
Improvement of Earthquake Risk Awareness and Seismic Literacy of Korean Citizens through Earthquake Vulnerability Map from the 2017 Pohang Earthquake, South Korea

 ,
,  ,
,  and
and
Abstract
:
1. Introduction
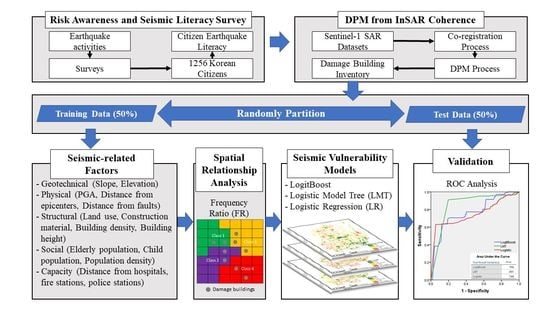
2. Materials and Methods
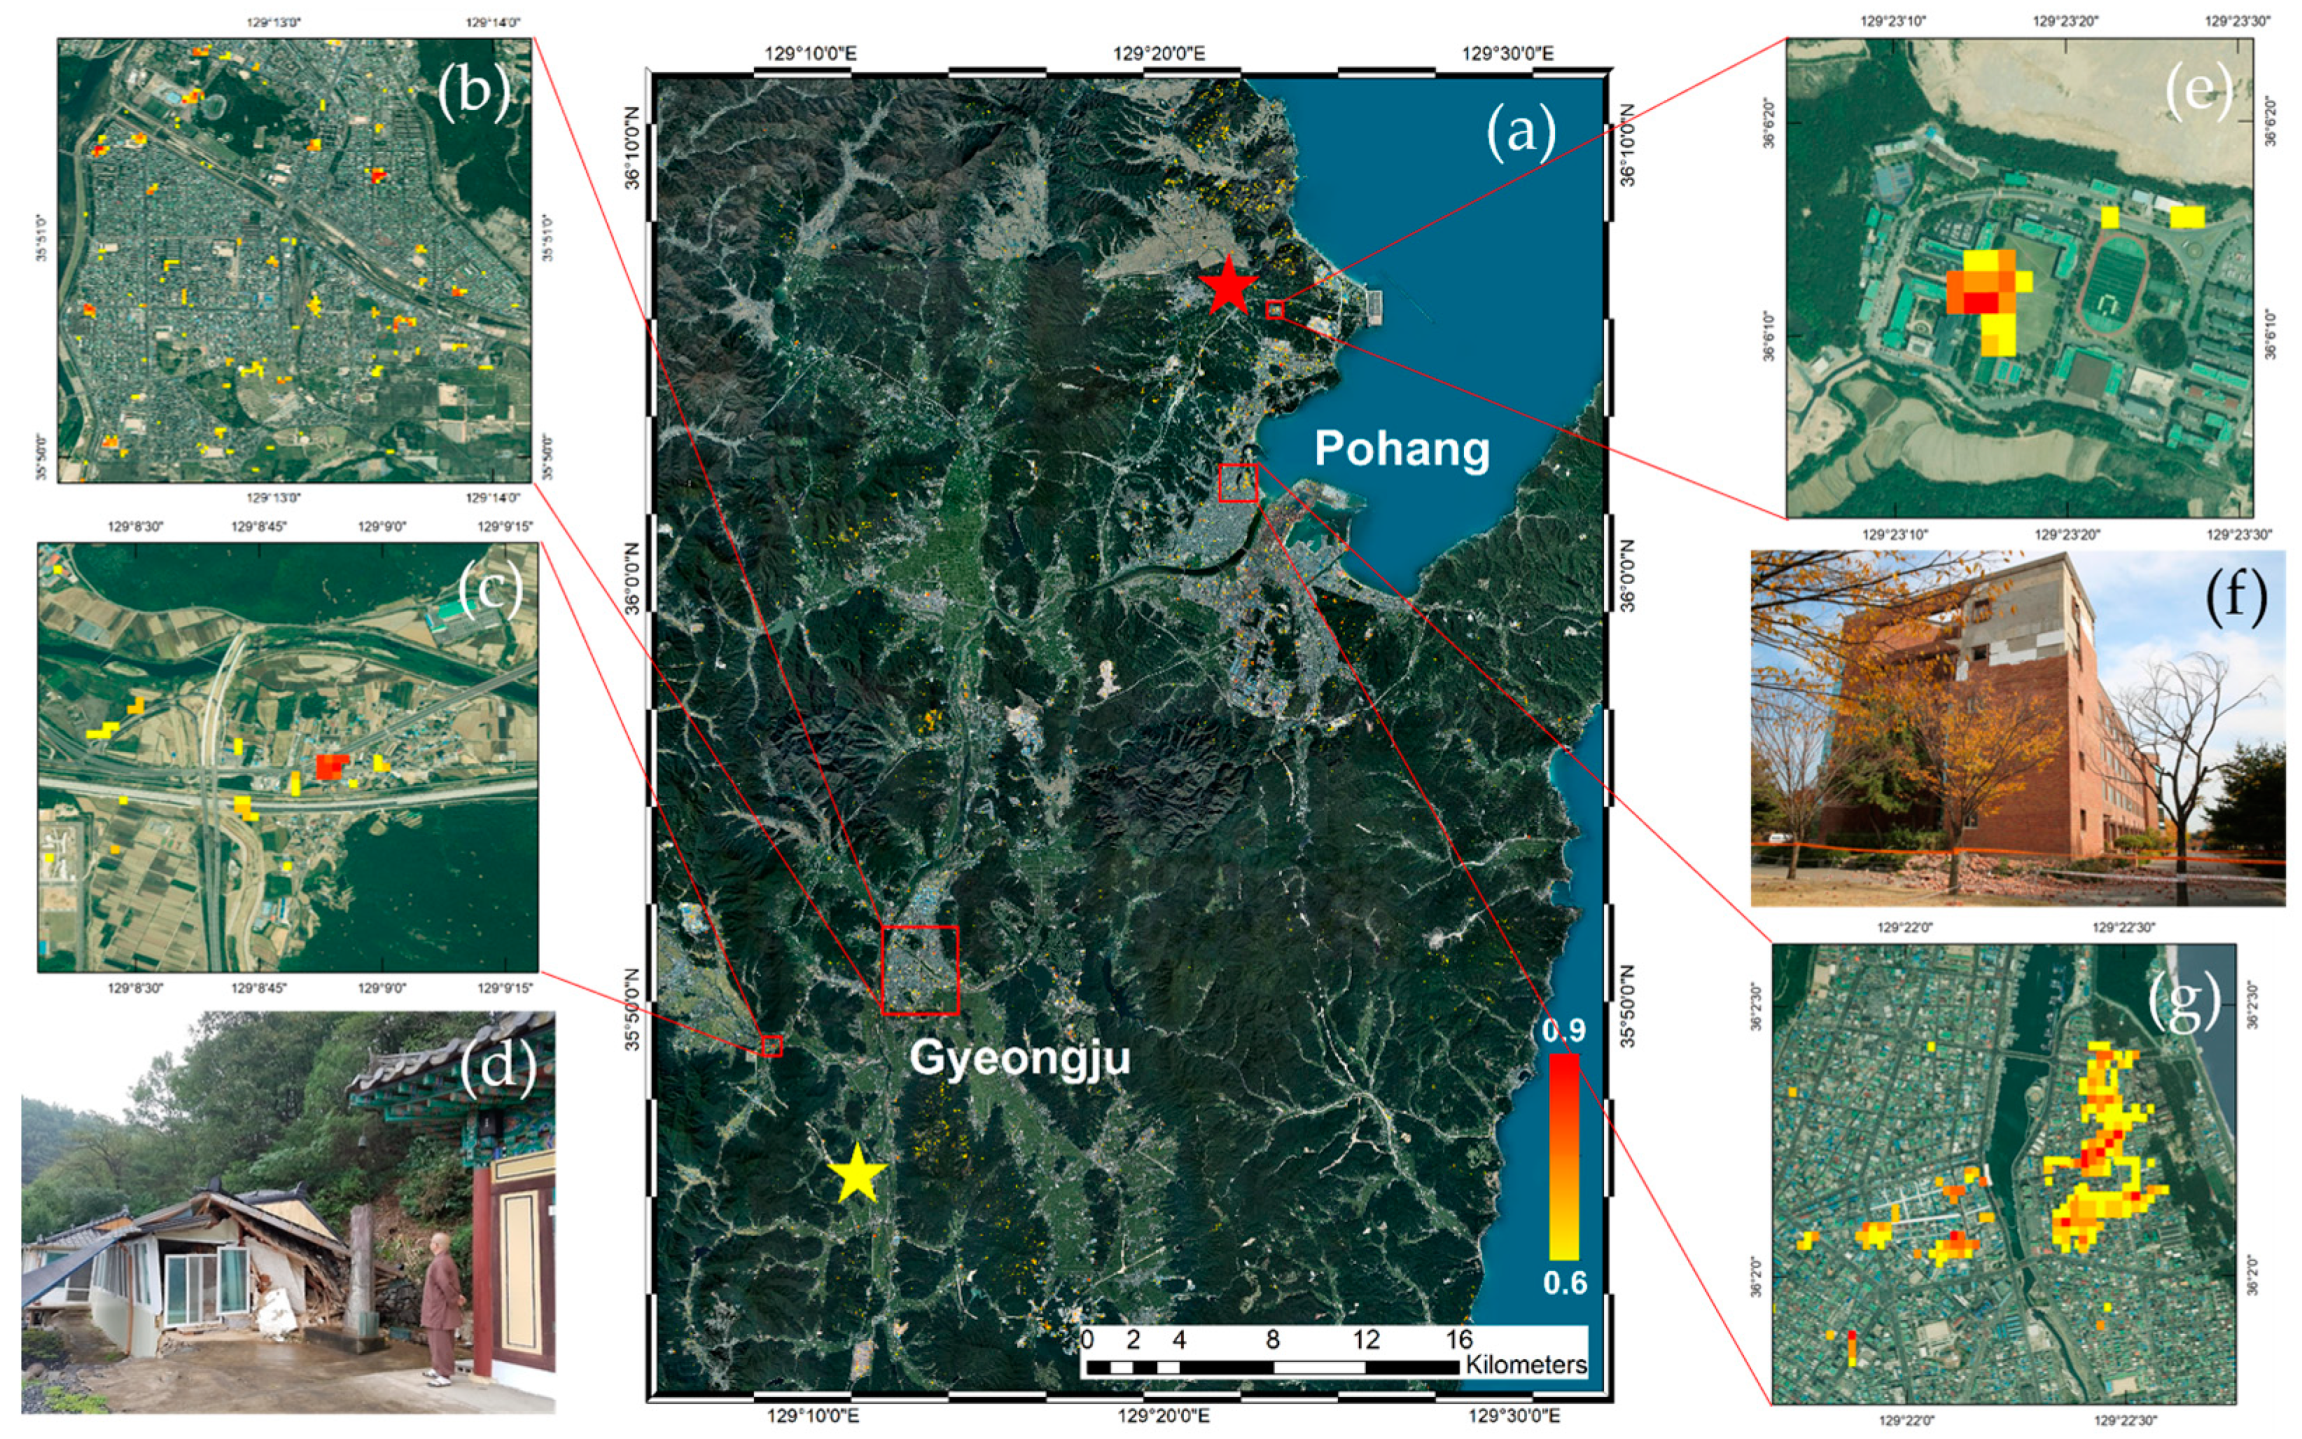
2.1. Study Area
2.2. SAR Datasets
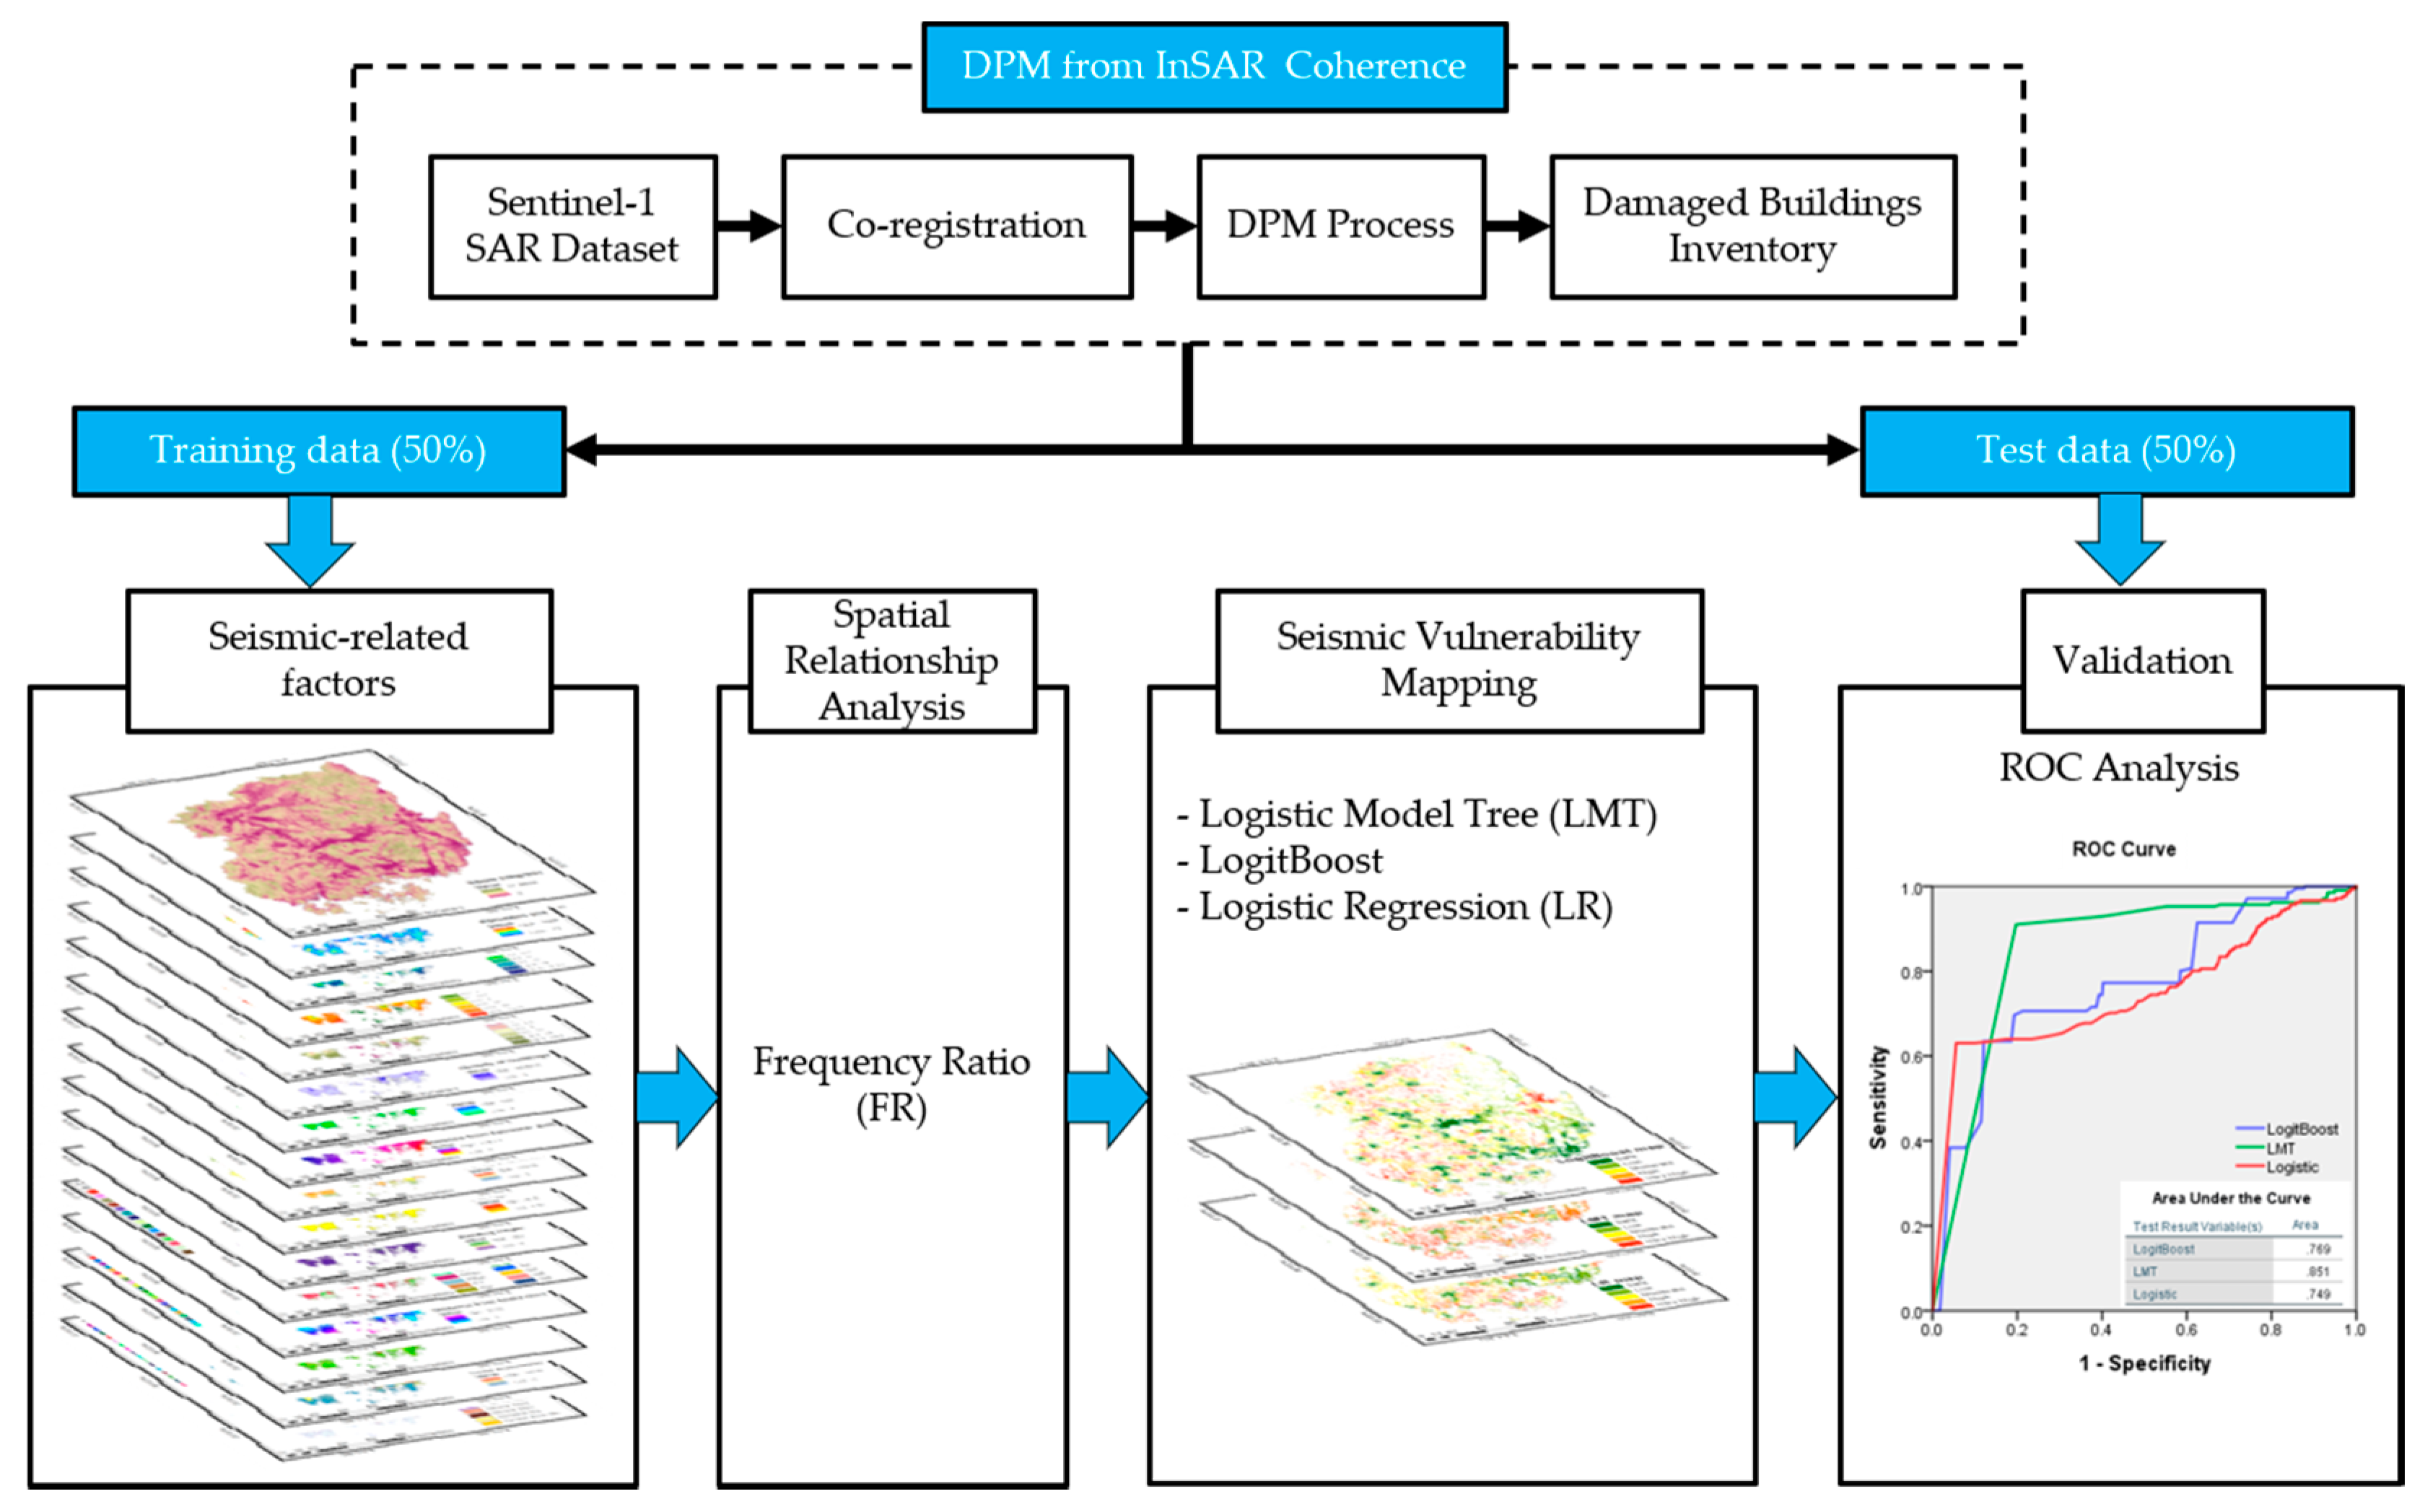
2.3. Damage Proxy Map (DPM)
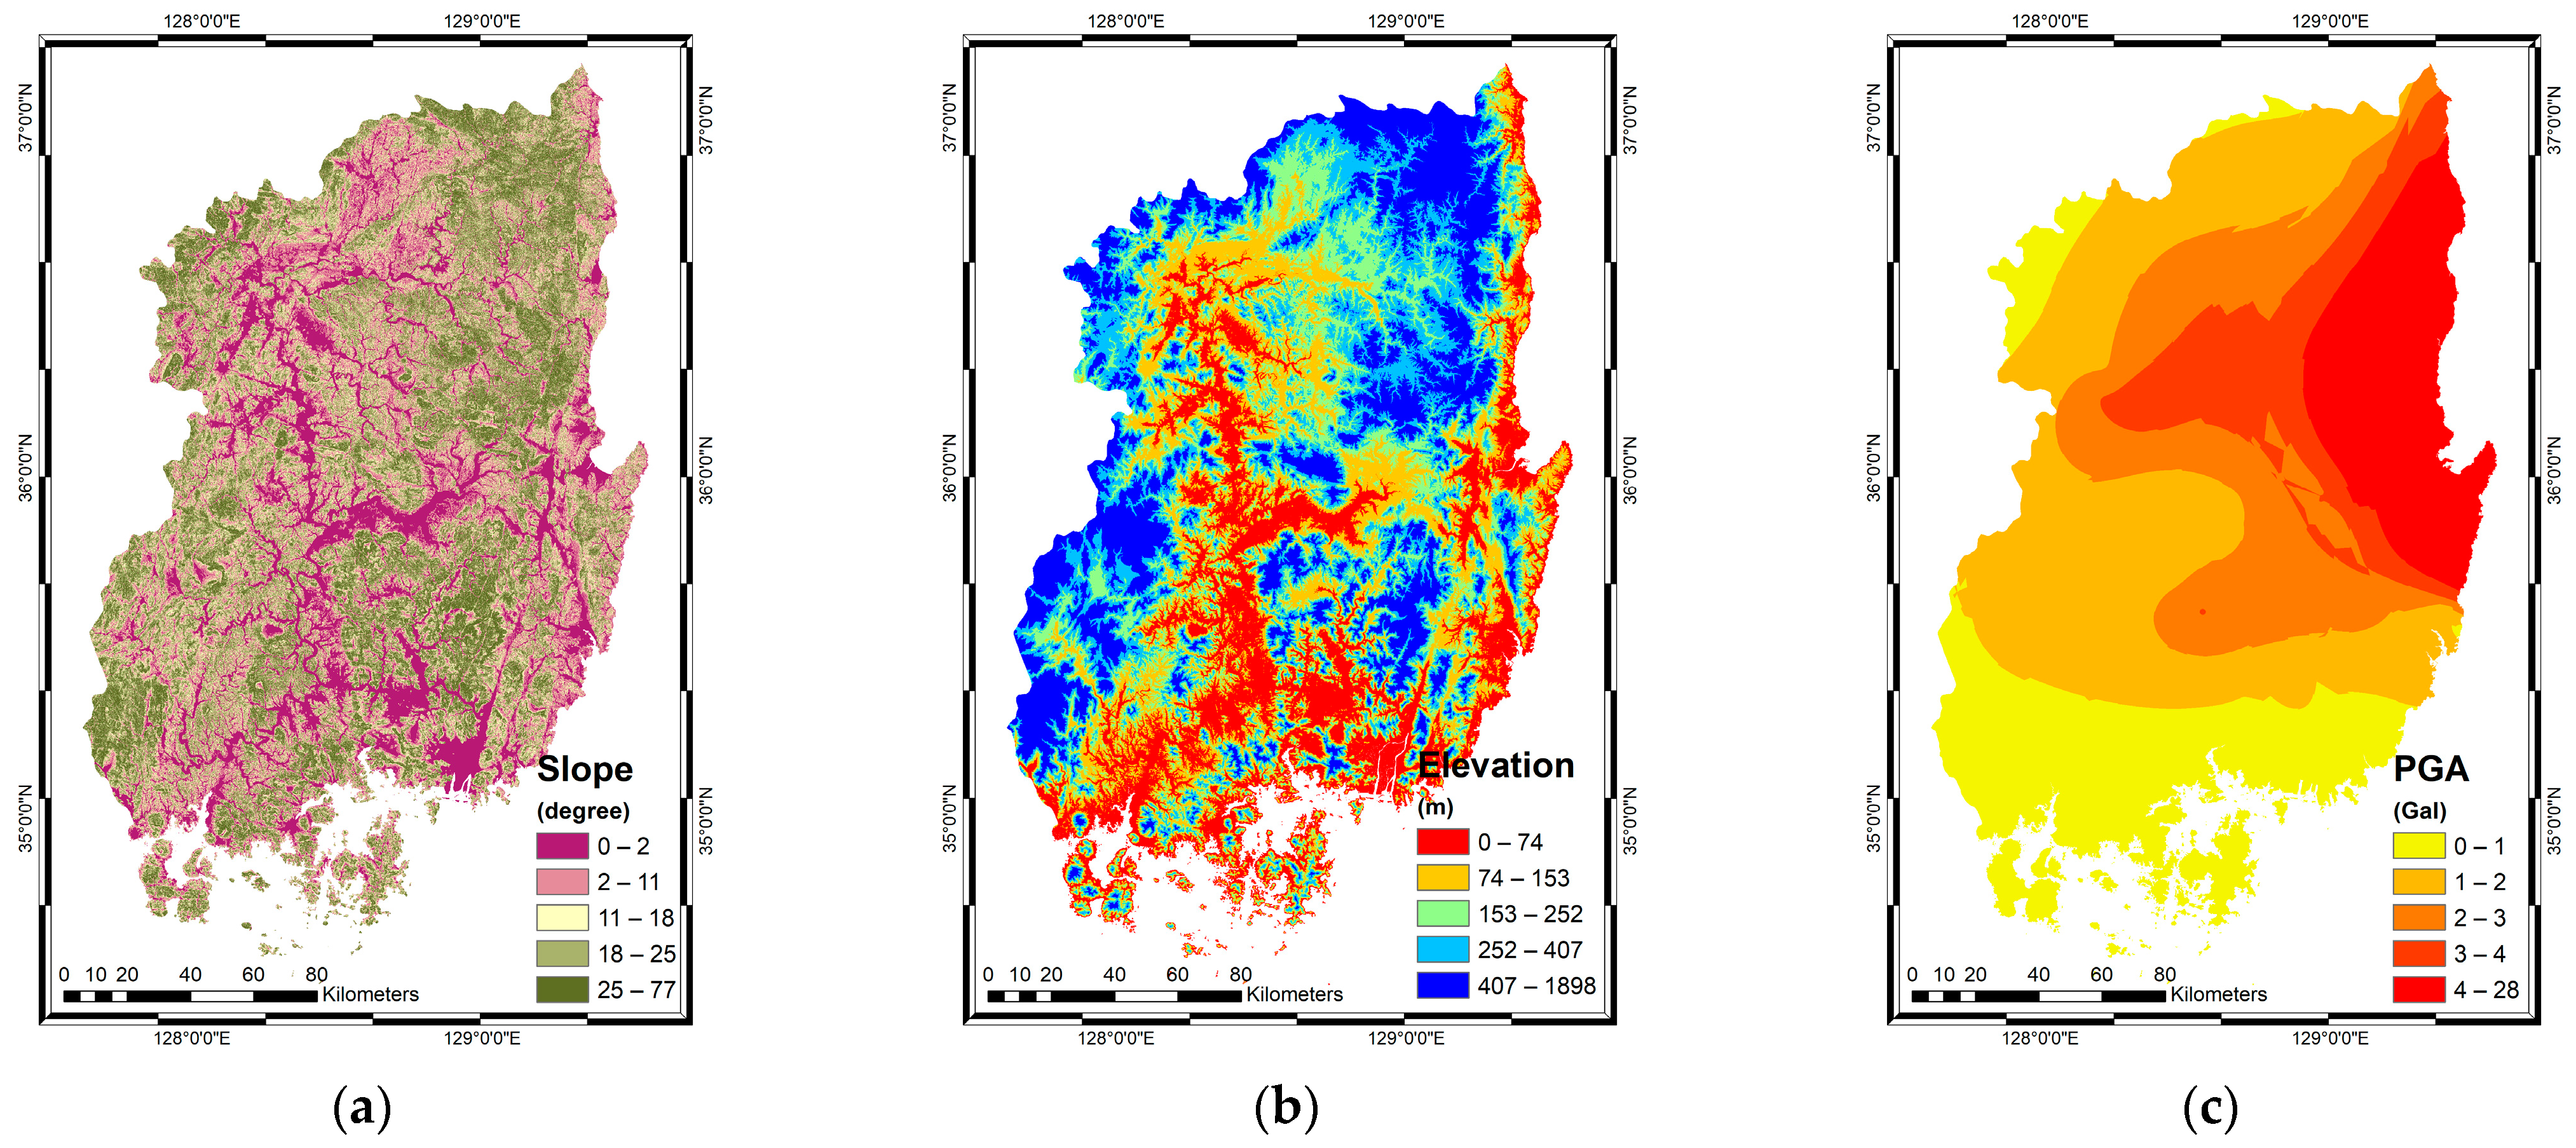
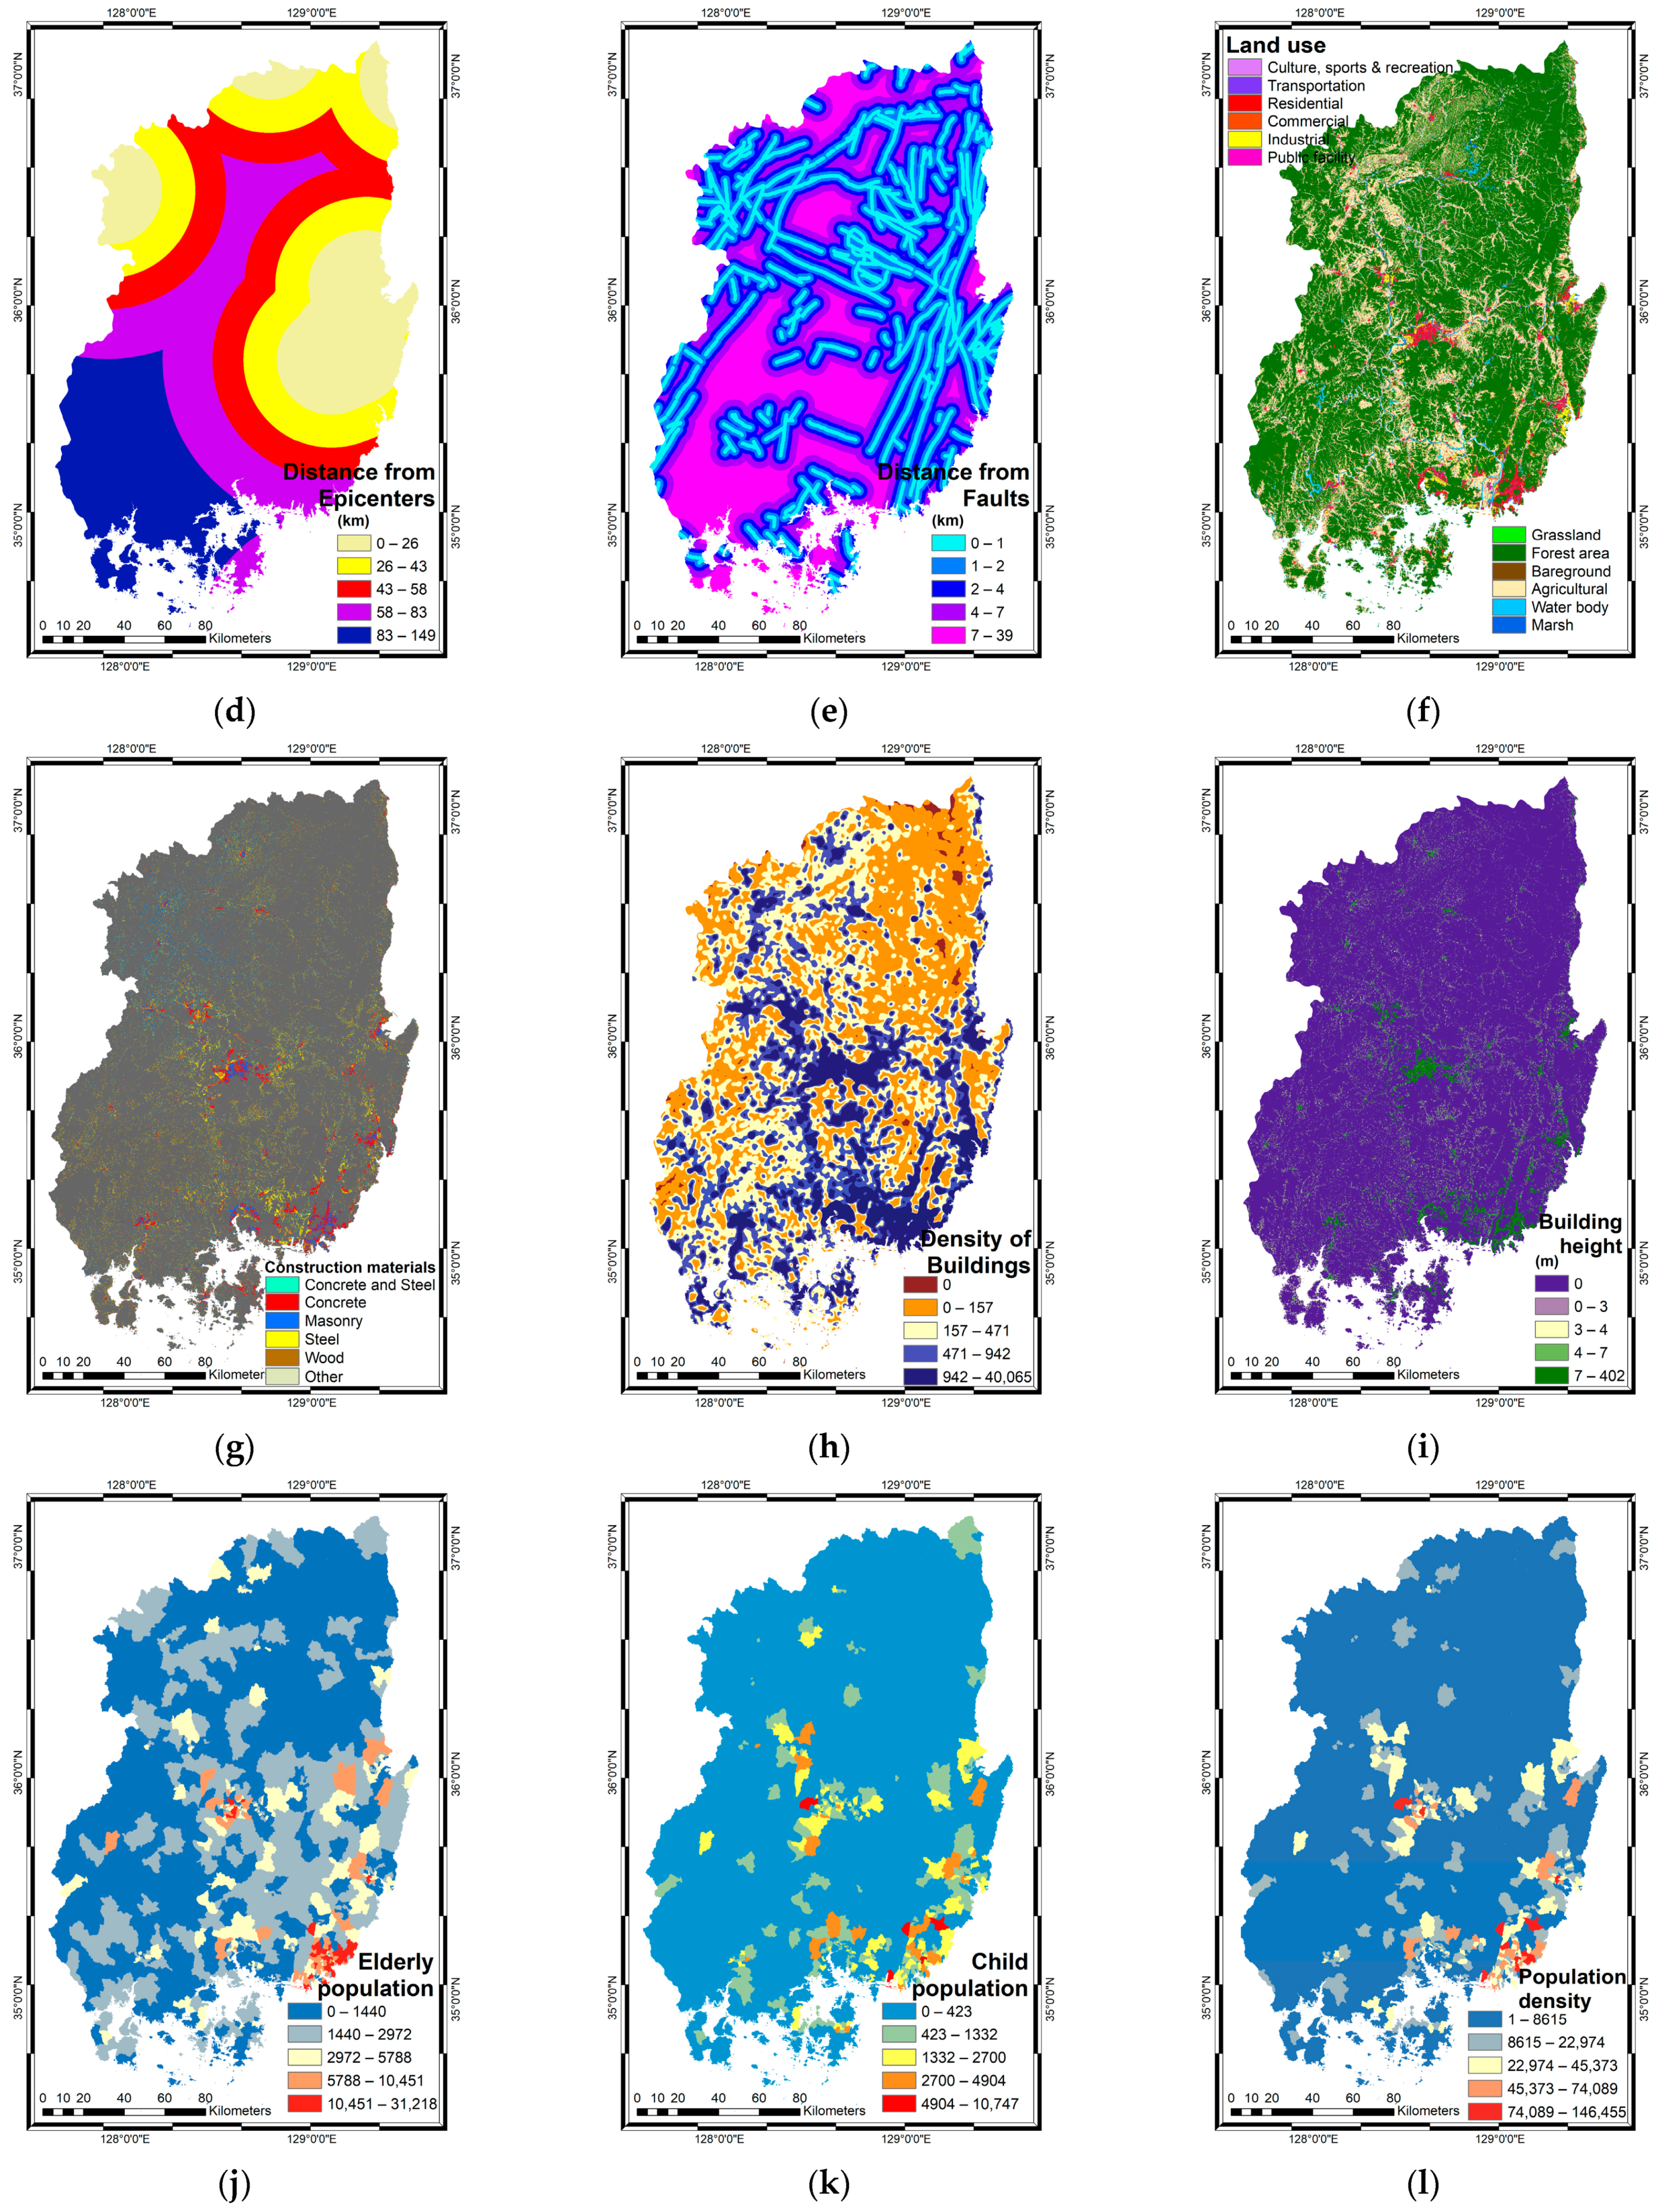
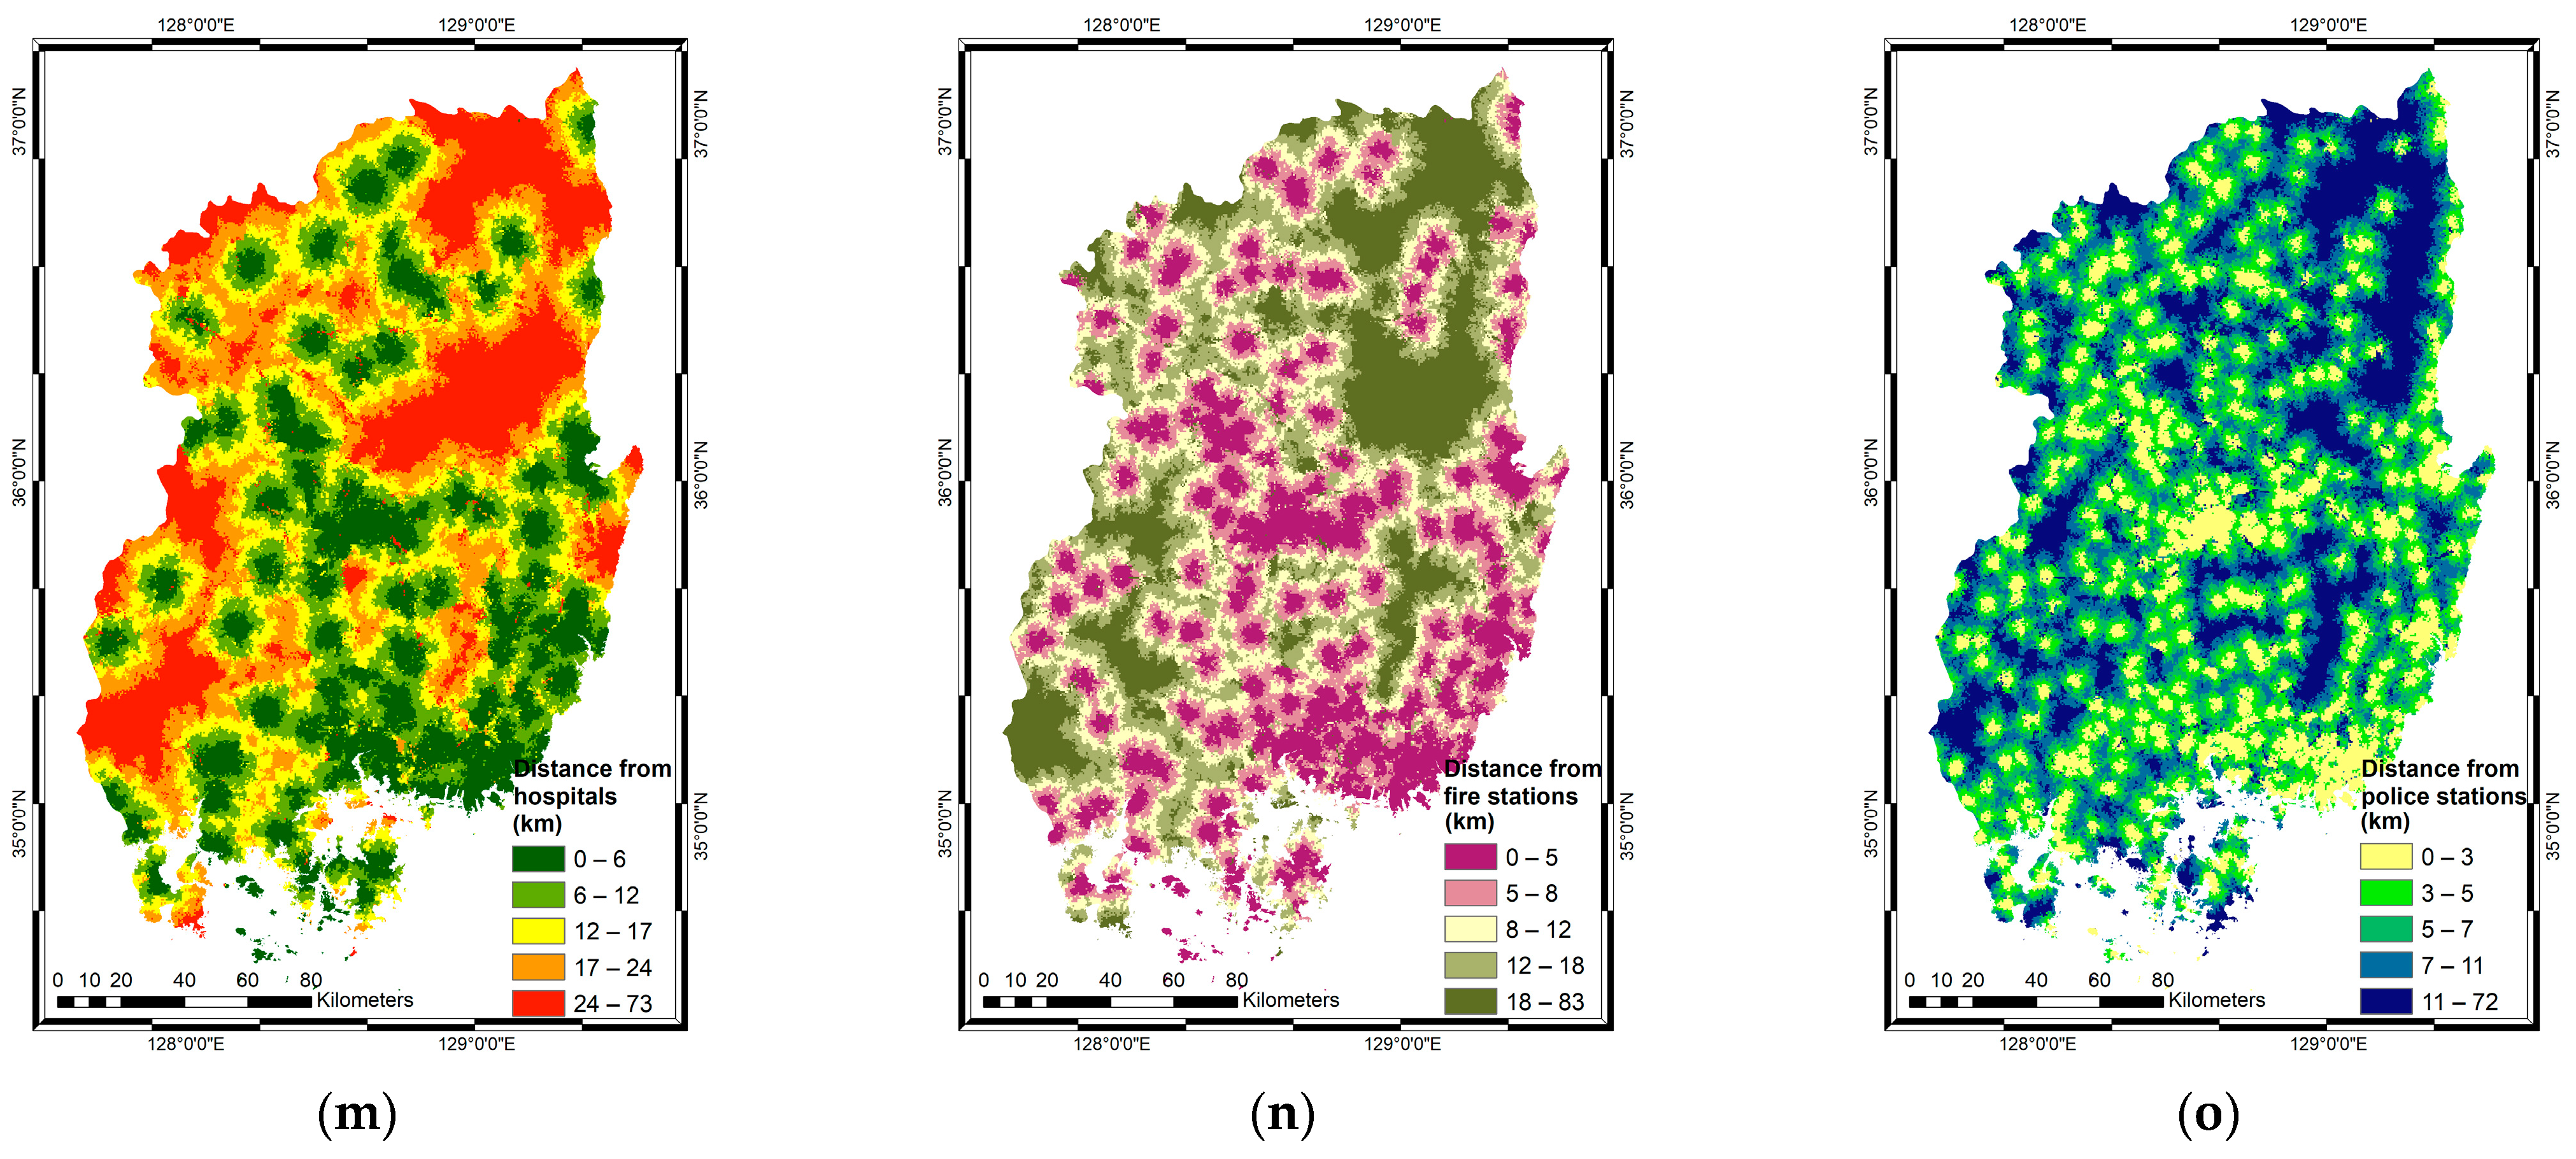
2.4. Selection of Seismic-Related Factors
2.5. Machine Learning
2.5.1. LogitBoost
2.5.2. Logistic Model Tree (LMT)
2.5.3. Logistic Regression (LR)
3. Results
3.1. Building Damage Inventory Map
3.2. Relationship between Damaged Buildings and Related Factors
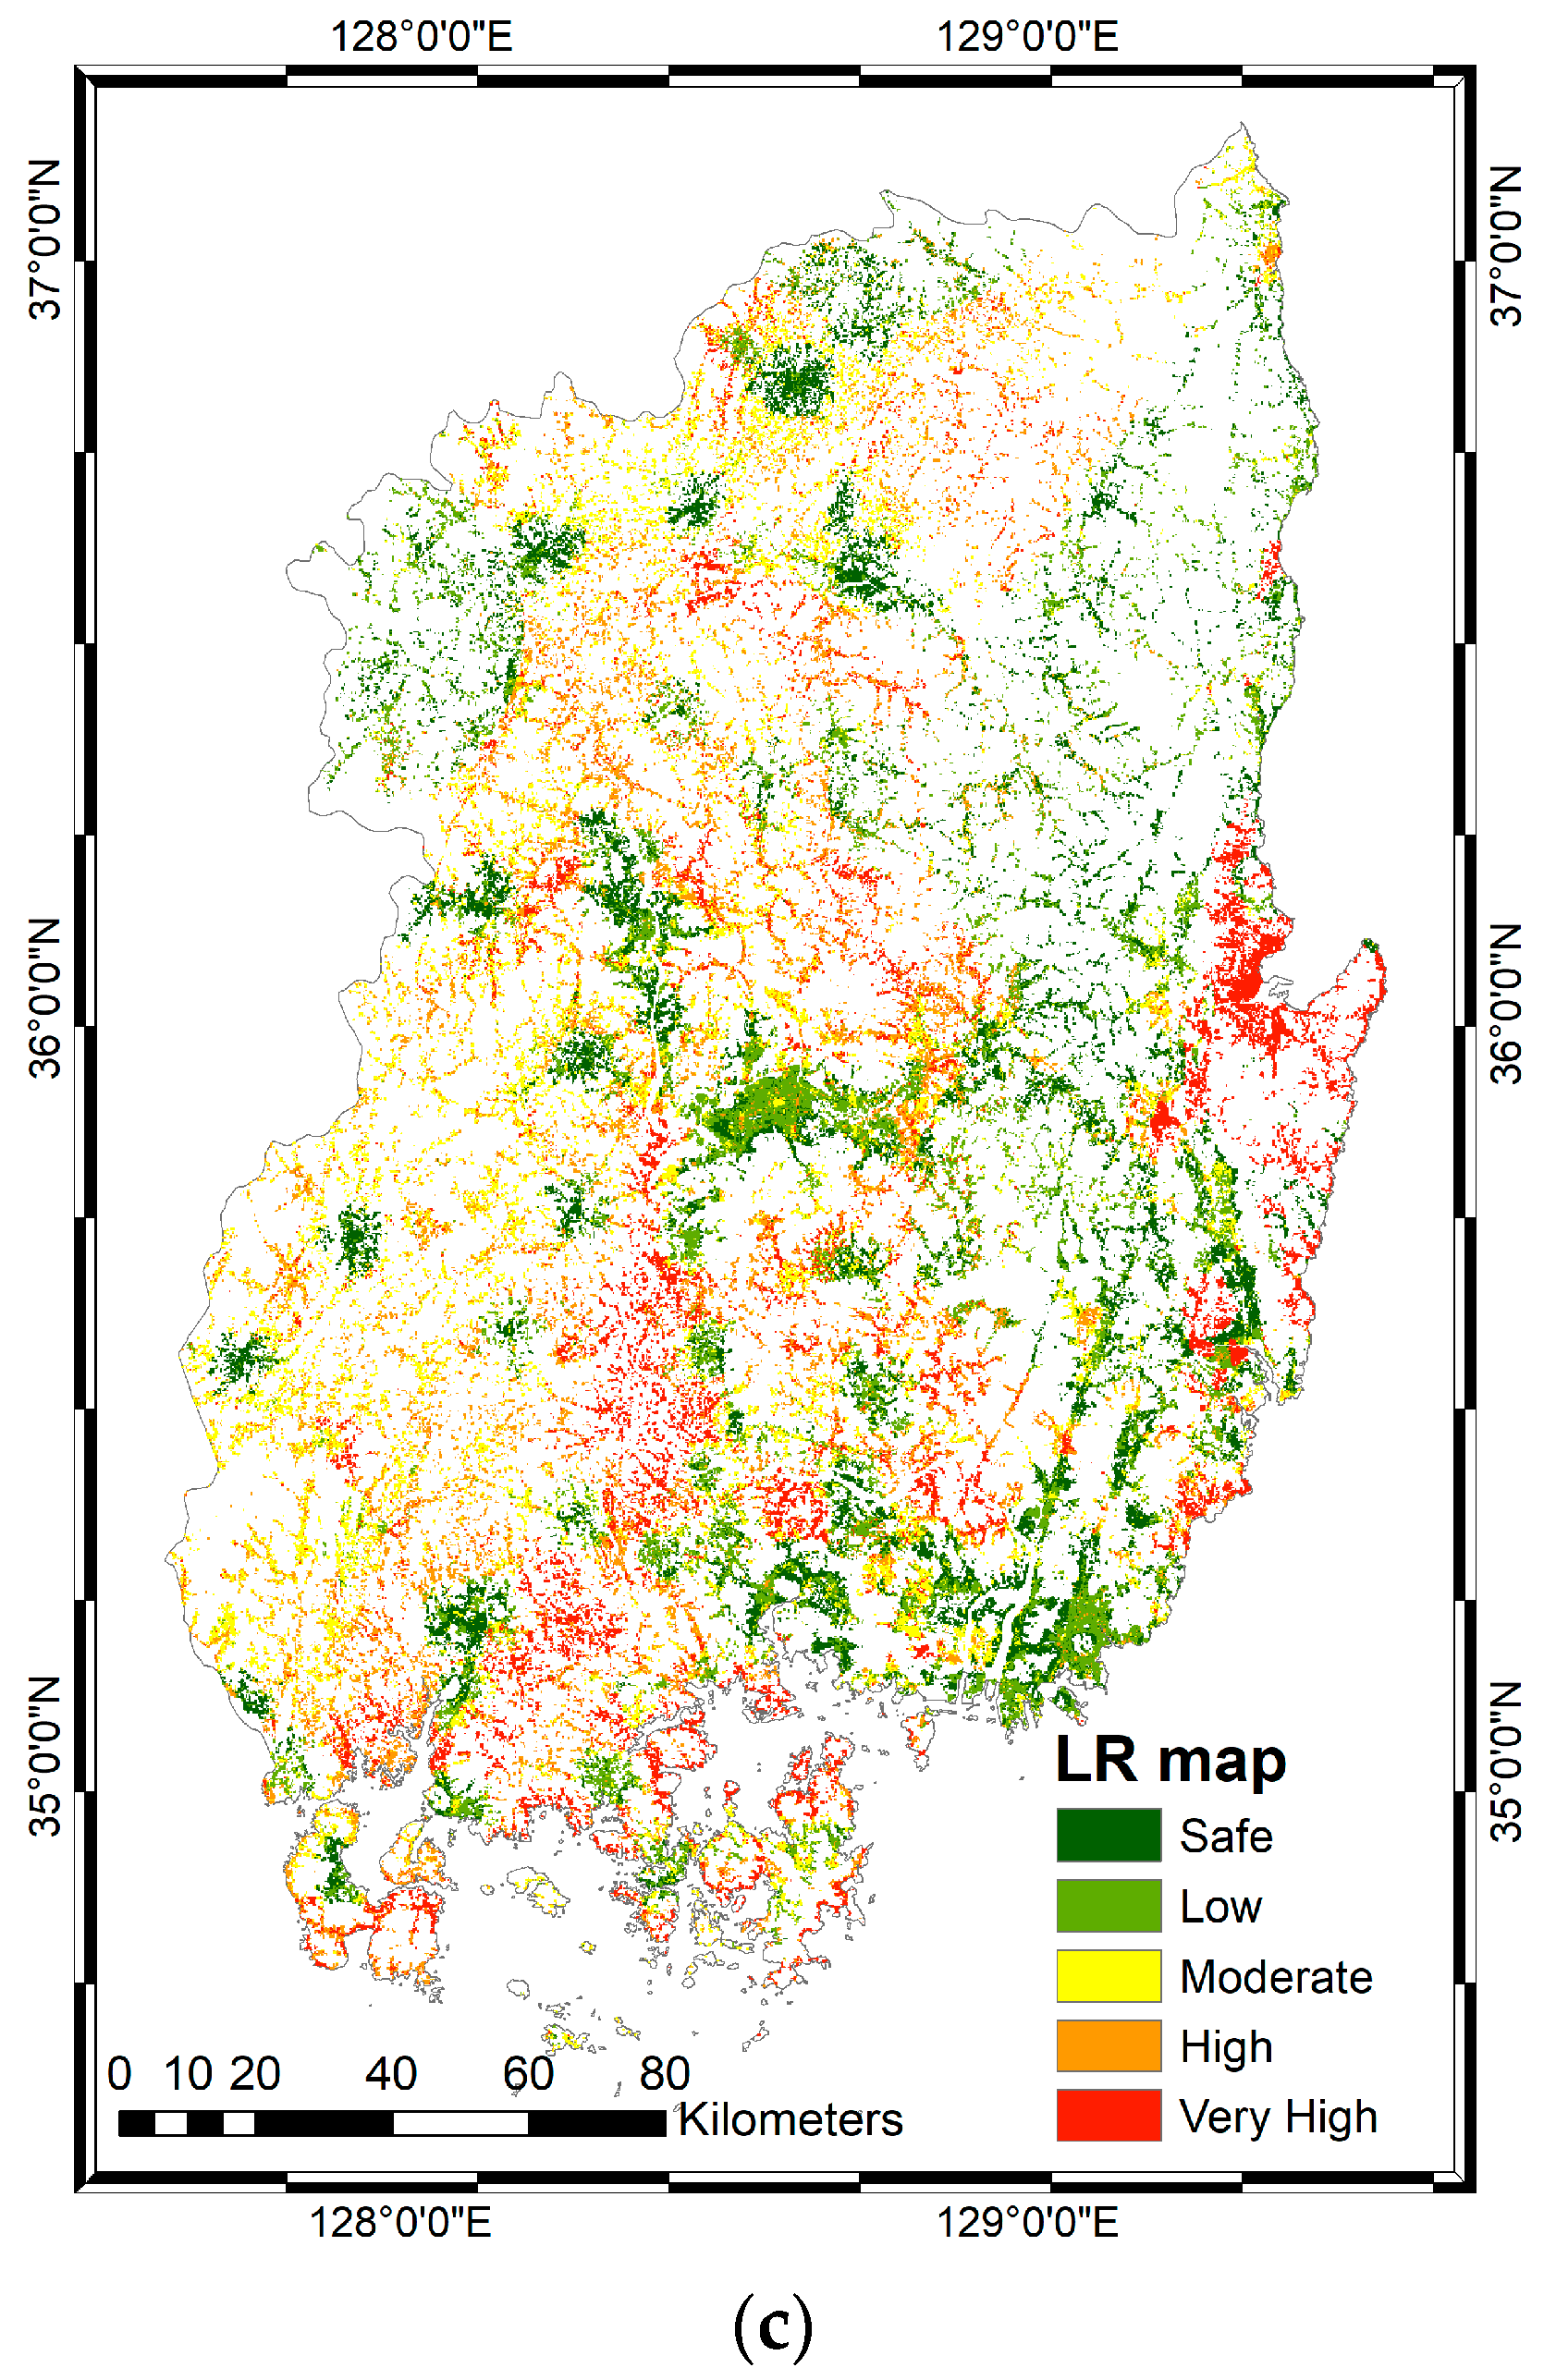
3.3. Seismic Vulnerability Map
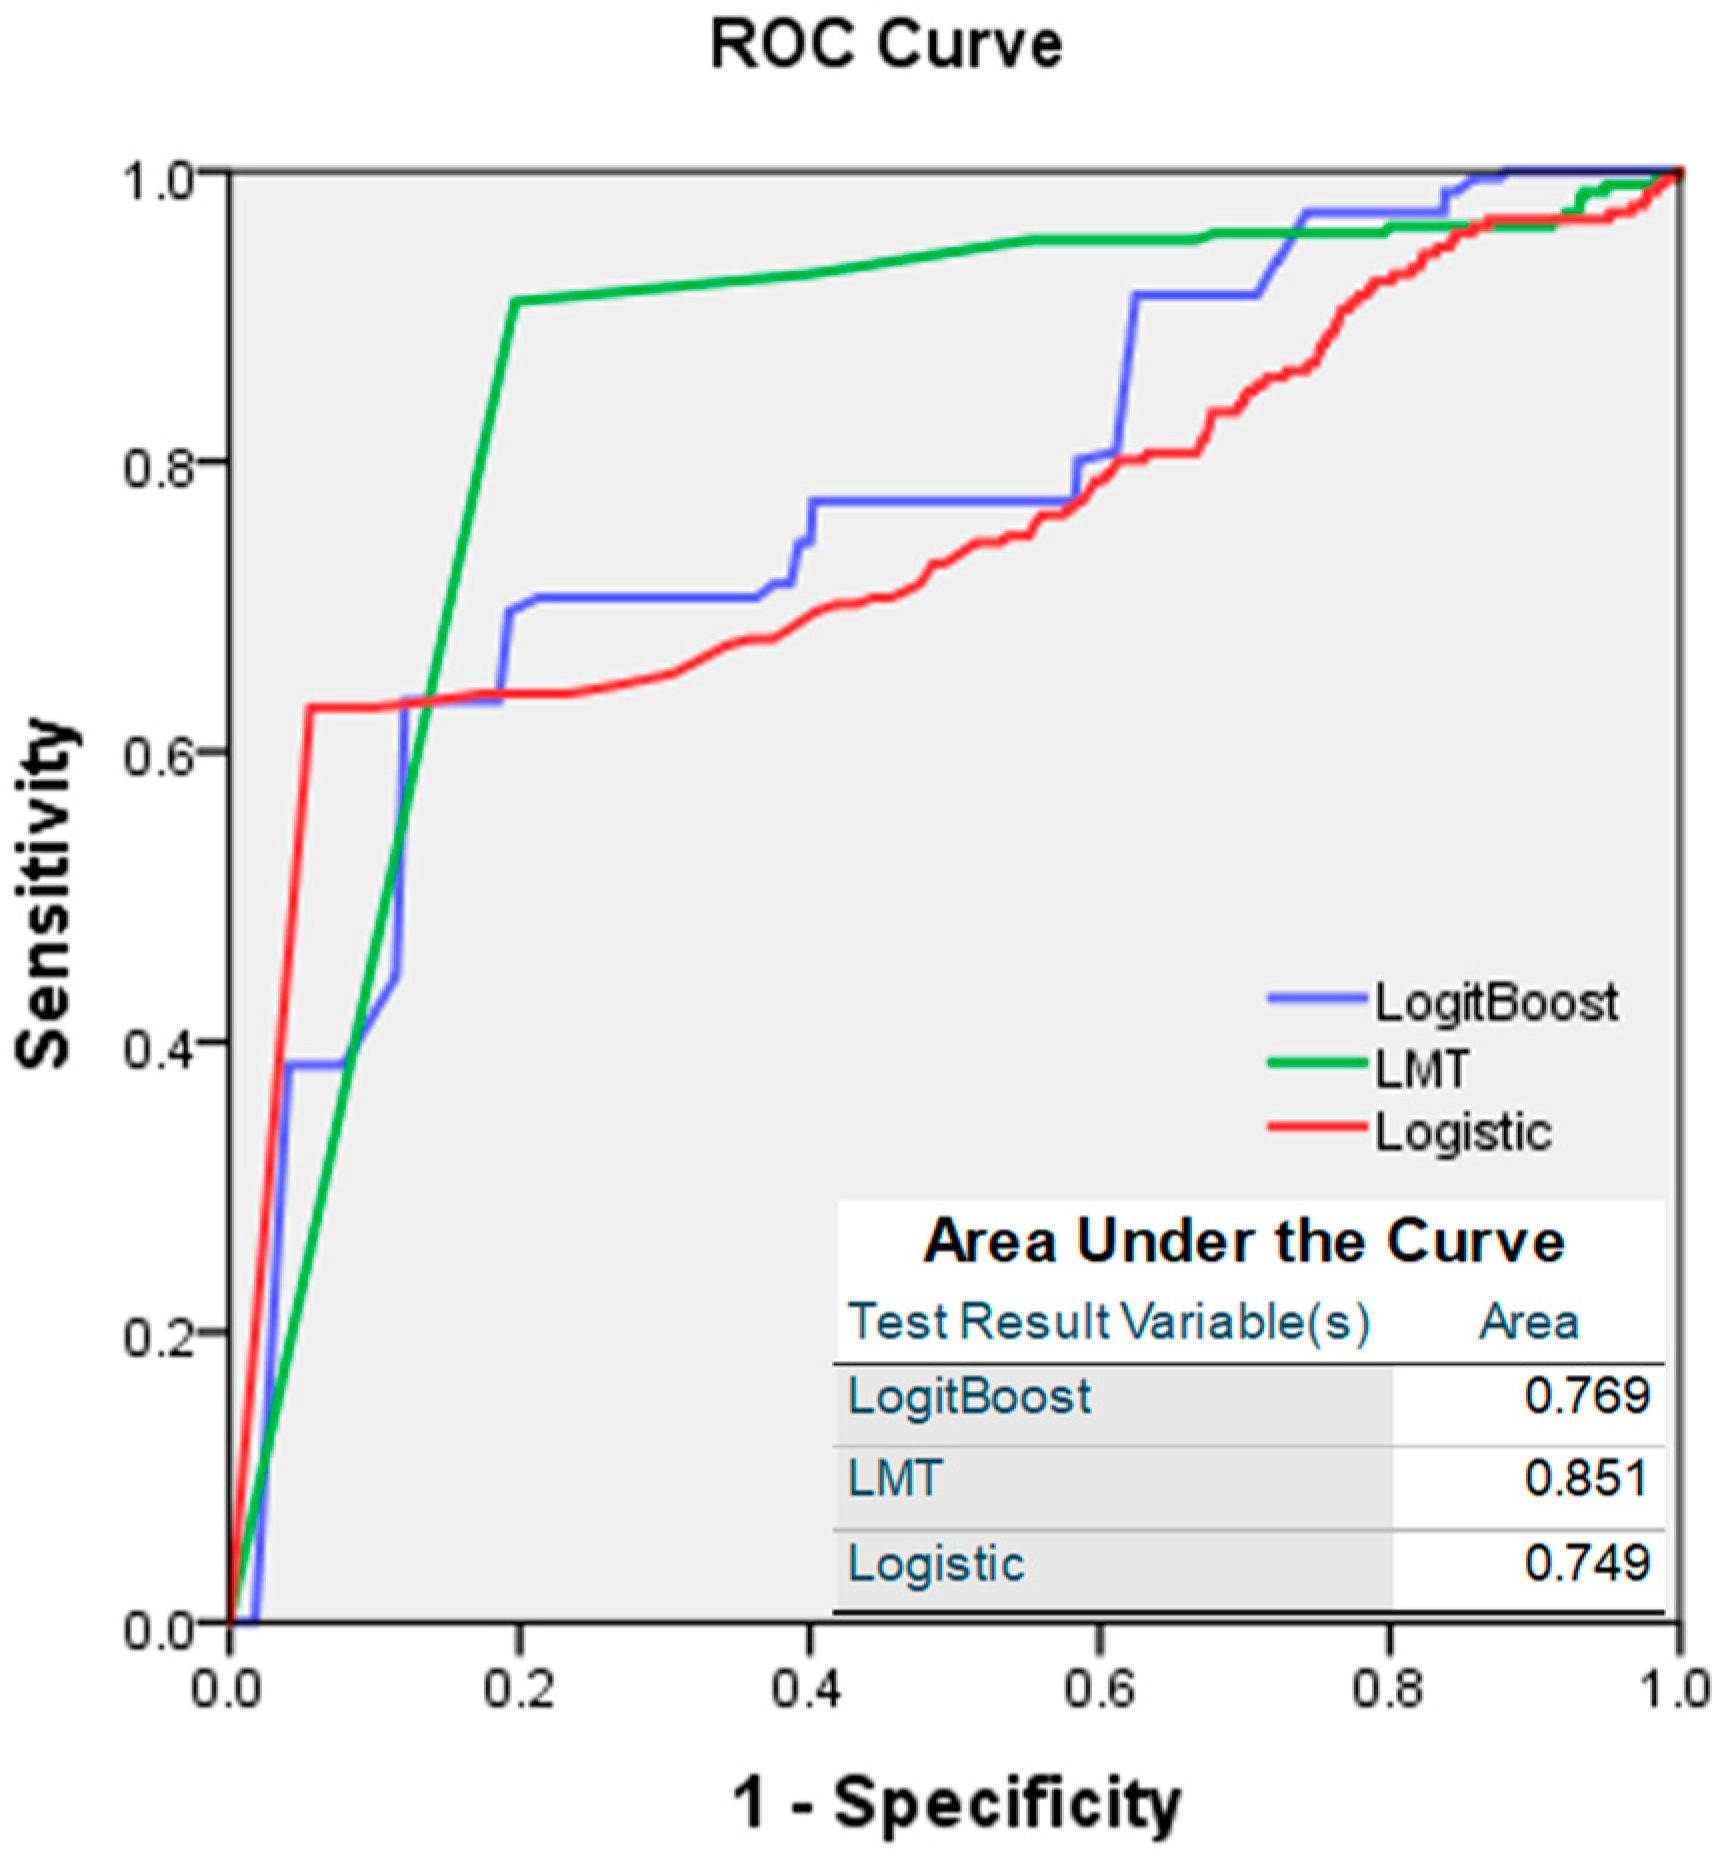
3.4. Model Validation
4. Discussion
4.1. Building Damage Inventory Map
4.2. Seismic Vulnerability Map
5. Conclusions
Author Contributions
Funding
Institutional Review Board Statement
Informed Consent Statement
Data Availability Statement
Conflicts of Interest
Appendix A

| No | Knowledge | 1 | 2 | 3 | 4 | 5 |
|---|---|---|---|---|---|---|
| 1. | I know why earthquakes occur | 1.91 | 11.94 | 42.68 | 38.14 | 5.33 |
| 2. | I can distinguish between earthquake magnitude and scale | 4.70 | 25.16 | 37.02 | 29.22 | 3.90 |
| 3. | I can explain the terms related to earthquakes (e.g., epicenter, hypocenter, main earthquake, aftershock) | 5.89 | 25.51 | 38.06 | 25.08 | 4.46 |
| 4. | I do not have problem understanding earthquake news or articles | 0.64 | 10.27 | 39.01 | 42.36 | 7.72 |
| 5. | I know how and what technology is used to study earthquakes | 11.39 | 41.24 | 36.15 | 9.00 | 2.23 |
| Awareness | ||||||
| 6. | I know the shelter close to my home for escaping from earthquakes | 5.49 | 29.94 | 35.67 | 25.32 | 3.58 |
| 7. | I know prevention items when earthquakes occur | 8.44 | 42.68 | 32.96 | 14.01 | 1.91 |
| 8. | I know the earthquake will affect to my area and social community | 2.15 | 14.09 | 33.52 | 42.12 | 8.12 |
| 9. | I know what to do when earthquakes happen | 0.88 | 11.86 | 38.14 | 43.15 | 5.97 |
| 10. | I know the earthquake early warning service | 4.38 | 26.27 | 40.21 | 26.51 | 2.63 |
| Management | ||||||
| 11. | I have a calm attitude for earthquakes | 2.55 | 21.66 | 49.28 | 23.73 | 2.79 |
| 12. | I can handle terror, fear in earthquake situations | 3.66 | 26.04 | 46.10 | 21.74 | 2.47 |
| 13. | I changed my house to reduce damage, e.g., falling furniture or broken glass, when earthquakes happen | 8.04 | 37.98 | 35.67 | 16.48 | 1.83 |
| 14. | I can rapidly follow the earthquake early warning (message) service | 2.23 | 13.93 | 45.70 | 34.08 | 4.06 |
| 15. | I can return to daily life after an earthquake | 1.83 | 13.38 | 49.12 | 32.40 | 3.26 |
References
- Kim, Y.S.; Park, J.Y.; Kim, J.H.; Shin, H.C.; Sanderson, D.J. Thrust geometries in unconsolidated Quaternary sediments and evolution of the Eupchon Fault, southeast Korea. Isl. Arc 2004, 13, 403–415. [Google Scholar] [CrossRef]
- Lee, K.; Yang, W.S. Historical seismicity of Korea. Bull. Seismol. Soc. Am. 2006, 96, 846–855. [Google Scholar] [CrossRef]
- Kang, S.; Kim, B.; Bae, S.; Lee, H.; Kim, M. Earthquake-Induced Ground Deformations in the Low-Seismicity Region: A Case of the 2017 M5.4 Pohang, South Korea, Earthquake. Earthq. Spectra 2019, 35, 1235–1260. [Google Scholar] [CrossRef]
- Grigoli, F.; Cesca, S.; Rinaldi, A.P.; Manconi, A.; López-Comino, J.A.; Clinton, J.F.; Westaway, R.; Cauzzi, C.; Dahm, T.; Wiemer, S. The November 2017 Mw 5.5 Pohang earthquake: A possible case of induced seismicity in South Korea. Science 2018, 360, 1003–1006. [Google Scholar] [CrossRef] [PubMed] [Green Version]
- Woo, J.-U.; Kim, M.; Sheen, D.-H.; Kang, T.-S.; Rhie, J.; Grigoli, F.; Ellsworth, W.L.; Giardini, D. An In-Depth Seismological Analysis Revealing a Causal Link between the 2017 MW 5.5 Pohang Earthquake and EGS Project. J. Geophys. Res. Solid Earth 2019, 124, 13060–13078. [Google Scholar] [CrossRef] [Green Version]
- Lee, K.-K. Summary Report of the Korean Government Commision on Relation between the 2017 Pohang Earthquake and EGS Project; The Geological Society of Korea: Seoul, Korea, 2019. [Google Scholar]
- Han, J.; Kim, J.; Park, S.; Son, S.; Ryu, M. Seismic Vulnerability Assessment and Mapping of Gyeongju, South Korea Using Frequency Ratio, Decision Tree, and Random Forest. Sustainability 2020, 12, 7787. [Google Scholar] [CrossRef]
- Sang-Sun toward Better Risk Preparedness for Cultural Heritage. Available online: http://www.koreanheritage.kr//inside/view.jsp?articleNo=15 (accessed on 19 January 2021).
- Doo, R. Artifacts Damaged in Record-Breaking Earthquake in Gyeongju. Available online: https://www.thejakartapost.com/life/2016/09/19/artifacts-damaged-in-record-breaking-earthquake-in-gyeongju.html (accessed on 18 January 2021).
- Werner, C.; Wegmüller, U.; Strozzi, T.; Wiesmann, A. GAMMA SAR and interferometric processing software. In Proceedings of the ERS—ENVISAT Symposium, Gothenburg, Sweden, 16–20 October 2000; Special Publication ESA SP. European Space Agency: Paris, France, 2000; pp. 211–219. [Google Scholar]
- Zebker, H.A.; Goldstein, R.M. Topographic Mapping from Interferometric Synthetic Aperture Radar Observations. In Digest—International Geoscience and Remote Sensing Symposium (IGARSS); IEEE: New York, NY, USA, 1985; pp. 113–117. [Google Scholar]
- Panahi, M.; Rezaie, F.; Meshkani, S.A. Seismic vulnerability assessment of school buildings in Tehran city based on AHP and GIS. Nat. Hazards Earth Syst. Sci. Discuss. 2013, 1, 4511–4538. [Google Scholar] [CrossRef]
- Jena, R.; Pradhan, B.; Beydoun, G. Earthquake vulnerability assessment in Northern Sumatra province by using a multi-criteria decision-making model. Int. J. Disaster Risk Reduct. 2020, 46, 101518. [Google Scholar] [CrossRef]
- Yariyan, P.; Avand, M.; Soltani, F.; Ghorbanzadeh, O.; Blaschke, T. Earthquake vulnerability mapping using different hybrid models. Symmetry 2020, 12, 405. [Google Scholar] [CrossRef] [Green Version]
- Han, J.; Park, S.; Kim, S.; Son, S.; Lee, S.; Kim, J. Performance of Logistic Regression and Support Vector Machines for Seismic Vulnerability Assessment and Mapping: A Case Study of the 12 September 2016 ML5.8 Gyeongju Earthquake, South Korea. Sustainability 2019, 11, 7038. [Google Scholar] [CrossRef] [Green Version]
- Alizadeh, M.; Hashim, M.; Alizadeh, E.; Shahabi, H.; Karami, M.; Beiranvand Pour, A.; Pradhan, B.; Zabihi, H. Multi-Criteria Decision Making (MCDM) Model for Seismic Vulnerability Assessment (SVA) of Urban Residential Buildings. ISPRS Int. J. Geo-Inf. 2018, 7, 444. [Google Scholar] [CrossRef] [Green Version]
- Han, J.; Kim, J. GIS-Based Seismic Vulnerability Mapping and Assessment Using AHP: A Case Study of Gyeongju, Korea. Korean J. Remote Sens. 2019, 35, 217–228. [Google Scholar]
- Rezaie, F.; Panahi, M. GIS modeling of seismic vulnerability of residential fabrics considering geotechnical, structural, social and physical distance indicators in Tehran using multi-criteria decision-making techniques. Nat. Hazards Earth Syst. Sci. 2015, 15, 461–474. [Google Scholar] [CrossRef] [Green Version]
- Lee, S.; Panahi, M.; Pourghasemi, H.R.; Shahabi, H.; Alizadeh, M.; Shirzadi, A.; Khosravi, K.; Melesse, A.M.; Yekrangnia, M.; Rezaie, F.; et al. SEVUCAS: A Novel GIS-Based Machine Learning Software for Seismic Vulnerability Assessment. Appl. Sci. 2019, 9, 3495. [Google Scholar] [CrossRef] [Green Version]
- Yun, S.-H.; Hudnut, K.; Owen, S.; Webb, F.; Simons, M.; Sacco, P.; Gurrola, E.; Manipon, G.; Liang, C.; Fielding, E.; et al. Rapid Damage Mapping for the 2015 Mw 7.8 Gorkha Earthquake Using Synthetic Aperture Radar Data from COSMO–SkyMed and ALOS-2 Satellites. Seismol. Res. Lett. 2015, 86, 1549–1556. [Google Scholar] [CrossRef] [Green Version]
- Tay, C.W.J.; Yun, S.-H.; Chin, S.T.; Bhardwaj, A.; Jung, J.; Hill, E.M. Rapid flood and damage mapping using synthetic aperture radar in response to Typhoon Hagibis, Japan. Sci. Data 2020, 7, 100–108. [Google Scholar] [CrossRef] [PubMed]
- Hough, S.E.; Yun, S.-H.; Jung, J.; Thompson, E.; Parker, G.A.; Stephenson, O. Near-Field Ground Motions and Shaking from the 2019 Mw 7.1 Ridgecrest, California, Mainshock: Insights from Instrumental, Macroseismic Intensity, and Remote-Sensing Data. Bull. Seismol. Soc. Am. 2020, 110, 1506–1516. [Google Scholar] [CrossRef]
- Biass, S.; Jenkins, S.; Lallemant, D.; Lim, T.N.; Williams, G.; Yun, S.-H. Remote sensing of volcanic impacts. In Forecasting and Planning for Volcanic Hazards, Risks, and Disasters; Elsevier: Amsterdam, The Netherlands, 2021; pp. 473–491. [Google Scholar]
- Choe, B.-N. The National Atlas of Korea; National Geography Information Institute: Suwon, Korea, 2019. [Google Scholar]
- Korean Statistical Information Service Statistics Korea. Population Census. Available online: https://kosis.kr/statHtml/statHtml.do?orgId=101&tblId=DT_1IN1502&conn_path=I2&language=en (accessed on 21 January 2020).
- Kim, H.-S.; Sun, C.-G.; Cho, H.-I. Geospatial Assessment of the Post-Earthquake Hazard of the 2017 Pohang Earthquake Considering Seismic Site Effects. ISPRS Int. J. Geo-Inf. 2018, 7, 375. [Google Scholar] [CrossRef] [Green Version]
- Kim, Y.; Rhie, J.; Kang, T.-S.; Kim, K.-H.; Kim, M.; Lee, S.-J. The 12 September 2016 Gyeongju earthquakes: 1. Observation and remaining questions. Geosci. J. 2016, 20, 747–752. [Google Scholar] [CrossRef]
- Jin, K.; Lee, J.; Lee, K.-S.; Kyung, J.B.; Kim, Y.-S. Earthquake damage and related factors associated with the 2016 ML = 5.8 Gyeongju earthquake, southeast Korea. Geosci. J. 2020, 24, 141–157. [Google Scholar] [CrossRef]
- Korea Meteorological Administration. 2018 Earthquake Annual Report; Korea Meteorological Administration: Seoul, Korea, 2019.
- Korea Meteorological Administration. 2019 Earthquake Annual Report; Korea Meteorological Administration: Seoul, Korea, 2020.
- MML, S.; Mote, T.; Pappin, J. Seismic hazard assessment of South Korea. In Proceedings of the Japanese Geotechnical Society Special Publication; Japanese Geotechnical Society: Tokyo, Japan, 2000; pp. 755–760. [Google Scholar]
- Ellsworth, W.L.; Giardini, D.; Townend, J.; Ge, S.; Shimamoto, T. Triggering of the Pohang, Korea, Earthquake (Mw 5.5) by enhanced geothermal system stimulation. Seismol. Res. Lett. 2019, 90, 1844–1858. [Google Scholar] [CrossRef]
- Zebker, H.A.; Villasenor, J. Decorrelation in interferometric radar echoes. IEEE Trans. Geosci. Remote Sens. 1992, 30, 950–959. [Google Scholar] [CrossRef] [Green Version]
- Korea Meteorological Administration. Pohang Eartquake Analysis Report; Korea Meteorological Administration: Seoul, Korea, 2018.
- Yariyan, P.; Karami, M.R.; Ali Abbaspour, R. Exploitation of Mcda to Learn the Radial Base Neural Network (rbfnn) Aim Physical and Social Vulnerability Analysis Versus the Earthquake (Case Study: Sanandaj City, Iran). ISPRS Int. Arch. Photogramm. Remote Sens. Spat. Inf. Sci. 2019, XLII-4/W18, 1071–1078. [Google Scholar] [CrossRef] [Green Version]
- Pachauri, A.K.; Pant, M. Landslide hazard mapping based on geological attributes. Eng. Geol. 1992, 32, 81–100. [Google Scholar] [CrossRef]
- Kim, K.-H.; Kang, T.-S.; Rhie, J.; Kim, Y.; Park, Y.; Kang, S.Y.; Han, M.; Kim, J.; Park, J.; Kim, M.; et al. The 12 September 2016 Gyeongju earthquakes: 2. Temporary seismic network for monitoring aftershocks. Geosci. J. 2016, 20, 753–757. [Google Scholar] [CrossRef]
- Kang, T.-S.; Kim, D.K. Convergence Research Review; Convergence Research Policy Center: Seoul, Korea, 2017. [Google Scholar]
- Sivakumar, N.; Karthik, S.; Thangaraj, S.; Saravanan, S.; Shidhardhan, C.K. Seismic Vulnerability of Open Ground Floor Columns in Multi Storey Buildings. Int. J. Sci. Eng. Res. 2013, 1, 52–58. [Google Scholar]
- Cole, G.L.; Dhakal, R.P.; Turner, F.M. Building pounding damage observed in the 2011 Christchurch earthquake. Earthq. Eng. Struct. Dyn. 2012, 41, 893–913. [Google Scholar] [CrossRef]
- Rimal, B.; Baral, H.; Stork, N.; Paudyal, K.; Rijal, S. Growing City and Rapid Land Use Transition: Assessing Multiple Hazards and Risks in the Pokhara Valley, Nepal. Land 2015, 4, 957–978. [Google Scholar] [CrossRef] [Green Version]
- Hassanzadeh, R.; Nedović-Budić, Z.; Alavi Razavi, A.; Norouzzadeh, M.; Hodhodkian, H. Interactive approach for GIS-based earthquake scenario development and resource estimation (Karmania hazard model). Comput. Geosci. 2013, 51, 324–338. [Google Scholar] [CrossRef]
- Rahman, N.; Ansary, M.A.; Islam, I. GIS based mapping of vulnerability to earthquake and fire hazard in Dhaka city, Bangladesh. Int. J. Disaster Risk Reduct. 2015, 13, 291–300. [Google Scholar] [CrossRef]
- Armaş, I.; Toma-Danila, D.; Ionescu, R.; Gavriş, A. Vulnerability to Earthquake Hazard: Bucharest Case Study, Romania. Int. J. Disaster Risk Sci. 2017, 8, 182–195. [Google Scholar] [CrossRef]
- Karimzadeh, S.; Miyajima, M.; Hassanzadeh, R.; Amiraslanzadeh, R.; Kamel, B. A GIS-based seismic hazard, building vulnerability and human loss assessment for the earthquake scenario in Tabriz. Soil Dyn. Earthq. Eng. 2014, 66, 263–280. [Google Scholar] [CrossRef]
- Pradhan, B.; Abokharima, M.H.; Jebur, M.N.; Tehrany, M.S. Land subsidence susceptibility mapping at Kinta Valley (Malaysia) using the evidential belief function model in GIS. Nat. Hazards 2014, 73, 1019–1042. [Google Scholar] [CrossRef]
- Hakim, W.; Achmad, A.; Lee, C.-W. Land Subsidence Susceptibility Mapping in Jakarta Using Functional and Meta-Ensemble Machine Learning Algorithm Based on Time-Series InSAR Data. Remote Sens. 2020, 12, 3627. [Google Scholar] [CrossRef]
- Moung-Jin, L.; Won-Kyong, S.; Joong-Sun, W.; Inhye, P.; Saro, L. Spatial and temporal change in landslide hazard by future climate change scenarios using probabilistic-based frequency ratio model. Geocarto Int. 2014, 29, 639–662. [Google Scholar] [CrossRef]
- Fawcett, T. An introduction to ROC analysis. Pattern Recognit. Lett. 2006, 27, 861–874. [Google Scholar] [CrossRef]
- Friedman, J.; Hastie, T.; Tibshirani, R. Additive logistic regression: A statistical view of boosting (with discussion and a rejoinder by the authors). Ann. Stat. 2000, 28, 337–407. [Google Scholar] [CrossRef]
- Quinlan, J.R. C4. 5: Programs for Machine Learning; Elsevier: Amsterdam, The Netherlands, 2014; ISBN 0080500587. [Google Scholar]
- Landwehr, N.; Hall, M.; Frank, E. Logistic Model Trees. Mach. Learn. 2005, 59, 161–205. [Google Scholar] [CrossRef] [Green Version]
- Lim, T.-S.; Loh, W.-Y.; Shih, Y.-S. A Comparison of Prediction Accuracy, Complexity, and Training Time of Thirty-Three Old and New Classification Algorithms. Mach. Learn. 2000, 40, 203–228. [Google Scholar] [CrossRef]
- Shahabi, H.; Ahmad, B.B.; Khezri, S. Evaluation and comparison of bivariate and multivariate statistical methods for landslide susceptibility mapping (case study: Zab basin). Arab. J. Geosci. 2013, 6, 3885–3907. [Google Scholar] [CrossRef]
- Doetsch, P.; Buck, C.; Golik, P.; Hoppe, N.; Kramp, M.; Laudenberg, J.; Oberdörfer, C.; Steingrube, P.; Forster, J.; Mauser, A. Logistic model trees with auc split criterion for the kdd cup 2009 small challenge. In Proceedings of the KDD-Cup 2009 Competition. PMLR Proc. Mach. Learn. Res. 2009, 7, 77–88. [Google Scholar]
- McFadden, D. Conditional logit analysis of qualitative choice behavior. In Frontiers in Econometrics; Academic Press: Cambridge, MA, USA, 1973. [Google Scholar]
- Kleinbaum, D.G.; Klein, M. Survival Analysis; Springer: New York, NY, USA, 2010; ISBN 1441966455. [Google Scholar]
- Colkesen, I.; Sahin, E.K.; Kavzoglu, T. Susceptibility mapping of shallow landslides using kernel-based Gaussian process, support vector machines and logistic regression. J. Afr. Earth Sci. 2016, 118, 53–64. [Google Scholar] [CrossRef]
- Lee, S. Application of logistic regression model and its validation for landslide susceptibility mapping using GIS and remote sensing data. Int. J. Remote Sens. 2005, 26, 1477–1491. [Google Scholar] [CrossRef]
- Wang, L.-J.; Guo, M.; Sawada, K.; Lin, J.; Zhang, J. A comparative study of landslide susceptibility maps using logistic regression, frequency ratio, decision tree, weights of evidence and artificial neural network. Geosci. J. 2016, 20, 117–136. [Google Scholar] [CrossRef]
- Bui, D.T.; Pradhan, B.; Lofman, O.; Revhaug, I.; Dick, O.B. Landslide susceptibility assessment in the Hoa Binh province of Vietnam: A comparison of the Levenberg–Marquardt and Bayesian regularized neural networks. Geomorphology 2012, 171, 12–29. [Google Scholar]
- Xu, C.; Xu, X.; Dai, F.; Saraf, A.K. Comparison of different models for susceptibility mapping of earthquake triggered landslides related with the 2008 Wenchuan earthquake in China. Comput. Geosci. 2012, 46, 317–329. [Google Scholar] [CrossRef]
- Han, M. The 6th Day of the Earthquake… Gyeongju Citizens “Continuously Anxious over Aftershocks”. Available online: https://www.yna.co.kr/view/AKR20160917017800053 (accessed on 21 January 2021).
- Gliem, J.A.; Gliem, R.R. Calculating, Interpreting, and Reporting Cronbach’s Alpha Reliability Coefficient for Likert-Type Scales. In Midwest Rest to Practice Conference in Adult Continuing and Community Education; The Ohio State University: Colombus, OH, USA, 2003; p. 87. [Google Scholar]
- Becker, J.S.; Paton, D.; Johnston, D.M.; Ronan, K.R.; McClure, J. The role of prior experience in informing and motivating earthquake preparedness. Int. J. Disaster Risk Reduct. 2017, 22, 179–193. [Google Scholar] [CrossRef]
- Paul, B.K.; Bhuiyan, R.H. Urban earthquake hazard: Perceived seismic risk and preparedness in Dhaka City, Bangladesh. Disasters 2010, 34, 337–359. [Google Scholar] [CrossRef] [PubMed]
- Tekeli-Yeşil, S.; Dedeoǧlu, N.; Tanner, M.; Braun-Fahrlaender, C.; Obrist, B. Individual preparedness and mitigation actions for a predicted earthquake in Istanbul. Disasters 2010, 34, 910–930. [Google Scholar] [CrossRef]


| Factor | Class | Total % | Event % | Frequency Ratio |
|---|---|---|---|---|
| Slope (degree) | 0–2.44 | 20.06 | 70.26 | 3.50 |
| 2.44–11.60 | 20.21 | 24.47 | 1.21 | |
| 11.60–18.32 | 20.14 | 4.21 | 0.21 | |
| 18.32–25.04 | 19.79 | 0.92 | 0.05 | |
| 25.04–77.89 | 19.77 | 0.13 | 0.01 | |
| Elevation (m) | 0–74 | 20.02 | 81.79 | 4.09 |
| 74–153 | 20.04 | 13.7 | 0.69 | |
| 153–252 | 19.99 | 4.48 | 0.23 | |
| 252–407 | 19.97 | 0 | 0 | |
| 407–1898 | 19.96 | 0 | 0 | |
| PGA (gal) | 0–0.81 | 17.97 | 0 | 0 |
| 0.81–1.48 | 20.71 | 0 | 0 | |
| 1.48–2.26 | 23.86 | 0 | 0 | |
| 2.26–3.37 | 19.26 | 3.58 | 0.19 | |
| 3.37–28.56 | 18.17 | 96.41 | 5.31 | |
| Distance from epicenter (km) | 0–26.90 | 19.55 | 100 | 5.12 |
| 26.90–43.27 | 19.96 | 0 | 0 | |
| 43.27–58.48 | 19.88 | 0 | 0 | |
| 58.48–83.04 | 20.61 | 0 | 0 | |
| 83.04–149.12 | 19.97 | 0 | 0 | |
| Distance from fault (km) | 0–0.92 | 20.00 | 18.58 | 0.93 |
| 0.92–2.29 | 20.00 | 8.33 | 0.42 | |
| 2.29–4.14 | 20.00 | 6.41 | 0.33 | |
| 4.14–7.36 | 19.99 | 13.71 | 0.69 | |
| 7.36–39.08 | 19.99 | 52.94 | 2.65 | |
| Construction materials | Steel | 31.88 | 22.81 | 0.71 |
| Masonry | 28.81 | 20.70 | 0.71 | |
| Concrete | 21.08 | 55.57 | 2.63 | |
| Wood | 17.86 | 0.9 | 0.05 | |
| Concrete and steel | 0.25 | 0 | 0 | |
| Other | 0.10 | 0 | 0 | |
| Building density | 0–157 | 11.85 | 0 | 0 |
| 157–314 | 29.08 | 0.51 | 0.02 | |
| 314–628 | 22.51 | 7.56 | 0.34 | |
| 628–1256 | 21.96 | 17.30 | 0.79 | |
| 1256–40,065 | 14.57 | 74.61 | 5.13 | |
| Building height (m) | 0–1.57 | 20.11 | 3.55 | 0.18 |
| 1.57–3.15 | 20.76 | 7.32 | 0.36 | |
| 3.15–4.73 | 19.70 | 14.43 | 0.74 | |
| 4.73–7.88 | 19.72 | 29.28 | 1.49 | |
| 7.88–402 | 19.68 | 45.39 | 2.31 | |
| Land use | Residential | 2.70 | 37.64 | 0.76 |
| Industrial | 0.81 | 13.64 | 0.92 | |
| Commercial | 0.32 | 23.29 | 3.99 | |
| Culture, sports, and recreation facilities | 0.04 | 1.17 | 1.62 | |
| Transportation area | 1.30 | 19.058 | 0.8 | |
| Public facility area | 0.32 | 5.176 | 0.8 | |
| Agricultural | 21.88 | 0 | 0 | |
| Forest area | 66.71 | 0 | 0 | |
| Grassland | 0.30 | 0 | 0 | |
| Marsh | 0.73 | 0 | 0 | |
| Bare ground | 1.72 | 0 | 0 | |
| Water body | 2.06 | 0 | 0 | |
| Child population | 0–22 | 20.59 | 14.92 | 0.73 |
| 22–37 | 20.85 | 2.57 | 0.13 | |
| 37–60 | 19.73 | 5.14 | 0.27 | |
| 60–228 | 19.68 | 7.59 | 0.39 | |
| 228–10,747 | 19.13 | 69.75 | 3.65 | |
| Elderly population | 0–823 | 20.00 | 18.01 | 0.91 |
| 823–1049 | 20.09 | 2.31 | 0.12 | |
| 1049–1508 | 20.08 | 3.98 | 0.19 | |
| 1508–2252 | 20.13 | 5.79 | 0.29 | |
| 2252–31,218 | 19.68 | 69.88 | 3.56 | |
| Population density | 0–1723 | 19.04 | 13.32 | 0.69 |
| 1723–2872 | 29.78 | 4.61 | 0.16 | |
| 2872–4595 | 22.50 | 2.90 | 0.13 | |
| 4595–10,913 | 14.91 | 8.17 | 0.55 | |
| 10,913–146,455 | 13.75 | 70.97 | 5.17 | |
| Distance from hospital (km) | 0–6.92 | 19.32 | 76.28 | 3.95 |
| 6.92–12.11 | 20.99 | 18.58 | 0.89 | |
| 12.11–17.59 | 20.15 | 4.87 | 0.25 | |
| 17.59–24.81 | 19.90 | 0.25 | 0.02 | |
| 24.81–73.56 | 19.62 | 0 | 0 | |
| Distance from police station (km) | 0–3.39 | 17.89 | 70.51 | 3.95 |
| 3.39–5.66 | 20.88 | 14.48 | 0.69 | |
| 5.66–7.93 | 20.16 | 8.71 | 0.44 | |
| 7.93–11.32 | 21.22 | 5.76 | 0.28 | |
| 11.32–72.22 | 19.83 | 0.51 | 0.03 | |
| Distance from fire station (km) | 0–5.24 | 18.94 | 79.35 | 4.18 |
| 5.24–8.84 | 20.22 | 15.64 | 0.77 | |
| 8.84–12.78 | 20.50 | 3.84 | 0.18 | |
| 12.78–18.35 | 20.40 | 1.15 | 0.05 | |
| 18.35–83.57 | 19.91 | 0 | 0 |
| % | Knowledge | Awareness | Management | |||||
|---|---|---|---|---|---|---|---|---|
| All Samples (n = 1256) | Mean | SD | Mean | SD | Mean | SD | ||
| Gender | Male | 50.96 | 3.1988 | 0.6655 | 3.1428 | 0.6937 | 3.1759 | 0.6299 |
| Female | 49.04 | 2.9032 | 0.7008 | 2.9659 | 0.6591 | 2.8484 | 0.6515 | |
| Age Group | Under 20 | 17.75 | 3.1274 | 0.7671 | 3.1229 | 0.6648 | 3.1157 | 0.6535 |
| 30s | 19.11 | 3.0008 | 0.7141 | 2.9442 | 0.7138 | 2.9450 | 0.7019 | |
| 40s | 22.37 | 2.9993 | 0.6652 | 2.9929 | 0.6592 | 2.9117 | 0.6303 | |
| 50s | 23.49 | 3.0414 | 0.6664 | 3.0569 | 0.6684 | 3.0285 | 0.6372 | |
| Over 60 | 17.28 | 3.1244 | 0.6862 | 3.1917 | 0.6886 | 3.1060 | 0.6692 | |
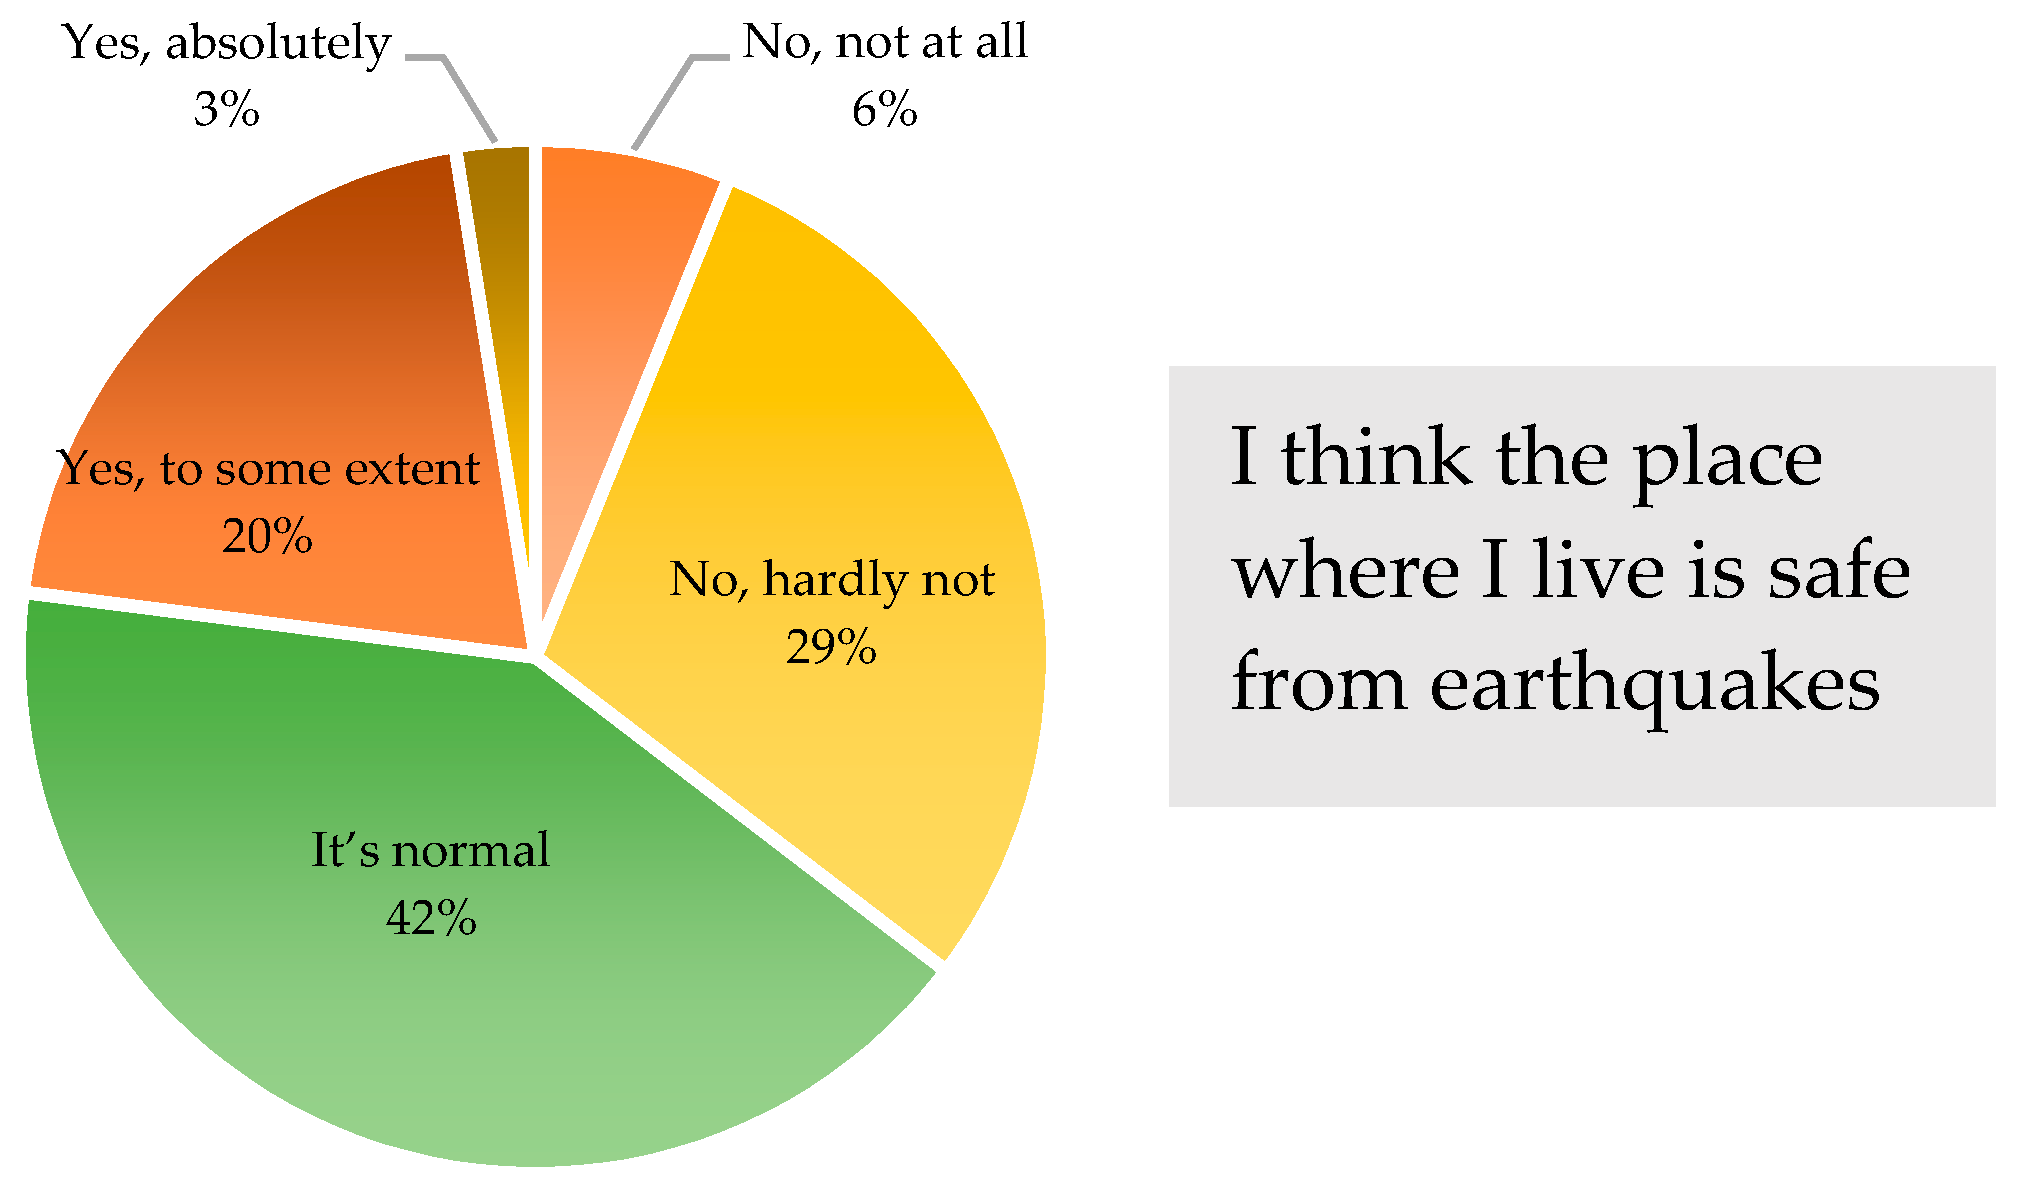
| Risk Awareness | No, not at all | 6.13 | 2.9974 | 0.7877 | 3.1922 | 0.7756 | 2.9299 | 0.7812 |
| No, hardly not | 29.30 | 3.0538 | 0.7050 | 3.0946 | 0.7120 | 2.9533 | 0.6851 | |
| It’s normal | 41.64 | 3.0164 | 0.6718 | 3.0191 | 0.6340 | 2.9897 | 0.6121 | |
| Yes, to some extent | 20.46 | 3.1354 | 0.6694 | 3.0412 | 0.6471 | 3.1447 | 0.6095 | |
| Yes, absolutely | 2.47 | 3.1484 | 0.9946 | 3.0065 | 1.0462 | 3.3226 | 0.9888 | |
| Final Education | Under high school | 1.11 | 2.7857 | 0.8282 | 3.1000 | 0.8727 | 3.0571 | 0.8821 |
| High school graduate | 16.16 | 2.8512 | 0.6770 | 2.9586 | 0.6560 | 2.8975 | 0.6496 | |
| In college (or university) | 5.81 | 3.3151 | 0.6960 | 3.3014 | 0.6482 | 3.2877 | 0.5588 | |
| College (or university) graduate | 5.81 | 3.0227 | 0.6805 | 3.0336 | 0.6759 | 2.9755 | 0.6516 | |
| In graduate school | 64.41 | 3.4762 | 0.6999 | 3.1048 | 0.6888 | 3.3524 | 0.5759 | |
| Graduate school graduate | 10.83 | 3.3632 | 0.6685 | 3.1912 | 0.7176 | 3.2250 | 0.6818 | |
Publisher’s Note: MDPI stays neutral with regard to jurisdictional claims in published maps and institutional affiliations. |
© 2021 by the authors. Licensee MDPI, Basel, Switzerland. This article is an open access article distributed under the terms and conditions of the Creative Commons Attribution (CC BY) license (https://creativecommons.org/licenses/by/4.0/).
Share and Cite
Han, J.; Nur, A.S.; Syifa, M.; Ha, M.; Lee, C.-W.; Lee, K.-Y. Improvement of Earthquake Risk Awareness and Seismic Literacy of Korean Citizens through Earthquake Vulnerability Map from the 2017 Pohang Earthquake, South Korea. Remote Sens. 2021, 13, 1365. https://doi.org/10.3390/rs13071365
Han J, Nur AS, Syifa M, Ha M, Lee C-W, Lee K-Y. Improvement of Earthquake Risk Awareness and Seismic Literacy of Korean Citizens through Earthquake Vulnerability Map from the 2017 Pohang Earthquake, South Korea. Remote Sensing. 2021; 13(7):1365. https://doi.org/10.3390/rs13071365
Chicago/Turabian StyleHan, Ju, Arip Syaripudin Nur, Mutiara Syifa, Minsu Ha, Chang-Wook Lee, and Ki-Young Lee. 2021. "Improvement of Earthquake Risk Awareness and Seismic Literacy of Korean Citizens through Earthquake Vulnerability Map from the 2017 Pohang Earthquake, South Korea" Remote Sensing 13, no. 7: 1365. https://doi.org/10.3390/rs13071365