Article

Quantitative Recognition and Characteristic Analysis of Production-Living-Ecological Space Evolution for Five Resource-Based Cities: Zululand, Xuzhou, Lota, Surf Coast and Ruhr

School of Environment and Spatial Informatics, China University of Mining and Technology, Xuzhou 221116, China
*
Author to whom correspondence should be addressed.
Remote Sens. 2021, 13(8), 1563; https://doi.org/10.3390/rs13081563
Submission received: 19 March 2021 / Revised: 12 April 2021 / Accepted: 14 April 2021 / Published: 17 April 2021
(This article belongs to the Special Issue Advancements in Remote Sensing of Land Surface Change)

Abstract

:
The accurate identification of PLES changes and the discovery of their evolution characteristics is a key issue to improve the ability of the sustainable development for resource-based urban areas. However, the current methods are unsuitable for the long-term and large-scale PLES investigation. In this study, a modified method of PLES recognition is proposed based on the remote sensing image classification and land function evaluation technology. A multi-dimensional index system is constructed, which can provide a comprehensive evaluation for PLES evolution characteristics. For validation of the proposed methods, the remote sensing image, geographic information, and socio-economic data of five resource-based urbans (Zululand in South Africa, Xuzhou in China, Lota in Chile, Surf Coast in Australia, and Ruhr in Germany) from 1975 to 2020 are collected and tested. The results show that the data availability and calculation efficiency are significantly improved by the proposed method, and the recognition precision is better than 87% (Kappa coefficient). Furthermore, the PLES evolution characteristics show obvious differences at the different urban development stages. The expansions of production, living, and ecological space are fastest at the mining, the initial, and the middle ecological restoration stages, respectively. However, the expansion of living space is always increasing at any stage, and the disorder expansion of living space has led to the decrease of integration of production and ecological spaces. Therefore, the active polices should be formulated to guide the transformation of the living space expansion from jumping-type and spreading-type to filling-type, and the renovation of abandoned industrial and mining lands should be encouraged.

Graphical Abstract

1. Introduction

Resource-based cities are cities in which development depends primarily on the exploitation and primary processing of natural resources (e.g., minerals, energy, and virgin forests) [1]. These cities have made great contributions to the economic and social development of their respective countries by supplying basic energy and raw materials. However, due to resource exhaustion, a lot of problems can be exposed. For example, environmental degradation, economic recession, increased unemployment rate, etc. [2,3]. Therefore, many investigations into sustainable development of resource-based urban areas have been carried out, and some significant results have been obtained. For example, the driving forces of land use/cover change in resource-based urban areas are analyzed. The results show that the policy transformation of the resource industry has the most important influence on the land use change in resource-based urbans [4]. The land use change of resource-based urbans and the industry life cycle have a high degree of consistency [5]. In addition, the ecological vulnerability of resource-based urbans is also investigated, and the different resource exploitation strategies are proposed for the regions with different ecological vulnerability indexes [6].
However, there is still a lack of investigation into the long-term and large-scale spatial evolution characteristics of resource-based urbans. There is also a lack of research into urban spatial change differences for resource-based urbans at different exploiting stages. Therefore, it is a disadvantage to formulate the targeted spatial development planning for different resource-based urbans. In this study, the urban tempo-spatial evolution characteristics are analyzed in detail based on remote sensing image data, which are from five typical mining resource-based urbans in the past 45 years. The aim is to discover the main features of urban spatial evolution and determine the restricting factors for the healthy development of resource-based urbans. The findings of this study allow us to understand the laws of urban spatial development and improve the ability of sustainable development for resource-based urbans.
In the past decades, many kinds of urban planning approaches have been proposed for different planning objectives. For example, the approach based on ecological footprint and biocapacity focused mainly on the urban environmental carrying capacity and the sustainable development of urban settlements [7]. The approach of land use planning is to determine the most favorable spatial development of various land-use types [8]. The objective of urban traffic planning is to provide optimal spatial distribution of traffic facilities and road network for improving urban transport capacity [9]. Therefore, if multiple plans are implemented in the same place at the same time, it will lead to difficulties in decision-making and implementation (e.g., the conflict areas) [10,11]. To solve this problem, a new concept of space planning has been put forward and named as the production-living-ecological space (PLES) planning, where the land space is divided into three categories (production, living, and ecology) for strengthening the integration and coordination of multiple plans [12,13].
A number of theoretical and practical studies of PLES planning have been carried out in the past decade, which can be summarized as follows: (1) the recognition and division of PLES dominant function areas [14,15]; (2) the evaluation of the index design of PLES evolution characteristics [16,17]; (3) the simulation and optimization allocation of PLES planning [18,19]. Furthermore, the research method has been transformed from the traditional qualitative evaluation to the quantitative measurement; the research scale is increasingly refined (from the national and municipal scales to the town and village scales); the data source has been developed from traditional socio-economic statistical data to integrate multi-source data, such as remote sensing image and geographic information data [20,21].
However, some problems with PLES planning are still unsolved. For example, the recognition and division of PLES is mostly based on the two kinds of methods. One method is based on biophysical process expression and value transformation, where the different functional spaces are identified by the statistical data of each administrative unit and their transformation values. The statistical data include environment, energy, and economy data, etc. [22] Another method is the based on land utilization investigation data, where urban functional spaces are recognized by evaluating the function of each plot and merging the same function of plots [23]. The first kind of method is highly precise for PLES recognition, but its calculation is complex and data dependency is very strong. Therefore, it is not convenient for the non-professional users. The second kind of method is simple, but it is very difficult for unauthorized users to obtain the land utilization investigation data. Therefore, they cannot meet the requirement of the long-time and large-scale PLES recognition. In addition, the current evaluation indexes of PLES evolution characteristics are puzzled and unsystematic. Many indexes crossover, overlap, and are represented poorly [24]. Therefore, a multi-dimensional index system should be constructed to comprehensively evaluate PLES evolution characteristics.
The main aim of this study is to provide a long-term and multi-dimensional analysis of PLES changes and determine the main rules of PLES evolution and the restricted factors for sustainable development of resource-based urbans. The specific objectives include: (i) developing a modified method which is suitable for long-term and large-scale PLES recognition; (ii) constructing a multi-dimensional index system, which can provide a comprehensive evaluation for PLES evolution characteristic analysis; (iii) discovering the main rules of resource-based urbans at the different exploiting stages; (iv) finding out the bottleneck problems and proposing targeted polices to improve the ability of the sustainable development of resource-based urbans.
To realize the above objectives, the following work has been performed. Firstly, the study areas and data sources are determined in Section 2. The study areas are five typical mining resource-based urbans (Zululand in South Africa, Xuzhou in China, Lota in Chile, Surf Coast in Australia, and Ruhr in Germany). The data includes the remote sensing image, geographic information, and socio-economic data of these cities from 1975 to 2020. Then, a modified method of PLES recognition, based on remote sensing image classification and land function evaluation technology, is proposed in Section 3. A multi-dimensional index system of PLES evolution character analysis is constructed, which includes three layers (expansion scale, spatial distribution, and interaction relationship) and six special indexes (the proportion of PLES function, the proportion of PLES dominant function, the largest patch index, the landscape shape index, the coupling index, and the coordination index). In Section 4, the recognition results and PLES evolution characteristics of five chosen cities are analyzed in detail. The main issues and locations with problems to do with PLES development in five cities are pointed out. In Section 5, the main findings of this study are compared with the relevant studies, and the limitations of this study are also analyzed. Finally, some conclusions and the policy implications are proposed in Section 6.

2. Study Area and Data Sources
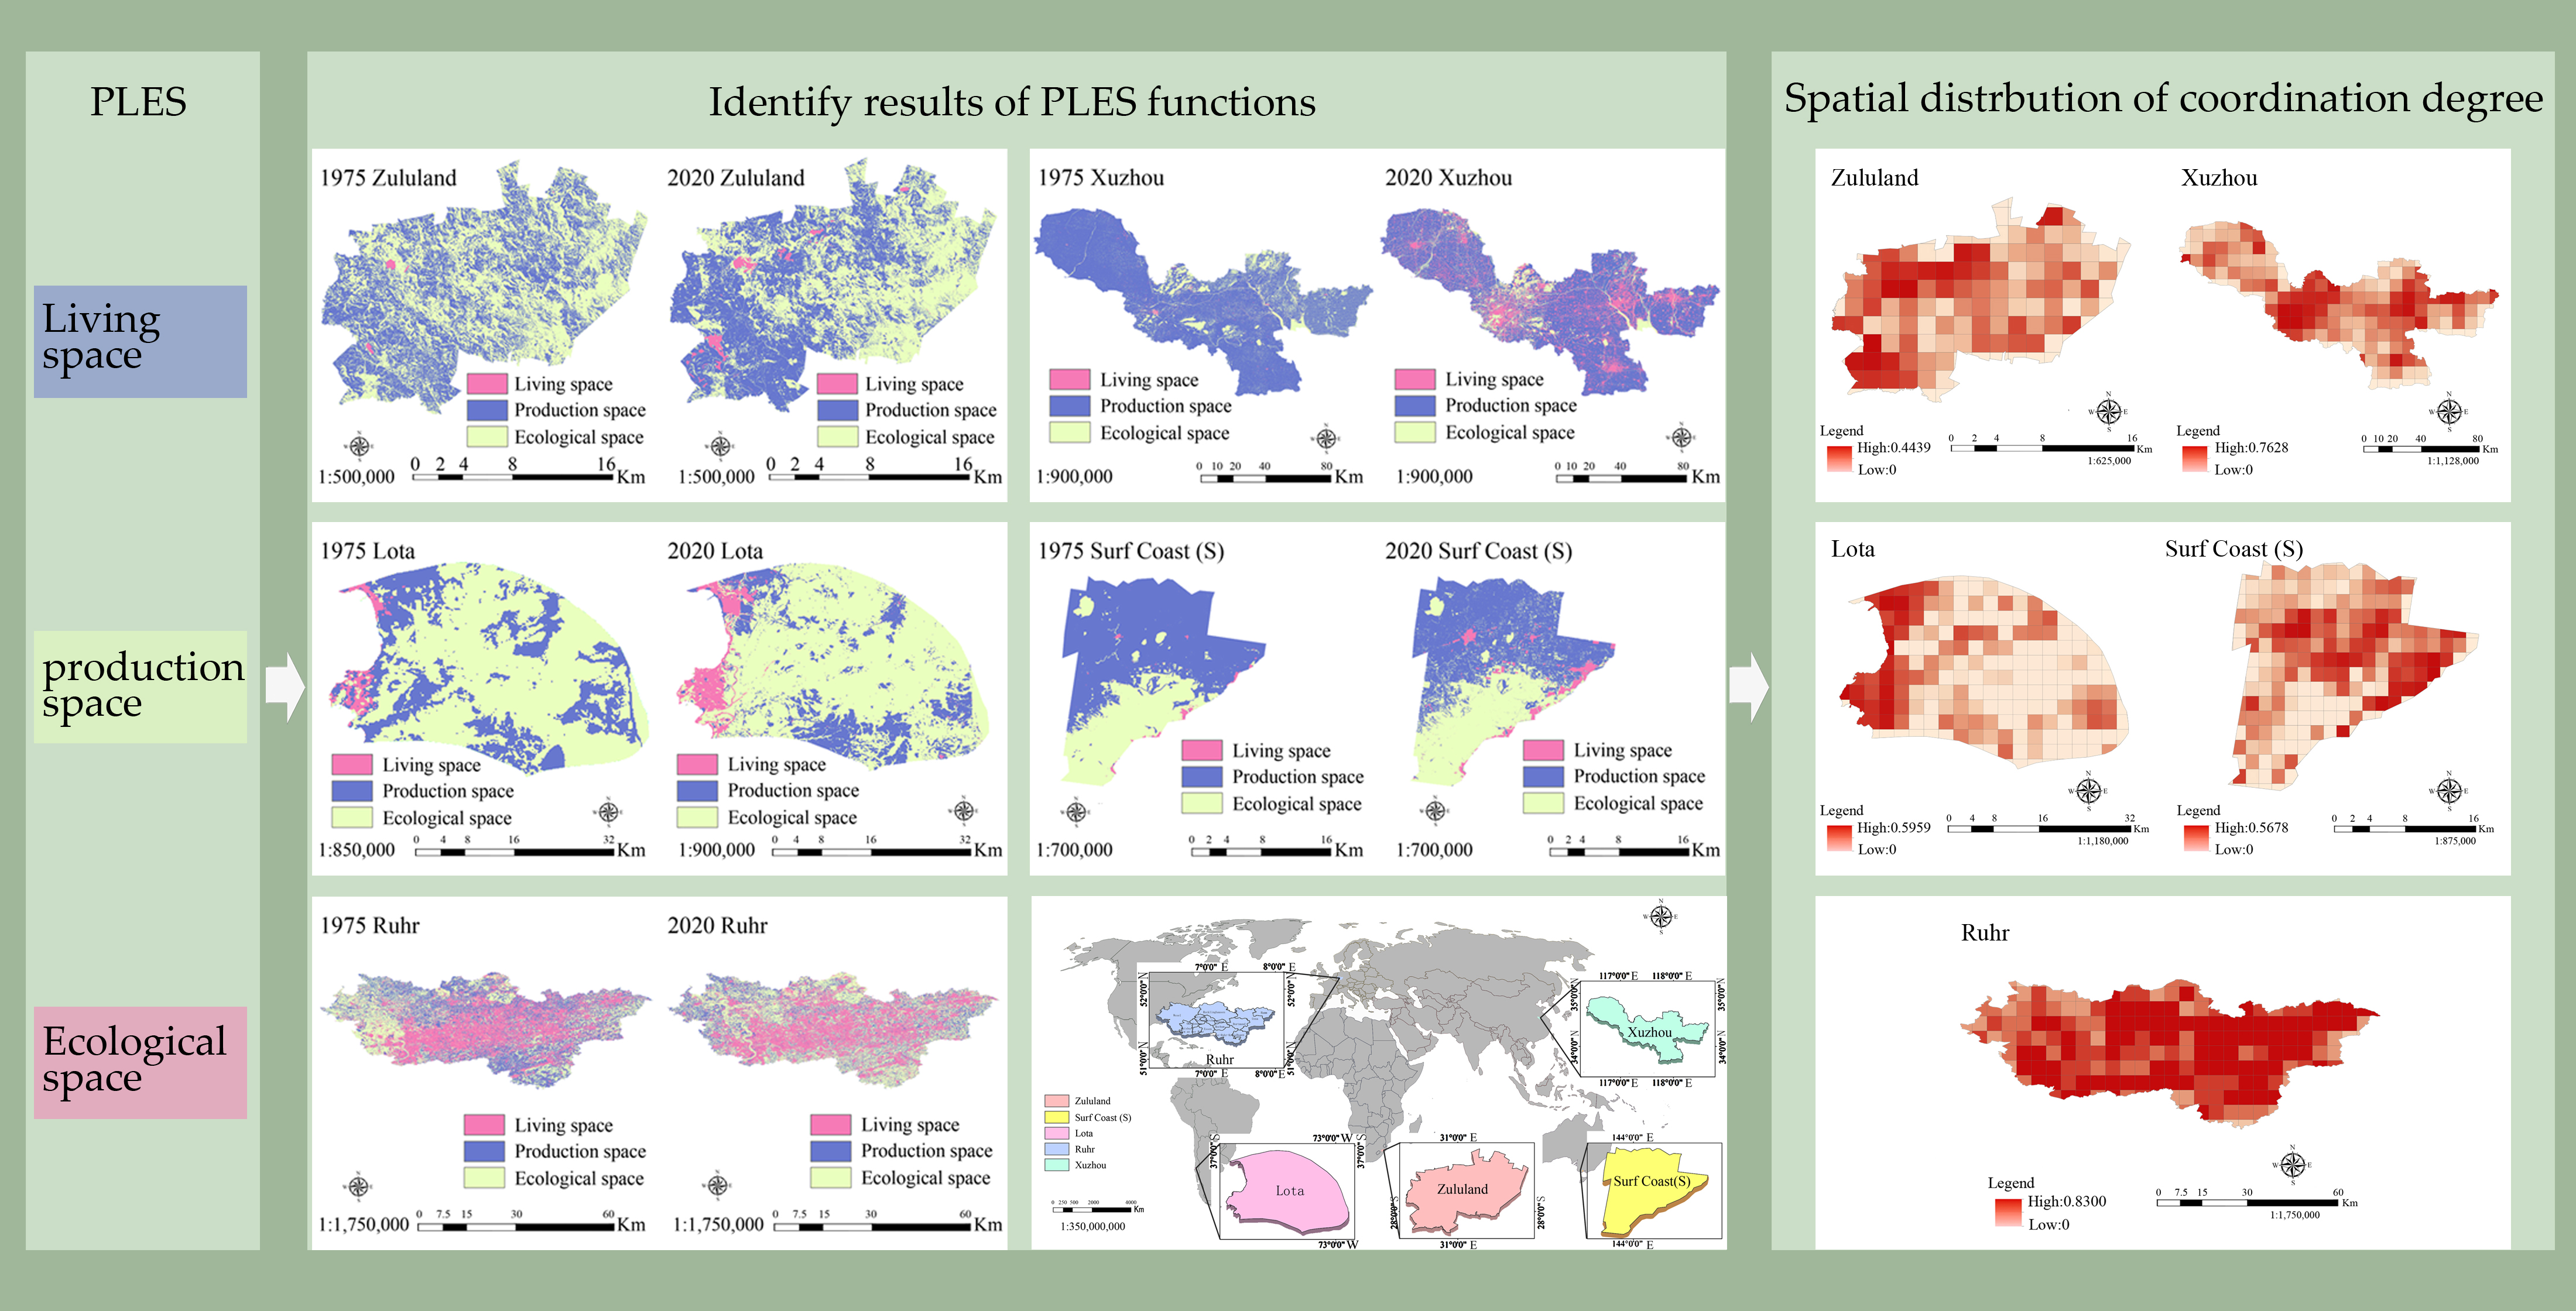
2.1. Study Area

To investigate the PLES evolution characteristics of resource-based urbans at different exploiting stages, study areas are selected following these principles: (a) the selected cities should be located in the different areas as far as possible, such as Africa, Asia, America, Australia, and Europe; (b) the selected cities should be at the different stages of resource exploitation, such as the mining stage, initial, middle, mid-late, and late stages of ecological restoration; (c) a long-time span data (1975–2020) of selected cities is available, including the remote sensing image, geographic information and socio-economic data. According to the above principles, the five typical mining resource-based urbans (Zululand in South Africa, Xuzhou in China, Lota in Chile, Surf Coast in Australia, and Ruhr in Germany) are picked out. Figure 1 shows the geographical distribution of five selected cities.
Zululand is located in the east of South Africa, which is one of the most important coal production cities in South Africa. Since 1977, it is still in the period of resource exploitation [25]. Xuzhou is located in the southeast of China, which was an important coal producing city in China. However, all coal mines were closed in 2011 and it is now in the initial stage of ecological restoration [26]. Lota is located in the middle of Chile, which started to mine in 1884 and closed in 1990. Now, it is in the middle stage of ecological restoration [27]. Surf Coast is located in the southeast of Australia, where coal is mainly distributed in the southeast coastal areas. In 1991, it announced the closure of the mine and transformed into the tourist city. It is now in the mid-late stage of ecological restoration [28]. Ruhr is the most famous industrial zone, not only in Germany, but in the world. It is located in the west of Germany, where the coal reserves account for 3/4 of the total reserves in Germany [29]. With the decline of traditional industries (e.g., coal, steel, etc.), Ruhr has carried out industrial restructuring and environmental improvement since the 1970s [30]. Now, it has been transformed into a scientific-technological city, where the computer and information industries are dominant. It is in the late stage of ecological restoration [31].

2.2. Data Sources

In this study, there are three kinds of data collected and used: one is the remote sensing images of five resource-based urbans from 1975 to 2020 (a cycle of nine years and a total of six cycles); the other is the geographic information data, which provide the vector files of administrative divisions of five cities in 2018; the third is the socio-economic statistical data from the literature and statistical yearbooks from 1975 to 2020, including the population, industrial economy, natural resources of five cities, etc. The special information of the three kinds of data is listed in the Table 1.
The remote sensing image data are from the Landsat satellite. The data acquisition time is in the summer of each city, because identifying remote sensing images of vegetation in the growth season peak is easier than during other seasons [32]. The specific years are 1975, 1984, 1993, 2002, 2011, and 2020, respectively. The image spatial resolutions of 1975–1993 and 2002–2020 are 60 m × 60 m and 30 m × 30 m, respectively. Since the administrative boundaries of the five cities have not significantly changed in the past 45 years, the vector files of administrative division from the Geographical Information Monitoring Cloud platform of China (GIM Cloud) in 2018 are adopted.

3. Research Methods

3.1. Recognition Method of PLES Based on Remote Sensing Image Classification

Accurate identification of the function spatial changes of PLES is necessary for investigating PLES spatial distribution and evolution characteristics, and two kinds of method are often used to realize this. One is the method based on biophysical process expression and value transformation, where the PLES function is identified by using the value transformation models and the environmental, energy, economic, and other statistical data of each administrative unit. The other is the classification method of land utilization investigation and function evaluation, where the PLES function of each type of land is evaluated and the same function of lands are classified into one of production, living, or ecological space functions. The first kind of method is highly precise for PLES function recognition, but its calculation is complex and data dependency is strong. Therefore, it is not convenient for the non-professional users. The second kind of method is simple, but it is very difficult to obtain the land utilization investigation data for the unauthorized users. Therefore, there is still no simple and convenient method to meet the requirements of long-term and large-scale PLES function recognition.
To alleviate this problem, an efficient recognition method of PLES function, based on remote sensing image classification and land function evaluation technology, is proposed in this study. The basic idea is that the recognized land use types can be reduced by merging the land use types which have the same PLE function, and the evaluation processing can be simplified by assigning the priori scores of PLE function for each kind of land. The specific steps are as follows: (i) the types of land use are identified by remote sensing image data classification technology. In this study, seven types of land use are identified by the Convolutional Neural Network (CNN) method [33], including the waters, construction land, woodland, grass, arable land, industrial and mining land, and rural residential land; (ii) the priori scores of the PLE function of each land use type are assigned based on the existing references and our experimental results [34,35]. The specific scoring criteria are shown in Table 2; (iii) the PLE function scores of each unit space (60 × 60 m and 30 × 30 m) are determined based on the results of land type classification and land function evaluation. The modified method has more advantages than the existing two methods in operation convenience and data availability, because there is no complicated calculations and only remote sensing image data is needed. Therefore, it is more suitable for long-term and large-scale PLES function recognition than the existing methods. However, it should be noticed that a limited number of land types can be identified by remote sensing image data. On the contrary, all types of land can be obtained if using land utilization investigation data. Therefore, the precision of PLES recognition with the proposed method has to be verified by the real experimental data.
In theory, it is feasible to use remote sensing image data to quantitatively identify the PLES function because the PLES function of many second-level land types is the same or similar [36]. For example, the cultivated land is subdivided into the paddy field, irrigated land, and dry land in the land utilization investigation data. However, their scores of production, living, and ecological function are the same (5, 0 and 3), where 5, 3, 1, and 0 indicate the strong, middle, weak, and no function, respectively. For another example, the woodland is subdivided into the forest land, shrub land, and other forest land, but their scores of PLES function are 1/0/5, 0/0/5 and 0/0/5, respectively [35]. However, the scores of PLES function from some second-level land types are different, although their first-level land types are the same. For example, the scores of PLES function from natural and artificial pasture are 1/0/5, 1/0/1, respectively, namely, the ecological function of natural pasture is stronger than that of artificial pasture.
Therefore, using remote sensing image data to quantitatively identify the PLES function can improve the operation convenience and the data availability, but it also leads to the loss of precision of PLES function identification at the same time. However, if this loss of precision is acceptable (a slight effect on the PLES evolution characteristics analysis), the proposed method is more efficient than the existing two methods. The actual precision of PLES function identification will be verified by real data in the Section 4. Table 2 shows the marking criteria for using remote sensing image data to evaluate PLES functions for the different land types.
Using the land use classification results of remote sensing image data and the above evaluation method of PLES function, the evaluation results of PLES function in the unit space (60 × 60 m and 30 × 30 m) can be obtained. However, the PLES functions are different in the same unit. To obtain the spatial distribution of the PLES dominant function of each city, the strongest function of PLES needs to be identified in each unit. This is used to determine the PLES dominant functions of each unit and the highest scores of production, living, and ecological functions of each unit. For example, if the scores of PLES functions are respectively 3, 5, and 0 in a patch of construction land, the dominant function of this unit is the living function.

3.2. Spatial Distribution and Evolution Characteristics Analysis Index of PLES Function

Many indexes of spatial distribution and evolution characteristics analysis of the PLES function have been presented. However, these indexes are puzzled or fragmental, where the indexes crossover, overlap, and are poorly represented. Therefore, it is necessary to construct a comprehensive index system to investigate the spatial distribution and evolution characteristics of the PLES function. In this section, a layer index system of PLES function evaluation is constructed, which includes three layers and six special evaluation indexes. The indexes of the first layer are used to analyze the scale variation of PLES, including the proportion of the PLES function (PPF) and the proportion of PLES dominant function (PDF). The indexes of the second layer are used to describe the spatial distribution of the PLES function, including the largest patch index (LPI) and the landscape shape index (LSI). The indexes of the third layer are used to evaluate the interaction relationship of the PLES function, including the coupling index and the coordination index. The specific formulas and principles of each index are as follows:
(a) The proportion of the PLES function (PPF) is mainly used to analyze the scores of production, living, and ecological function in the study area and it changes with time. The calculation formula is:
R K T = i = 1 n K i T i = 1 n P i T + i = 1 n L i T + i = 1 n E i T × 100 % ,   ( K = P , L , E )
RTK represents the percentage of the K-th function scores in the total scores of the PLES function in the T-th year. P, L, and E are respectively the scores of production, living, and ecological functions and K is one of P, L, and E. n is the number of unit space in the study area. Because 60 × 60 and 30 × 30 m of remote sensing image data are used in this article, a unit space is one pixel. The variation of the PPF of each city in the different years can be obtained by RTK minus RTK−1.
(b) Proportion of the PLES dominant function (PDF) is used to analyze the area proportion of the production, living, and ecological dominant function in the study area and its changes with the time. The calculation formula is:
R K T = j = 1 x K i T j = 1 a P j T + j = 1 b L j T + j = 1 c E j T × 100 % ,   ( K = P , L , E x = a , b , c )
R′TK’ notes the area proportion of the K′-th dominant function in the total study area in the T-th year. P′, L′, and E′ are respectively the areas of production, living, and ecological dominant functions, and K′ is one of P′, L′, and E′. a, b, and c are respectively the number of unit spaces of production, life, and ecological dominant functions and x is one of them. Since the area of unit space of each city is the same (60 × 60 or 30 × 30 m) in the same year, the area of P′, L′, and E′ can be replaced by the number of unit space (a, b, and c).
(c) Although the scale variation of the PLES function can be presented by PPF and PDF, the geographical distribution of PLES functions cannot be described by them. Therefore, the indexes of the second layer are adopted, namely the largest patch index (LPI) and landscape shape index (LSI), and the Fragstats software (Version 4.2) is used to calculate the two indexes. LPI and LSI represent the aggregation and integrity of urban land patches, respectively. The larger the value of LPI, the more concentrated the urban land expansion [37,38]. The smaller the value of LSI, the better integrity of urban land patches. The calculation formula is:
L P I = M a x ( a 1 , a 2 , a n ) A × 100 %
a is the area of each patch and A is the total area of all patches. Max means the maximum area of a1, a2, …, an and n is the number of patches.
L S I = 0.25 E A
E is the total length of the edge of the landscape. A is same with the Equation (3).
(d) The spatial distribution of PLES function can be analyzed by LPI and LSI. However, the interaction relationship between the different PLES functions cannot be described by the LPI and LSI. Therefore, the coupling and the coordination indexes are introduced to analyze the interrelationship between the different PLES functions in each city [39]. The calculation formula is as follows:
C = 3 × [ P × L × E ( P + L + E ) ] 1 / 3
D = C × T ,   T = α P + β L + χ E
C and D are the degree of coupling and coordination of the PLES function in one study area, respectively. The P, L, and E are the same as in the Equation (1). T is the weighted scores of P, L, and E. α, β, χ are respectively the weighted coefficients of P, L and E, which are set as 0.35, 0.35, and 0.30 [40]. In addition, the degree of coupling and coordination of production-living, production-ecological, and living-ecological functions can be written as
D = C × T ,   T P L = α P + β L ,   T P E = α P + χ E ,   T L E = β L + χ E
where α and β take 0.50 and 0.50 respectively to calculate the production-living coordination; α and χ take 0.55 and 0.45 respectively to calculate the production-ecological coordination; β and χ take 0.55 and 0.45 respectively to calculate the living-ecological coordination [41]. Therefore, the coupling and coordination level of PLES function in one study area can be obtained by Equations (6) and (7). The specific standards are as follows: [0, 0.2] is a serious disorder; [0.2, 0.4] is a moderate disorder; [0.4, 0.6] is basically coordinated; [0.6, 0.8] is moderately coordinated; [0.8, 1.0] is highly coordinated.

4. Experimental Results and Analysis

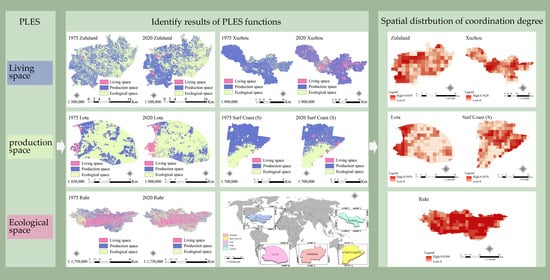
4.1. Quantitative Recognition Results of PLES

To analyze the spatial distribution and evolution characteristics of PLES of five selected resource-based urbans (Zululand in South Africa, Xuzhou in China, Lota in Chile, Surf Coast in Australia, and Ruhr in Germany) in the past 45 years, it is necessary to quantitatively identify the PLES function of each city. The remote sensing image data in Table 1 and the marking criterion of PLES functions in Table 2 are adopted to identify the PLES functions of five cities in 1975, 1984, 1993, 2002, 2011, and 2020, respectively. Figure 2 shows the identified results in 1975 and 2020.
For validation of the proposed method, the land utilization investigation data of Xuzhou, China in 2011 and the identification method of PLES functions are adopted. The identified results of two methods are highly consistent (Kappa coefficient is 87.1%). This means that the proposed method of PLES identification can meet the requirement of spatial distribution and evolution characteristics analysis of PLES functions, if the identified precision is not overemphasized. However, the proposed method is more efficient and convenient than the traditional methods of PLES function identification.

4.2. Analysis of PLES Evolution Characteristics

The spatial distribution and evolution characteristics of the PLES function of five cities in the different periods can be analyzed, based on the above identification results and the evaluation index system in Section 3.2. The variation of PPF and PDF of each city in the different years are calculated by Equations (1) and (2) and the results are listed in Table 3.
From the results in Table 3, it is clear that the PPF and PDF of five cities have been changed in different levers in the past 45 years. For Zululand at the mining stage, the PPF and PDF of the production function are increasing; on the contrary, the PPF and PDF of the ecological function are decreasing. The reason for this is that a large amount of ecological land is being transformed into the production land in this area. The PPF and PDF of living functions in Zululand is increased slightly, which means that this city is in the initial stage of urbanization. For Xuzhou at the initial stage of ecological restoration, the increase of PPF and PDF of living functions are a maximum of five cities; at the same time, the PPF and PDF of production and ecological function are all decreasing. This means that Xuzhou is in the period of rapid urban development. For Lota, Surf Coast, and Ruhr at the middle, mid-late, and late stage of ecological restoration respectively, the PPF and PDF of the ecological function are increasing; on the contrary, the PPF and PDF of the production function are decreasing. In addition, the growth rate of PPF and PDF of the living function of the three cities is decreasing. This means that the expansion of living space has slowed down as the urbanization process is completed gradually.
Although the scale variation of PLES functions of the five cities are shown in Table 3, the spatial distribution variation of PLES of each city in the past 45 years has not been demonstrated. Therefore, the LPI and LSI are adopted to analyze it. Table 4 and Figure 3 show the variations of LPI and LSI of five cities from 1975 to 2020, respectively.
From Table 4, it is clear that the aggregation of production space in Zululand increased significantly (LPI increased by 18.67%). However, the aggregation of production space was seriously damaged (LPI decreased by 16.73%). And Figure 3a shows the LSI of grassland in Zululand has the greatest increase from 1975 to 2020. Therefore, more attention should be paid to the protection of the grassland in Zululand in the future. For Xuzhou, the expansion scale of the living function is a maximum of five cities. However, the aggregation of living space has not been increased (LPI increased by 2.08%), and it leads to serious damage to the aggregation of production space (LPI decreased by 20.21%). From Figure 3b, the most important problem is that a number of scattered rural construction land destroys the integrity of the land landscape. The LSI of Lota is about an order of magnitude smaller than those of other cities from Figure 3c, which means the landscape integrity of Lota is best of five cities. And the aggregation of living and production spaces have not been decreased significantly, although the ecological space is increasing rapidly in Lota in past 45 years. The LPI of production space in Surf Coast has dropped significantly (−11.41%). The reason is that many abandoned industrial and mining lands in the area have been renovated into the small lakes, which leads to the decline of aggregation of production space and increased the LSI of water bodies as Figure 3d. Ruhr is at the late stage of ecological restoration, and the aggregation of living space has a greatest increase in five cities (LPI increased by 11.41%). However, the expansion of living space leads to the decrease in aggregation of other spaces (LPI of ecology and production dropped 5.89% and 3.47%, respectively).
In addition, it should be noted that the PSI values increased in most of cases in Figure 3. The main reason for this is that the areas of living space have significantly increased for five analyzed cities in the past 45 years (see Table 3). In addition, the jumping-type and spreading-type are the main expansion types of living space, rather than filling-type (see Figure 2). Therefore, it damaged the spatial integrity of the urban landscape and led to an increase in edge lengths for the most of patches. Namely, the LSI values increased, as shown in Figure 3. Therefore, more attention should be paid to solving the problem of disorder expansion of construction land in the future, especially Xuzhou and Ruhr.
The scale and spatial distribution of PLES function evolution of the five cities in the past 45 years was analyzed by PPF, PDF, LPI, and PSI indexes. However, the relationship between production, living, and ecological spaces is not demonstrated. Thus, the coupling and coordination indexes are adopted for further analysis. Figure 4 shows the variations of coupling and coordination indexes of the five cities from 1975 to 2020.
Figure 4a shows that the relationship of PLES functions of the five cities has been gradually strengthened in the past 45 years, where Ruhr has the strongest interaction relationship, Zululand has the weakest, and Xuzhou has the largest increase. Figure 4b–f reflects the good and bad situation of the relationships between the PLES functions of each city. The coordination index of Ruhr is the highest (>0.8), which is in a highly coordinated level. The coordination indexes of other cities are 0.4 ~ 0.8, which are in basic coordination and moderate coordination levels. Moreover, the coordination index of production-ecological (PE) space in the five cities are the highest. This means that the relationship of PE space is the best. In Xuzhou, the coordination index of production-living (PL) space is the lowest, and the coordination indexes of living-ecological (LE) of the other four cities are the lowest. This means that the disorderly expansion of living space has had a serious impact on the healthy development of production and ecological space.
To find out the specific locations of the low coordination degree of PL and LE in each city, a 9 km × 9 km grid is taken as the unit space and the spatial distributions of the coordination degree of LE space of Zululand, Lota and Surf Coast, and the coordination degree of PL space of Xuzhou and Ruhr in 2020 are shown in Figure 5.
Figure 5a,c,d shows that the areas of the lowest coordination degree of LE space are located in the northeast (Louwsburg) of Zululand, the middle east (Tricauco) of Lota, the north (Ombersley and Gnarwarre) and the southwest (Lorne) of Surf Coast, respectively. Figure 5b,e show that the areas of the lowest coordination degree of PL space are located in the northwest (Feng County and Pei County) of Xuzhou and the northwest (Wesel) of Ruhr, respectively. Therefore, these cities should pay more attention to alleviating the problem of disorderly expansion of living space in the above regions in the future.

5. Discussion

The obtained results demonstrate that the PLES evolution has two salient features in the development of resource-based urbans. One feature is that the expansion velocity of PLES is different for urbans at different exploiting stages. The expansions of production, living, and ecological space are fastest at the mining, the initial, and the middle ecological restoration stages, respectively. On the other hand, the expansion of living space is always increasing at any stage. In addition, the expansion velocity of living space is slowed down as the urbanization process is completed gradually. Moreover, the disorder expansion of living space has led to the decrease of integration of production and ecological spaces. However, most existing studies focus on resource-based cities at a specific exploiting stage [42]. For example, in the early days, the studies of resource-based urbans focused on the social problems, such as the proportion characters of male to female [43], the age structure changes of population [44], and the relationship between employment rate and industrial structure [45]. In the past decades, with the enhancement of awareness of environment protection, the study of the effects of resource-based urban development on the ecological environment has become a hot spot, such as ecological vulnerability evaluation [46], ecological restoration method [47], and pollution index system [48]. However, it is lack of a long-time analysis of urban spatial evolution characters at the different exploiting stages. The key limited factor is the data availability.
With the advances of satellite remote sensing and geo-information technology, it provides a new opportunity to solve this problem. In this study, a modified method of PLES recognition is proposed, based on the remote sensing image classification and land function evaluation technology. The proposed method has more advantages than the existing two methods for the data availability and the operation convenience. For example, the land utilization investigation data and the socio-economic statistical data from each administrative unit are needed if using the existing methods [49]. On the contrary, there is only remote sensing image data using this method, and it can be downloaded for free from the Internet. In addition, the complex calculation processes and mathematic models are required if using the method based on biophysical process expression and value transformation [50]. However, the proposed method in this study only needs the prior marking criteria to determine the PLES function scores of unit space. Therefore, the proposed method is more suitable for the long-term span and large-scale PLES recognition than the current methods.
The evaluation of PLES function is another important issue to reveal PLES evolution characteristics and problems. Therefore, many PLES evaluation indexes have been proposed for the different applications. For example, an environment evaluation index system is constructed based on Copula function for ecological assessment [51]. For another example, an evaluation index system is designed based on Analytic Hierarchy Process (AHP) to investigate the changes of landscape resources [52]. Moreover, the function area ratio, aggregation of function space, and local Moran Index are often used to analyze the PLES evolution characteristics [53,54]. However, these indexes, or index systems, just evaluate the PLES evolution characteristics from one dimension. In this study, a multi-dimensional index system is constructed to comprehensively evaluate the PLES evolution characteristics. Compared to the current methods, the proposed index system is more systematic and more organized for PLES function evaluation. In addition, the proposed index system just needs the PLES recognized results from the remote sensing image data, rather than the other data.
Based on the proposed PLES recognition method and the multi-dimensional evaluation index system, the evolution characteristics of PLES functions are analyzed, which are from five typical mining resource-based urbans in the past 45 years. Some significant characteristics and obvious problems of PLES evolution were discovered. Compared to the existing findings, the results of this study show the PLES evolution characteristics of resource-based urbans at the different exploiting stages. For example, the characteristics of PLES evolution show obvious differences at the different exploiting stages. The production, living, and ecological space expansion are fastest at the mining, the initial, and the middle ecological restoration stage, respectively. However, the area and aggregation of living space is always increasing at any stage. In addition, some common problems of PLES development are pointed out for the different resource-based urbans. For example, the rapid and disorderly expanding of living space has led to a decrease in integration of production and ecological spaces in all analyzed resource-based cities.
However, there are still some limitations in this study. (i) The PLES recognition precision of the proposed method is worse than that of the method based on land utilization investigation data. This is because the identified land types from remote sensing image classification technology are less than those from the and utilization investigation data. This leads to the decrease of evaluation accuracy, because the scores of the PLES function from some second-level land types are different, although their first-level land types are the same. (ii) The scores of the PLES function evaluation from the proposed method are rough (5, 3, 1 and 0). On the contrary, the evaluation results of the PLES function are intensive/specific, if using the method of biophysical process expression and value transformation. (iii) The proposed index system of PLES evolution analysis is also not perfect, because it just considers the tempo-spatial characteristics of PLES evolution. Therefore, the inherent factors and mechanism of PLES evolution cannot be revealed using this index system. With the development of artificial intelligence (AI) technology, the simulation and prediction of PLES evolution by AI have become a hot spot, such as cellular automata (CA) and multi-agent system (MAS). The dominant factors and fundamental laws of PLES evolution can be discovered by the CA and MAS technology [55]. And the optimal planning of urban PLES development can be also obtained based on the multi-objective optimization technology [56].

6. Conclusions

The accurate identification of PLES changes and the discovery of evolution rules to improve the ability of sustainable development of resource-based urban areas is a key issue. In this study, a modified PLES recognition method was proposed based on remote sensing image classification and land function evaluation technology, for the long-term and large-scale PLES investigation. In addition, a multi-dimensional index system was constructed, which can provide a comprehensive evaluation for PLES evolution characteristics. Using the proposed method and index system, the evolution of characteristics of PLES from five resource-based urbans in the past 45 years were analyzed in detail. Some obvious problems with PLES development in the five analyzed cities were discovered, and the targeted policy implications were proposed. The main conclusions of this study are as follows:
(1)
The characteristics of PLES evolution show obvious differences between the resource-based urbans at the different exploiting stages. The production, living, and ecological space expansions were fastest at the mining, the initial, and the middle ecological restoration stages, respectively. However, the expansion of living space was always increasing at any stage. The expansion velocity of living space slowed down as the urbanization process was completed gradually.
(2)
The largest patch indexes (LPI) of living space were always increasing for the five analyzed resource-based cites. This seriously damaged the integration of production and ecological spaces, such as the grassland in Zululand, the rural land in Xuzhou, and the water body in Surf Coast. In addition, the landscape shape indexes (LSI) of living space also increased in Zululand, Xuzhou, and Ruhr, due to the disorder expansion of urban construction land.
(3)
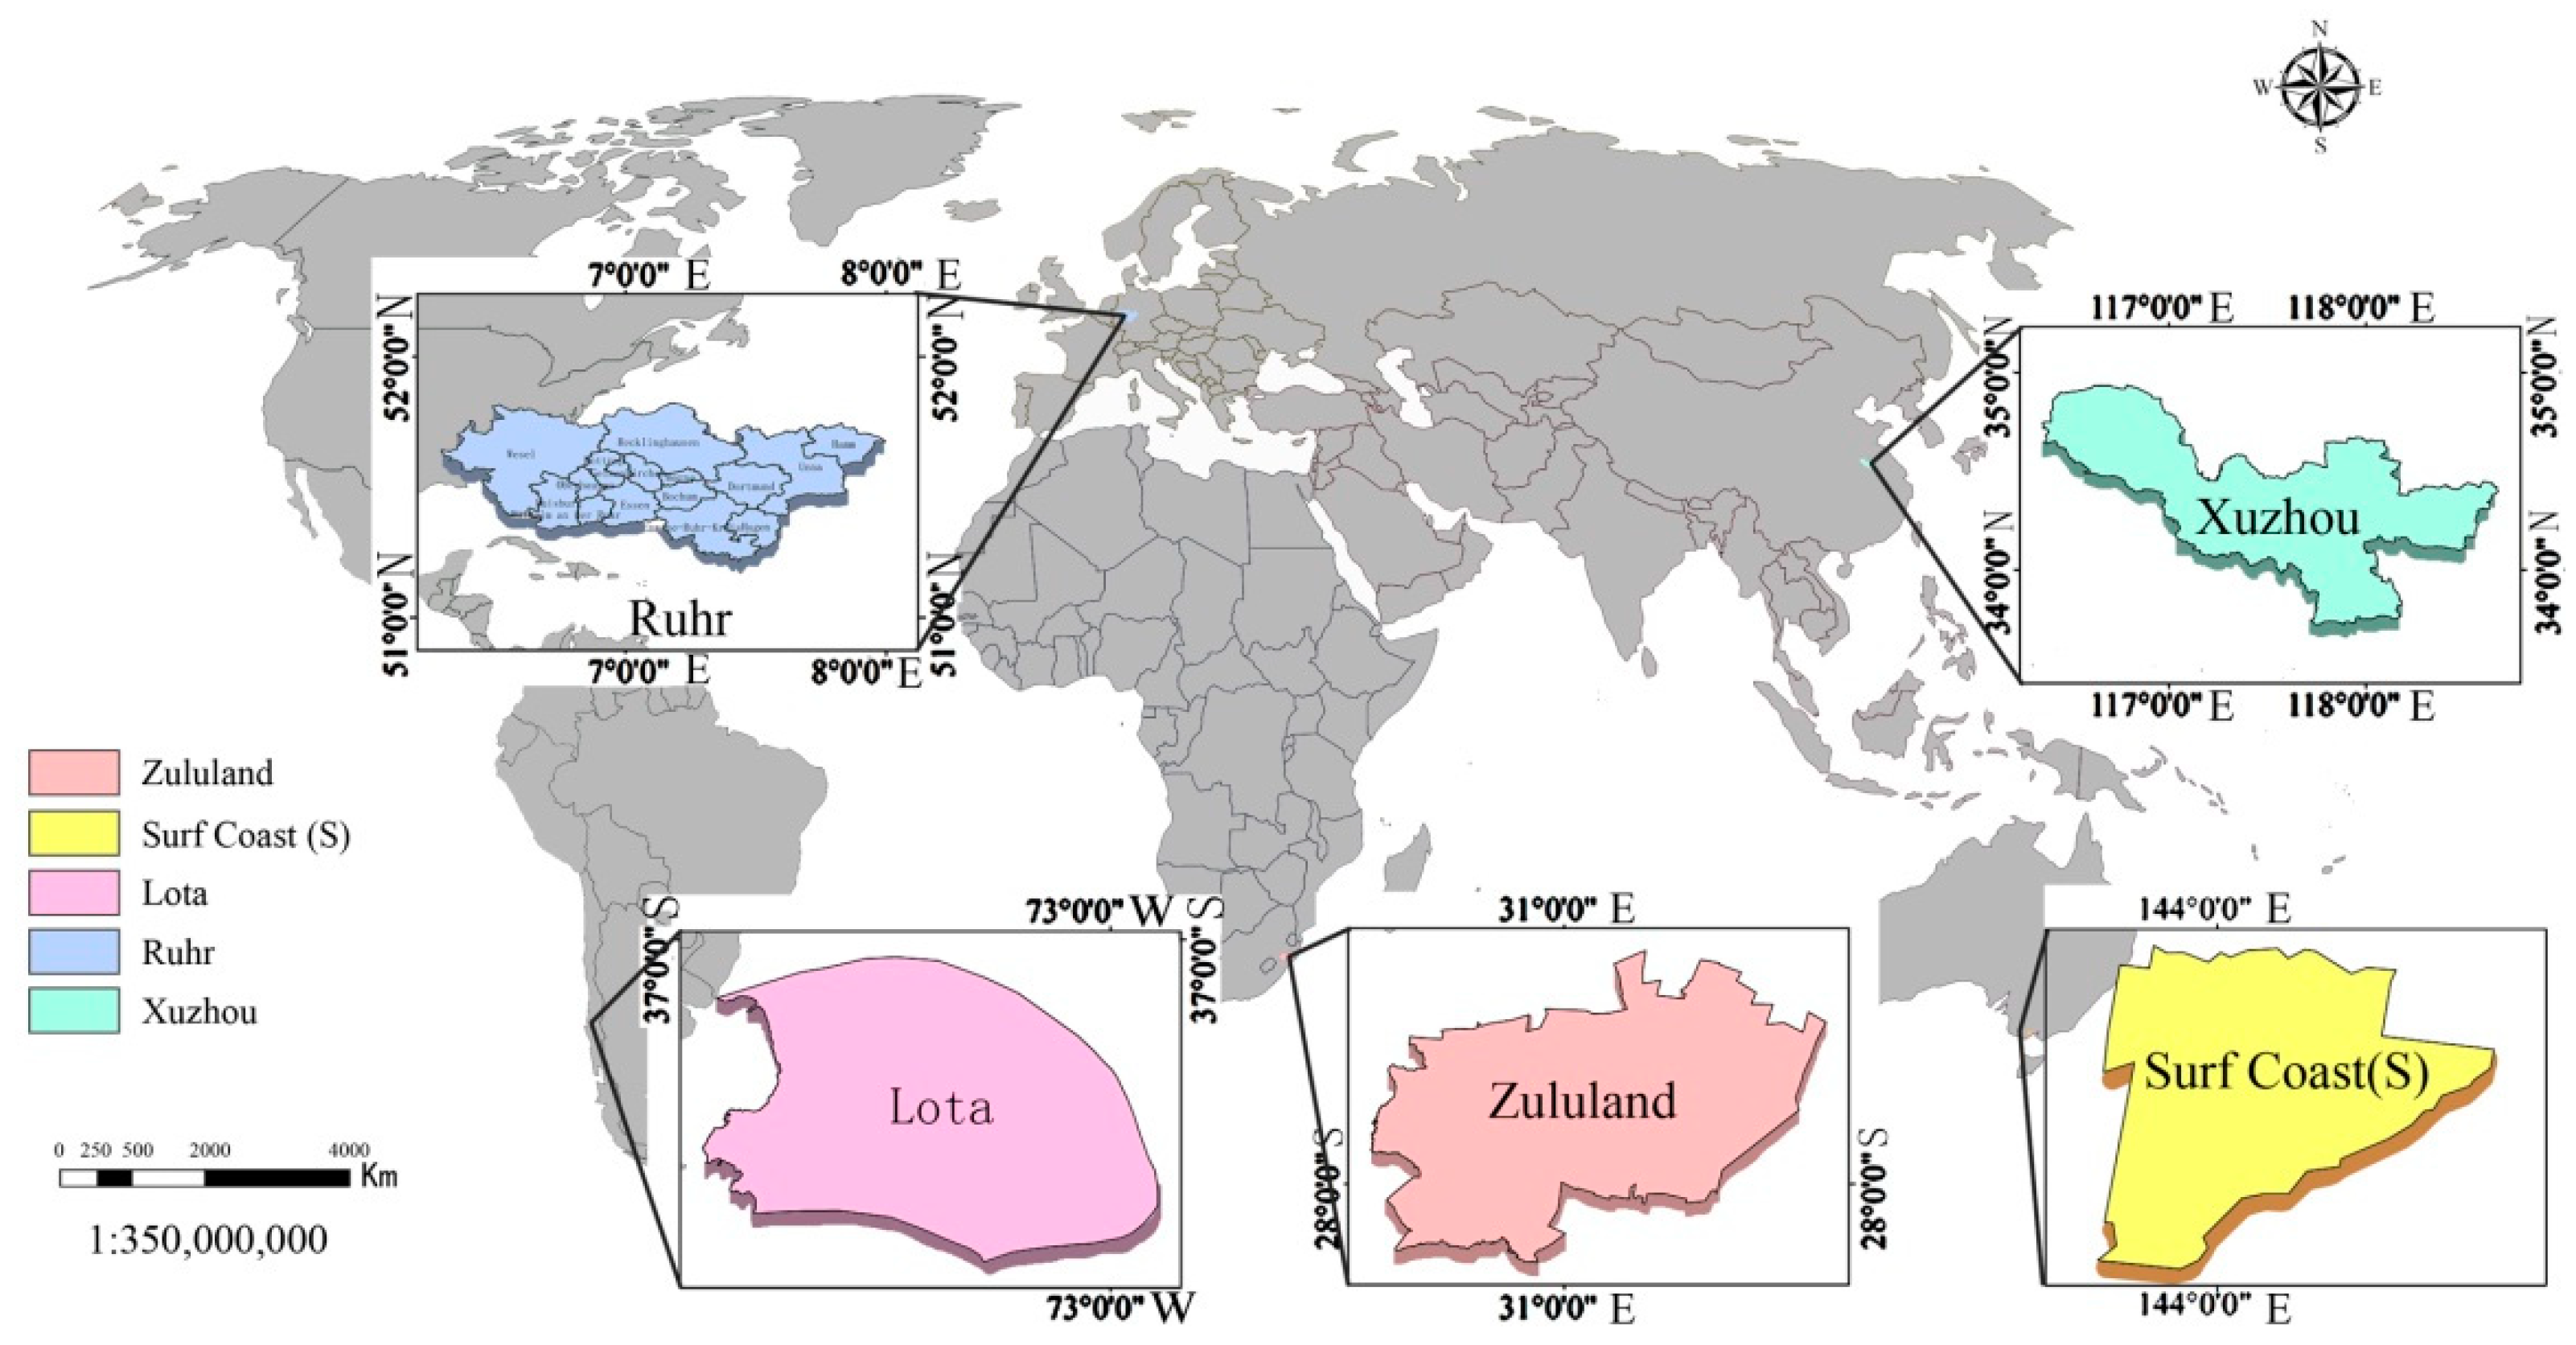
The PLES coupling indexes of the five analyzed cities have increased in the past 45 years, which means that PLES becomes closer and closer to urban development. However, the PLES coordinating indexes of most cities are about 0.4 ~ 0.8, which are in the basic and moderate coordination levels. Moreover, the coordinating indexes of living space and the other spaces are the lowest. Therefore, the scientific planning of urban living space is the most important issue to improve the level of PLES coordination development.
(4)
The specific locations with the lowest coordination were discovered for five analyzed cities. For example, the northeast (Louwsburg) of Zululand, the middle east (Tricauco) of Lota, the north (Ombersley and Gnarwarre), the southwest (Lorne) of Surf Coast, the northwest (Feng County and Pei County) of Xuzhou, and the west (Wesel) of Ruhr. Therefore, the above-mentioned regions should be paid more attention to solve the problems of PLES coordination development in the future.
According to the above analysis and conclusions, some policy implications are proposed to improve the ability of sustainable development for the resource-based urbans. At present, the rapid and disorderly expansion of urban construction land is the most important factor that damages the integration and coordination of PLES. Therefore, the active policy should be formulated to guide the transformation of the living space expansion from the jumping-type and the spreading-type, to the filling-type. This can not only ensure urban economy development but can also improve PLES integration and coordination.
In addition, although the transformation of resource-based cities has been included in the agenda, due to the lagging effect of policies, the status quo of its development cannot be changed immediately. Therefore, it is still very difficult to achieve a balance between economic development and environmental protection. The other implication for policy-making in this paper is to encourage the abandoned industrial and mining lands to be renovated into ecological lands, and pay more attention to the optimization of ecological landscape patterns during the ecological restoration.
Moreover, the targeted polies also need to be formulated for the different cities because they are facing different complications with PLES development. For example, the protection policies of grassland, rural land, and water body should be strengthened in Zululand, Xuzhou, and Surf Coast, respectively. Mining land planning and urban landscape planning should be strengthened for Lota and Ruhr. If the above policy implications are adopted, the PLES coordination level and the ability of sustainable development will be further improved for these resource-based urbans.

Author Contributions

Conceptualization, funding acquisition and writing—review & editing, Q.W.; Data curation, image processing, software and writing-original draft preparation, Y.T.; Statistical analysis and methodology, Q.W. and Y.T. All authors have read and agreed to the published version of the manuscript.

Funding

This research was supported by the Fundamental Research Funds for the Central Universities (grant number 2020CXNL08).

Institutional Review Board Statement

Not applicable.

Informed Consent Statement

Not applicable.

Data Availability Statement

Not applicable.

Acknowledgments

The authors would like to thank Yuanxin Qi, Yiyi Xie and Shan Han for their help in data collection, image processing and preliminary analysis. The authors would like to appreciate the United States Geological Survey (USGS) and Geographical Information Monitoring Cloud Platform (GIM) for the provision of relevant data and products. We would like to thank the reviewers for their valuable comments and suggestions.

Conflicts of Interest

The authors declare no conflict of interest. The funders had no role in the design of the study, in the collection, analyses, or interpretation of data; in the writing of the manuscript, or in the decision to publish the results.

References

  1. Tan, J.; Zhang, P.; Lo, K.; Li, J.; Liu, S. The urban transition performance of resource-based cities in northeast China. Sustainability 2016, 8, 1022. [Google Scholar] [CrossRef] [Green Version]
  2. Zhu, C.; Li, Y.; Zhang, L.; Wang, Y. Evaluation and diagnosis of obstacles to land-based ecological security in resource-based urban: A case study of Xingtai city. PLoS ONE 2020, 15, e0241618. [Google Scholar] [CrossRef] [PubMed]
  3. Hopkins, F.M.; Ehleringer, J.R.; Bush, S.E.; Duren, R.M.; Miller, C.E.; Lai, C.T.; Hsu, Y.K.; Carranza, V.; Randerson, J.T. Mitigation of methane emissions in cities: How new measurements and partnerships can contribute to emissions reduction strategies. Earth’s Future 2016, 4, 408–425. [Google Scholar] [CrossRef] [Green Version]
  4. Swette, B.; Lambin, E. Institutional changes drive land use transitions on rangelands: The case of grazing on public lands in the American West. Glob. Environ. Chang. 2021, 66, 102220. [Google Scholar] [CrossRef]
  5. Cao, Y.; Bai, Z.; Zhou, W.; Zhang, X. Analyses of traits and driving forces on urban land expansion in a typical coal-resource-based city in a loess area. Environ. Earth Sci. 2016, 75, 1191. [Google Scholar] [CrossRef]
  6. Tang, Q.; Wang, J.; Jing, Z. Tempo-spatial changes of ecological vulnerability in resource-based urban based on genetic projection pursuit model. Ecol. Indic. 2021, 121, 107059. [Google Scholar] [CrossRef]
  7. Swiader, M.; Lin, D.; Szewranski, S.; Kazak, J.; Iha, K.; Hoof, J.; Belcakova, I.; Altiok, S. The application of ecological footprint and biocapacity for environmental carrying capacity assessment: A new approach for European cities. Environ. Sci. Policy 2020, 105, 56–74. [Google Scholar] [CrossRef]
  8. Masoudi, M.; Centeri, C.; Jakab, G.; Nel, L.; Mojtahedi, M. GIS-based multi-criteria and multi-objective evaluation for sustainable land-use planning (case study: Qaleh Ganj county, Iran) “land use planning using MCE and Mola”. Int. J. Environ. Res. 2021. [Google Scholar] [CrossRef]
  9. Serok, N.; Levy, O.; Havlin, S.; Blumenfeld-Lieberthal, E. Unveiling the inter-relations between the urban streets network and its dynamic traffic flows: Planning implication. Environ. Plan. B Urban Anal. City Sci. 2019, 46, 1362–1376. [Google Scholar] [CrossRef]
  10. Bryan, B.A.; Gao, L.; Ye, Y.Q.; Sun, X.F.; Connor, J.D.; Crossman, N.D.; Stafford-Smith, M.; Wu, J.G.; He, C.Y.; Yu, D.Y.; et al. China’s response to a national land-system sustainability emergency. Nature 2018, 559, 193–204. [Google Scholar] [CrossRef]
  11. Mcdonald, R.I.; Kareiva, P.; Forman, R.T.T. The implications of current and future urbanization for global protected areas and biodiversity conservation. Biol. Conserv. 2008, 141, 1695–1703. [Google Scholar] [CrossRef]
  12. Wang, D.; Jiang, D.; Fu, J.; Lin, G.; Zhang, J. Comprehensive Assessment of Production–Living–Ecological Space Based on the Coupling Coordination Degree Model. Sustainability 2020, 12–2009. [Google Scholar] [CrossRef] [Green Version]
  13. Glaser, G.; Kanie, N.; Noble, I. Sustainable development goals for people and planet. Nature 2013, 495, 305–307. [Google Scholar]
  14. Deng, W.; Zhang, S.Y. Spatio-temporal pattern changes of land space in Hengduan mountains during 1990–2015. Geogr. Sci. 2018, 28, 529–542. [Google Scholar]
  15. Zhang, J.; Wang, K.; Chen, X.; Zhu, W. Combining a fuzzy matter-element model with a geographic information system in eco-environmental sensitivity and distribution of land use planning. Int. J. Environ. Res. Public Health 2011, 8, 1206–1221. [Google Scholar] [CrossRef] [PubMed]
  16. Zhang, F.; Tiyip, T.; Feng, Z.D.; Kung, H.T.; Johnson, V.C.; Ding, J.L.; Tashpolat, N.; Sawut, M.; Gui, D.W. Spatio-temporal patterns of land use/cover changes over the past 20 years in the middle reaches of the Tarim River, Xinjiang, China. Land Degrad. Dev. 2015, 26, 284–299. [Google Scholar] [CrossRef]
  17. Shi, G.; Ye, P.; Ding, L.; Quinones, A.; Li, Y.; Jiang, N. Spatio-temporal patterns of land use and cover change from 1990 to 2010: A case study of Jiangsu province, China. Int. J. Environ. Res. Public Health 2019, 16, 907. [Google Scholar] [CrossRef] [Green Version]
  18. Gao, X.; Liu, Z.; Li, C. Land use Function Transformation and ecological environment effect in Xiongan New Area based onproduction–living–ecological space. Acta Ecol. Sin. 2020, 40, 1–10. [Google Scholar]
  19. Zhang, Y.; Song, W. Identify ecological corridors and build potential ecological networks in response to recent land cover changes in Xinjiang, China. Sustainability 2020, 12, 8960. [Google Scholar] [CrossRef]
  20. Wei, S.; Pan, J.; Liu, X. Landscape ecological safety assessment and landscape pattern optimization in arid inland river basin: Take Ganzhou district as an example. Hum. Ecol. Risk Assess. Int. J. 2018, 1–25. [Google Scholar] [CrossRef]
  21. Huang, J.; Lin, H.; Qi, X. Research progress of production–living–ecological space oriented to the optimization of national space. Adv. Geogr. Sci 2017, 36, 378–391. [Google Scholar]
  22. Chen, G.; Li, X.; Liu, X.; Chen, Y.; Huang, K. Global projections of future urban land expansion under shared socioeconomic pathways. Nat. Commun. 2020, 11, 537. [Google Scholar] [CrossRef] [PubMed] [Green Version]
  23. Bastola, S.; Lee, S.; Shin, Y.; Jung, Y. An assessment of environmental impacts on the ecosystem services: Study on the Bagmati basin of Nepal. Sustainability 2020, 12, 8186. [Google Scholar] [CrossRef]
  24. Li, C.; Thinh, N.X.; Zhao, J. Spatiotemporally varying relationships between urban growth patterns and driving factors in Xuzhou city, China. Photogramm. Fernerkund. Geoinf. PFG 2014, 547–560. [Google Scholar] [CrossRef]
  25. Witt, H. Indigenous Trees and Forests: Contradictions, Conflict and Conservation in Natal and Zululand (1900–1960). Environ. Hist. 2016, 22, 319–349. [Google Scholar] [CrossRef]
  26. Li, H.; Li, L.; Chen, L.; Zhou, X.; Cui, Y.; Liu, Y. Mapping and characterizing spatiotemporal dynamics of impervious surfaces using Landsat images: A case study of Xuzhou, east China from 1995 to 2018. Sustainability 2019, 11, 1124. [Google Scholar] [CrossRef] [Green Version]
  27. Novoa, and Magdalena. Insurgency, heritage and the working class: The case of the Theatre of Union N6 of the Coal Miners of Lota, Chile. Int. J. Herit. Stud. 2017, 24, 1–20. [Google Scholar]
  28. Jopp, R.; Delacy, T.; Mair, J.; Fluker, M. Using a regional tourism adaptation framework to determine climate change adaptation options for Victoria’s Surf Coast. Asia Pac. J. Tour. Res. 2012, 8, 1–2. [Google Scholar] [CrossRef] [Green Version]
  29. Haeupler, H. Long-Term Observations of Secondary Forests Growing on Hard-Coal Mining Spoils in the Industrial Ruhr Region. of Germany, 1st ed.; Springer: New York, NY, USA, 2008; pp. 357–368. [Google Scholar]
  30. Oei, P.; Brauers, H.; Herpich, P. Lessons from Germany’s hard coal mining phase-out: Policies and transition from 1950 to 2018. Clim. Policy 2019, 20, 1–17. [Google Scholar] [CrossRef] [Green Version]
  31. Gawor, L.; Jankowski, A.; Ruman, M. Post-mining dumping grounds as geotourist attractions in the upper Silesian coal basin and the Ruhr district. Morav. Geogr. Rep. 2011, 19, 61–68. [Google Scholar]
  32. Liu, F.; Zhang, Z.; Wang, X. Forms of urban expansion of Chinese municipalities and provincial capitals, 1970s–2013. Remote Sens. 2016, 8, 930. [Google Scholar] [CrossRef] [Green Version]
  33. Shakya, A.; Biswas, M.; Pal, M. Parametric study of convolutional neural network based remote sensing image classification. Int. J. Remote Sens. 2021, 42, 2663–2685. [Google Scholar] [CrossRef]
  34. Zhang, H.; Xu, E.; Zhu, H. An ecological-living-industrial land classification system and its spatial distribution in China. Resour. Sci. 2015, 37, 1332–1338. [Google Scholar]
  35. Cui, J.; Gu, J.; Sun, J.; Luo, J. The spatial pattern and evolution characteristics of the production, living and ecological space in Hubei province. China Land Sci. 2018, 32, 67–73. [Google Scholar]
  36. Wu, Z.; Li, Z.; Zeng, H. Using remote sensing data to study the coupling relationship between urbanization and eco-environment change: A case study in the Guangdong-Hong Kong-Macao greater bay area. Sustainability 2020, 12, 7875. [Google Scholar] [CrossRef]
  37. Zhang, Z.; Li, N.; Wang, X.; Liu, F.; Yang, L. A comparative study of urban expansion in Beijing, Tianjin and Tangshan from the 1970s to 2013. Remote Sens. 2016, 8, 496. [Google Scholar] [CrossRef] [Green Version]
  38. Wang, M.; Wang, K. Exploring water landscape adaptability of urban spatial development base on coupling coordination degree model a case of Caidian district, Wuhan. Sustainability 2021, 13, 1475. [Google Scholar] [CrossRef]
  39. Li, L.; Yang, Q.; Sun, C. Coupling Coordinated Evolution and Forecast of Tourism-Urbanization-Ecological Environment: The Case Study of Chongqing, China. Math. Probl. Eng. 2021, 2021, 7271637. [Google Scholar]
  40. Lou, Y.; Yin, G.; Xin, Y. Recessive Transition Mechanism of Arable Land Use Based on the Perspective of Coupling Coordination of Input–Output: A Case Study of 31 Provinces in China. Land 2021, 10, 41. [Google Scholar] [CrossRef]
  41. Sun, X.; Yu, C.; Wang, J.; Wang, M. The intensity analysis of production living ecological land in Shandong province, china. Sustainability 2020, 12, 8286. [Google Scholar] [CrossRef]
  42. Yan, D.; Kong, K.; Ren, X.; Shi, Y.; Chiang, S. The determinants of urban sustainability in Chinese resource-based cities: A panel quantile regression approach. Sci. Total. Environ. 2019, 686, 1210–1219. [Google Scholar] [CrossRef]
  43. Lucas, R.; Tepperman, L. Minetown, Milltown, Railtown: Life in Canadian Communities of Single Industry; University of Toronto Press: Toronto, ON, Canada, 1971. [Google Scholar]
  44. O’Faircheallaigh, C. Economic base and employment structure in northern territory mining towns. In Source Communities: Settlement and Workforces Issues; CSIRO: Melbourne, Australia, 1988; pp. 41–63. [Google Scholar]
  45. Bradbury, J.; St-Martin, I. Winding down in a Quebee mining town: A case study of Schefferville. Can. Geogr. 1983, 27, 128–144. [Google Scholar] [CrossRef]
  46. Liao, X.; Li, W.; Hou, J. Application of GIS based ecological vulnerability evaluation in environmental impact assessment of master plan of coal mining area. Procedia Environ. Sci. 2013, 18, 271–276. [Google Scholar] [CrossRef] [Green Version]
  47. Huang, C.; Huang, P.; Wang, X.; Zhou, Z. Assessment and optimization of green space for urban transformation in resources-based city—A case study of Lengshuijiang city, China. Urban. For. Urban. Green. 2018, 30, 295–306. [Google Scholar] [CrossRef]
  48. Tan, M.; Zhao, H.; Li, G.; Qu, J. Assessment of potentially toxic pollutants and urban livability in a typical resource-based city, China. Environ. Sci. Pollut. Res. 2020, 27, 18640–18649. [Google Scholar] [CrossRef] [PubMed]
  49. Arrigo, L. Chinese Agriculture in the 1930s: Investigations into John Lossing Buck’s rediscovered “land utilization in China” microdata. China J. 2020, 84, 185–188. [Google Scholar] [CrossRef]
  50. Li, G.; Fang, C. Quantitative function identification and analysis of urban ecological-production-living spaces. Acta Geogr. Sin. 2016, 71, 49–65. [Google Scholar]
  51. Chen, S.; Yan, J. Environment evaluation index system for environment ecological assessment and independent innovation ability of environmental BIO industry cluster based on Copula function. J. Environ. Prot. Ecol. 2018, 19, 1037–1046. [Google Scholar]
  52. Yu, L.; Piao, Y.; Jiang, D.; Jo, H. Research about the evaluation index of agricultural sightseeing garden landscape resources based on AHP. J. Environ. Sci. Int. 2016, 25, 483–490. [Google Scholar]
  53. Zhang, H.; Jin, X.; Wang, L.; Zhou, Y.; Shu, B. Multi-agent based modeling of spatiotemporal dynamical urban growth in developing countries: Simulating future scenarios of Liangyungang city, China. Stoch. Environ. Res. Risk Assess. 2015, 29, 63–78. [Google Scholar] [CrossRef]
  54. Guo, L.; Wang, D.; Qiu, J.; Wang, L.; Liu, Y. Spatio- temporal patterns of land use change along the Bohai Rim in China during 1985-2005. J. Geogr. Sci. 2009, 19, 568–576. [Google Scholar] [CrossRef]
  55. Liu, J.; Liu, Y.; Li, Y. Classification evaluation and spatial-temporal analysis of “production-living-ecological” spaces in China. Acta Geogr. Sin. 2017, 72, 1290–1304. [Google Scholar]
  56. Christopher, B.; Suzana, D.; Roger, W. Modeling-in-the-middle: Bridging the gap between agent-based modeling and multi-objective decision-making for land use change. Int. J. Geogr. Inf. Sci. 2011, 25, 717–737. [Google Scholar]
Figure 1. The geographical location and administrative divisions of five selected resource-based urbans (Zululand in South Africa, Xuzhou in China, Lota in Chile, Surf Coast in Australia, Ruhr in Germany).
Remotesensing 13 01563 g001
Figure 2. Results of PLES functions of five cities based on remote sensing image data ((a). Zululand, (b). Xuzhou, (c). Lota, (d). Surf Coast, (e). Ruhr).
Remotesensing 13 01563 g002aRemotesensing 13 01563 g002b
Figure 3. Variation of LSI of five cities from 1975 to 2020 ((a). Zululand, (b). Xuzhou, (c). Lota, (d). Surf Coast, (e). Ruhr).
Remotesensing 13 01563 g003
Figure 4. Variation of coupling indexes (a) and coordination indexes (bf) of the five cities from 1975 to 2020.
Remotesensing 13 01563 g004
Figure 5. Spatial distribution of the coordination degree of LE space of Zululand (a), Lota (c), Surf Coast (d), and the coordination degree of PL of Xuzhou (b) and Ruhr (e) in 2020.
Remotesensing 13 01563 g005
Table 1. Study data sources and contents.
Data TypeContentTimeSource
Remote sensing image dataLandsat 30 × 30 and 60 × 60 m remote sensing image1975–2020USGS official website, Geospatial Data Cloud
Administrative boundary dataVector files of administrative division2018Geographical Information Monitoring Cloud (GIM Cloud)
Socioeconomic statisticsPopulation, industrial economy, natural resources1975–2020Literatures and statistical yearbooks
Table 2. Marking criteria for PLES function evaluation for the different land types.
No.Land TypeProductionLivingEcological
1Waters005
2Construction land350
3Woodland105
4Grass105
5Arable land503
6Industrial and mining land510
7Rural residential land350
Table 3. Variation of PPF and PDF of five cities from 1975 to 2020. Unit: Percentage.
CityEcological FunctionProduction FunctionLiving Function
PPFPDFPPFPDFPPFPDF
Zululand−5.17−3.643.832.631.351.01
Xuzhou−11.24−11.79−13.94−2.2625.1714.06
Lota6.452.28−10.10−5.703.713.43
Surf Coast1.280.94−2.23−3.803.512.87
Ruhr7.633.71−9.5−6.781.871.72
Table 4. Variation of LPI of five cities from 1975 to 2020. Unit: Percentage.
CityZululandXuzhouLotaSurf CoastRuhr
Ecological space−16.731.0515.232.61−5.89
Production space18.67−20.21−3.33−11.41−3.47
Living space0.292.083.320.6211.41
Publisher’s Note: MDPI stays neutral with regard to jurisdictional claims in published maps and institutional affiliations.

