
Monitoring the Reduced Resilience of Forests in Southwest China Using Long-Term Remote Sensing Data


1
Chongqing Jinfo Mountain Karst Ecosystem National Observation and Research Station, School of Geographical Sciences, Southwest University, Chongqing 400715, China
2
Chongqing Engineering Research Center for Remote Sensing Big Data Application, School of Geographical Sciences, Southwest University, Chongqing 400715, China
3
State Key Laboratory of Earth Surface Processes and Resources Ecology, Faculty of Geographical Science, Beijing Normal University, Beijing 100875, China
*
Author to whom correspondence should be addressed.
Remote Sens. 2022, 14(1), 32; https://doi.org/10.3390/rs14010032
Submission received: 8 November 2021
/
Revised: 14 December 2021
/
Accepted: 20 December 2021
/
Published: 22 December 2021
(This article belongs to the Special Issue The Impact of Extreme Climatic and Disturbance Events on Vegetation Using Remote Sensing)
Abstract
:An increase in the frequency and severity of droughts associated with global warming has resulted in deleterious impacts on forest productivity in Southwest China. Despite attempts to explore the response of vegetation to drought, less is known about forest’s resilience in response to drought in Southwest China. Here, the reduced resilience of the forest was found based on remotely sensed optical and microwave vegetation products. The spatial distribution and temporal variation of resilience-reduced forest were assessed using the standardized precipitation evapotranspiration index (SPEI) and vegetation optical depth (VOD). Our findings showed that 40–50% of the forest appeared to have abnormally low resilience approximately 6 months after the severe drought. The spatial distributions of abnormally low resilience had a good agreement with the regions affected by the 2009–2011 drought events. In particular, our results indicated that areas of afforestation were more susceptible to drought than natural forest, maybe due to the different water uptake strategy of the diverse root systems. Our findings highlight the vulnerability of afforestation areas to climate change, and recommend giving more attention to soil water availability.
1. Introduction
Southwest China is a crucial region in the subtropics. This hotspot is home to more than 30 percent of China’s higher plants, which support the delivery of ecosystem services of high economic value. However, the hotspot has experienced intensive land-use changes, and is now one of the most variable areas of managed forest all over the world [1]. The agricultural area on marginal sloping lands have been partly converted to afforestation and reforestation areas, to expand the forest areas in China’s ecological restoration projects [2]. These projects managed to improve the forest coverage, and reshaped ecosystems in Southwest China; however, they may also contribute to the significant decline in soil moisture in this region [1]. The forestation-induced decrease in soil moisture, in turn, restricts plant growth—especially for trees in afforestation areas.
The increased frequency and severity of droughts associated with global warming, combined with poor environmental conditions, especially over karst regions where rainfall quickly infiltrates the subsurface of the ground through sinkholes, influence the forest productivity and the ecosystem services [3,4]. Quantifying and understanding the resilience of forests to climate change is of major interest in this area [3,4,5,6], where vegetation has experienced greening, and enhanced drought events. The resilience (recovery rate) of the forest is commonly reduced near the transition point, which has been introduced by climate perturbations [7]. The transition point refers to a rapid transition from forest state to non-forest state. This reduced resilience can reduce the stability of the current forested state, and the forest ecosystem could easily shift into a contrasting state which refers to ‘critical slowing down’ [8]. However, the rate at which the forest ecosystem might move into a degraded dynamic regime is variable, due to various tree species conferring different levels of resistance to drought. Therefore, critical reduced-resilience detection largely depends on whether the regime shift could be catastrophic, and is therefore approached gradually [9]. Consequently, neighboring points in forest timeline can be similar to each other, and have a high temporal autocorrelation. This concept was used to evaluate the spatio-temporal pattern of forest’s reduced resilience [10], and predict tree mortality by tracking the temporal variation of forest resilience [7]. The current approach to quantifying forest’s resilience to drought, on both a regional and global scale, mainly uses remote sensing imagery, which can provide spatio-temporal information on ground–forest primary productivity. The temporal autocorrelation in satellite data-based vegetation indices has been analyzed over tropical forest to detect the rate of spatial patterns [10]. Long-term data are required to infer the critical slowness over time in the broader range of systems.
In Southwest China, due to Chinese ecological engineering projects, greening and biomass increases have been monitored in conservation areas located in most karst regions [1,2]. Large afforestation and reforestation projects in these tropical regions can gradually improve the forest coverage, and result in an intensively managed forest [11]. This increased forest cover can also introduce an adverse impact on the ecosystem, due to the consequent decreased soil-moisture content [1]. This could potentially result in a deficit of available soil water, constraining plant growth—especially for the afforested trees of the widely distributed karst regions in Southwest China. Moreover, vegetation growth restrictions have been observed over large areas of Southwest China caused by droughts [5], thus leading to a reduction in carbon uptake. This is partly due to the limited resilience of the managed forest, and the low water-hold capacity of the thin soil layer. Therefore, detecting the reduced resilience of the forest is beneficial in understanding the forest ecosystem change; it can be used to better manage afforestation areas in abominable environment conditions, with thin soil layers and low water-retention capacities.
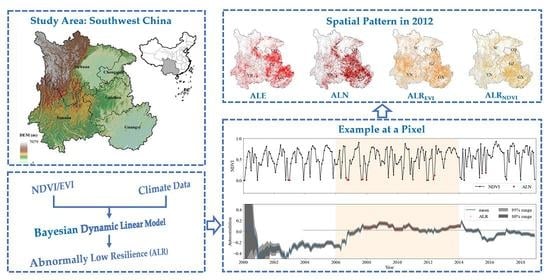
In this study, forest resilience is defined as a recovery rate from a disturbed state, which is dominated by forest physiological functions under drought. When resilience is reduced approaching the transition point, abnormally low resilience (ALR) is defined to macroscopically explore and measure the impaired physiological functions of the forest, and compare the magnitude of afforestation forest resilience with natural forest resilience under drought. The ALR of forest in Southwest China was detected according to the abnormally high lag-1 autocorrelation in forest variations over a long period of time. The normalized difference vegetation index (NDVI), as a proxy of coverage and biomass to vegetation, and the enhanced vegetation index (EVI) as a proxy of greenness and productivity to vegetation, were used to detect the ALR induced by the drought. The fraction of areas with ALR and abnormally low vegetation indices were counted, and their dynamics were then evaluated along with the computed drought index, and compared with the estimated changes of the vegetation optical depth (VOD) during the drought. Furthermore, this study also assessed the consistency of the spatial patterns of the low resilience in forested areas, and the drought severity distributions.
2. Methods and Materials
2.1. Study Region
The study region, Southwest China, includes five provinces (Chongqing, Sichuan, Guizhou, Yunnan and Guangxi) spanning from 97° E to 113° E, and from 21° N to 35° N (Figure 1). In this region, the climate is mainly controlled by the subtropical monsoon climate zone, which is characterized by cold–dry winters, and warm–wet summers. The annual mean precipitation is unevenly distributed in the seasons, with most falling in summer and autumn, and varying in total from 1000 to 1300 mm [3]. This region has already become the largest terrestrial carbon sink of China in the past 30 years, owing to its rich forest with strong carbon sequestration ability [12]. The forest in this region includes both natural forest and afforestation forest. Afforestation forest has increased in the past years due to ecological afforestation and reforestation projects, such as returning farmland to the forest, implemented to combat desertification and soil erosion and fundamentally improve the ecological environment in Southwest China. However, the forest is easily affected by high frequency drought disturbance in this region, especially due to its extensive karst landscape, which makes it difficult to hold water in the soil [13].
2.2. Dataset
2.2.1. Satellite-Derived Data
Two satellite-derived vegetation indices, including NDVI and EVI, were used for detecting the abnormally low resilience of the forest. The two gridded indices were both from the Moderate Resolution Imaging Spectrometer (MODIS) product (MODIS13A3, V006 version) (https://lpdaac.usgs.gov/products/mod13a3v006/, accessed date: 18 February 2021). The MODIS datasets are monthly data at a spatial resolution of 1 km, from 2000 to 2018. The first month of the MODIS monthly data was the February 2000. We synthesized the data of January 2000 to ensure continuity, by averaging all the data of Januarys from 2001 to 2018. VOD derived from passive microwave remote sensing observations was used for comparative analysis with the abnormally low resilience of the forest. This is a dimensionless quantity, ranging from 0 to 3, and had the capacity to characterize vegetation water content and aboveground biomass [14]. The daily VOD data with a spatial resolution of 0.25° were derived from the Advanced Microwave Scanning Radiometer for Earth Observing System (AMSR-E) onboard the Aqua satellite, using the Land Parameter Retrieval Model (LPRM) algorithm (https://hydro1.gesdisc.eosdis.nasa.gov/data/, accessed date: 10 May 2021) [15]. VOD data has been released since 2002. There is a gap from October 2011 to July 2012, between a failure in the AMSR-E sensor and the launch of AMSR-2. VOD from the AMSR-E sensor and AMSR-2 is defective, due to an incomplete matching of accuracy and scale. In order to ensure the coherence and consistency of data, the datasets in this study were selected from June 2002 to September 2011. The daily datasets were averaged into monthly products, aiming to match the temporal resolution with vegetation indices. Besides, the statistics of the monthly anomalies can reflect directly variations of VOD associated with extreme climate events.
2.2.2. Climate Data
The meteorological data selected in our study included monthly and daily air temperature, precipitation, and downward shortwave radiation from 2000 to 2018. These data were gridded reanalysis datasets, at a spatial resolution of 0.1° developed by the Hydrometeorological Research Group in the Institute of Tibetan Plateau Research, Chinese Academy of Sciences [16,17], and were obtained from the China Meteorological Forcing Dataset (CFMD) (http://data.tpdc.ac.cn/, accessed date: 12 January 2021). Here, these meteorological data, including air temperature, precipitation and downward shortwave radiation, were resampled by the bilinear interpolation method to 1 km, for achieving consistent spatial resolution with MODIS vegetation indices. Besides, the multiple-year daily average values of these meteorological data from 2000 to 2018, along with the monthly climate data and vegetation indices, were used as inputs of the Bayesian dynamic linear model to detect the reduced resilience of the forest. Meanwhile, the monthly temperature and precipitation were used for calculating the standardized precipitation evapotranspiration index (SPEI), which were used to identify the drought events in Southwest China.
2.2.3. Drought Metrics
The monthly SPEI in this research, with 1 km spatial resolution, was calculated to determine the spatio-temporal extent and severity of the drought events. These gridded SPEI datasets are standardized variables, relative to the long-term climatic balance. They are developed based on the difference between precipitation and potential evapotranspiration [18,19]. Therefore, SPEI is an ideal measurement of drought by the impact of precipitation and temperature. SPEI could represent the cumulative water status in the past 1–48 months, and it is suitable for characterizing diverse types of drought events [20]. In this study, the SPEI rates over the preceding 3 months (abbreviated as SPEI3) were used to identify drought events during the study period; they have been proven to consistently capture short-term changes in soil moisture conditions [6,21].
2.2.4. Forest Types Map
In this study, natural forest and afforestation were obtained from the dataset of Hansen Global Forest Change V1.8 (https://earthenginepartners.appspot.com/science-2013-global-forest, accessed date: 28 November 2021) [22]. Natural forest was extracted from the tree cover in 2000 with a threshold of a 20% canopy closure for all vegetation taller than 5 m in height. The afforestation was defined as aggregated gain from 2000 to 2012. The forest distributions, at a spatial resolution of 1 km, were extracted from China land use and land cover change database (CNLUCC, https://www.resdc.cn/, accessed date: 20 June 2021) to take into consideration the land cover changes during the study period. All the spatial and temporal resolutions and source information of the datasets used in this study are listed in Table 1. The bilinear interpolation was used to resample the spatial resolution of all other data to be consistent with MODIS products.
2.3. Methods
2.3.1. Bayesian Dynamic Linear Model
The Bayesian dynamic linear model (BDLM) in this study was used to track the high autocorrelation that represents the ALR of forests. Under ideal conditions, the forest will experience normal growth, development and decline during one entire year, showing seasonal fluctuations. However, when subjected to extreme weather events such as drought, the forest will suffer abnormally slow growth, decline or even death. When resilience is reduced as approaching the transition point, one indicator of ALR is the critical slowing down (another indicator is the basin of attraction shrinks) under drought [23]. This critical slowing down is characterized by a high autocorrelation; this means the state at the next observation being highly similar that of the previous moment. Autocorrelation is regarded as the simplest way to measure the critical slowing down, because the rise in autocorrelation at lag-1 means that the state of the forest ecosystem becomes increasingly alike in successive observations [24]. Similar to existing research [25,26], the Kalman filter is used by BDLM to estimate time-variant autocorrelation. Then, ALR serves as a macroscopic measure of the impaired physiological functions of the ecosystem due to extreme drought stress. This model has been successfully used to predict the reduced resilience leading to forest mortality in California [7]. BDLM is composed of two equations, as follows [7]:
where as the observed variable represents the NDVI/EVI anomaly (the observed subtracting the long-term mean) from 2000 to 2018 for each pixel at a time, . is a p-dimensional array of regressors array or initial constants at the time, and includes the lag-1 NDVI/EVI and climate variables which calculate the anomaly within 1-month intervals to remove seasonality. as a p-dimensional state array contains the coefficients which represent the influence of sensitivity to climatic conditions, seasonality, local mean and trend on the observable at the time, and the observed variable at the last step (). as the observation noise follows a Gaussian distribution with zero mean; as a known p × p state evolution matrix, is 1 or 2 harmonic components with 1 year or half year adopted in this study, and is defined to be unchanging. as the state evolution noise follows a multivariate Gaussian distribution with mean zero at time, and is separate from . Using forward filtering at each time, [27,28], by associating the prior information (, , …, ), the posterior distribution of was estimated. It was likely from currently observed variable of to lead to a time-variant posterior distribution of . It is worth noting that the temporal variation of the item in quantifies the correlations between and . The item in corresponding to is the autocorrelation which is defined as a time-variant measurement of resilience (further details of this model can be obtained from [7]). When the forest ecosystem is near the transition point, it could turn to critical slowing down as an indicator of ALR. The ALR can be characterized by a high autocorrelation, which means that the state at the next observation is highly like the one at the previous moment. In this study, using the corresponding climate data and BDLM, the time-variant autocorrelation of NDVI/EVI was estimated at each pixel in all forested areas of Southwest China. A probability distribution of autocorrelation was acquired from the BDLM for each time interval from 2000 to 2018.
There is an example application of the BDLM using NDVI data at a pixel in Southwest China (Figure 2). This pixel is at the location (105.293° E, 28.433° N) and observed 67% tree coverage in 2000. ALR, showing the high autocorrelation of the NDVI time series, had been detected for a long period of time during the droughts (Figure 2b). The ALR was identified in the case of the mean autocorrelation (blue line) exceeding the threshold (grey dashed line), exceeding zero, and lasting for at least for 3 months. The threshold was calculated as the long-term average value of the upper bound (the 80th percentile) of the indetermination range (not including a four-year prewarming period) and was unchanging, providing a measurement for establishing the ALR anomaly range. Abnormally low NDVI (ALN) (and the same for abnormally low EVI (ALE)) was defined as the circumstance of NDVI/EVI values being below the threshold, and lasting for at least the next 3 months. The threshold is calculated as the value lower than 20% of all observed NDVI for each pixel. The sensitivity analysis with different thresholds suggests that the selected thresholds here are reliable [7]. ALN that may represent the drop in greenness was detected in 2006, 2012 and 2014 (graphed as red dots in Figure 2b) when the monthly precipitation was lower than that of the previous year (Figure 2a). ALR was detected more than ALN between 2008 and 2014 (graphed as red triangles in Figure 2c). For instance, before ALN was detected in March 2014, ALR was detected much earlier in May 2013, lasting for about 6 months. Moreover, ALR, as a typical feature of the critical slowing down of the forest ecosystem, was detected at multiple points during the period of frequent droughts from 2008 to 2013.
Theoretically, high autocorrelation could not necessarily assure a critical upcoming transition and the emergence of slowing down [29], which means that it is necessary, but not sufficient. However, to further inspect the typicality of ALR for the critical slowing down of the forest ecosystem, a separate analysis within the forest dynamics with two stable states, representing an existing forest cover and a non-forest cover state, was conducted [7,24]. The analysis showed that the basin of attraction shriveled, and the forest ecosystem slowed down during the period when an ALR was identified. The two shifts represent the reduced resilience of the forest, and indicate a higher possibility of a transition to a no-forest cover state under random perturbations. This analysis additionally supports the use of BDLM to detect the reduced resilience of forest ecosystems. This means that ALR could be identified due to climate stress, by tracking the high autocorrelation of vegetation indices.
The BDLM was used for each NDVI and EVI pixel in Southwest China to detect ALR. The detected ALRNDVI or ALREVI were compared with ALN or ALE in spatio-temporal variations since July 2004. ALN and ALE may be associated with forest slowing growth, decline, or even death [30,31], and have the same spatio-temporal resolutions as ALR. A comparison of the ALR, ALN and ALE were also performed with VOD in temporal variations, because VOD can characterize aboveground biomass and vegetation water content.
2.3.2. Identification of the Drought Event
A monthly (the time scale of the SPEI is 3 months) was adopted in this research to capture the characteristics of drought events, including their severity and the spatio-temporal extent, from 2000 to 2018. Furthermore, the standardized anomaly of () was computed to characterize the deviation from the multi-year average of during the whole period [5]. For each pixel, the was computed as follows:
where is the value, is the mean value and is the standard deviation of at the th pixel for the th month from 2000 to 2018. Note that is a dimensionless value, and it is characterized as a drought with below the threshold of −0.5 [5].
A flow chart of the data processing and results generation can be seen in Figure 3.
3. Results
3.1. Fraction of the Area Showing the ALR Dynamics
Abnormally low resilience and abnormally low vegetation indices of the forest can indicate a drop in the vitality and greenness of the forest. The fraction of forest areas with abnormally low resilience and abnormally low vegetation index values were counted in Southwest China. The forest appeared to have a large proportion of abnormally low resilience areas, including abnormally low values about 6 months after two extreme drought events (the 2009/2010 winter–spring drought, and the 2011 summer–autumn drought) (Figure 4). This hysteresis may be that the forest has a certain resistance to drought, and can still maintain a short period of growth and greenness. For the forest area in Southwest China, the fraction of the area showing the abnormally low resilience and abnormally low values of EVI and NDVI exhibited little increases in May 2010 (Figure 4b,c). More obviously, the fraction of the area with detected ALREVI and ALE rapidly increased to above 30%, and above 20%, respectively, in March 2012 (Figure 4b). The fractions of ALRNDVI and ALN areas showed similar temporal variations, which increased to a high value of around 30% and 20%, respectively, in March 2012 (Figure 4c). During this period, the SPEI captured two major extreme droughts, including the 2009/2010 winter–spring drought and the 2011 summer–autumn drought, with below-average 36% and 31% precipitation, respectively (Figure 4a, SA of SPEI < −0.5). Notably, the average SPEI values during these two drought events dropped to less than −1.0 over the whole forest area. However, 6 months after the droughts, the forest showed a wide distribution of low resilience and abnormally low vegetation values, indicating that the impact of the drought events on forest growth and development had a lag effect. As for the gradual increase in ALRNDVI area before the severe 2009/2010 winter–spring drought, this may have been caused by the frequent occurrence of less-severe droughts in Southwest China during 2008 to 2009. Moreover, the computed ALREVI or ALRNDVI area proportions were generally higher than the ALE or ALN areas, indicating that abnormally low resilience was more sensitive than abnormally low vegetation indices values. The areas exhibiting ALRNDVI or ALN followed similar temporal trajectories to ALREVI or ALE during the drought events frequently occurring from 2009 to 2013 in Southwest China. Such obvious temporal correspondence highlights the possibility of using abnormally low resilience and abnormally low vegetation indices to detect temporal variations in forest slowness recovery stressed by drought events. One thing to note is that EVI could be more sensitive than NDVI in reflecting forest growth information, but the above results do not reflect this characteristic, perhaps because of the monthly vegetation indices with coarse time resolution.
Furthermore, temporal comparative analysis was used for low resilience, low vegetation index values, and the anomaly changes of VOD representing vegetation water content and aboveground biomass. The fraction of the areas showing ALE, ALN, ALREVI and ALRNDVI exhibited small increases in May 2010; at the same time, the VOD anomaly showed a negative value, meaning the aboveground biomass and vegetation water content were in a declining state (Figure 4d). Such a match indicates that ALR, in combination with the abnormally low vegetation index values, can detect the abnormally low recovery rate, and macroscopically explore and measure the impaired physiological functions of a forest after drought.
3.2. Spatial Patterns of the ALR Variations
The previous statistics can only exhibit inter-annual dynamics, but not the spatial consistency among drought, ALE, ALN, ALREVI and ALRNDVI. Therefore, we also evaluated the spatial patterns of ALE, ALN, ALREVI and ALRNDVI along with the drought severity distributions. The 2009/2010 drought event (SPEI < −0.5) hit most of the Southwest China area; it was especially severe in eastern Yunnan, nearly the entirety of Guizhou, southern Sichuan and western Guangxi (Figure 5f,g). About 6 months later (as seen from Figure 4), the forest showed widely distributed ALE, ALN, ALREVI and ALRNDVI areas in southern Sichuan, most of Yunnan and eastern Guangxi, as well as scattered areas in Guizhou and Chongqing in 2010 (Figure 5a–d). ALE, ALN, ALREVI and ALRNDVI can be captured in most areas where drought occurred; however, severe drought occurred in western Guizhou and ALE and ALN hardly appear in this area (Figure 5a,b). This may be due to the forest in this region being more drought-resistant, and having deeper and stronger roots that can easily draw water from deeper soil layers [32]. Notably, a large area of ALE signal appeared in northeastern Guangxi (Figure 5a), where the drought was not particularly serious. The reason for this phenomenon may be the large-scale planted forest and harvest that occurred in Guangxi province in 2010 [1].
The 2011 drought event also attacked Southwest China severely, with the borders of Yunnan, Guizhou, Sichuan and Chongqing being particularly affected in the summer and autumn (Figure 6f,g). Most areas of Guangxi, especially northeastern Guangxi, suffered the drought event from spring to autumn (Figure 6e–g). Around 6 months later, ALE and ALN followed a similar spatial distribution with the 2011 drought, which was mainly concentrated on Guangxi, the junction of Yunnan, Guizhou, Sichuan and Chongqing, and the Hengduan Mountains in central Sichuan (Figure 6a,b). There are existing karst landforms in Central and North Sichuan (Figure 1), which make it difficult to contain water in the soil [33]. Even if the SPEI3 of Central and North Sichuan were not very low, the forest here was still facing abnormally slow growth, decline, and even death, due to the poor water retention of the karst landforms. ALREVI and ALRNDVI were mostly detected in Guangxi and the Hengduan Mountains in central Sichuan (Figure 6c,d). They were relatively sparsely distributed in Yunnan, Guizhou and Chongqing, perhaps because of the stronger drought resistance of the forest. The signals of ALE, ALN, ALREVI and ALRNDVI, whether calculated by NDVI or EVI, can be captured in areas affected by the 2011 drought. Overall, the spatial patterns of these three indicators have impressive spatial consistency, whether in 2012 or in 2010.
3.3. Vulnerability of Natural Forest and Afforestation Forest
The above results show that abnormally low resilience and abnormally low vegetation indices in Southwest China appeared in large areas of the forest, approximately 6 months after the drought. Furthermore, we found that the response to drought was different from the natural forest and afforestation areas through classification statistics. Afforestation-type land, associated with an area rapidly varied from non-forest to forest, has increased by about 3.4% (about 7820 km2) in past years, due to the implementation of the ecological afforestation and reforestation projects [1,2]. The results showed that most of the recovering forest and afforestation areas were in Southwest China: about 77.8% existed in Guangxi from 2000 to 2012. For entire forest area in Guangxi, it is worth noting that the afforestation area accounted for about 3.5% and natural forest accounted for about 96.5% in 2012, as counted from Hansen Global Forest Change V1.8. The forest areas with ALE, ALN, ALREVI and ALRNDVI were counted separately. It was shown that the proportion of increased afforestation areas with ALE, ALN, ALREVI and ALRNDVI were larger than those of natural forest in 2012 (Figure 7c). ALREVI and ALE of afforestation calculated by EVI accounted for about 55.0% and about 55.8%, respectively, whereas natural forest accounted for 50.7%, and 50.3 %. Furthermore, it also showed similar results when computed by NDVI data: ALRNDVI and ALN of afforestation accounted for about 56.0% and about 67.1%, respectively, whereas natural forest accounted for 49.6% and 64.7 %. Moreover, the spatial distribution of afforestation, natural forest and ALE—which were different from afforestation and natural forest in Guangxi—are shown in Figure 7a. ALE of natural forest mainly appeared in northeastern Guangxi (Figure 7a), where a severe drought occurred during summer and autumn in 2011 (Figure 6f,g). However, afforestation appeared as widely distributed ALE, which was concentrated on central Guangxi (Figure 7a), even though they only experienced slight drought during summer and autumn in 2011 (Figure 6f,g).
4. Discussion
Our results suggest that the forest’s response to drought is different for natural forest and afforestation areas. This phenomenon is probably due to the different uptake strategies of trees with diverse root depths disturbed by drought events [34,35]. Existing research has shown that inferred water uptake depth is unrelated to seasonal leaf phenology patterns (evergreen or deciduous) [36], and mean species height [37,38]. However, the mean trunk basal diameter has the ability to provide a simple alternative measurement of deductive water uptake depth across species [36], according to the size and depth of the roots, which usually increase with the plant’s above-ground size [39]. In order to draw bedrock water or groundwater, the roots need to penetrate the karst vadose zone in Southwest China. This is generally an extremely slow course, which happens when the roots penetrate the cracks in the weathered bedrock, or produce cracks on their own through root bioengineering. The capability of roots to penetrate into bedrock is likely to increase with plant size and age [40,41]. Therefore, the afforestation areas containing younger trees with smaller trunk diameters likely have shallower root systems, at a depth of about 0–50 cm, whereas the natural forest containing older trees with larger trunk diameters, have deeper root systems at a depth of about 50–100 cm [42]. Shallow-root species with negative water potential and shallower water-uptake strategies will face severe canopy defoliation, or even death, when drought causes a shallow-soil water shortage. In contrast, tree species with deep roots have a different water extraction strategy to resist drought conditions. Trees extracts water mainly from shallow soils in the early stages of drought. As the drought continues and worsens, trees will turn to draw from deep-water sources such as bedrock water or groundwater. This deeper water uptake strategy ensures that they could survive with lower canopy defoliation in drought conditions [43,44]. Accordingly, the afforestation areas with shallower roots suffer severe canopy defoliation, or even death, with the widely distributed ALE; this was seen in the slight drought during summer and autumn in 2011, while the natural forest appeared to have relatively less distributed ALE under severer drought conditions. These findings indicate that the afforestation areas were more susceptible to drought than the natural forest, and this different water uptake strategy can partially explain the incomplete spatial consistency of the low resilience, low vegetation index values of the forest in drought.
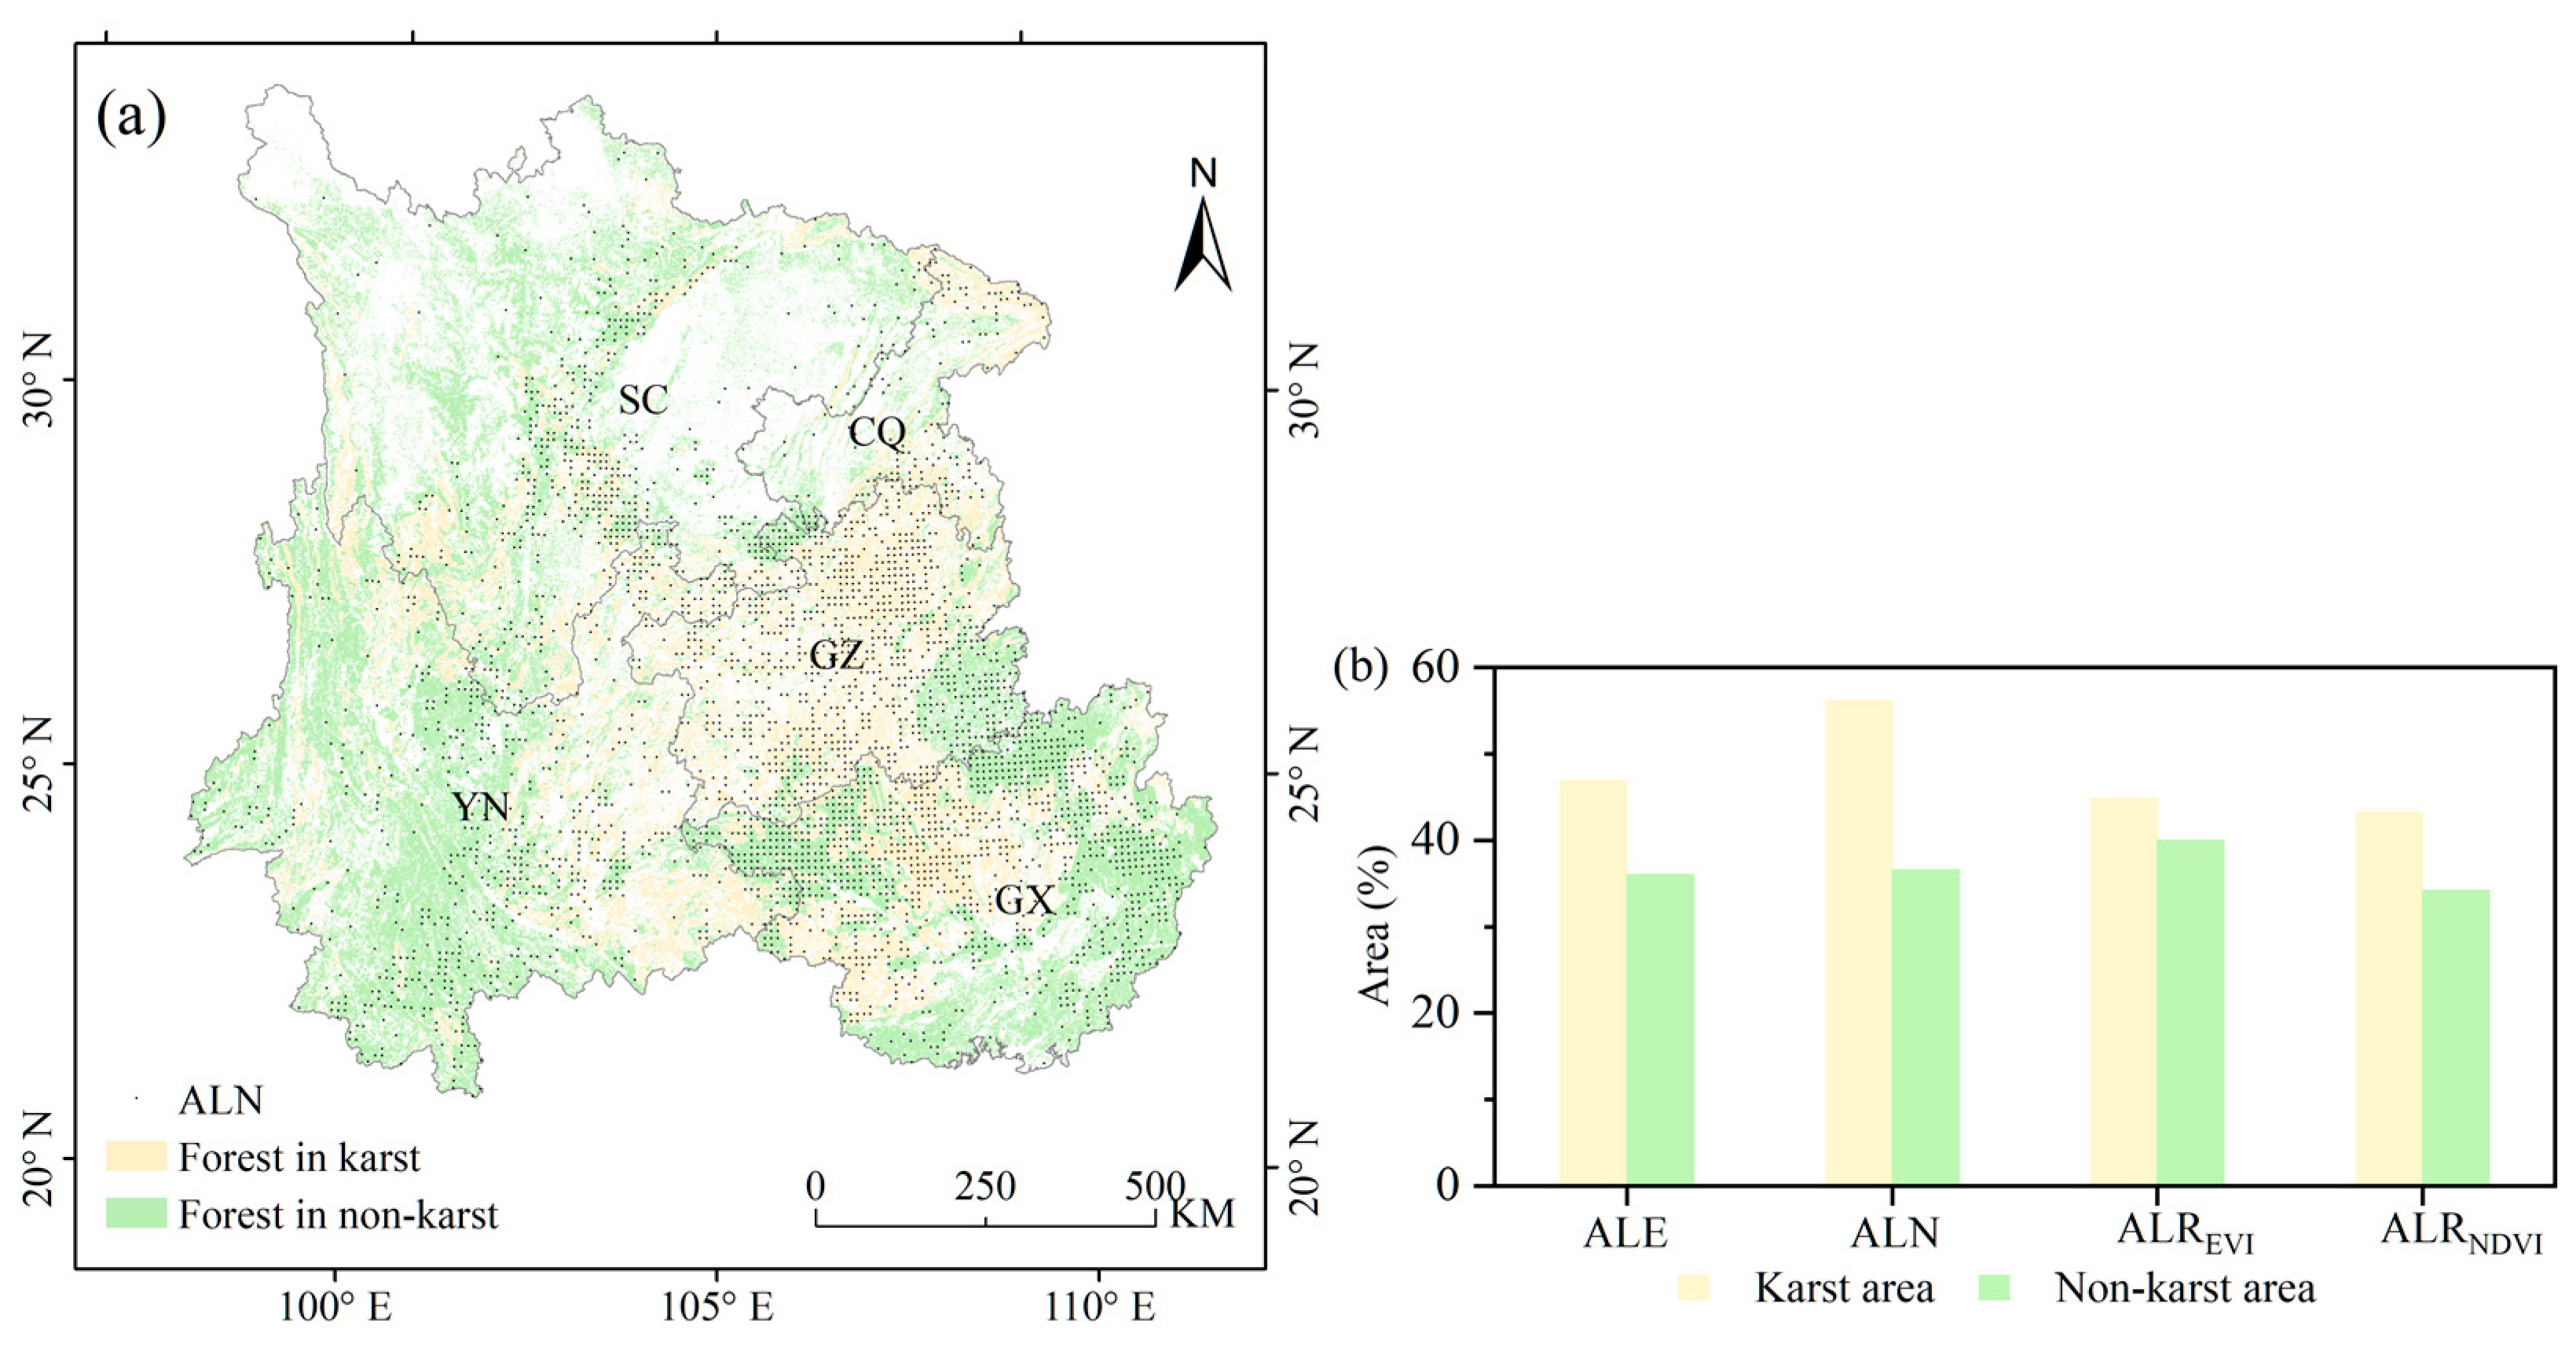
Moreover, the response to drought is different from ALE, ALN, ALREVI and ALRNDVI in karst and non-karst areas through classification statistics. The karst landforms are mainly distributed in Guizhou, eastern Yunnan, western Guangxi, central Sichuan and eastern Chongqing (Figure 8a). The abnormally low development of forest indicated by ALE, ALN, ALREVI and ALRNDV were detected over the karst landform areas in 2012 (Figure 6a–d). The forest areas which appeared as signals of ALE, ALN, ALREVI and ALRNDVI were counted separately. The results showed that the proportion of karst areas with ALE, ALN, ALREVI and ALRNDVI was larger than that of non-karst areas in 2012 (Figure 8b). The ALREVI and ALE of karst areas calculated by EVI accounted for about 44.9% and 46.9% of the areas, respectively, whereas for non-karst areas these accounted for about 40.0% and 36.0%. Furthermore, similar results were found when computed by NDVI data, for which the ALRNDVI and ALN of the karst area accounted for about 43.2% and 56.1%, respectively, whereas for the non-karst area this accounted for about 34.2% and 36.6%. The karst landform areas are more susceptible to drought because of the difficulty in containing water in the soil [6,36]. Strong evidence is provided for this by the larger proportions of detected ALE, ALN, ALREVI and ALRNDVI in karst areas than in non-karst areas.
The above content proves the ability of detected abnormally low resilience to macroscopically explore and reveal the impaired physiological functions of a forest hit by drought. However, more indices or approaches are necessary to be applied and compared with the results, and long-time series remote sensing data with higher accuracy are still urgent. It is impossible to quantify forest resilience by a general index, formula or analysis method, as this would be too generalized and vague [45,46]. Widely used forest resilience is related to resistance (the ability of the ecosystem to persist in disturbances), recovery (the ability of the ecosystem to restore its original state) and stability (the ability to maintain the same structure and function) [46,47,48,49]. These methods were usually adopted to calculate the index (fixed values) and determine high or low figures. However, the forest resilience in our study regarded the recovery rate from a perturbed state, and was internally dominated by forest physiological functions under drought conditions. Abnormally low resilience means an abnormally low recovery rate, which may be represented by abnormally high autocorrelation. The signals of reduced resilience (reduced recovery rate) in our study were dynamic, and can reflect the response to drought at each time interval. We did not detect forest resilience by combining resistance and stability in this research. Besides, the accuracy of threshold selection could be affected by the quality of the vegetation index products. The accuracy of these optical products can also be impaired by cloud and rain, and uncertainties are also caused by measurement errors and mixed signals of forest growth. As our research is regards the large-scale monitoring of forest resilience using satellite-based remote sensing data, we also ignored the impact of diverse species on the selection of the threshold. There are also other indicators for assessing forest dynamics, such as tree-ring width measurements [50,51,52]. In future research, it is necessary to comprehensively adopt different methods and fuse different metrics to monitor the forest resilience under drought pressure, which can better contribute to forest resource management with increasing climate change.
5. Conclusions
The BDLM was used to detect the reduced resilience of the forest in Southwest China, and the ability to estimate the critical slowing down of forest recovery as a consequence of drought was examined. Forest in Southwest China appeared to have large areas of abnormally low resilience and abnormally low vegetation indices approximately 6 months after the drought. Meanwhile, the distributions of abnormally low resilience and abnormally low vegetation indices and drought events had good spatial consistency, whether in 2010 or 2012. Moreover, we found that afforestation forest areas were more susceptible to drought than natural forest, perhaps due to the different water uptake strategy with diverse root systems. Furthermore, the trees over karst regions also yielded a higher sensitivity to the changing climate. In the future, it will be necessary to further understand the drought-introduced reduction in forest resilience by combining forest death data, field measurements and finer-scaled satellite observations, because the reduction affected by drought in forest resilience is closely related to forest ecosystem management, especially considering the increasing extreme weather events in recent years.
Author Contributions
Conceptualization, H.J. and L.S.; methodology, H.J. and L.S.; validation, H.J. and L.S.; formal analysis, H.J. and L.S.; resources, L.S. and M.M.; data curation, H.J.; visualization, H.J.; writing—original draft preparation, H.J.; writing—review and editing, L.S., Y.L. and L.F.; supervision, L.S. and M.M.; funding acquisition, L.S. and M.M. All authors have read and agreed to the published version of the manuscript.
Funding
This research was funded by the National Natural Science Foundation of China Project, grant number 41830648 and 42071298; National Major Projects on High-Resolution Earth Observation System, grant number 21-Y20B01-9001-19/22.
Institutional Review Board Statement
Not applicable.
Informed Consent Statement
Not applicable.
Data Availability Statement
Not applicable.
Acknowledgments
This manuscript was supported by the National Natural Science Foundation of China Project under Grant 41830648 and 42071298; National Major Projects on High-Resolution Earth Observation System under Grant 21-Y20B01-9001-19/22.
Conflicts of Interest
The authors declare no conflict of interest.
References
- Tong, X.; Brandt, M.; Yue, Y.; Ciais, P.; Jepsen, M.R.; Penuelas, J.; Wigneron, J.-P.; Xiao, X.; Song, X.-P.; Horion, S.; et al. Forest management in southern China generates short term extensive carbon sequestration. Nat. Commun. 2020, 11, 129. [Google Scholar] [CrossRef] [PubMed]
- Tong, X.; Brandt, M.; Yue, Y.; Horion, S.; Wang, K.; Keersmaecker, W.D.; Tian, F.; Schurgers, G.; Xiao, X.; Luo, Y.; et al. Increased vegetation growth and carbon stock in China karst via ecological engineering. Nat. Sustain. 2018, 1, 44–50. [Google Scholar] [CrossRef]
- Song, L.; Li, Y.; Ren, Y.; Wu, X.; Guo, B.; Tang, X.; Shi, W.; Ma, M.; Han, X.; Zhao, L. Divergent vegetation responses to extreme spring and summer droughts in Southwestern China. Agric. For. Meteorol. 2019, 279, 107703. [Google Scholar] [CrossRef]
- Zhang, L.; Xiao, J.; Li, J.; Wang, K.; Lei, L.; Guo, H. The 2010 spring drought reduced primary productivity in southwestern China. Environ. Res. Lett. 2012, 7, 045706. [Google Scholar] [CrossRef] [Green Version]
- Li, X.; Li, Y.; Chen, A.; Gao, M.; Slette, I.J.; Piao, S. The impact of the 2009/2010 drought on vegetation growth and terrestrial carbon balance in Southwest China. Agric. For. Meteorol. 2019, 269, 239–248. [Google Scholar] [CrossRef]
- Wang, M.; Ding, Z.; Wu, C.; Song, L.; Ma, M.; Yu, P.; Lu, B.; Tang, X. Divergent responses of ecosystem water-use efficiency to extreme seasonal droughts in Southwest China. Sci. Total Environ. 2021, 760, 143427. [Google Scholar] [CrossRef] [PubMed]
- Liu, Y.; Kumar, M.; Katul, G.G.; Porporato, A. Reduced resilience as an early warning signal of forest mortality. Nat. Clim. Change 2019, 9, 880–885. [Google Scholar] [CrossRef]
- Dakos, V.; Carpenter, S.R.; van Nes, E.H.; Scheffer, M. Resilience indicators: Prospects and limitations for early warnings of regime shifts. Philos. Trans. R. Soc. B-Biol. Sci. 2015, 370, 20130263. [Google Scholar] [CrossRef] [Green Version]
- Reyer, C.P.O.; Rammig, A.; Brouwers, N.; Langerwisch, F. Forest resilience, tipping points and global change processes. J. Ecol. 2015, 103, 1–4. [Google Scholar] [CrossRef]
- Verbesselt, J.; Umlauf, N.; Hirota, M.; Holmgren, M.; Van Nes, E.H.; Herold, M.; Zeileis, A.; Scheffer, M. Remotely sensed resilience of tropical forests. Nat. Clim. Change 2016, 6, 1028–1031. [Google Scholar] [CrossRef]
- Brandt, M.; Yue, Y.; Wigneron, J.P.; Tong, X.; Tian, F.; Jepsen, M.R.; Xiao, X.; Verger, A.; Mialon, A.; Al-Yaari, A.; et al. Satellite-Observed Major Greening and Biomass Increase in South China Karst During Recent Decade. Earths Future 2018, 6, 1017–1028. [Google Scholar] [CrossRef]
- Piao, S.; Fang, J.; Ciais, P.; Peylin, P.; Huang, Y.; Sitch, S.; Wang, T. The carbon balance of terrestrial ecosystems in China. Nature 2009, 458, U1009–U1082. [Google Scholar] [CrossRef] [PubMed]
- Liu, C.; Liu, Y.; Guo, K.; Wang, S.; Liu, H.; Zhao, H.; Qiao, X.; Hou, D.; Li, S. Aboveground carbon stock, allocation and sequestration potential during vegetation recovery in the karst region of southwestern China: A case study at a watershed scale. Agric. Ecosyst. Environ. 2016, 235, 91–100. [Google Scholar] [CrossRef]
- Jackson, T.; Schmugge, T. Vegetation effects on the microwave emission of soils. Remote Sens. Environ. 1991, 36, 203–212. [Google Scholar] [CrossRef]
- Owe, M.; de Jeu, R.; Holmes, T. Multisensor historical climatology of satellite-derived global land surface moisture. J. Geophys. Res.-Earth Surf. 2008, 113, 113. [Google Scholar] [CrossRef]
- Yang, K.; He, J.; Tang, W.; Qin, J.; Cheng, C.C.K. On downward shortwave and longwave radiations over high altitude regions: Observation and modeling in the Tibetan Plateau. Agric. For. Meteorol. 2010, 150, 38–46. [Google Scholar] [CrossRef]
- He, J.; Yang, K.; Tang, W.; Lu, H.; Qin, J.; Chen, Y.; Li, X. The first high-resolution meteorological forcing dataset for land process studies over China. Sci. Data 2020, 7, 1–11. [Google Scholar] [CrossRef] [PubMed] [Green Version]
- Vicente-Serrano, S.M.; Begueria, S.; Lopez-Moreno, J.I. A Multiscalar Drought Index Sensitive to Global Warming: The Standardized Precipitation Evapotranspiration Index. J. Clim. 2010, 23, 1696–1718. [Google Scholar] [CrossRef] [Green Version]
- Begueria, S.; Vicente-Serrano, S.M.; Reig, F.; Latorre, B. Standardized precipitation evapotranspiration index (SPEI) revisited: Parameter fitting, evapotranspiration models, tools, datasets and drought monitoring. Int. J. Climatol. 2014, 34, 3001–3023. [Google Scholar] [CrossRef] [Green Version]
- Huang, K.; Yi, C.; Wu, D.; Zhou, T.; Zhao, X.; Blanford, W.J.; Wei, S.; Wu, H.; Ling, D.; Li, Z. Tipping point of a conifer forest ecosystem under severe drought. Environ. Res. Lett. 2015, 10, 024011. [Google Scholar] [CrossRef]
- Xu, K.; Yang, D.; Yang, H.; Li, Z.; Qin, Y.; Shen, Y. Spatio-temporal variation of drought in China during 1961–2012: A climatic perspective. J. Hydrol. 2015, 526, 253–264. [Google Scholar] [CrossRef]
- Hansen, M.C.; Potapov, P.V.; Moore, R.; Hancher, M.; Turubanova, S.A.; Tyukavina, A.; Thau, D.; Stehman, S.V.; Goetz, S.J.; Loveland, T.R.; et al. High-Resolution Global Maps of 21st-Century Forest Cover Change. Science 2013, 342, 850–853. [Google Scholar] [CrossRef] [PubMed] [Green Version]
- Held, H.; Kleinen, T. Detection of climate system bifurcations by degenerate fingerprinting. Geophys. Res. Lett. 2004, 31, 4. [Google Scholar] [CrossRef] [Green Version]
- Scheffer, M.; Carpenter, S.; Foley, J.A.; Folke, C.; Walker, B. Catastrophic shifts in ecosystems. Nature 2001, 413, 591–596. [Google Scholar] [CrossRef] [PubMed]
- Ives, A.R.; Dakos, V. Detecting dynamical changes in nonlinear time series using locally linear state-space models. Ecosphere 2012, 3, art58-15. [Google Scholar] [CrossRef]
- Dakos, V.; Carpenter, S.R.; Brock, W.A.; Ellison, A.M.; Guttal, V.; Ives, A.R.; Kefi, S.; Livina, V.; Seekell, D.A.; van Nes, E.H.; et al. Methods for Detecting Early Warnings of Critical Transitions in Time Series Illustrated Using Simulated Ecological Data. PLoS ONE 2012, 7, e41010. [Google Scholar] [CrossRef] [PubMed] [Green Version]
- Prado, R.; West, M. Time Series: Modeling, Computation, and Inference; Chapman and Hall/CRC: New York, NY, USA, 2010. [Google Scholar]
- West, M.; Harrison, J. Bayesian Forecasting and Dynamic Models; Springer Science & Business Media: Berlin/Heidelberg, Germany, 2006. [Google Scholar]
- Scheffer, M.; Bascompte, J.; Brock, W.A.; Brovkin, V.; Carpenter, S.R.; Dakos, V.; Held, H.; van Nes, E.H.; Rietkerk, M.; Sugihara, G. Early-warning signals for critical transitions. Nature 2009, 461, 53–59. [Google Scholar] [CrossRef] [PubMed]
- Brodrick, P.G.; Asner, G.P. Remotely sensed predictors of conifer tree mortality during severe drought. Environ. Res. Lett. 2017, 12, 115013. [Google Scholar] [CrossRef] [Green Version]
- Breshears, D.D.; Cobb, N.S.; Rich, P.M.; Price, K.P.; Allen, C.D.; Balice, R.G.; Romme, W.H.; Kastens, J.H.; Floyd, M.L.; Belnap, J.; et al. Regional vegetation die-off in response to global-change-type drought. Proc. Natl. Acad. Sci. USA 2005, 102, 15144–15148. [Google Scholar] [CrossRef] [Green Version]
- Nie, Y.; Chen, H.; Wang, K.-L.; Yang, J. Water source utilization by woody plants growing on dolomite outcrops and nearby soils during dry seasons in karst region of Southwest China. J. Hydrol. 2012, 420, 264–274. [Google Scholar] [CrossRef]
- Liu, M.; Xu, X.; Wang, D.; Sun, A.Y.; Wang, K. Karst catchments exhibited higher degradation stress from climate change than the non-karst catchments in southwest China: An ecohydrological perspective. J. Hydrol. 2016, 535, 173–180. [Google Scholar] [CrossRef]
- Zhong, Z.; He, B.; Chen, Y.; Yuan, W.; Huang, L.; Guo, L.; Zhang, Y.; Xie, X. Higher sensitivity of planted forests’ productivity than natural forests to droughts in China. J. Geophys. Res. Biogeosci. 2021, 126, e2021JG006306. [Google Scholar] [CrossRef]
- Nie, Y.P.; Chen, H.S.; Wang, K.L.; Ding, Y.L. Rooting characteristics of two widely distributed woody plant species growing in different karst habitats of southwest China. Plant Ecol. 2014, 215, 1099–1109. [Google Scholar] [CrossRef]
- Ding, Y.L.; Nie, Y.P.; Chen, H.S.; Wang, K.L.; Querejeta, J.I. Water uptake depth is coordinated with leaf water potential, water-use efficiency and drought vulnerability in karst vegetation. New Phytol. 2021, 229, 1339–1353. [Google Scholar] [CrossRef]
- Jackson, P.C.; Meinzer, F.C.; Bustamante, M.; Goldstein, G.; Franco, A.; Rundel, P.W.; Caldas, L.; Igler, E.; Causin, F. Partitioning of soil water among tree species in a Brazilian Cerrado ecosystem. Tree Physiol. 1999, 19, 717–724. [Google Scholar] [CrossRef] [PubMed] [Green Version]
- Brum, M.; Teodoro, G.S.; Abrahao, A.; Oliveira, R.S. Coordination of rooting depth and leaf hydraulic traits defines drought-related strategies in the campos rupestres, a tropical montane biodiversity hotspot. Plant Soil 2017, 420, 467–480. [Google Scholar] [CrossRef]
- Schenk, H.J.; Jackson, R.B. Rooting depths, lateral root spreads and below-ground/above-ground allometries of plants in water-limited ecosystems. J. Ecol. 2002, 90, 480–494. [Google Scholar] [CrossRef] [Green Version]
- Phillips, J.D. Biogeomorphology and contingent ecosystem engineering in karst landscapes. Prog. Phys. Geogr.-Earth Environ. 2016, 40, 503–526. [Google Scholar] [CrossRef]
- Phillips, J.D. Self-limited biogeomorphic ecosystem engineering in epikarst soils. Phys. Geogr. 2018, 39, 304–328. [Google Scholar] [CrossRef]
- Liu, W.N.; Chen, H.S.; Zou, Q.Y.; Nie, Y.P. Divergent root water uptake depth and coordinated hydraulic traits among typical karst plantations of subtropical China: Implication for plant water adaptation under precipitation changes. Agric. Water Manag. 2021, 249, 106798. [Google Scholar] [CrossRef]
- Nardini, A.; Casolo, V.; Dal Borgo, A.; Savi, T.; Stenni, B.; Bertoncin, P.; Zini, L.; McDowell, N.G. Rooting depth, water relations and non-structural carbohydrate dynamics in three woody angiosperms differentially affected by an extreme summer drought. Plant Cell Environ. 2016, 39, 618–627. [Google Scholar] [CrossRef] [PubMed]
- Crouchet, S.E.; Jensen, J.; Schwartz, B.F.; Schwinning, S. Tree Mortality After a Hot Drought: Distinguishing Density-Dependent and-Independent Drivers and Why It Matters. Front. For. Glob. Chang. 2019, 2, 21. [Google Scholar] [CrossRef] [Green Version]
- Hollings, C.S. Resilience and Stability of Ecological Systems. Annu. Rev. Ecol. Syst. 1973, 4, 1–23. [Google Scholar] [CrossRef] [Green Version]
- Yi, C.X.; Jackson, N. A review of measuring ecosystem resilience to disturbance. Environ. Res. Lett. 2021, 16, 053008. [Google Scholar] [CrossRef]
- Olano, J.M.; Brito, P.; Gonzalez-Rodriguez, A.M.; Martin-Esquivel, J.L.; Garcia-Hidalgo, M.; Rozas, V. Thirsty peaks: Drought events drive keystone shrub decline in an oceanic island mountain. Biol. Conserv. 2017, 215, 99–106. [Google Scholar] [CrossRef]
- Nimmo, D.G.; Mac Nally, R.; Cunningham, S.C.; Haslem, A.; Bennett, A.F. Vive la resistance: Reviving resistance for 21st century conservation. Trends Ecol. Evol. 2015, 30, 516–523. [Google Scholar] [CrossRef] [PubMed]
- Huang, K.; Xia, J. High ecosystem stability of evergreen broadleaf forests under severe droughts. Glob. Change Biol. 2019, 25, 3494–3503. [Google Scholar] [CrossRef] [PubMed]
- Julio Camarero, J.; Gazol, A.; Sangueesa-Barreda, G.; Oliva, J.; Vicente-Serrano, S.M. To die or not to die: Early warnings of tree dieback in response to a severe drought. J. Ecol. 2015, 103, 44–57. [Google Scholar] [CrossRef] [Green Version]
- Cailleret, M.; Jansen, S.; Robert, E.M.R.; Desoto, L.; Aakala, T.; Antos, J.A.; Beikircher, B.; Bigler, C.; Bugmann, H.; Caccianiga, M.; et al. A synthesis of radial growth patterns preceding tree mortality. Glob. Chang. Biol. 2017, 23, 1675–1690. [Google Scholar] [CrossRef] [PubMed]
- Lloret, F.; Keeling, E.G.; Sala, A. Components of tree resilience: Effects of successive low-growth episodes in old ponderosa pine forests. Oikos 2011, 120, 1909–1920. [Google Scholar] [CrossRef]
Figure 1.
Geographical location of study region and distribution of karst landscape (the geographic coordinate system with WGS84 and projection with Lambert adopted in the map, same for all the maps below).
Figure 1.
Geographical location of study region and distribution of karst landscape (the geographic coordinate system with WGS84 and projection with Lambert adopted in the map, same for all the maps below).
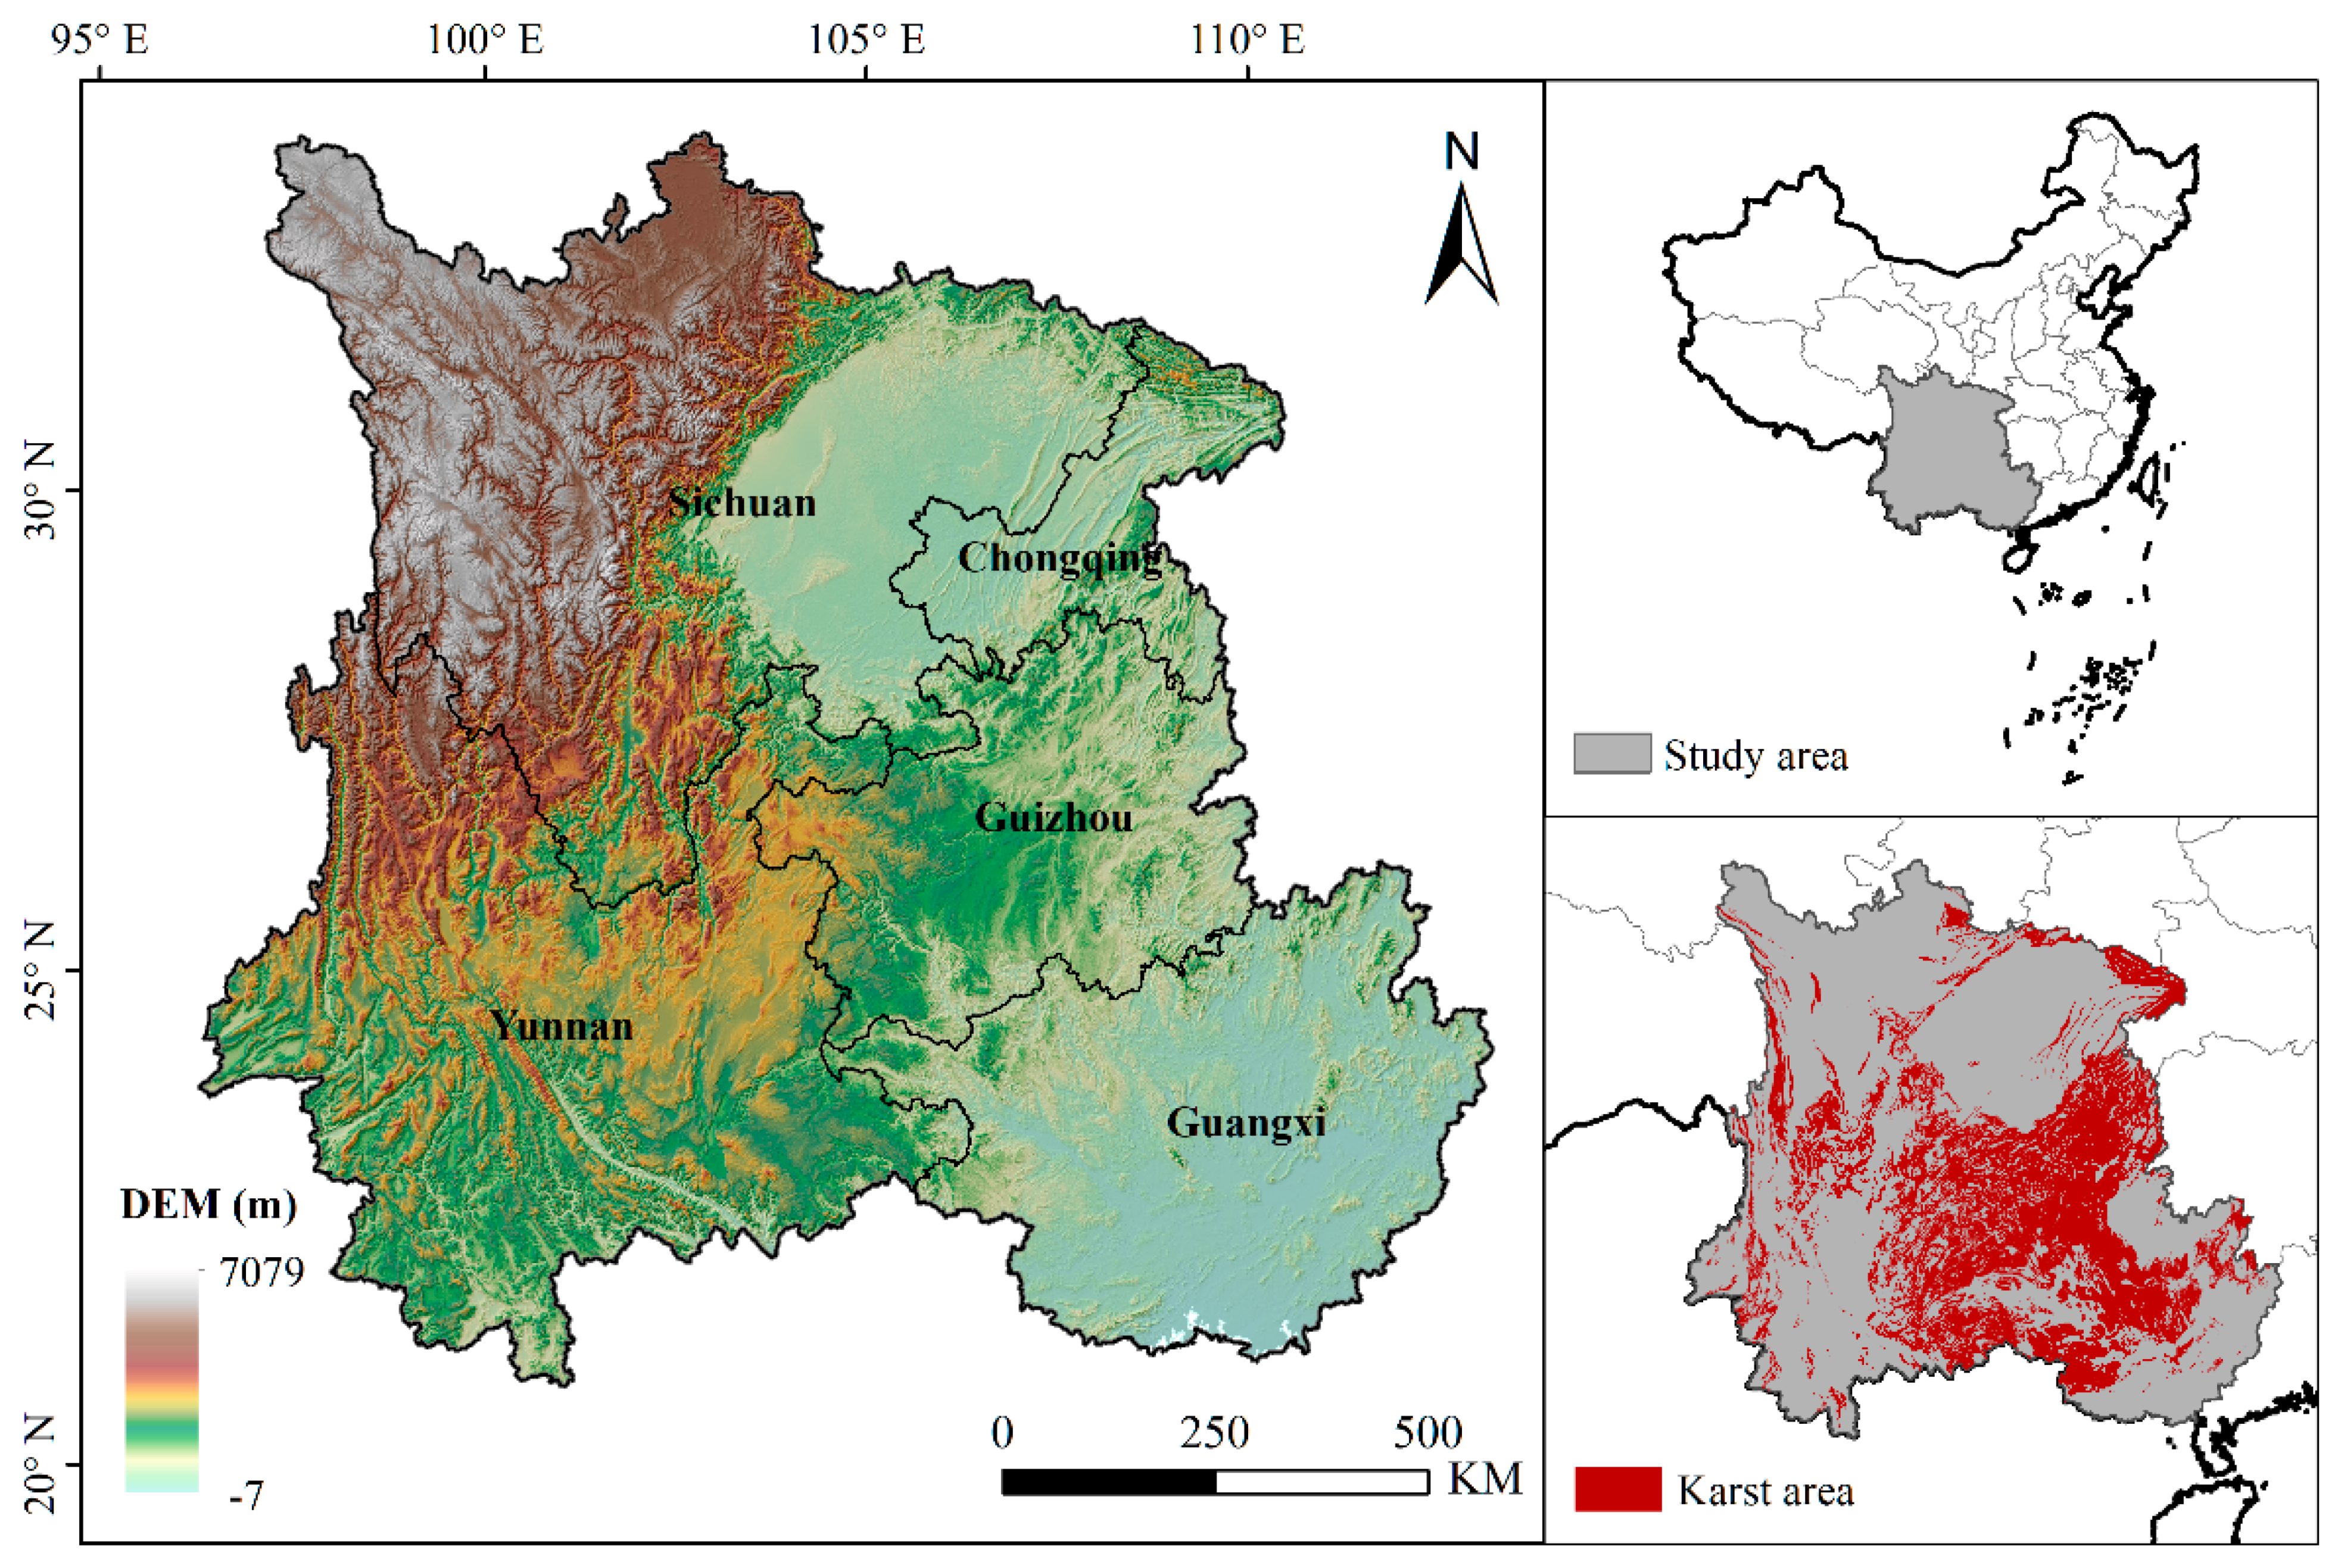
Figure 2.
An example of ALR detected using the Bayesian dynamic linear model. (a) Time series changes of monthly precipitation at a pixel; (b) time series changes of NDVI at a pixel; (c) the time-variant autocorrelation and the ALR estimated by the BDLM at a pixel. The ALR were identified in the case of the mean autocorrelation (blue line) exceeding the threshold (grey dashed line) and the mean autocorrelation also exceeding zero. The threshold was defined as the long-term average of the upper bound of the indetermination range (not including a four-year prewarming period). The orange time range represents the droughts by the SPEI. Each tick on the x axis represents the January of each year.
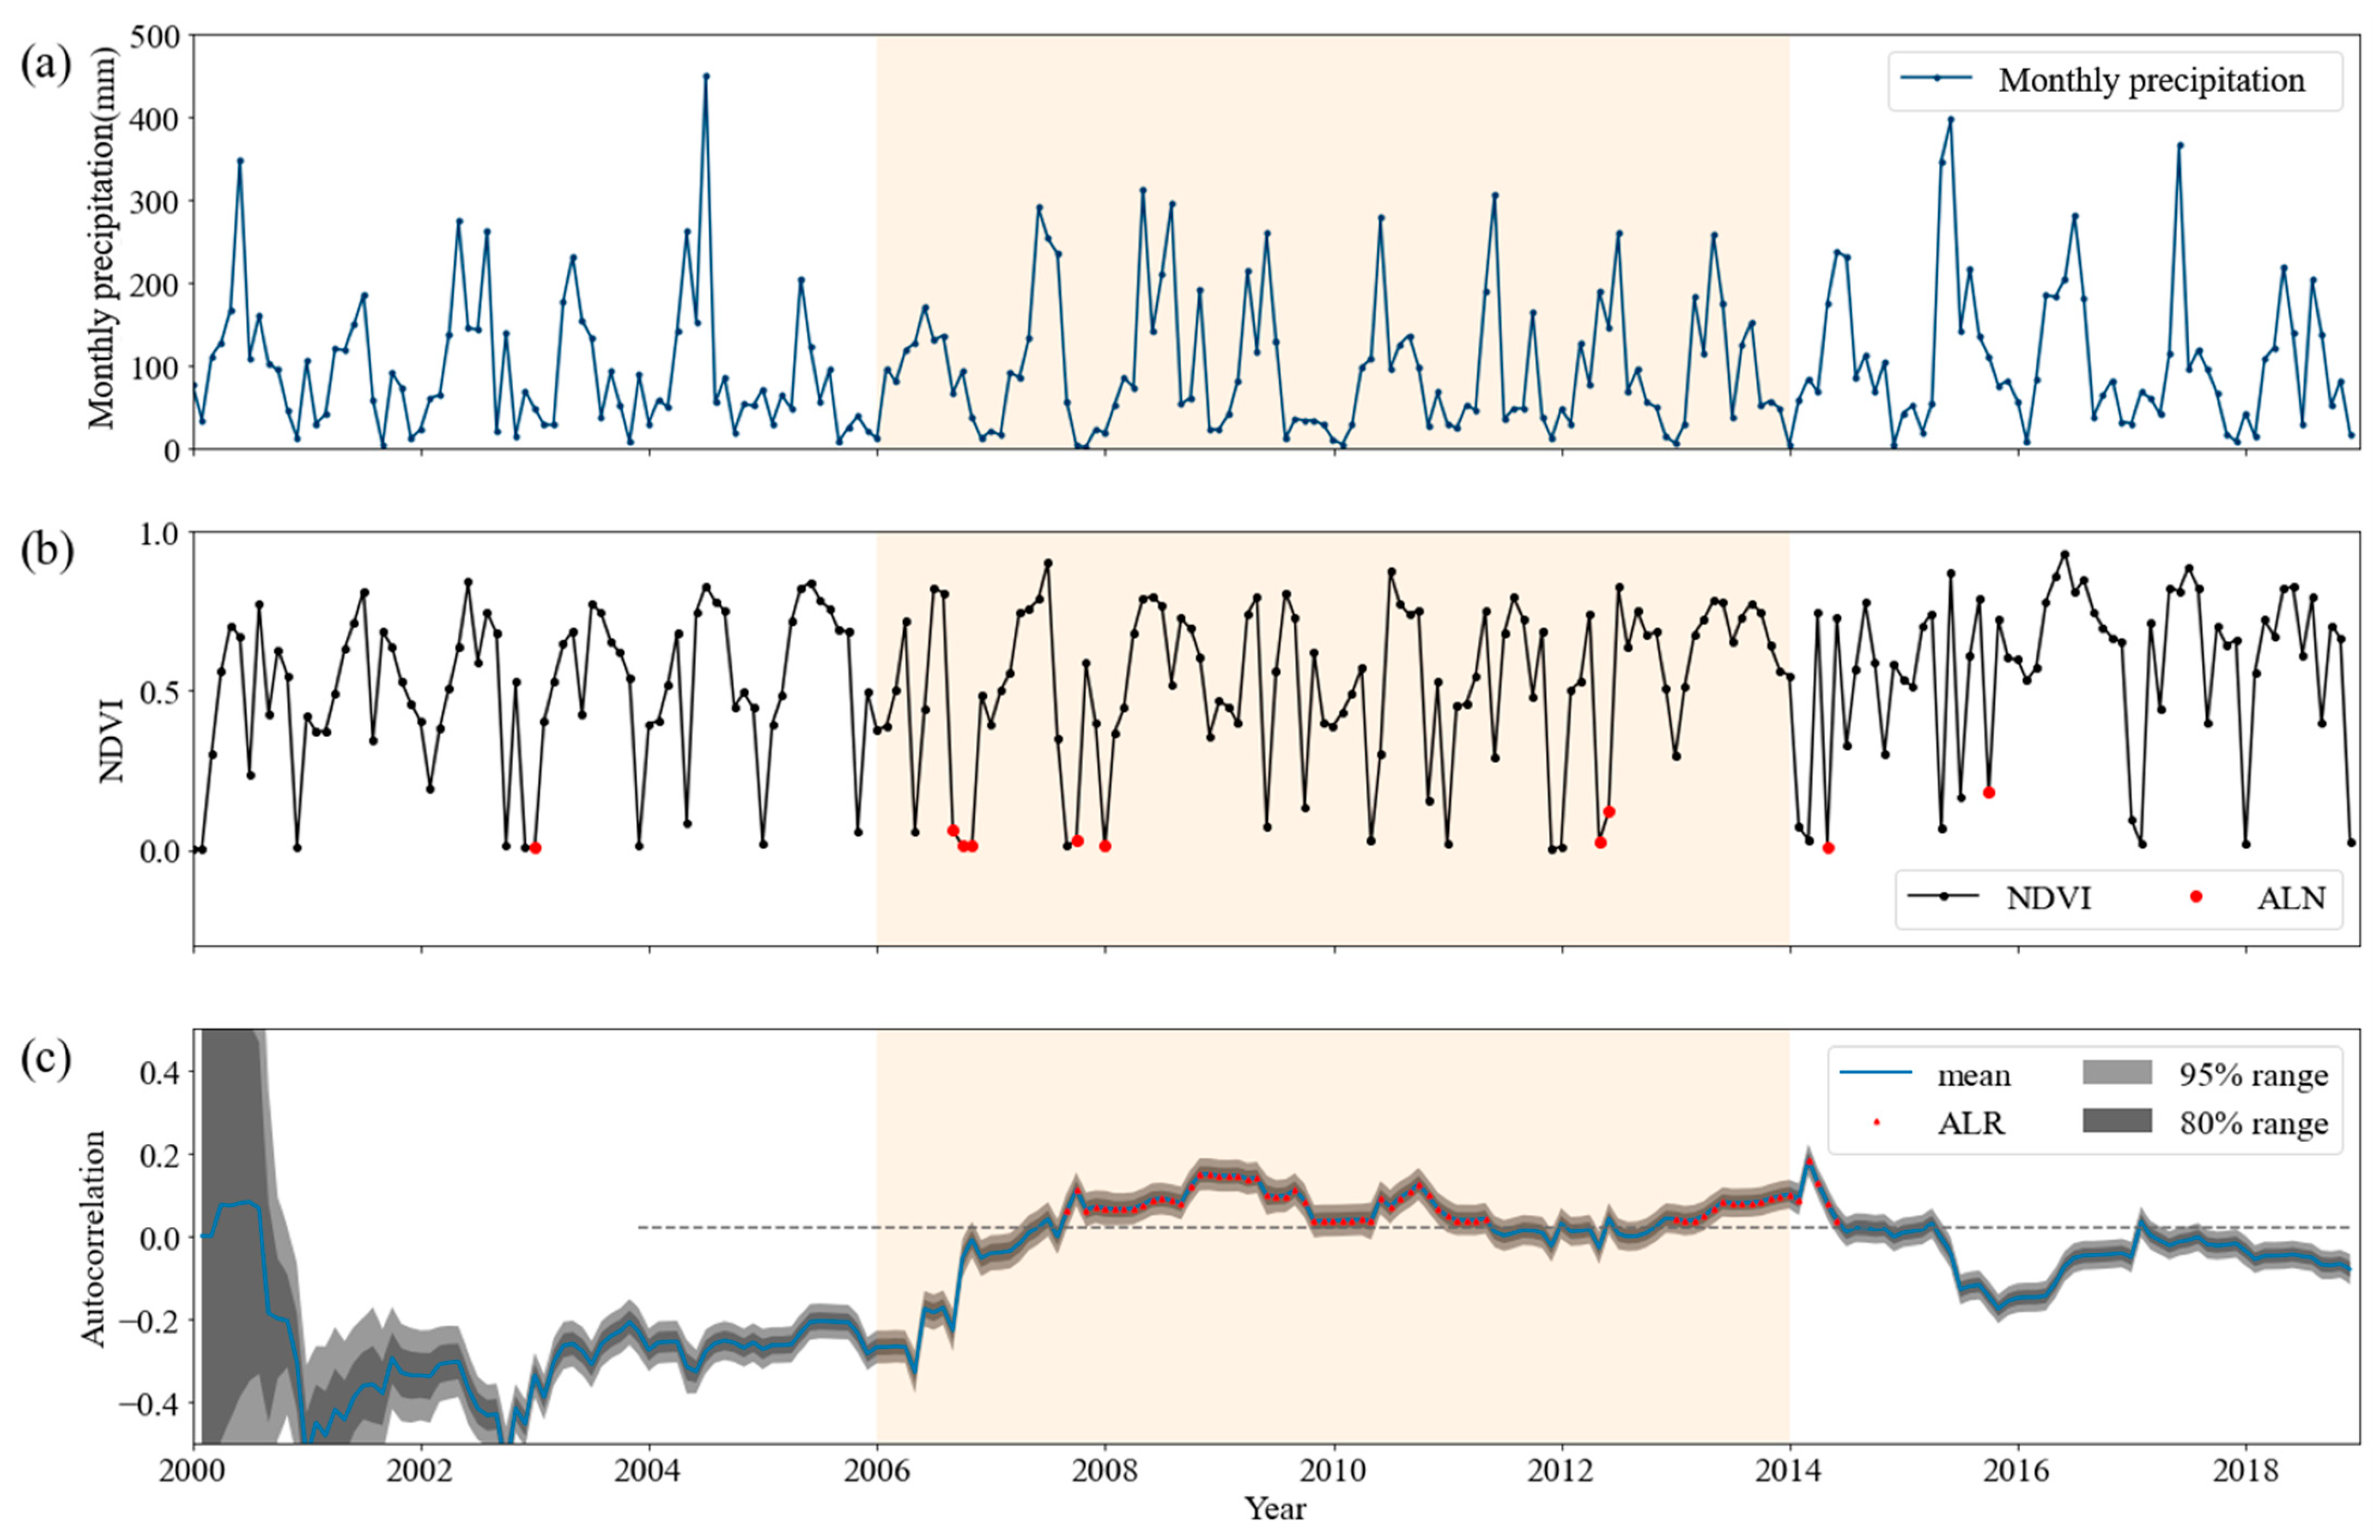
Figure 3.
Flow chart of data processing and results generation.

Figure 4.
Temporal series of drought severity, the areas of ALE and ALREVI, the area of ALN and ALRNDVI, and VOD anomaly. (a) The monthly standardized anomaly of SPEI3 for the Southwest China; (b) proportion of the area showing ALE (red) and ALREVI (blue); (c) proportion of the area showing ALN (dark red) and ALRNDVI (dark blue); (d) the monthly VOD anomaly for Southwest China. The blue vertical dotted line represents the most severe moment of the two drought events and the red vertical dotted line represents the moment of the sharp increase in ALE, ALREVI, ALN and ALRNDVI. Each tick on the x axis represents January of each year.
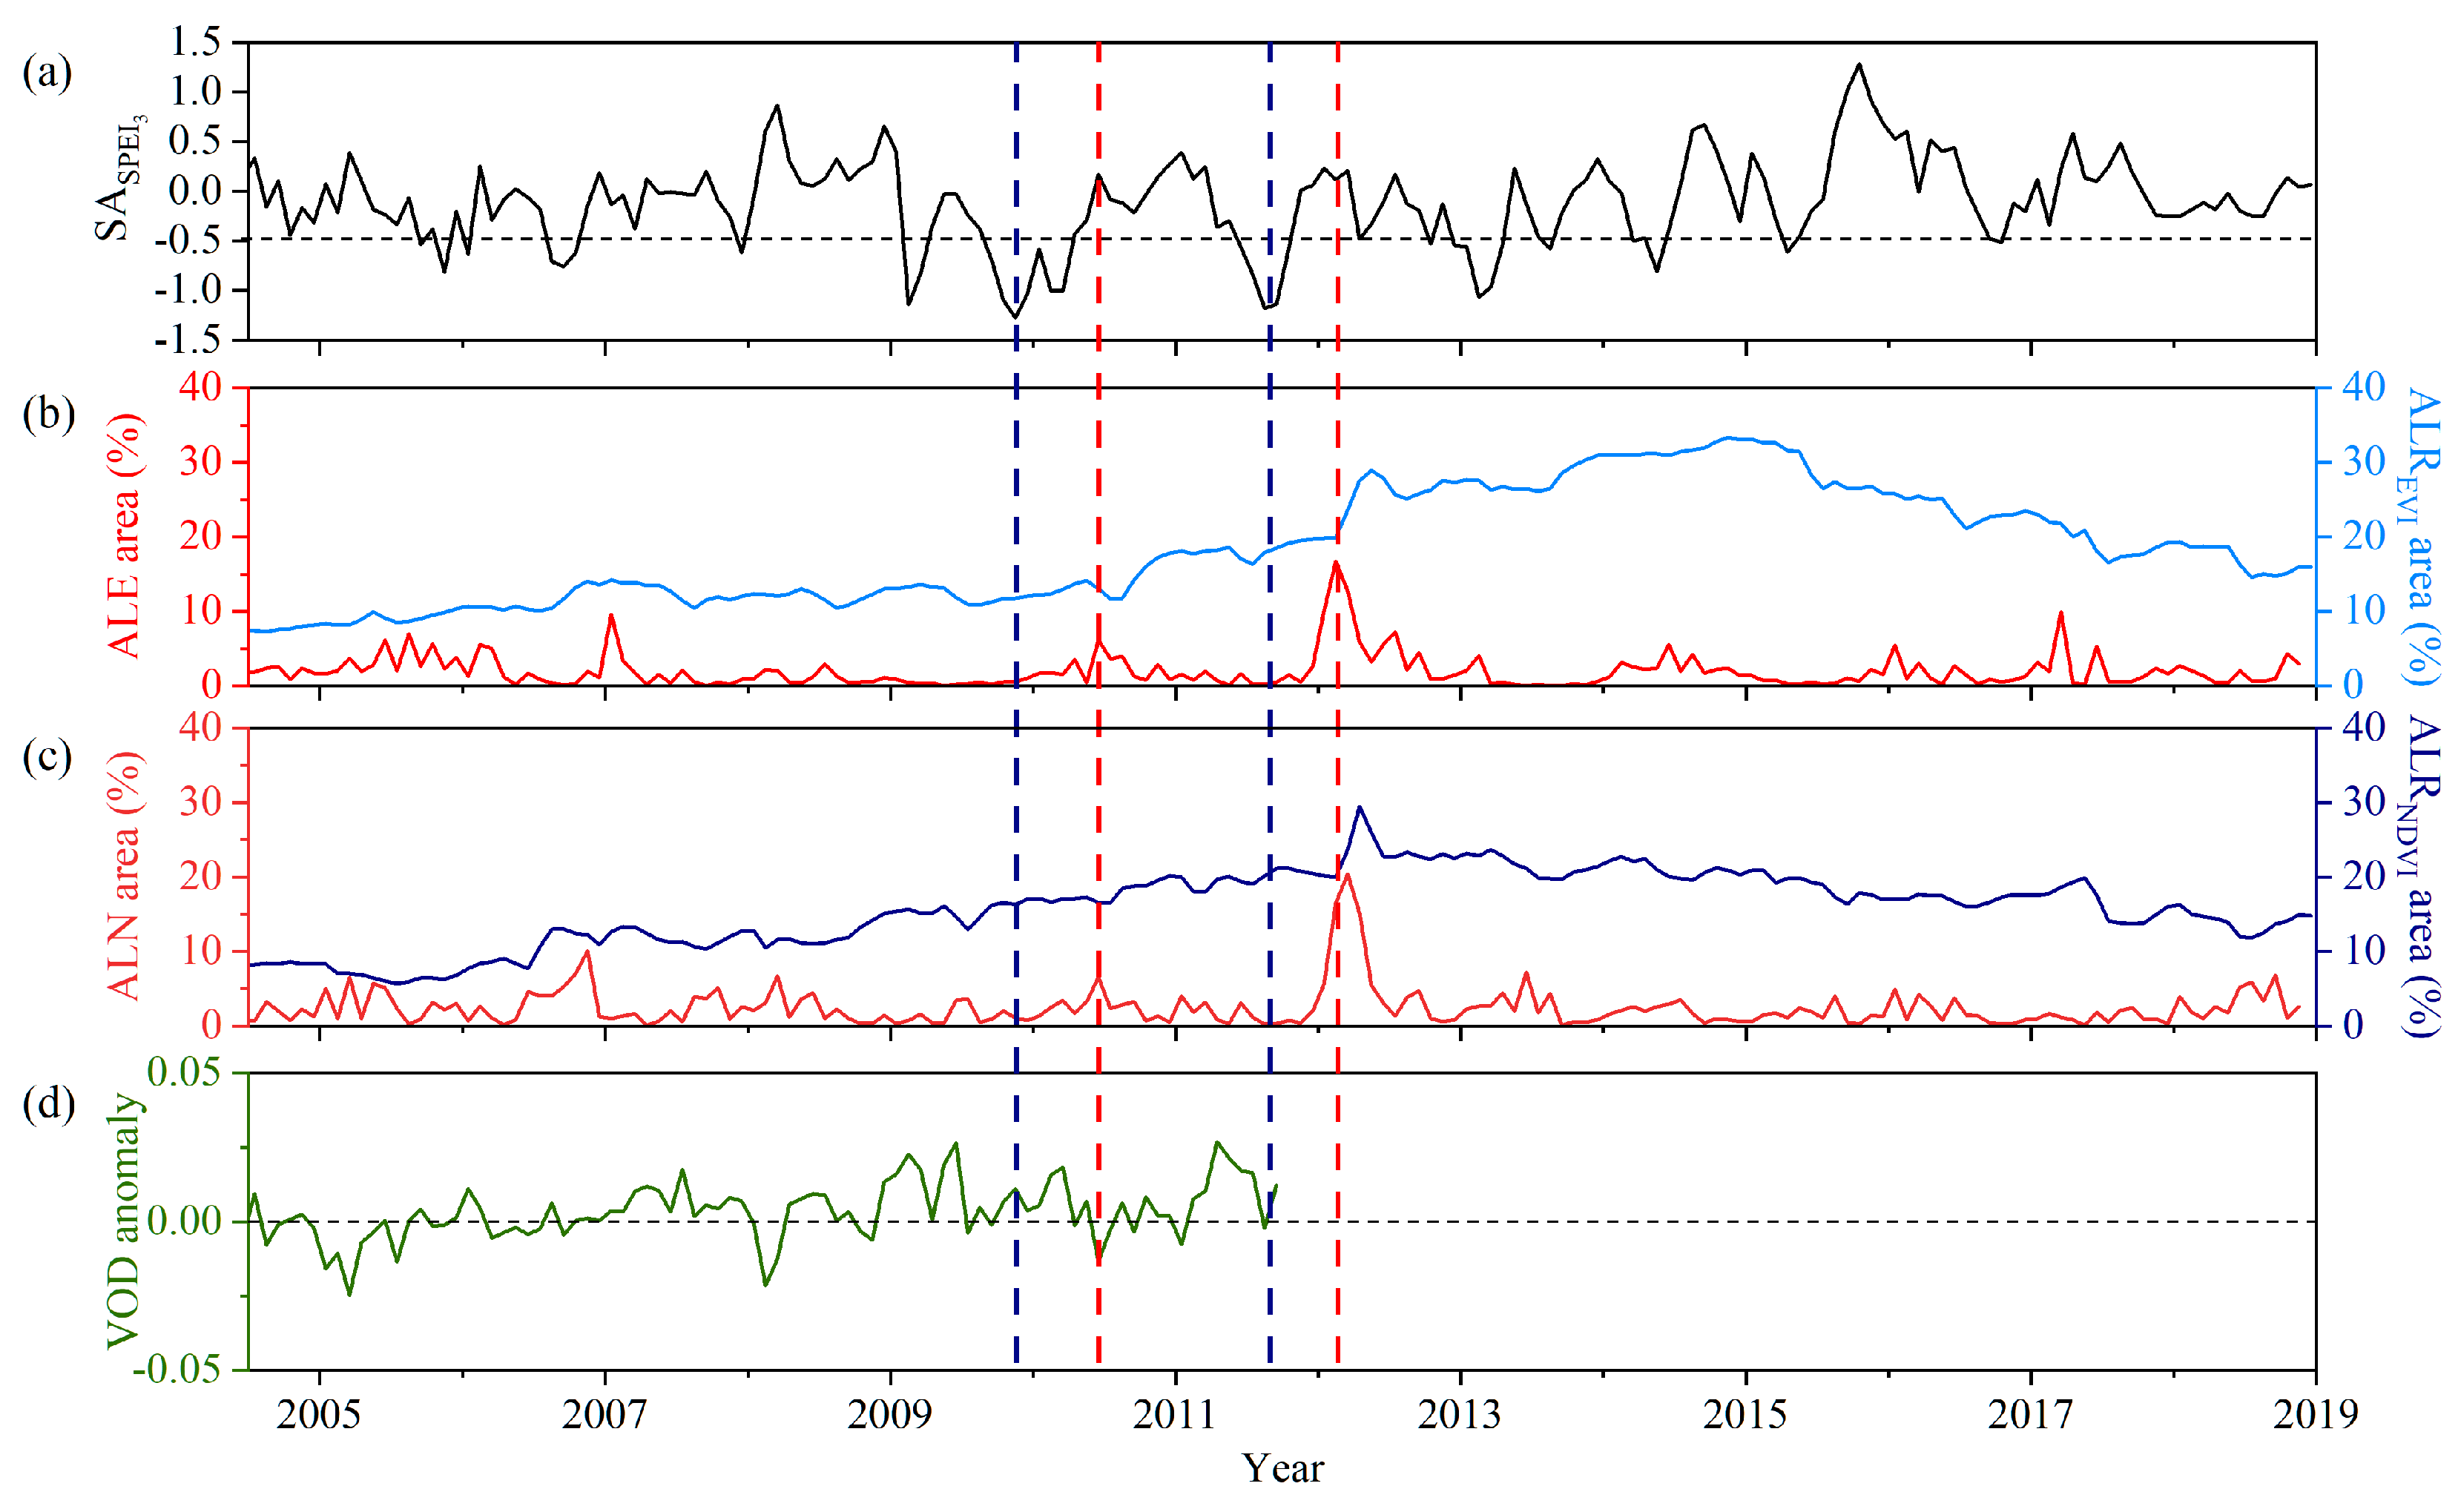
Figure 5.
Spatial pattern of the ALE in 2010 (a), ALN in 2010 (b), ALREVI in 2010 (c), ALRNDVI in 2010 (d), the 2009 autumn drought (e), the 2009 winter drought (f), the 2010 spring drought (g) and the 2010 summer drought (h) across Southwest China. The abbreviation: CQ (Chongqing), SC (Sichuan), GZ (Guizhou), YN (Yunnan) and GX (Guangxi).
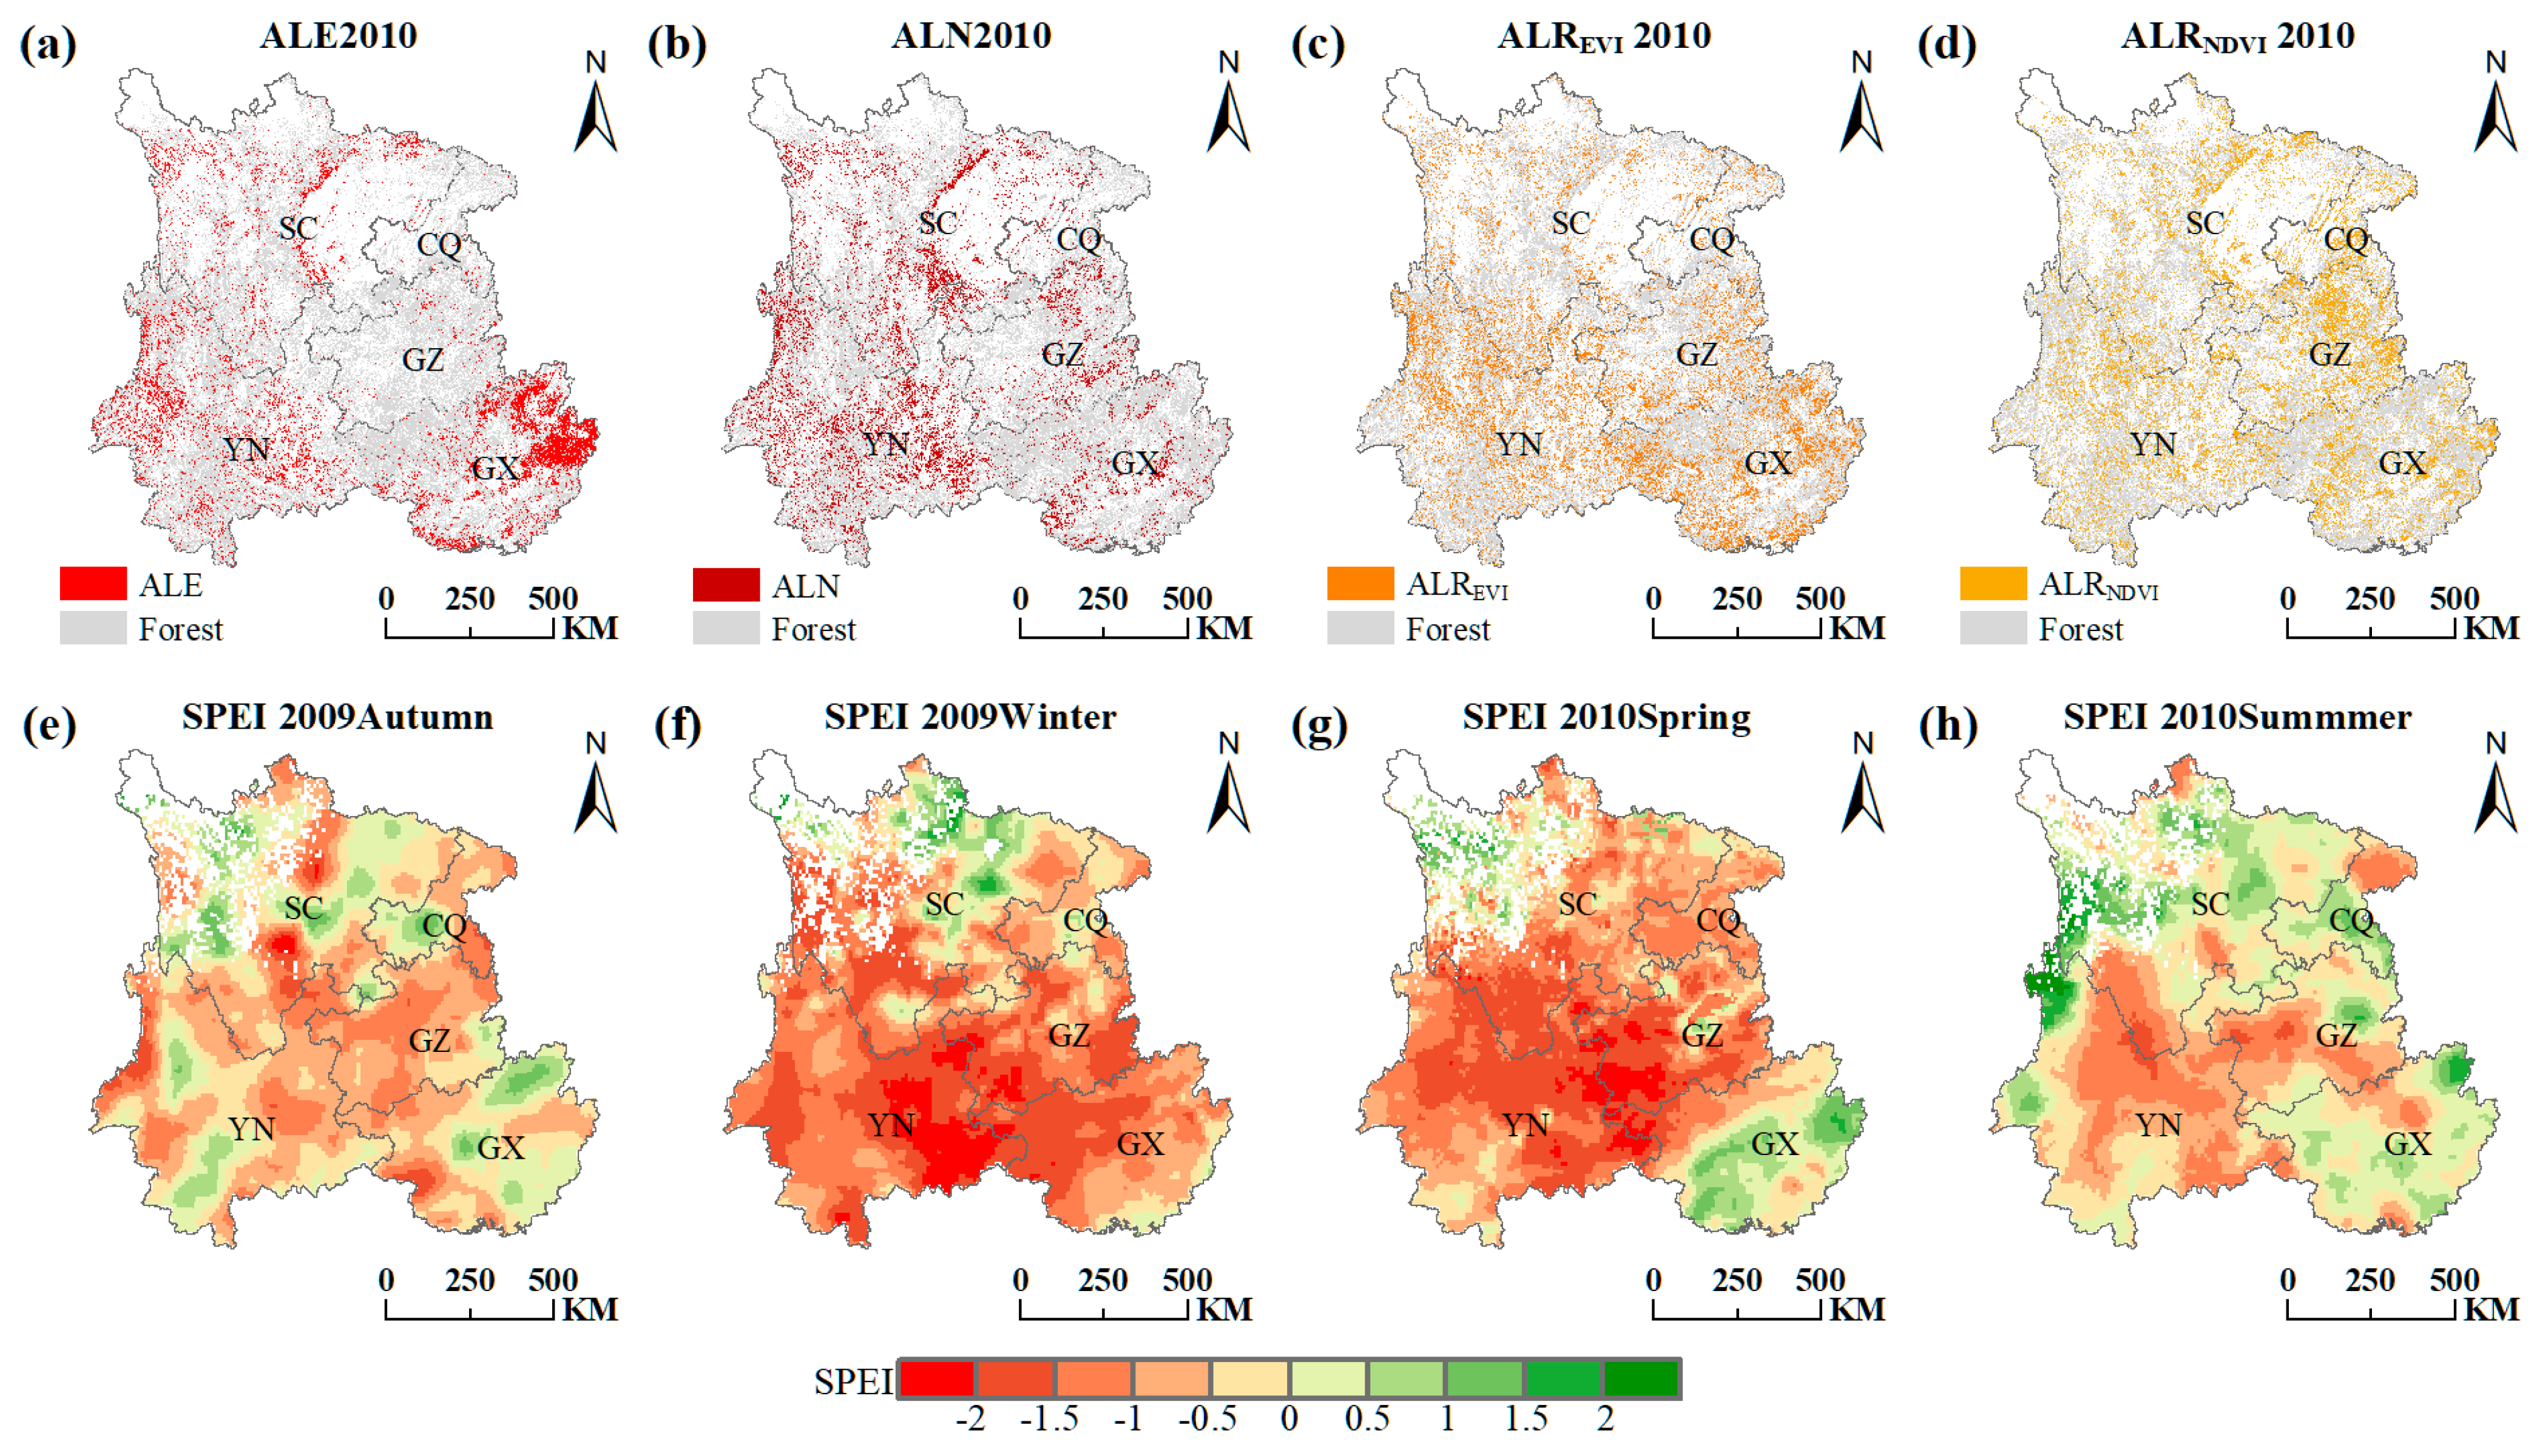
Figure 6.
Spatial pattern of the ALE in 2012 (a), ALN in 2012 (b), ALREVI in 2012 (c), ALRNDVI in 2012 (d), the 2011 spring drought (e), the 2011 summer drought (f), the 2011 autumn drought (g) and the 2011 winter drought (h) across Southwest China. The abbreviation: CQ (Chongqing), SC (Sichuan), GZ (Guizhou), YN (Yunnan) and GX (Guangxi).
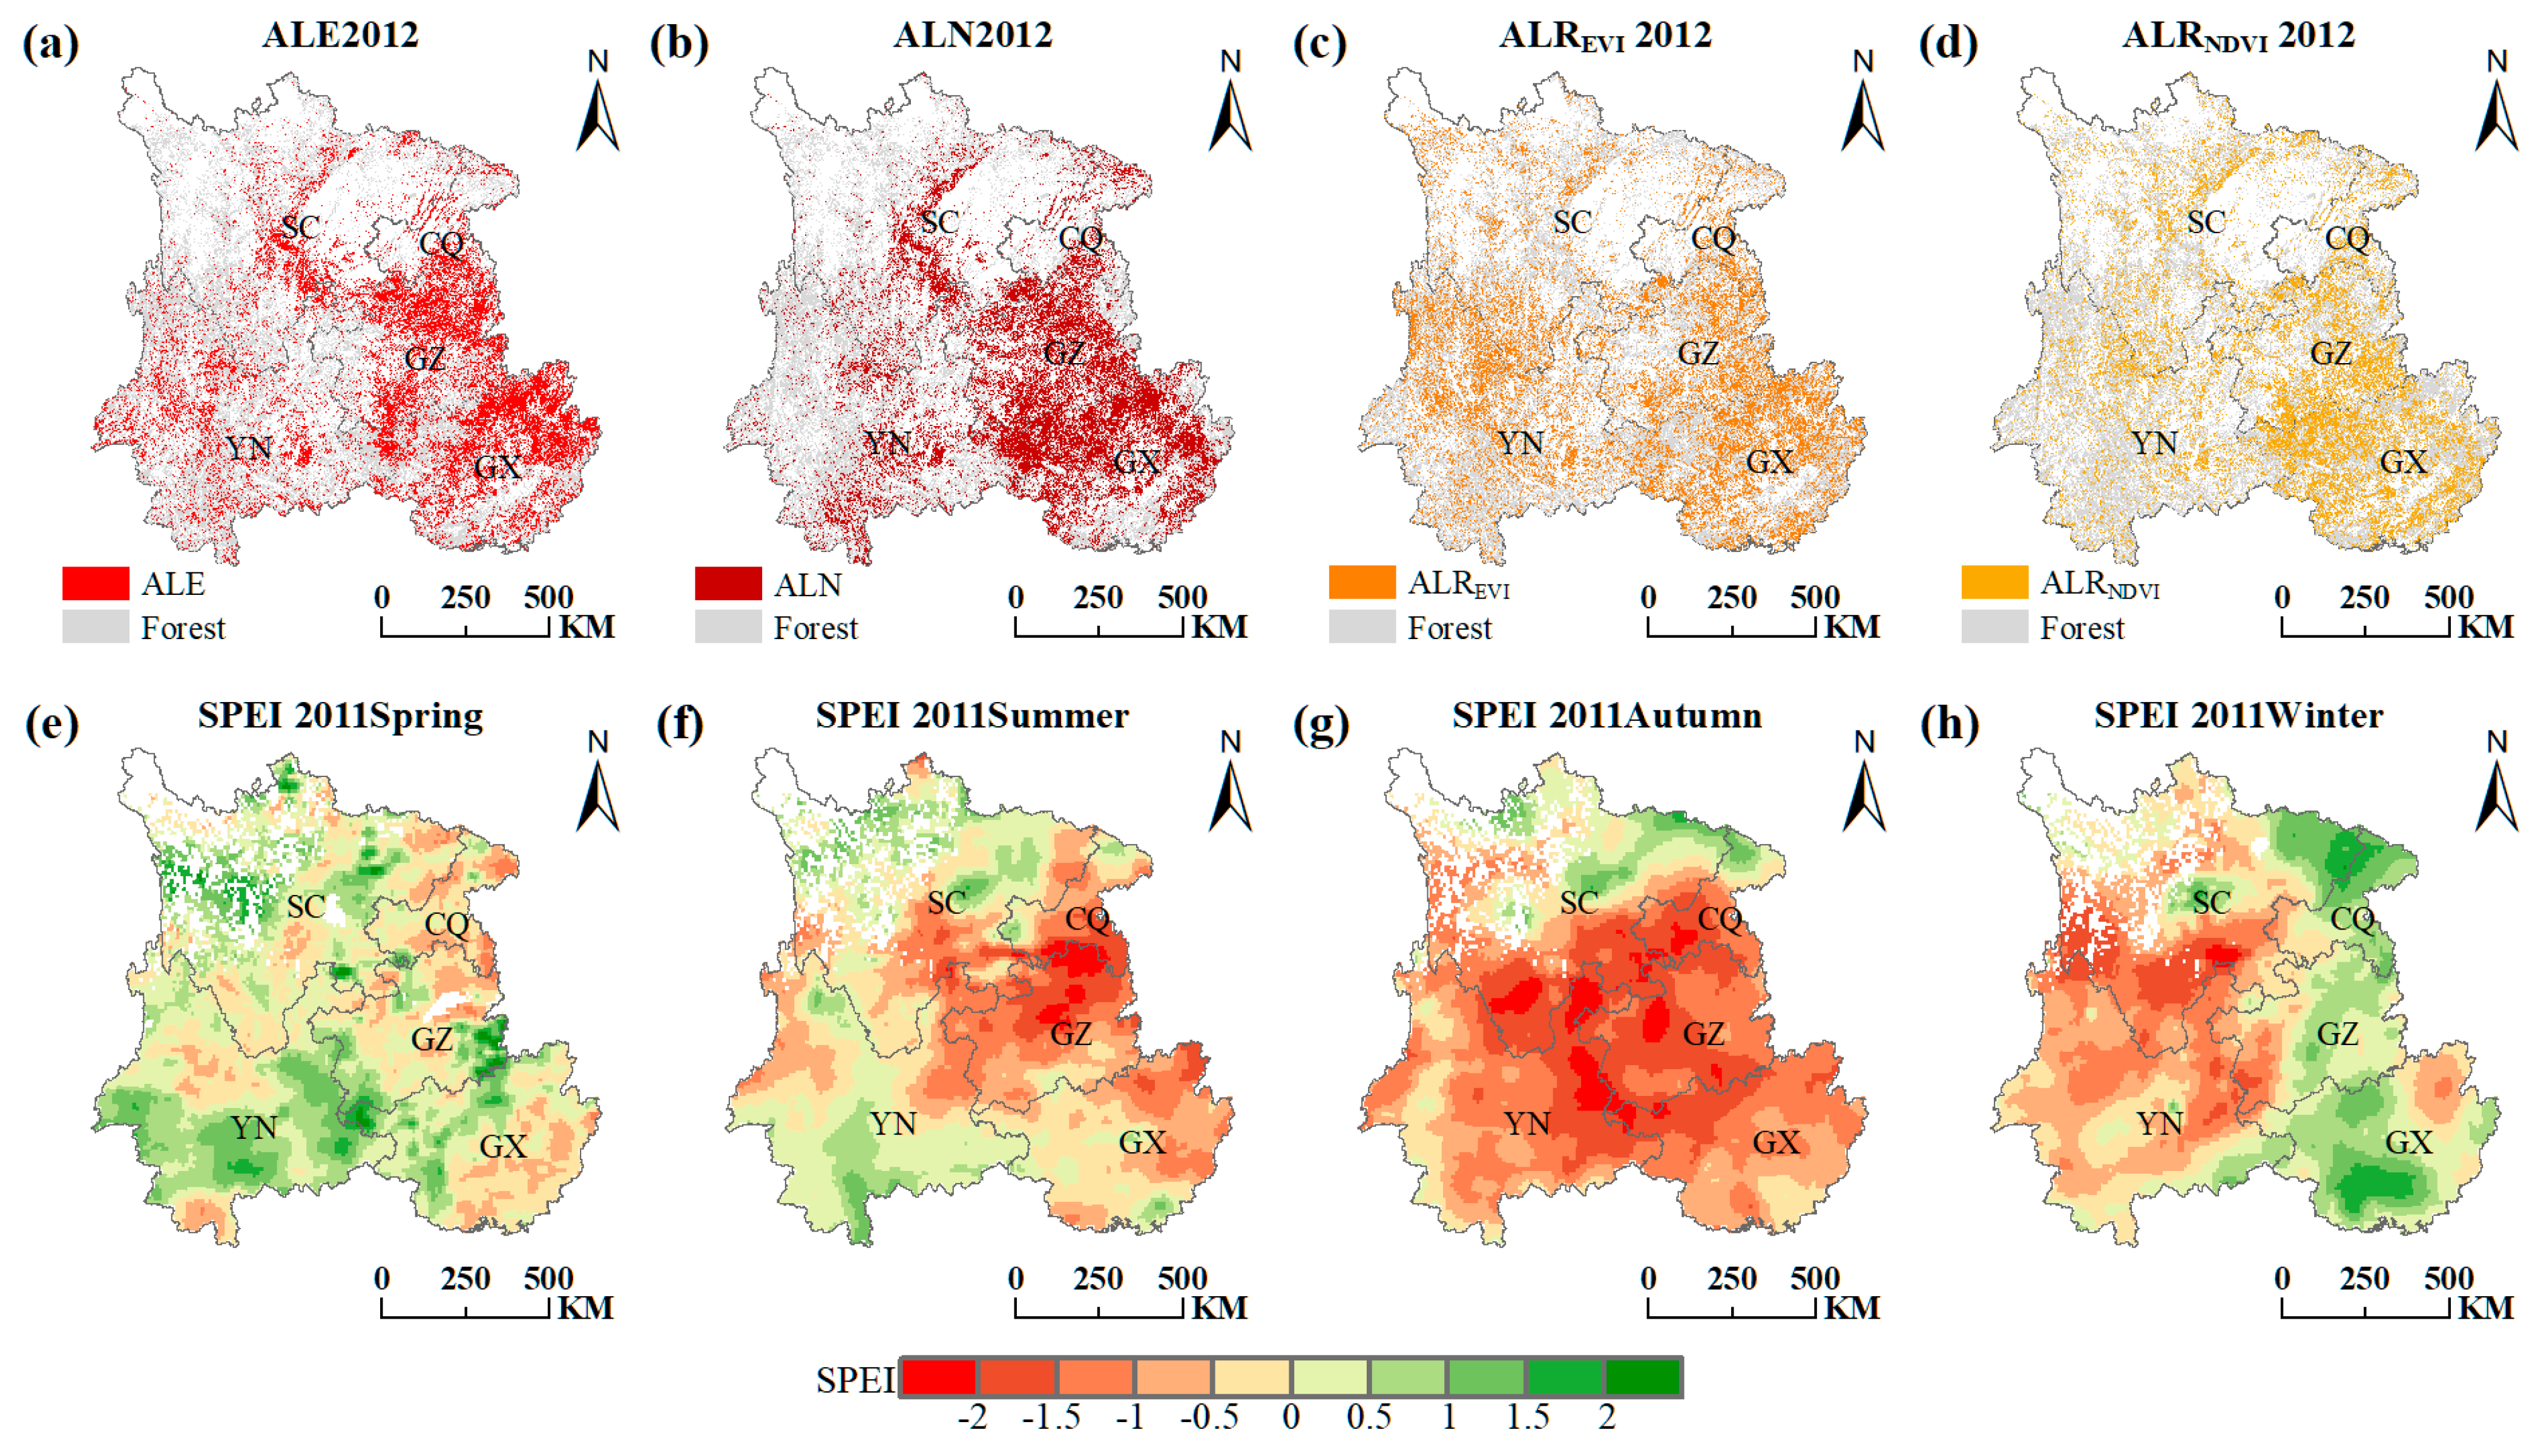
Figure 7.
(a) The spatial distributions of ALE, afforestation and natural forest in 2012; (b) close-up of the rectangle in (a); (c) the area proportion of ALE, ALN, ALREVI, ALRNDVI between afforestation and natural forest.
Figure 7.
(a) The spatial distributions of ALE, afforestation and natural forest in 2012; (b) close-up of the rectangle in (a); (c) the area proportion of ALE, ALN, ALREVI, ALRNDVI between afforestation and natural forest.
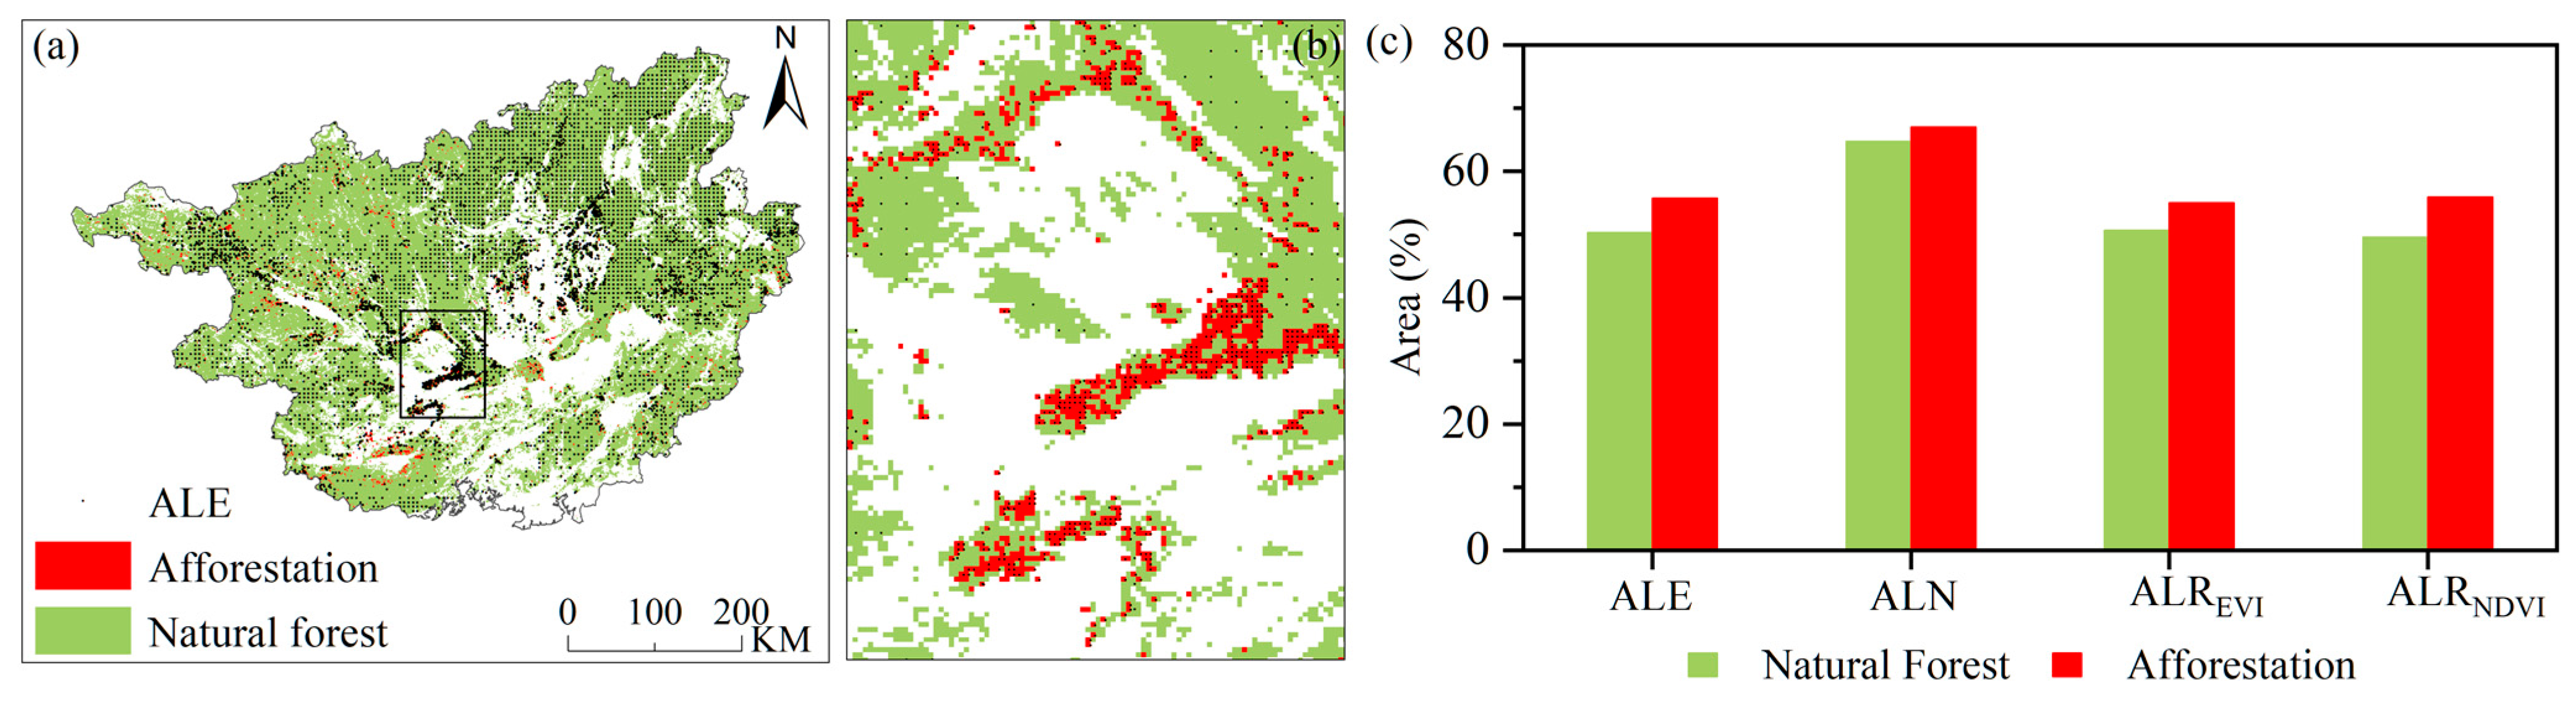
Figure 8.
(a) The spatial distributions of ALN, karst and non-karst areas in 2012; (b) the area proportions of ALE, ALN, ALREVI and ALRNDVI of forest between karst and non-karst areas in 2012. The abbreviation: CQ (Chongqing), SC (Sichuan), GZ (Guizhou), YN (Yunnan) and GX (Guangxi).
Figure 8.
(a) The spatial distributions of ALN, karst and non-karst areas in 2012; (b) the area proportions of ALE, ALN, ALREVI and ALRNDVI of forest between karst and non-karst areas in 2012. The abbreviation: CQ (Chongqing), SC (Sichuan), GZ (Guizhou), YN (Yunnan) and GX (Guangxi).

Table 1.
Spatial and temporal resolutions, and sources of datasets.
| Product | Spatial Resolution | Temporal Resolution | Source |
|---|---|---|---|
| MODIS NDVI | 1 km | Monthly | https://lpdaac.usgs.gov/products/mod13a3v006/, accessed date: 18 February 2021 |
| MODIS EVI | 1 km | Monthly | https://lpdaac.usgs.gov/products/mod13a3v006/, accessed date: 18 February 2021 |
| LPRM VOD | 0.25° | Daily | https://hydro1.gesdisc.eosdis.nasa.gov/data/, accessed date: 10 May 2021 |
| Air temperature | 0.1° | Monthly and daily | CFMD (http://data.tpdc.ac.cn/) accessed date: 12 January 2021 |
| Precipitation | 0.1° | Monthly and daily | CFMD (http://data.tpdc.ac.cn/) accessed date: 12 January 2021 |
| Shortwave radiation | 0.1° | Monthly and daily | CFMD (http://data.tpdc.ac.cn/) accessed date: 12 January 2021 |
| SPEI | 0.1° | Monthly | Derived from the method proposed by Vicente-Serrano [18] and using the monthly air temperature and precipitation above |
| Natural forest | 30 m | Single | https://earthenginepartners.appspot.com/science-2013-global-forest/, accessed date: 28 November 2021 |
| Afforestation | 30 m | Single | https://earthenginepartners.appspot.com/science-2013-global-forest/, accessed date: 28 November 2021 |
| Forest distributions | 1 km | Four periods | CNLUCC (https://www.resdc.cn/) accessed date: 20 June 2021 |
Publisher’s Note: MDPI stays neutral with regard to jurisdictional claims in published maps and institutional affiliations. |
© 2021 by the authors. Licensee MDPI, Basel, Switzerland. This article is an open access article distributed under the terms and conditions of the Creative Commons Attribution (CC BY) license (https://creativecommons.org/licenses/by/4.0/).
Share and Cite
MDPI and ACS Style
Jiang, H.; Song, L.; Li, Y.; Ma, M.; Fan, L. Monitoring the Reduced Resilience of Forests in Southwest China Using Long-Term Remote Sensing Data. Remote Sens. 2022, 14, 32. https://doi.org/10.3390/rs14010032
AMA Style
Jiang H, Song L, Li Y, Ma M, Fan L. Monitoring the Reduced Resilience of Forests in Southwest China Using Long-Term Remote Sensing Data. Remote Sensing. 2022; 14(1):32. https://doi.org/10.3390/rs14010032
Chicago/Turabian StyleJiang, Hao, Lisheng Song, Yan Li, Mingguo Ma, and Lei Fan. 2022. "Monitoring the Reduced Resilience of Forests in Southwest China Using Long-Term Remote Sensing Data" Remote Sensing 14, no. 1: 32. https://doi.org/10.3390/rs14010032
Note that from the first issue of 2016, this journal uses article numbers instead of page numbers. See further details here.