
Two-Stage Convolutional Neural Networks for Diagnosing the Severity of Alternaria Leaf Blotch Disease of the Apple Tree


College of Engineering, China Agricultural University, Beijing 100083, China
*
Author to whom correspondence should be addressed.
†
These authors contributed equally to this work.
Remote Sens. 2022, 14(11), 2519; https://doi.org/10.3390/rs14112519
Submission received: 19 April 2022
/
Revised: 13 May 2022
/
Accepted: 23 May 2022
/
Published: 24 May 2022
(This article belongs to the Special Issue Phenotyping Technologies for Resistance Screening, Crop Breeding and Precision Agriculture)
Abstract
:In many parts of the world, apple trees suffer from severe foliar damage each year due to infection of Alternaria blotch (Alternaria alternata f. sp. Mali), resulting in serious economic losses to growers. Traditional methods for disease detection and severity classification mostly rely on manual labor, which is slow, labor-intensive and highly subjective. There is an urgent need to develop an effective protocol to rapidly and accurately evaluate disease severity. In this study, DeeplabV3+, PSPNet and UNet were used to assess the severity of apple Alternaria leaf blotch. For identifications of leaves and disease areas, the dataset with a total of 5382 samples was randomly split into 74% (4004 samples) for model training, 9% (494 samples) for validation, 8% (444 samples) for testing and 8% (440 samples) for overall testing. Apple leaves were first segmented from complex backgrounds using the deep-learning algorithms with different backbones. Then, the recognition of disease areas was performed on the segmented leaves. The results showed that the PSPNet model with MobileNetV2 backbone exhibited the highest performance in leaf segmentation, with precision, recall and MIoU values of 99.15%, 99.26% and 98.42%, respectively. The UNet model with VGG backbone performed the best in disease-area prediction, with a precision of 95.84%, a recall of 95.54% and a MIoU value of 92.05%. The ratio of disease area to leaf area was calculated to assess the disease severity. The results showed that the average accuracy for severity classification was 96.41%. Moreover, both the correlation coefficient and the consistency correlation coefficient were 0.992, indicating a high agreement between the reference values and the value that the research predicted. This study proves the feasibility of rapid estimation of the severity of apple Alternaria leaf blotch, which will provide technical support for precise application of pesticides.
1. Introduction
Apples are one of the most productive fruits worldwide, with high nutritional and medicinal values [1]. In recent years, apple trees have been increasingly attacked by fungal diseases [2,3,4]. Alternaria alternata apple pathotype generates toxins and causes Alternaria blotch on apple leaves, severely affecting apple orchards in Europe, North America and East Asia [5,6]. Alternaria blotch disease was first reported in the USA in 1924 [7]. This disease is characterized by the appearance of small round brown or black lesions that gradually enlarge with a brownish-purple border on leaves in late spring or early summer, resulting in reduction in photosynthesis, severe defoliation and deterioration of fruit quality [8,9]. Currently, management of the Alternaria leaf blotch is mainly carried out by traditional chemical control agents [10]. However, the long-term heavy use of chemicals could lead to numerous hazards, such as soil and water pollution [11], the resistance of tree pathogens [12] and pesticide residues in fruits [13]. Precision spraying [14] and disease-resistance breeding [15] are alternative ways to achieve green and efficient control of apple diseases. As apple cultivars vary in their level of susceptibility to Alternaria blotch, the selection of resistance phenotypes of apple cultivars is of great significance for effective control of this disease. Alternaria leaf blotch is traditionally inspected by experienced experts [16], which means that experts need to carry out sampling inspections of apple leaves carefully [1]. Nevertheless, there is a risk of error owing to subjective perception [17]. A rough assessment of the disease may lead to incorrect conclusions drawn from the data, which in turn is likely to lead to incorrect actions taken in decision making in disease management [18]. Failure to detect and prevent apple diseases in time has a great impact on apple yield and quality, resulting in great economic losses. Thus, reliable and accurate estimations of disease severity are critical for predicting yield losses and epidemics, and for evaluating disease resistance in crop germplasm [18,19].
Computer vision and machine learning have been widely used in agriculture, especially for plant identification and disease evaluation [20,21,22,23,24,25,26,27]. For instance, Gargade and Khandekar [28] proposed a leaf parameter-measurement system that applied k-nearest neighbor (k-NN) and support vector machine (SVM) algorithms to classify apple leaf defects with an accuracy of 99.5%. A multilayer perceptron (MLP) pattern classifier using 11 apple leaf image features was successfully utilized for predicting apple Alternaria leaf blotch [29]. With the development of deep learning (DL), Liu et al. [30] designed an architecture based on the convolutional neural network (CNN) using AlexNet for leaf blotch detection, yielding an accuracy of 91.87%. Later, the accuracy was improved to 95.81% using the single-shot multibox detector (SSD) with Inception module and Rainbow concatenation (INAR-SSD) [16]. Compared to the above models, the XDNet model showed the best performance, with an accuracy of 96.36% in disease identification [31]. Furthermore, CNN-based deep learning has been effectively used for assessments of leaf disease severity. A multiclassification CNN model was developed for severity detection of corn gray leaf spot (CGLS) in maize plants, with the accuracy of 95.33% [32]. Ozguven and Adem [33] developed a system for automatic detection and identification of three levels (mild, moderate and severe) of leaf spot disease of sugar beet. The developed Faster R-CNN achieved an accuracy of 95.48%. However, CNNs have not been employed in the diagnosing of leaf disease severities in apples, especially Alternaria leaf blotch.
In recent years, DL-based image segmentation algorithms have been integrated with agriculture to promote the development of smart agriculture. Esgario et al. [34] used different CNN architectures to estimate the severity of the biotic stress on coffee leaves. The trained network of residual network (ResNet)-50 obtained the best results with an accuracy of 97.07%. Later, three CNN models, namely AlexNet, SqueezeNet and Inception V3, were used to evaluate disease severity of tomato late blight disease [35]. Results showed that AlexNet demonstrated the highest performance, with an accuracy of 93.4%. Based on binary relevance (BR) multiple-label learning algorithms and deep CNN, Ji et al. [6] proposed a BR-CNN algorithm using ResNet-50 to detect crop leaves with three disease severities (normal, fair and severe), yielding the best accuracy of 86.70%. In a recent study, Su et al. [36] used a dual mask-RCNN framework to automatically assess the resistance of wheat to Fusarium head blight. The protocol achieved a prediction accuracy of 77.19%, but the accuracy should be further improved. In another study, a two-stage framework incorporating DeepLabV3+ and UNet was proposed for severity classification of cucumber leaf disease and reached the classification accuracy of 92.85% [37], but other effective methods, including pyramid scene parsing network (PSPNet) and the analysis of confusion matrix and the Lin’s correlation coefficient, were not considered in their study.
The novelty of this research lies in the development of an integrated CNN-based method for estimating the severity of apple Alternaria leaf blotch in complex field conditions. The main objectives are as follows: (1) propose a two-stage CNN protocol for segmentation of feature images with complex backgrounds; (2) annotate apple leaves and disease areas in the images; (3) develop an optimal model that works well in detecting and segmenting apple leaves under complex backgrounds; (4) build another optimal model that is effective for segmenting disease regions of sub-images; (5) evaluate the disease level of apple Alternaria leaf blotch based on the ratio of disease areas to leaves; (6) assess the performance of the two-stage framework based on Lin’s correlation coefficient analysis and confusion matrix.
2. Materials and Methods
The main steps and methodology involved in this study are described below. The leaves in the dataset were manually annotated first. Then, different CNN models were trained based on the annotated images. The most accurate model for leaf segmentation was selected. Similarly, the diseased areas in the segmented leaves were manually annotated. Then, an optimal model for disease segmentation was determined based on the evaluation of the performance of different models. Afterwards, the disease degree of the leaves was obtained based on the calculation of the ratio of the disease area to the leaf area. The accuracy of disease grades was assessed using confusion matrix and the Lin’s correlation coefficient, eventually.
2.1. Data Annotation and Examination
The dataset consists of 5382 images of healthy leaves and disease cases, with 4942 original images noted as dataset I and the other 440 images for overall validation. Among them, 3587 images were taken in the orchard, while the remaining 1795 were acquired in the lab. The dataset is publicly available for noncommercial use (https://aistudio.baidu.com/aistudio/datasetdetail/11591, accessed on 29 October 2021). All images used in this study are 512 × 512 pixels in size. All image annotations were performed by using manual image-annotation software (Labelme, https://github.com/wkentaro/labelme, accessed on 3 November 2021). Image annotation consisted of three steps. In the first step, the apple leaves in dataset I were annotated. The JSON files annotated using Labelme were converted to PNG tags and the leaves were separated from the background by image fusion. A single image containing multiple leaves was saved as a single-leaf image (only one leaf contained in each image). The set of all single-leaf images was regarded as dataset II, which had the same number of images as dataset I. In the second step, the leaf lesions on dataset II were annotated. For detections of the apple leaf and disease area, the number of 4004, 494 and 444 images in both dataset I and II were randomly selected for model training, validation and testing, respectively. The results of labeling of leaves and disease spots were shown in Figure 1.
2.2. Deep-Learning Algorithms
PSPNet [38] is a deep-learning model released in 2017 dedicated to semantic segmentation on scene understanding [39]. The core structure contains the pyramid pool module and a backbone feature network [40]. The structure is shown in Figure 2a. Given an input image, the CNN is first used to obtain the feature map of the final convolutional layer. A pyramid parsing module is then employed to obtain different subregion representations, proceeded by upsampling and concatenation layers to form the final feature representation, containing both local and global information in pyramid pooling module. Eventually, this representation is sent to the convolutional layer to obtain the final per-pixel prediction. The backbones of the study used in PSPNet are MobileNetV2 [41] and ResNet [42]. MobileNetV2 is a new mobile architecture providing improved state-of-the-art capabilities of mobile models across multiple tasks and benchmarks and across a range of model sizes, while ResNet is able to improve accuracy by adding considerable depth. The residual blocks within it use jump connections, which alleviate the problem of gradient disappearance associated with increasing depth in deep neural networks.
UNet is a semantic segmentation network built based on fully convolutional networks (FCN) with a typical encoder–decoder architecture. The encoder part consists of repeating convolutional layers with a kernel size of 3 × 3. Each convolutional layer is followed by a 2 × 2 maximum pooling with a step size of 2, which gradually reduces the patch size. The part of the decoder contains up sampling operations for the 2 × 2 convolution, which halves the number of feature channels. The overall structure of the UNet used in this study is shown in Figure 2b, and the reason for choosing UNet is that the original images are plain RGB images, which can achieve a satisfying segmentation result without using complex models such as Mask RCNN or V-Net [43]. Although UNet can segment pixels accurately, the detection process for each pixel-centered region is required. In addition, the overlap of some central regions can lead to redundant operations, causing slow and inefficient operation. ResNet is also used as the backbone in UNet. Another one is visual geometry group (VGG) [44], a deep convolutional neural network instrumented by researchers at Oxford University’s Computer Vision Group and Google DeepMind, which takes previous models (e.g., AlexNet) and deepens them so that they can have better model generalization and ultimately achieve a smaller classification error rate.
DeepLabV3+ [45] is a semantic segmentation network based on DeepLabV3 [46], adding a simple and efficient Decoder to refine the segmentation results, especially along the target object boundaries, as well as a two-in-one implementation using a spatial pyramid pooling module or a codec structure. DeepLabV3+ network consists of two parts: encoding and decoding module. The coding module consists of a backbone and an Atrous Spatial Pyramid Pool (ASPP). In the study, MobileNetV2 and Xception [47] are used as the backbones. Xception is an improved model of InceptionV3 [48] proposed by Google after Inception, whose main improvement is to use depthwise separable convolution to replace the multisize convolutional kernel feature-response operation in the original Inception V3. While the accuracy is slightly higher than that of Inception V3, the number of parameters has been reduced.
2.3. Evaluation Metrics
A few factors were used to evaluate the performance of the CNN-based segmentation model. The false negative (FN), false positive (FP) and true positive (TP) were calculated and used to generate metrics including Recall and Precision. Recall (also known as sensitivity) is the proportion of TP instances out of the total number of positive instances that actually belong to the positive category, whereas Precision (also known as positive predictive value) is the proportion of real positive instances out of the total number of positive instances predicted to belong to the positive category. The average intersection over union (MIoU) is a fundamental metric for assessing picture segmentation performance [49]. MIoU is calculated as the TP number of the sum of TP, FN and FP. The MIoU, precision and recall can be presented in the following equations:
where TP corresponds to the number of true positives generated (i.e., the number of pixel points correctly detected), FP represents the number of pixel points incorrectly identified, FN is the number of pixel points undetected but that should have been identified, is the number of divided categories of pixels and is reference category of a pixel.
2.4. Apple Alternaria Leaf Blotch Severity Classification Method
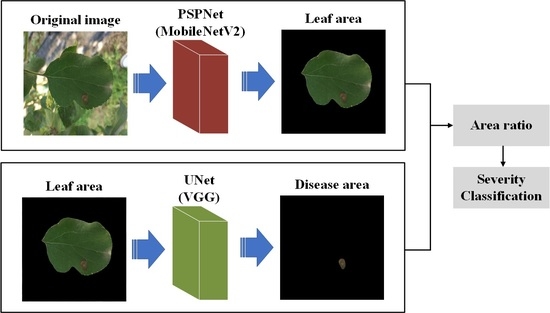
The ratio of disease area to leaf area was used for disease-severity evaluation. The obtained ratios of disease severity were classified to five grades, namely healthy (0), early (0–0.95%), mild (0.95–1.75%), moderate (1.75–3.00%) and severe (3.00–100%). The severity classification of apple Alternaria leaf blotch was divided into two stages. In the first stage, the images used for prediction were fed into various models, and the predictions were output and fused with the original images. The leaves were segmented and the pixel areas of the leaf images were calculated; in the second stage, the segmented image was input to the same models as in the first stage. After selecting the best model in both stages, the prediction result was output for calculation. The area ratio of leaf lesions was calculated and the grade was judged according to the threshold value delineated. The calculation formula is shown in Equation (4).
where represents the area of apple leaves after segmentation; represents apple Alternaria leaf blotch areas after segmentations; represents the ratio of disease areas over apple leaves. The whole flow of the section is shown in Figure 3.
2.5. Equipment
The entire process of model training and validation was implemented on a personal computer (processor: Intel® CoreTM i7-10750H CPU @ 2.60 GHz 2.59 GHz; operating system: Windows 11 64 bits; memory: 16 Gb). The training speed was optimized in graphics processing unit (GPU) mode (NVIDIA GeForce RTX 2060 6 Gb). Table 1 presents the detailed modeling parameters such as input batch size, base learning rate and maximum iterations. Moreover, the code for image processing was coded in Python.
3. Results
3.1. Model Training
Six different CNN-based segmentation models were established based on the labeled images of leaves and disease areas. Figure 4a shows the trend of loss of apple leaves identification. It was observed that the loss curves of all models gradually stabilized with increasing values of epochs. Specifically, the DeepLabV3+ (Xception) network converged the fastest but exhibited the highest loss values, which gradually stabilized after 30 epochs. The PSPNet (ResNet) network also gradually stabilized around 30 epochs, and the network converged the second fastest in the 6 models but also ended up with the second-highest loss values after DeepLabV3+ (Xception). The UNet converged slower overall and stabilized after the 60th epoch with the lowest final loss value. The PSPNet (MobileNetV2) network converged slowly at first but had the lowest loss value and eventually achieved a lower loss value as well. However, the UNet (VGG) network demonstrated a clear advantage for disease-area identification as shown in Figure 4b. Images with labeled disease areas were used to train the same models. The UNet (VGG) network had the lowest loss value. PSPNet (MobileNetV2) network reached the fastest convergence speed and the highest loss value, which was relatively stable after the 30th epoch, whereas the rest of the models converged at similar rates and were stable after epoch 50.
3.2. Leaf and Disease-Area Identification
Similar to other studies of crop-severity quantification, the validation loss fluctuated a great deal in the early training stage (20 epochs) and then slowly converged at the end of training. It can be seen from Figure 5a that the DeepLabV3+ (Xception) network exhibited the highest loss values, converged slowly and stabilized relatively after 20 epochs. PSPNet (ResNet) had the fastest convergence rate and gradually stabilized around the 40th epoch. The UNet (VGG) network converged faster than the former and eventually achieved the second-highest loss value. The PSPNet (MobileNetV2) network and DeeplabV3+ (MobileNetV2) network exhibited similar overall convergence trends with the lowest loss values, stabilizing after 30 epochs. Similarly, the loss values of all models were undulating with the overall trend remaining decreasing in the second stage. As shown in Figure 5b, the UNet (VGG) network still maintained the lowest loss value. In the early stage, the DeeplabV3+ (Xception) network showed the fastest convergence rate and the highest loss value. After the 30th epoch, the loss values of DeeplabV3+ (Xception), PSPNet (MobileNetV2), and PSPNet (ResNet) networks were very close and relatively stable. The UNet (ResNet) network maintained similar convergence speed as UNet (VGG), but the loss values were always higher than UNet (VGG).
The trained CNN-based segmentation models were then used to recognize apple leaves and disease areas in the test set. The failures of the proposed approach for targeted region identification were also evaluated. Figure 6 presented the selected examples of incorrect segmentation of apple leaves. FP were detection failures (blue circles) caused by various factors, such as missing annotations on slightly blurred leaves due to human error and blurred edges due to ambient lighting, while the unpredicted areas (red circle) were the FN due to the model error. It was clear that PSPNet with MobileNet backbone had the least misidentification for the same original image, while DeeplabV3+ (MobileNetV2) had the most incorrectly predicted regions. However, different results occurred when the disease areas were predicted. As shown in Figure 7, UNet with VGG backbone showed the least incorrectly predicted and unpredicted parts. PSPNet with MobileNet backbone, which performed best for apple leaf prediction, had the most frequent incorrectly predicted areas. DeeplabV3+ (MobileNetV2) still did not show excessive prediction errors, but the unpredicted areas were more numerous. In summary, PSPNet with MobileNet backbone performed best in leaf identification, while UNet with VGG backbone showed excellent performance in disease-area recognition in terms of image recognition.
All models were evaluated comprehensively in terms of precision, recall and MIoU. Table 2 showed the results of apple leaf recognition by three models based on different backbone networks. The performance of all three models in identifying leaves was excellent. PSPNet with MobileNetV2 backbone achieved the highest precision and MIoU of 99.15% and 98.42%, respectively, followed by UNet with ResNet backbone, having a precision and MIoU of 99.12% and 98.41%, respectively. The result indicated that PSPNet with MobileNetV2 backbone was the optimal model from comparison. However, in the second stage, UNet with VGG backbone showed better performance than the best model of the first stage. As shown in Table 3, UNet with VGG backbone achieved the highest recall and MIoU of 95.54% and 92.05%, respectively. This indicated that the UNet (ResNet) demonstrated strong potential in identifying disease spots.
Upon comparison, the PSPNet based on MobileNetV2 and the UNet based on VGG demonstrated a clear advantage in the two stages, respectively. For the next section, the examination of apple Alternaria leaf blotch severity is provided based on the two models selected.
3.3. Examination of Apple Alternaria Leaf Blotch Severity
Apple Alternaria leaf blotch severity was evaluated based on the ratio of the disease area to the apple leaf area. After selecting the best models in the two stages, 440 images of apple leaves were used as the total examination object. Since there were several leaves in one image, each leaf was segmented by number, resulting in 446 individual leaf images. The predicted severity was checked and compared with the hand-labeled severity to calculate the classification accuracy of the model. The results of the study are shown in Table 4.
Correct grading denotes the number of correctly categorized images; data quantity denotes the total number of photos of this category; accuracy is equal to the ratio of these two values.
When the disease spot area is too large, there is no need to use deep-learning methods for classification. The very few data points at this time would bring large errors to the fit, so a few data with relatively large areas were discarded. The relationship between the reference value of the area ratio and the predicted values measured by the proposed system is shown in Figure 8. For the area ratio, the predictions are in close agreement with the reference values. Both the correlation coefficient and the consistency correlation coefficient are 0.992 (. , which is close to zero, indicating no constant bias. As the median value of the sample increases, the calculated index is increasingly underestimated. Thus, the slope of the estimated value is slightly lower than the correlation line.
The two-stage model selected obtained an overall accuracy of 96.41% on the overall test dataset. Specifically, accuracies of 100%, 97.81%, 91.54%, 95.89% and 97.92% were obtained at five levels, respectively. As shown in Figure 9, there was a risk that mild-stage samples were easily misclassified as the early stage. Possible reasons for this fact were that the early and mild stages had similar area ratios. Moreover, the extremely small area of disease spots could easily lead to misidentification. Typically, misclassified samples were only confused with their neighboring labels. As an example, samples of mild stage were only confused with samples of early and moderate stages. The confounding between adjacent labels had a significant impact on the overall error, which mainly originated from the segmentation error, but was shown to be within the permissible limits.
4. Discussion
The research proposed a new approach using a two-stage CNN framework for automatic severity estimation of apple Alternaria leaf blotch in the field. This study addressed an issue that consists of three main parts: leaf segmentation, disease segmentation and disease-severity classification. The performance of three CNN algorithms, including DeeplabV3+ with MobileNetV2 or Xception backbone, PSPNet with MobileNetV2 or ResNet backbone, and UNet with ResNet or VGG backbone, were investigated and compared in segmentations of regions of interest. The results showed that the PSPNet with MobileNetV2 was the best model in leaf detection while the UNet with VGG obtained the highest accuracy in disease-area assessment. Based on the selected PSPNet–UNet framework, an excellent result in disease-severity classification was achieved. However, data annotation is laborious, time-consuming and complex. In the future, more advanced algorithms should be developed for automatic annotation of regions of interest. Although the model used in this study was able to identify lesions effectively, there were incorrect segmentations for small or inconspicuous lesions. Future research should focus more on improving the segmentation performance of the algorithm for extremely small targets and detailed parts.
The two-stage PSPNet–UNet framework used in the study performed very well, yielding an accuracy as high as 96.41% compared to the other studies shown in Table 5. In a recent study, Hayit et al. [50] proposed a deep CNN-based model, Yellow-Rust-Xception, to classify wheat leaf rust severity (i.e., percentage) with the accuracy of 91%. ResNet-101 was used to measure the severity of early wilt disease in tomato leaves [51] and achieved an accuracy of 94.6%. Although the above studies performed well in identifying the severity of plant diseases, the accuracy was lower than the protocol proposed in the current study. Quantitative separation and calculation of visible symptoms were used to assess the plant disease severity. A vision system was designed for segmenting abnormal leaves of hydroponic lettuce [52] using the DeepLabV3+ model with four backbones, including ResNet-50, ResNet-101, Xception-65 and Xception-71. ResNet-101 showed the best segmentation performance in the uniform weight (UW) assignment approach with an accuracy of 99.24% and MIoU of 0.8326. Later, Ji and Wu [53] proposed an effective automatic detection and severity analysis method for grapevine black measles disease using the DeepLabV3 + with ResNet-50 backbone, yielding an overall classification accuracy of 97.75%. Different from the single-stage segmentation method described above, the proposed method in the current study for apple Alternaria leaf blotch severity analysis used a two-stage protocol. The PSPNet model with MobileNetV2 backbone successfully separated apple leaves and background, and the UNet model with VGG backbone effectively separated the disease spots and leaves, which indicates that this protocol can achieve accurate segmentation of leaves and lesions, enabling a more objective assessment of plant disease severity.
The results of this study show that the developed framework has great potential for real-time assessment of apple Alternaria leaf blotch severity. Since this study is only an initial work, most of the images contain only one leaf. Further research will be carried out shortly using imaged with multiple leaves in a complex background. The segmentation of one or more leaves mainly depends on whether the leaves in the image are not out of focus and complete, which is conducive to the accurate identification of the diseased area. A portable device is expected to be designed in the near future. Images readily captured by the RGB camera of the device would be sent wirelessly to the microcomputer. After model calculation, the real-time assessment result of the disease level should be seen on the device. The developed device in future would be deployed on a mobile robot used in the orchard. The robot is expected to apply different dosages of pesticide to the apple trees according to their overall disease severities. Ideally the device should be lightweight and low-cost. A remote-detection advisory system is planned to extend the potential of DL and image segmentation for applications in agriculture. In addition, edge computing is expected to be integrated for online use in future study. The implementation of relevant research will significantly improve the efficiency and accuracy of pesticide spraying, which will contribute to the green development of agriculture, environmental protection and food safety.
5. Conclusions
A two-stage CNN framework for automatic severity estimation of apple Alternaria leaf blotch in complex contexts was developed. Compared with DeeplabV3+ (MobileNetV2 and Xception), PSPNet (ResNet) and UNet (ResNet), the PSPNet model with MobileNetV2 backbone exhibited the highest precision, recall and MIoU values of 99.15%, 99.26% and 98.42% in leaf segmentations, respectively. The UNet model with VGG backbone showed the best performance in disease-area detection with a precision of 95.84%, recall of 95.54% and MIoU value of 92.05%. The model integrating PSPNet (MobileNetV2) and UNet (VGG) demonstrated a strong capacity to identify leaf and disease areas. The classification accuracy from healthy to severe was 100%, 97.81%, 91.54%, 95.89% and 97.92%, respectively, and the average accuracy reached 96.41%. In addition, both the correlation coefficient and the consistency correlation coefficient were 0.992 based on the Lin’s correlation coefficient analysis, indicating a high agreement between the reference values and the predicted values of the proposed system measurements. The knowledge generated from this study will greatly aid in the accurate classification of apple Alternaria leaf blotch severity. In addition, the technical support will be provided for accurate application of pesticides, which in turn will be a powerful contribution to the protection of the environment and global food security.
Author Contributions
Conceptualization, W.-H.S.; methodology, B.-Y.L.; software, B.-Y.L.; validation, B.-Y.L.; formal analysis, K.-J.F.; investigation, B.-Y.L.; resources, W.-H.S.; writing—original draft preparation, K.-J.F.; writing—review and editing, K.-J.F., W.-H.S. and Y.P.; supervision, W.-H.S.; project administration, W.-H.S.; funding acquisition, W.-H.S. All authors have read and agreed to the published version of the manuscript.
Funding
This research was funded by National Natural Science Foundation of China (grant number 32101610).
Data Availability Statement
Data are available on request due to privacy.
Conflicts of Interest
The authors declare no conflict of interest.
References
- Bi, C.; Wang, J.; Duan, Y.; Fu, B.; Kang, J.-R.; Shi, Y. MobileNet based apple leaf diseases identification. Mob. Netw. Appl. 2020, 27, 172–180. [Google Scholar] [CrossRef]
- Norelli, J.L.; Farrell, R.E.; Bassett, C.L.; Baldo, A.M.; Lalli, D.A.; Aldwinckle, H.S.; Wisniewski, M.E. Rapid transcriptional response of apple to fire blight disease revealed by cDNA suppression subtractive hybridization analysis. Tree Genet. Genomes 2009, 5, 27–40. [Google Scholar] [CrossRef]
- Hou, Y.; Zhang, X.; Zhang, N.; Naklumpa, W.; Zhao, W.; Liang, X.; Zhang, R.; Sun, G.; Gleason, M. Genera Acremonium and Sarocladium cause brown spot on bagged apple fruit in China. Plant Dis. 2019, 103, 1889–1901. [Google Scholar] [CrossRef] [PubMed]
- Xu, X. Modelling and forecasting epidemics of apple powdery mildew (Podosphaera leucotricha). Plant Pathol. 1999, 48, 462–471. [Google Scholar] [CrossRef]
- Grove, G.G.; Eastwell, K.C.; Jones, A.L.; Sutton, T.B. 18 Diseases of Apple. In Apples: Botany, Production, and Uses; CABI Publishing Oxon: Wallingford, UK, 2003; pp. 468–472. [Google Scholar]
- Ji, M.; Zhang, K.; Wu, Q.; Deng, Z. Multi-label learning for crop leaf diseases recognition and severity estimation based on convolutional neural networks. Soft Comput. 2020, 24, 15327–15340. [Google Scholar] [CrossRef]
- Roberts, J.W. Morphological characters of Alternaria mali Roberts. J. Agric. Res. 1924, 27, 699–708. [Google Scholar]
- Jung, K.-H. Growth inhibition effect of pyroligneous acid on pathogenic fungus, Alternaria mali, the agent of Alternaria blotch of apple. Biotechnol. Bioprocess Eng. 2007, 12, 318–322. [Google Scholar] [CrossRef]
- Zhang, S.; Zhang, Y.; Liu, H.; Han, J. Isolation of Alternaria mali Roberts and its sensitivities to four fungicides. J. Shanxi Agric. Univ. 2004, 24, 382–384. [Google Scholar]
- Zhang, C.-X.; Tian, Y.; Cong, P.-H. Proteome analysis of pathogen-responsive proteins from apple leaves induced by the alternaria blotch Alternaria alternata. PLoS ONE 2015, 10, e0122233. [Google Scholar] [CrossRef]
- Lu, Y.; Song, S.; Wang, R.; Liu, Z.; Meng, J.; Sweetman, A.J.; Jenkins, A.; Ferrier, R.C.; Li, H.; Luo, W. Impacts of soil and water pollution on food safety and health risks in China. Environ. Int. 2015, 77, 5–15. [Google Scholar] [CrossRef] [Green Version]
- Sutton, T.B. Changing options for the control of deciduous fruit tree diseases. Annu. Rev. Phytopathol. 1996, 34, 527–547. [Google Scholar] [CrossRef] [PubMed]
- Kaushik, G.; Satya, S.; Naik, S. Food processing a tool to pesticide residue dissipation—A review. Food Res. Int. 2009, 42, 26–40. [Google Scholar] [CrossRef]
- Mahmud, M.S.; Zahid, A.; He, L.; Martin, P. Opportunities and possibilities of developing an advanced precision spraying system for tree fruits. Sensors 2021, 21, 3262. [Google Scholar] [CrossRef] [PubMed]
- Pathania, A.; Rialch, N.; Sharma, P. Marker-assisted selection in disease resistance breeding: A boon to enhance agriculture production. In Current Developments in Biotechnology and Bioengineering; Elsevier: Amsterdam, The Netherlands, 2017; pp. 187–213. [Google Scholar]
- Jiang, P.; Chen, Y.; Liu, B.; He, D.; Liang, C. Real-time detection of apple leaf diseases using deep learning approach based on improved convolutional neural networks. IEEE Access 2019, 7, 59069–59080. [Google Scholar] [CrossRef]
- Dutot, M.; Nelson, L.; Tyson, R. Predicting the spread of postharvest disease in stored fruit, with application to apples. Postharvest Biol. Technol. 2013, 85, 45–56. [Google Scholar] [CrossRef]
- Bock, C.; Poole, G.; Parker, P.; Gottwald, T. Plant disease severity estimated visually, by digital photography and image analysis, and by hyperspectral imaging. Crit. Rev. Plant Sci. 2010, 29, 59–107. [Google Scholar] [CrossRef]
- Ampatzidis, Y.; De Bellis, L.; Luvisi, A. iPathology: Robotic applications and management of plants and plant diseases. Sustainability 2017, 9, 1010. [Google Scholar] [CrossRef] [Green Version]
- Su, W.-H.; Yang, C.; Dong, Y.; Johnson, R.; Page, R.; Szinyei, T.; Hirsch, C.D.; Steffenson, B.J. Hyperspectral imaging and improved feature variable selection for automated determination of deoxynivalenol in various genetic lines of barley kernels for resistance screening. Food Chem. 2021, 343, 128507. [Google Scholar] [CrossRef]
- Su, W.-H.; Sheng, J.; Huang, Q.-Y. Development of a Three-Dimensional Plant Localization Technique for Automatic Differentiation of Soybean from Intra-Row Weeds. Agriculture 2022, 12, 195. [Google Scholar] [CrossRef]
- Su, W.-H. Advanced Machine Learning in Point Spectroscopy, RGB-and hyperspectral-imaging for automatic discriminations of crops and weeds: A review. Smart Cities 2020, 3, 767–792. [Google Scholar] [CrossRef]
- Su, W.-H.; Slaughter, D.C.; Fennimore, S.A. Non-destructive evaluation of photostability of crop signaling compounds and dose effects on celery vigor for precision plant identification using computer vision. Comput. Electron. Agric. 2020, 168, 105155. [Google Scholar] [CrossRef]
- Su, W.-H.; Fennimore, S.A.; Slaughter, D.C. Development of a systemic crop signalling system for automated real-time plant care in vegetable crops. Biosyst. Eng. 2020, 193, 62–74. [Google Scholar] [CrossRef]
- Su, W.-H.; Sun, D.-W. Advanced analysis of roots and tubers by hyperspectral techniques. In Advances in Food and Nutrition Research; Elsevier: Amsterdam, The Netherlands, 2019; Volume 87, pp. 255–303. [Google Scholar]
- Su, W.-H.; Zhang, J.; Yang, C.; Page, R.; Szinyei, T.; Hirsch, C.D.; Steffenson, B.J. Evaluation of Mask RCNN for Learning to Detect Fusarium Head Blight in Wheat Images. In Proceedings of the 2020 ASABE Annual International Virtual Meeting, Online, 13–15 July 2020; American Society of Agricultural and Biological Engineers: St. Joseph, MI, USA, 2020; p. 1. [Google Scholar]
- Su, W.-H. Crop plant signaling for real-time plant identification in smart farm: A systematic review and new concept in artificial intelligence for automated weed control. Artif. Intell. Agric. 2020, 4, 262–271. [Google Scholar] [CrossRef]
- Gargade, A.; Khandekar, S. Custard apple leaf parameter analysis, leaf diseases, and nutritional deficiencies detection using machine learning. In Advances in Signal and Data Processing; Springer: Berlin/Heidelberg, Germany, 2021; pp. 57–74. [Google Scholar]
- Jan, M.; Ahmad, H. Image Features Based Intelligent Apple Disease Prediction System: Machine Learning Based Apple Disease Prediction System. Int. J. Agric. Environ. Inf. Syst. (IJAEIS) 2020, 11, 31–47. [Google Scholar] [CrossRef]
- Liu, B.; Zhang, Y.; He, D.; Li, Y. Identification of apple leaf diseases based on deep convolutional neural networks. Symmetry 2018, 10, 11. [Google Scholar] [CrossRef] [Green Version]
- Chao, X.; Sun, G.; Zhao, H.; Li, M.; He, D. Identification of apple tree leaf diseases based on deep learning models. Symmetry 2020, 12, 1065. [Google Scholar] [CrossRef]
- Baliyan, A.; Kukreja, V.; Salonki, V.; Kaswan, K.S. Detection of Corn Gray Leaf Spot Severity Levels using Deep Learning Approach. In Proceedings of the 2021 9th International Conference on Reliability, Infocom Technologies and Optimization (Trends and Future Directions) (ICRITO), Noida, India, 3–4 September 2021; pp. 1–5. [Google Scholar]
- Ozguven, M.M.; Adem, K. Automatic detection and classification of leaf spot disease in sugar beet using deep learning algorithms. Phys. A Stat. Mech. Its Appl. 2019, 535, 122537. [Google Scholar] [CrossRef]
- Esgario, J.G.; Krohling, R.A.; Ventura, J.A. Deep learning for classification and severity estimation of coffee leaf biotic stress. Comput. Electron. Agric. 2020, 169, 105162. [Google Scholar] [CrossRef] [Green Version]
- Verma, S.; Chug, A.; Singh, A.P. Application of convolutional neural networks for evaluation of disease severity in tomato plant. J. Discret. Math. Sci. Cryptogr. 2020, 23, 273–282. [Google Scholar] [CrossRef]
- Su, W.-H.; Zhang, J.; Yang, C.; Page, R.; Szinyei, T.; Hirsch, C.D.; Steffenson, B.J. Automatic evaluation of wheat resistance to fusarium head blight using dual mask-RCNN deep learning frameworks in computer vision. Remote Sens. 2020, 13, 26. [Google Scholar] [CrossRef]
- Wang, C.; Du, P.; Wu, H.; Li, J.; Zhao, C.; Zhu, H. A cucumber leaf disease severity classification method based on the fusion of DeepLabV3+ and U-Net. Comput. Electron. Agric. 2021, 189, 106373. [Google Scholar] [CrossRef]
- Zhao, H.; Shi, J.; Qi, X.; Wang, X.; Jia, J. Pyramid scene parsing network. In Proceedings of the IEEE Conference on Computer Vision and Pattern Recognition, Honolulu, HI, USA, 21–26 July 2017; pp. 2881–2890. [Google Scholar]
- Picon, A.; San-Emeterio, M.G.; Bereciartua-Perez, A.; Klukas, C.; Eggers, T.; Navarra-Mestre, R. Deep learning-based segmentation of multiple species of weeds and corn crop using synthetic and real image datasets. Comput. Electron. Agric. 2022, 194, 106719. [Google Scholar] [CrossRef]
- Lv, Q.; Wang, H. Cotton Boll Growth Status Recognition Method under Complex Background Based on Semantic Segmentation. In Proceedings of the 2021 4th International Conference on Robotics, Control and Automation Engineering (RCAE), Wuhan, China, 4–6 November 2021; pp. 50–54. [Google Scholar]
- Sandler, M.; Howard, A.; Zhu, M.; Zhmoginov, A.; Chen, L.-C. Mobilenetv2: Inverted residuals and linear bottlenecks. In Proceedings of the IEEE Conference on Computer Vision and Pattern Recognition, Salt Lake City, UT, USA, 18–22 June 2018; pp. 4510–4520. [Google Scholar]
- He, K.; Zhang, X.; Ren, S.; Sun, J. Deep residual learning for image recognition. In Proceedings of the IEEE Conference on Computer Vision and Pattern Recognition, Las Vegas, NV, USA, 26 June–1 July 2016; pp. 770–778. [Google Scholar]
- Milletari, F.; Navab, N.; Ahmadi, S.-A. V-net: Fully convolutional neural networks for volumetric medical image segmentation. In Proceedings of the 2016 Fourth International Conference on 3D Vision (3DV), Stanford, CA, USA, 25–28 October 2016; pp. 565–571. [Google Scholar]
- Simonyan, K.; Zisserman, A. Very deep convolutional networks for large-scale image recognition. arXiv 2014, arXiv:1409.1556. [Google Scholar]
- Chen, L.-C.; Zhu, Y.; Papandreou, G.; Schroff, F.; Adam, H. Encoder-Decoder with Atrous Separable Convolution for Semantic Image Segmentation. In Proceedings of the European Conference on Computer Vision (ECCV), Munich, Germany, 8–14 September 2018. [Google Scholar]
- Chen, L.-C.; Papandreou, G.; Schroff, F.; Adam, H. Rethinking atrous convolution for semantic image segmentation. arXiv 2017, arXiv:1706.05587. [Google Scholar]
- Chollet, F. Xception: Deep learning with depthwise separable convolutions. In Proceedings of the IEEE Conference on Computer Vision and Pattern Recognition, Honolulu, HI, USA, 21–26 July 2017; pp. 1251–1258. [Google Scholar]
- Xia, X.; Xu, C.; Nan, B. Inception-v3 for flower classification. In Proceedings of the 2017 2nd International Conference on Image, Vision and Computing (ICIVC), Chengdu, China, 2–4 June 2017; pp. 783–787. [Google Scholar]
- Garcia-Garcia, A.; Orts-Escolano, S.; Oprea, S.; Villena-Martinez, V.; Garcia-Rodriguez, J. A review on deep learning techniques applied to semantic segmentation. arXiv 2017, arXiv:1704.06857. [Google Scholar]
- Hayit, T.; Erbay, H.; Varçın, F.; Hayit, F.; Akci, N. Determination of the severity level of yellow rust disease in wheat by using convolutional neural networks. J. Plant Pathol. 2021, 103, 923–934. [Google Scholar] [CrossRef]
- Prabhakar, M.; Purushothaman, R.; Awasthi, D.P. Deep learning based assessment of disease severity for early blight in tomato crop. Multimed. Tools Appl. 2020, 79, 28773–28784. [Google Scholar] [CrossRef]
- Wu, Z.; Yang, R.; Gao, F.; Wang, W.; Fu, L.; Li, R. Segmentation of abnormal leaves of hydroponic lettuce based on DeepLabV3+ for robotic sorting. Comput. Electron. Agric. 2021, 190, 106443. [Google Scholar] [CrossRef]
- Ji, M.; Wu, Z. Automatic detection and severity analysis of grape black measles disease based on deep learning and fuzzy logic. Comput. Electron. Agric. 2022, 193, 106718. [Google Scholar] [CrossRef]
- Nigam, S.; Jain, R.; Prakash, S.; Marwaha, S.; Arora, A.; Singh, V.K.; Singh, A.K.; Prakasha, T. Wheat Disease Severity Estimation: A Deep Learning Approach. In Proceedings of the International Conference on Internet of Things and Connected Technologies, Patna, India, 29–30 July 2021; pp. 185–193. [Google Scholar]
- Ramcharan, A.; McCloskey, P.; Baranowski, K.; Mbilinyi, N.; Mrisho, L.; Ndalahwa, M.; Legg, J.; Hughes, D.P. A mobile-based deep learning model for cassava disease diagnosis. Front. Plant Sci. 2019, 10, 272. [Google Scholar] [CrossRef] [Green Version]
- Hu, G.; Wang, H.; Zhang, Y.; Wan, M. Detection and severity analysis of tea leaf blight based on deep learning. Comput. Electr. Eng. 2021, 90, 107023. [Google Scholar] [CrossRef]
- Zeng, Q.; Ma, X.; Cheng, B.; Zhou, E.; Pang, W. Gans-based data augmentation for citrus disease severity detection using deep learning. IEEE Access 2020, 8, 172882–172891. [Google Scholar] [CrossRef]
Figure 1.
Results of labeling of leaves and disease spots.

Figure 2.
The structure of (a) pyramid scene parsing network (PSPNet) and (b) UNet. The selected neural networks were trained by the cropped images (512 × 512) obtained from the original images and then cut with multiple scales.
Figure 2.
The structure of (a) pyramid scene parsing network (PSPNet) and (b) UNet. The selected neural networks were trained by the cropped images (512 × 512) obtained from the original images and then cut with multiple scales.

Figure 3.
The whole process of calculating apple Alternaria leaf blotch severity.

Figure 4.
Training curves of loss against number of epochs on identifications of (a) apple leaves and (b) disease areas.
Figure 4.
Training curves of loss against number of epochs on identifications of (a) apple leaves and (b) disease areas.

Figure 5.
Validation curves of loss against number of epochs on identifications of (a) apple leaves and (b) disease areas.
Figure 5.
Validation curves of loss against number of epochs on identifications of (a) apple leaves and (b) disease areas.

Figure 6.
The prediction examples of DeeplabV3+ (MobileNetV2), PSPNet (MobileNetV2) and UNet (VGG) for apple leaves: the leaf area with the blue circle has only the base truth with no predicted results, which is a false negative (FN), and the red circled leaf area only has the predicted result with no base fact, which is false positive (FP).

Figure 7.
The prediction examples of DeeplabV3+ (MobileNetV2), PSPNet (MobileNetV2) and UNet (VGG) for disease areas: the disease area with the blue circle has only the base truth with no predicted results, which is a false negative (FN), and the red circled disease area only has the predicted result with no base fact, which is false positive (FP).

Figure 8.
Scatter plot of the relationship between predicted values calculated from the PSPNet and UNet models at the pixel level and the reference value of the area ratio obtained by manually annotating each pixel of the image on the same leaf. The black dashed line (45°, where slope = 1 and intercept = 0) indicates the line of perfect agreement. The solid red line indicates the best–fit first–order regret line. These statistics represent the Lin’s correlation coefficient analysis within the 95% confidence interval.

Figure 9.
Confusion matrices for apple Alternaria leaf blotch severity classification.


Table 1.
Settings of modeling parameters for identifications of leaves and disease areas.
| Modeling Parameters | Values |
|---|---|
| Number of training samples | 4004 |
| Number of validation samples | 494 |
| Number of test samples | 444 |
| Number of overall test samples | 440 |
| Input size | 512 × 512 |
| Training number of epochs | 100 |
| Base learning rate | 0.0001 |
| Image input batch size | 2 |
| Gamma | 0.1 |
| Number of classes | 2 |
| Maximum iterations | 2224 |
Table 2.
Performance comparison of models in apple leaf identification.
| Model | Backbone | Precision | Recall | MIoU |
|---|---|---|---|---|
| DeeplabV3+ | MobileNetV2 | 99.00% | 99.04% | 98.06% |
| Xception | 98.74% | 98.86% | 97.63% | |
| PSPNet | MobileNetV2 | 99.15% | 99.26% | 98.42% |
| ResNet | 99.10% | 99.21% | 98.33% | |
| UNet | ResNet | 99.12% | 99.27% | 98.41% |
| VGG | 99.07% | 99.24% | 98.32% |
Table 3.
Performance comparison of models in disease spots.
| Model | Backbone | Precision | Recall | MIoU |
|---|---|---|---|---|
| DeeplabV3+ | MobileNetV2 | 95.04% | 94.23% | 90.30% |
| Xception | 95.47% | 91.51% | 88.32% | |
| PSPNet | MobileNetV2 | 93.53% | 93.80% | 88.74% |
| ResNet | 93.99% | 93.11% | 88.55% | |
| UNet | ResNet | 95.92% | 94.55% | 91.27% |
| VGG | 95.84% | 95.54% | 92.05% |
Table 4.
Performance of overall verification.
| Disease Classification | Correct Grading | Data Quantity | Accuracy |
|---|---|---|---|
| Healthy | 44 | 44 | 100% |
| Early | 179 | 183 | 97.81% |
| Mild | 90 | 98 | 91.54% |
| Moderate | 70 | 73 | 95.89% |
| Severe | 47 | 48 | 97.92% |
| Total | 430 | 446 | 96.41% |
Table 5.
A summary of plant disease-severity evaluation based on different CNN methods.
| References | Plant | Model | Disease Levels | Accuracy (%) |
|---|---|---|---|---|
| Hayit et al. [50] | Wheat | Xception | 0, R, MR, MRMS, MS, S | 91 |
| Nigam et al. [54] | Wheat | Proposal modified CNNs | Healthy stage, early stage, middle stage and end-stage | 96.42 |
| Ramcharan et al. [55] | Cassava | MobileNet | Mild symptoms (A–C) and pronounced symptoms | 84.70 |
| Hu et al. [56] | Tea | VGG16 | Mild and severe | 90 |
| Zeng et al. [57] | Citrus | AlexNet, InceptionV3, ResNet | Early, mild, moderate, severe | 92.60 |
| Prabhakar et al. [51] | Tomato | AlexNet, VGGNet, GoogleNet ResNet | Healthy, mild, moderate, severe | 94.60 |
| Ji and Wu [53] | Grape | DeepLabV3+ (ResNet-50) | Healthy, mild, medium, severe | 97.75 |
| Proposed method | Apple | PSPNet (MobileNetV2) and UNet (VGG) | Healthy, early, mild, moderate, severe | 96.41 |
Publisher’s Note: MDPI stays neutral with regard to jurisdictional claims in published maps and institutional affiliations. |
© 2022 by the authors. Licensee MDPI, Basel, Switzerland. This article is an open access article distributed under the terms and conditions of the Creative Commons Attribution (CC BY) license (https://creativecommons.org/licenses/by/4.0/).
Share and Cite
MDPI and ACS Style
Liu, B.-Y.; Fan, K.-J.; Su, W.-H.; Peng, Y. Two-Stage Convolutional Neural Networks for Diagnosing the Severity of Alternaria Leaf Blotch Disease of the Apple Tree. Remote Sens. 2022, 14, 2519. https://doi.org/10.3390/rs14112519
AMA Style
Liu B-Y, Fan K-J, Su W-H, Peng Y. Two-Stage Convolutional Neural Networks for Diagnosing the Severity of Alternaria Leaf Blotch Disease of the Apple Tree. Remote Sensing. 2022; 14(11):2519. https://doi.org/10.3390/rs14112519
Chicago/Turabian StyleLiu, Bo-Yuan, Ke-Jun Fan, Wen-Hao Su, and Yankun Peng. 2022. "Two-Stage Convolutional Neural Networks for Diagnosing the Severity of Alternaria Leaf Blotch Disease of the Apple Tree" Remote Sensing 14, no. 11: 2519. https://doi.org/10.3390/rs14112519
Note that from the first issue of 2016, this journal uses article numbers instead of page numbers. See further details here.