Technical Note

A Neural Network-Based Spectral Approach for the Assignment of Individual Trees to Genetically Differentiated Subpopulations

by
Carlos Maldonado
1,
Freddy Mora-Poblete
2,*,
Cristian Echeverria
3,
Ricardo Baettig
4,
Cristian Torres-Díaz
5,
Rodrigo Iván Contreras-Soto
1,
Parviz Heidari
6,
Gustavo Adolfo Lobos
7 and
Antônio Teixeira do Amaral Júnior
8
1
Instituto de Ciencias Agroalimentarias, Animales y Ambientales—ICA3, Universidad de O’Higgins, San Fernando 3070000, Chile
2
Institute of Biological Sciences, University of Talca, Talca 3460000, Chile
3
Laboratorio de Ecología de Paisaje, Facultad de Ciencias Forestales, Universidad de Concepción, Concepción 4030000, Chile
4
Facultad de Ciencias Forestales y de la Conservación de la Naturaleza, Universidad de Chile, La Pintana, Santiago 8820000, Chile
5
Grupo de Investigación en Biodiversidad and Cambio Global (GIBCG), Departamento de Ciencias Básicas, Universidad del Bío-Bío, Chillán 3780000, Chile
6
Faculty of Agriculture, Shahrood University of Technology, Shahrood 3619995161, Iran
7
Plant Breeding and Phenomic Center, Faculty of Agricultural Sciences, University of Talca, Talca 3460000, Chile
8
Laboratory of Plant Breeding, Center of Agricultural Science and Technology, Darcy Ribeiro State University of Northern Rio de Janeiro, Campos dos Goytacazes 28013-602, Brazil
*
Author to whom correspondence should be addressed.
Remote Sens. 2022, 14(12), 2898; https://doi.org/10.3390/rs14122898
Submission received: 18 May 2022 / Revised: 10 June 2022 / Accepted: 15 June 2022 / Published: 17 June 2022
(This article belongs to the Special Issue Remote Sensing and Smart Forestry)

Abstract

:
Studying population structure has made an essential contribution to understanding evolutionary processes and demographic history in forest ecology research. This inference process basically involves the identification of common genetic variants among individuals, then grouping the similar individuals into subpopulations. In this study, a spectral-based classification of genetically differentiated groups was carried out using a provenance–progeny trial of Eucalyptus cladocalyx. First, the genetic structure was inferred through a Bayesian analysis using single-nucleotide polymorphisms (SNPs). Then, different machine learning models were trained with foliar spectral information to assign individual trees to subpopulations. The results revealed that spectral-based classification using the multilayer perceptron method was very successful at classifying individuals into their respective subpopulations (with an average of 87% of correct individual assignments), whereas 85% and 81% of individuals were assigned to their respective classes correctly by convolutional neural network and partial least squares discriminant analysis, respectively. Notably, 93% of individual trees were assigned correctly to the class with the smallest size using the spectral data-based multi-layer perceptron classification method. In conclusion, spectral data, along with neural network models, are able to discriminate and assign individuals to a given subpopulation, which could facilitate the implementation and application of population structure studies on a large scale.

Graphical Abstract

1. Introduction

Studying genetic population structure is fundamental to understanding ecological and evolutionary dynamics [1,2], and is also very useful for different areas of research, including association studies [3,4] and forensics [5,6]. In fact, testing the genetic structure is the first step in implementing an association mapping and in identifying loci linked to causal putative genes [7]. Such analysis basically involves the discovering and grouping of genetically similar individuals by identifying allelic similarities among individuals in a target population [5]. By such means, populations can be defined not only by their geographical distribution, but also by alternative criteria (e.g., phenotypic, behavioral, ecological) [8]. Therefore, the assignment of individuals to subpopulations can be carried out using non-genetic criteria, which need to be evaluated in terms of their correspondence with genetic patterns detected within populations [8].
Several genetic studies have been conducted to assess the effectiveness and sustainability of germplasm materials [9,10,11,12,13]. By such means, molecular markers, such as SNPs and simple sequence repeats, also termed microsatellites, have proved very powerful in the inference of population structure [14,15] and have become the most widely used genetic markers to examine the genetic diversity of natural populations of different species, including plants and animals [16]. Over recent decades, with the advent of genotyping techniques, the use of SNP markers—from genotyping by sequencing and/or DNA chip arrays—has played an increasing role in plant genetic studies and population structure inferences in many important crops, including maize [4,15,17], wheat [18,19,20], rice [3,21,22], and tomato [23,24], as well as forest tree species such as Eucalyptus [25,26,27] and poplars [28,29,30]. Moreover, the use of genome-wide studies based on SNPs has been proposed as a way to enhance breeding programs in terms of efficiency by reducing generation time [31]. In such cases, dense mapping studies are carried out to pinpoint the genetic basis of target traits, as well as to establish core collections [9].
High-throughput phenotyping platforms are routinely applied in plant breeding programs and natural vegetation studies, as they may provide potential clues to explain many aspects of genetics, epigenetics, environmental pressures, and other key determinants of plant production [31,32]. In fact, many phenotyping platforms are currently available which are used for the characterization of physiological processes related to growth and development, as well as to study the responses of plants to different stressors [33]. Indeed, the combination of spectral reflectance information and the parameters related to physiological and biochemical processes can enhance multiscale biological modeling by generating key information related to spatial and temporal features [34]. By such means, phenotyping platforms have enabled the analysis and identification of complex intermixture systems in a holistic manner [35,36].
Given the high effectiveness of artificial neural networks in handling clustering and classification problems, different complex neural network architectures have been implemented in several branches of science [4,37,38,39]. For instance, Liu et al. [37] showed that Convolutional Neural Network (CNN) architectures have a better ability to solve small-sample problems in the classification of hyperspectral images than support vector machines. In contrast, Torada et al. [40] produced an “ImaGene” neural network-based classifier that identifies and quantifies the signatures of natural selection from genomic data, providing the opportunity to obtain new insights into the use of neural networks in population genomics and human genetics. Furthermore, although neural network models offer a simple and effective method for sample clustering and classification, their implementation in population genetic structure analysis has been based on genomic information (e.g., SNPs or microsatellites). In this regard, the assignment of individuals to subpopulations has two main restrictions: (i) The individual must have been genotyped, and (ii) the computational model must be run again with all samples. This involves extracting a sample and genotyping and bioinformatics analysis, before the corresponding classification of each new individual.
Due to the importance of plant genetic resource collections for conservation and restoration, as well as for the enhancement of agricultural crop resilience to adverse environmental conditions, we present in this article a new application of spectral reflectance techniques for the classification of genetically differentiated groups (subpopulations). For this purpose, a structured population of Eucalyptus cladocalyx F. Muell was taken as a case for study. As not all individuals are genotyped in a reference population, due to the time-consuming and cost-intensive genotyping process, we hypothesized that different machine learning models could be trained with leaf spectral reflectance information to discriminate between subpopulations, which could be especially useful to assign the remaining individuals that have not been genotyped in a provenance–progeny trial or base population collection. Therefore, the aim of the present study was to assess a machine learning-based spectral approach for the assignment of individual trees to their respective class (subpopulations). This process involves the training of models considering the genetic structure previously defined, and foliar spectral reflectance measures.

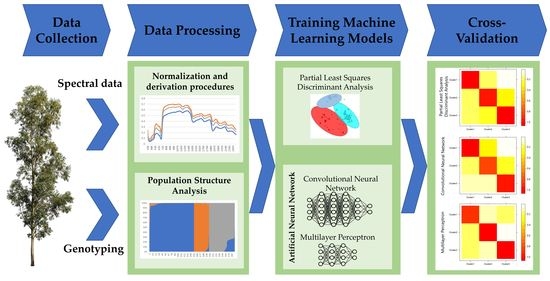
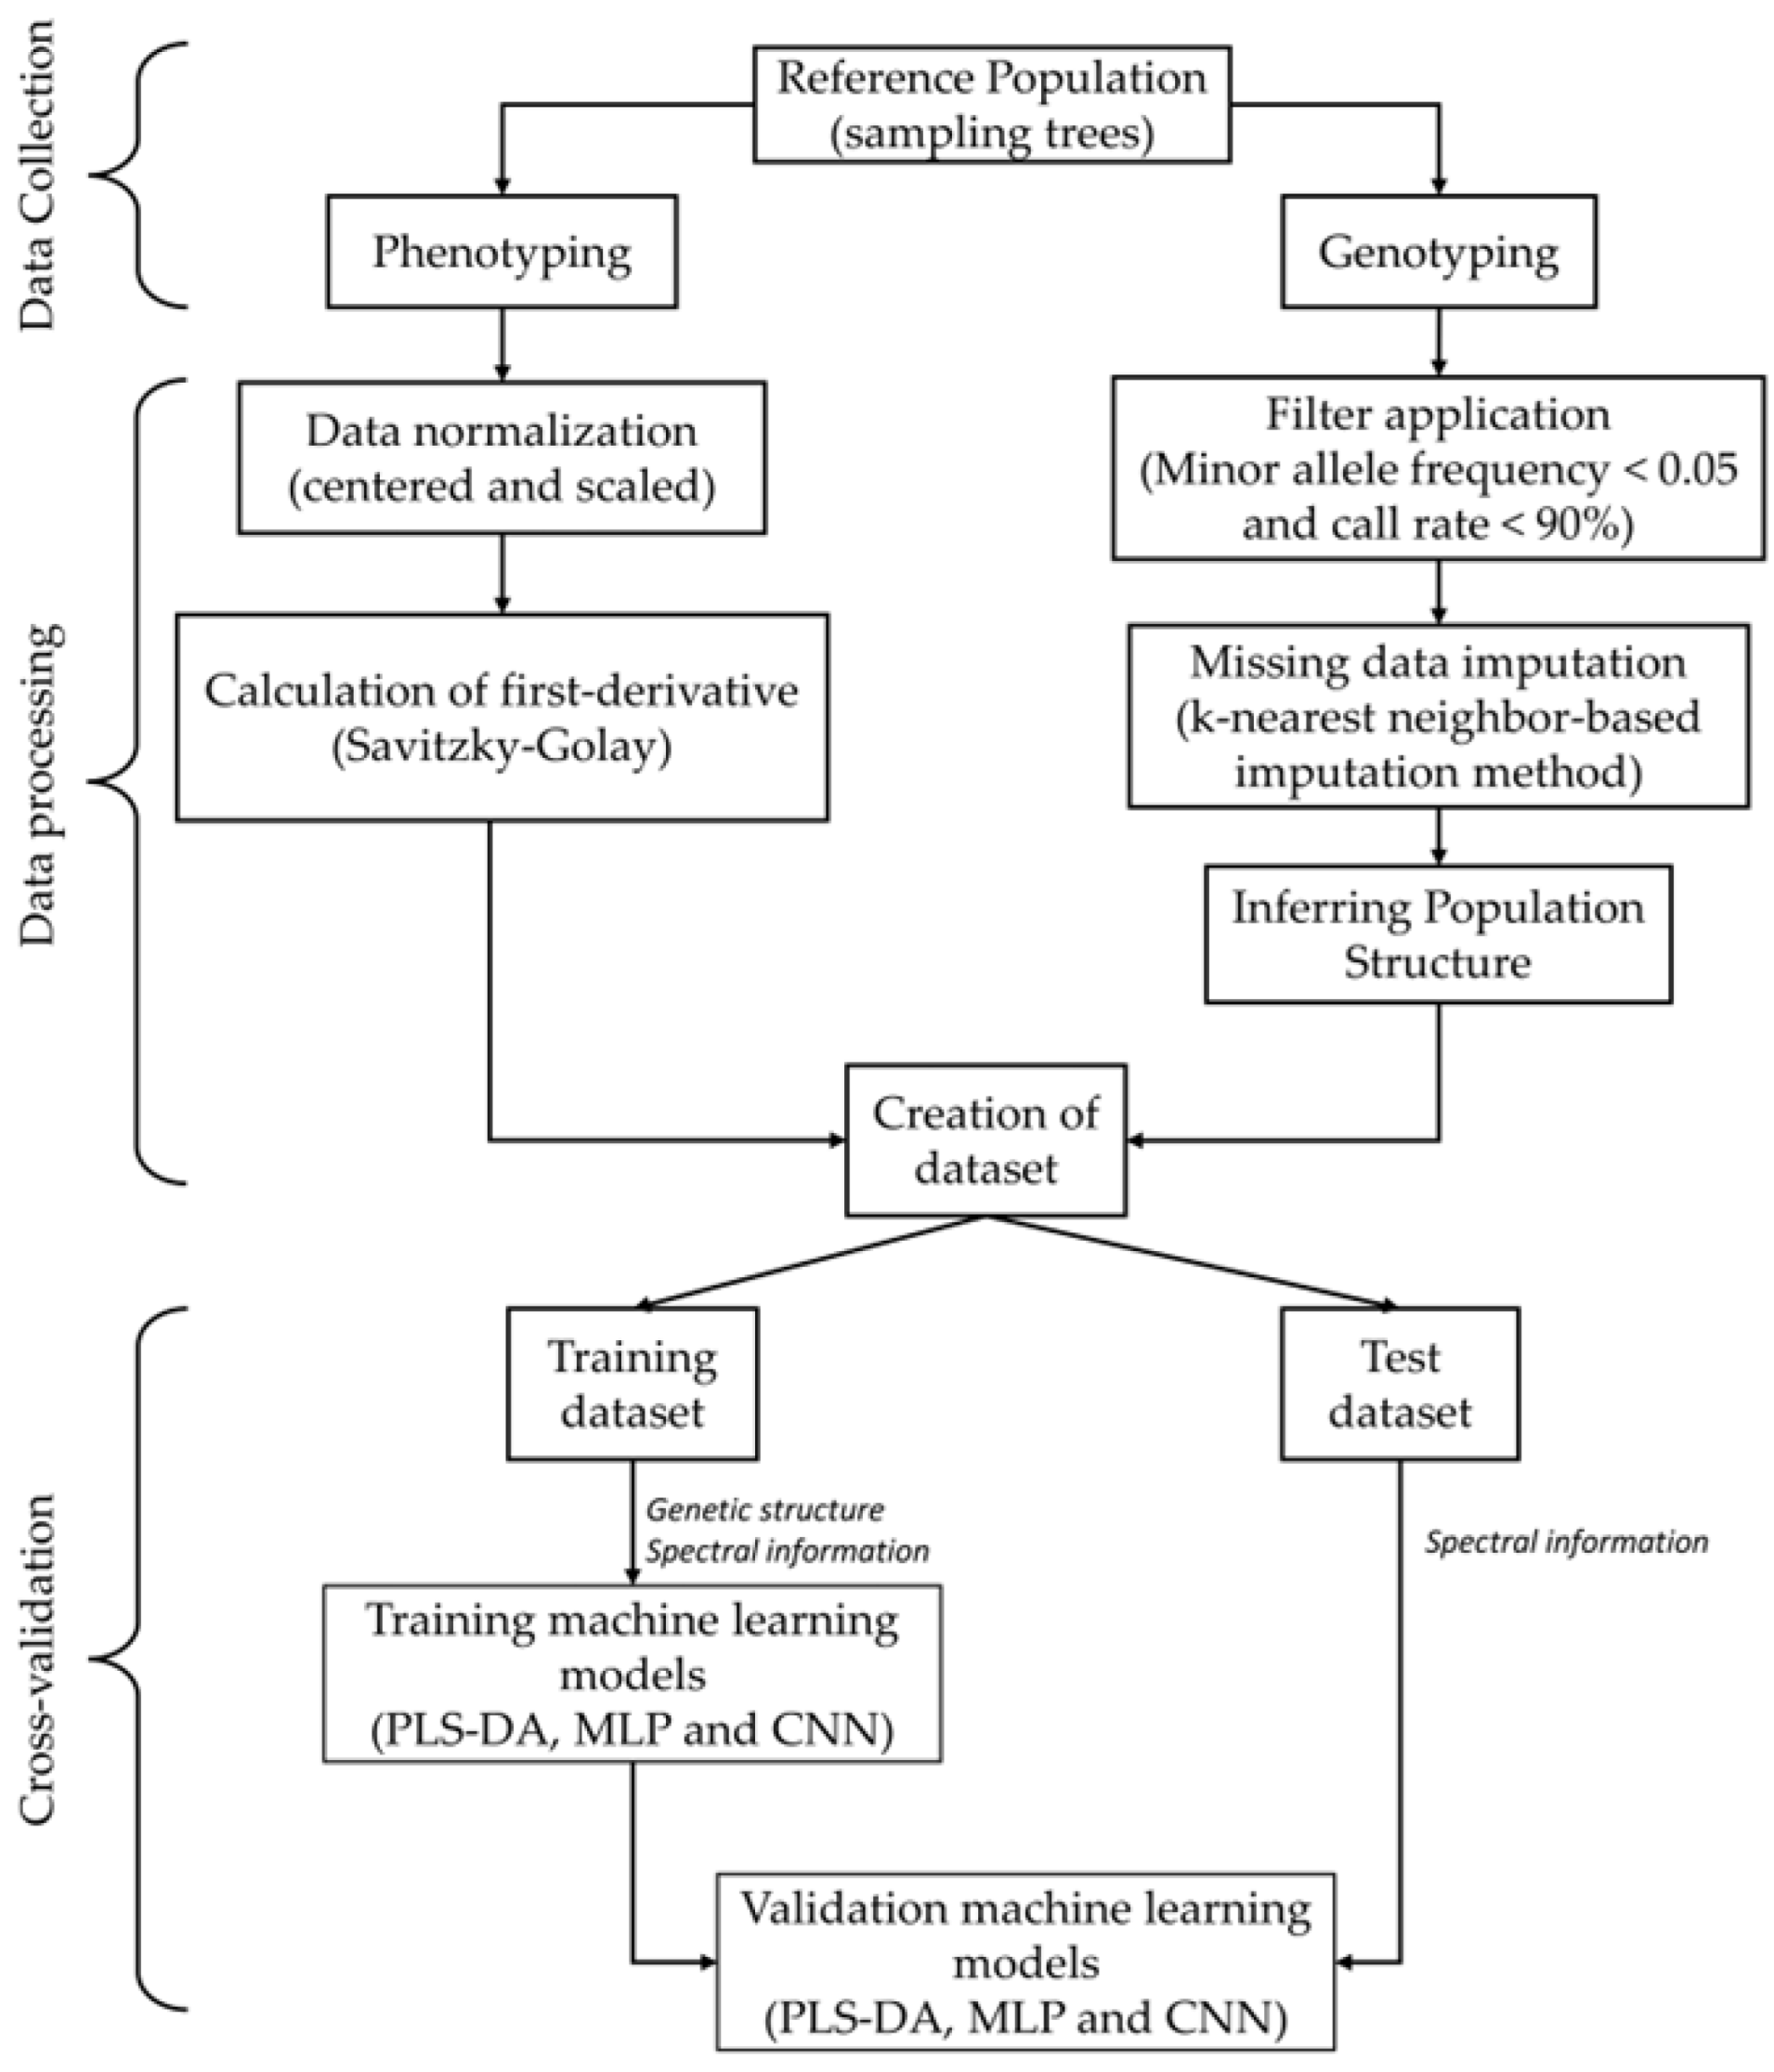
2. Materials and Methods

This section explains the spectral data processing and the estimation of the genetic structure of the target population, as well as the classification methods implemented. The proposed methodology is provided in Figure 1, which illustrates, in detail and step by step, the different stages of this methodology.

2.1. Study Population

The present study was carried out using a provenance–progeny trial of sugar gum (Eucalyptus cladocalyx F. Muell), consisting of open-pollinated families derived from five Australian provenances [25]. The trial was located in Choapa Province (31°55′S, 71°27′W; 167 masl), in Chile (Supplementary Figure S1), with a typical arid (to semi-arid) Mediterranean-type climate [41,42] with a long and severe dry season (of ~6 months) and a mean annual precipitation of less than 200 mm. The provenance–progeny trial was composed of 49 half-sib families planted in a randomized block design (with 30 complete blocks and a single-tree plot). For this study, a total of 310 trees from nine blocks were sampled at the end of the dry season of 2018–2019.

2.2. High-Throughput Phenotyping

Mature, fully expanded leaves were selected from the north side and the uppermost part of the canopy of each of the 310 18-year-old trees. From each tree, at least 10 leaves were taken, which were then freeze-dried and milled. The resulting powder was analyzed by a portable spectrometer (FieldSpec® 4 HiRes spectroradiometer, Analytical Spectral Devices ASD Inc., Boulder, CO, USA) covering 350–2500 nm. The resulting spectral data were centered, scaled, and derived (using a Savitzky–Golay filter with a window of 37 points) using R statistical software version 4.0.5 [43] according to Ballesta et al. [44].

2.3. High-Throughput Genotyping and Population Genetic Structure

Genomic DNA was extracted from the leaves of the sugar gum trees according to the method of Porebski et al. [45] and Doyle and Doyle [46]. The samples were genotyped using the Illumina Infinium 60 K array (of ~60,000 SNPs) (Illumina, CA, USA). The SNPs with a minor allele frequency of <0.05 and a call rate of <90% were discarded from this study. The LD-kNNi method of TASSEL v.5.2 [47] was used to impute the missing data.
The population genetic structure was inferred based on the Bayesian clustering approach from the STRUCTURE program [45]. The number of genetically differentiated groups was estimated at 1 to 6 (K = 1–6). For this, 10 independent runs for each K were performed, each of which consisted of 100,000 Monte Carlo Markov Chain replicates and 10,000 iterations of burn-in. The optimal K value was determined using the method of Evanno et al. [48] according to Mora et al. [49].

2.4. Classification Analysis

2.4.1. Partial Least Squares Discriminant Analysis (PLS-DA)

PLS-DA is a regression approach in which the reduction of the dimensions and the latent decomposition between a set of predictors X and label responses Y are key [50]. PLS defines a new subspace of latent variables through an iterative process, considering a compromise between maximum variance in X and maximum correlation to Y, where both X and Y are mean-centered. This method can be described statistically by:
X = T P + E
Y = U Q + F
where T, P, and E represent the score, loading, and residual matrices of X, while U, Q, and F correspond to the score, loading, and residual matrices of Y, respectively. PLS-DA was run in R statistical software version 4.0.5 [43] with the plsDA() function of the DiscriMiner package [51].

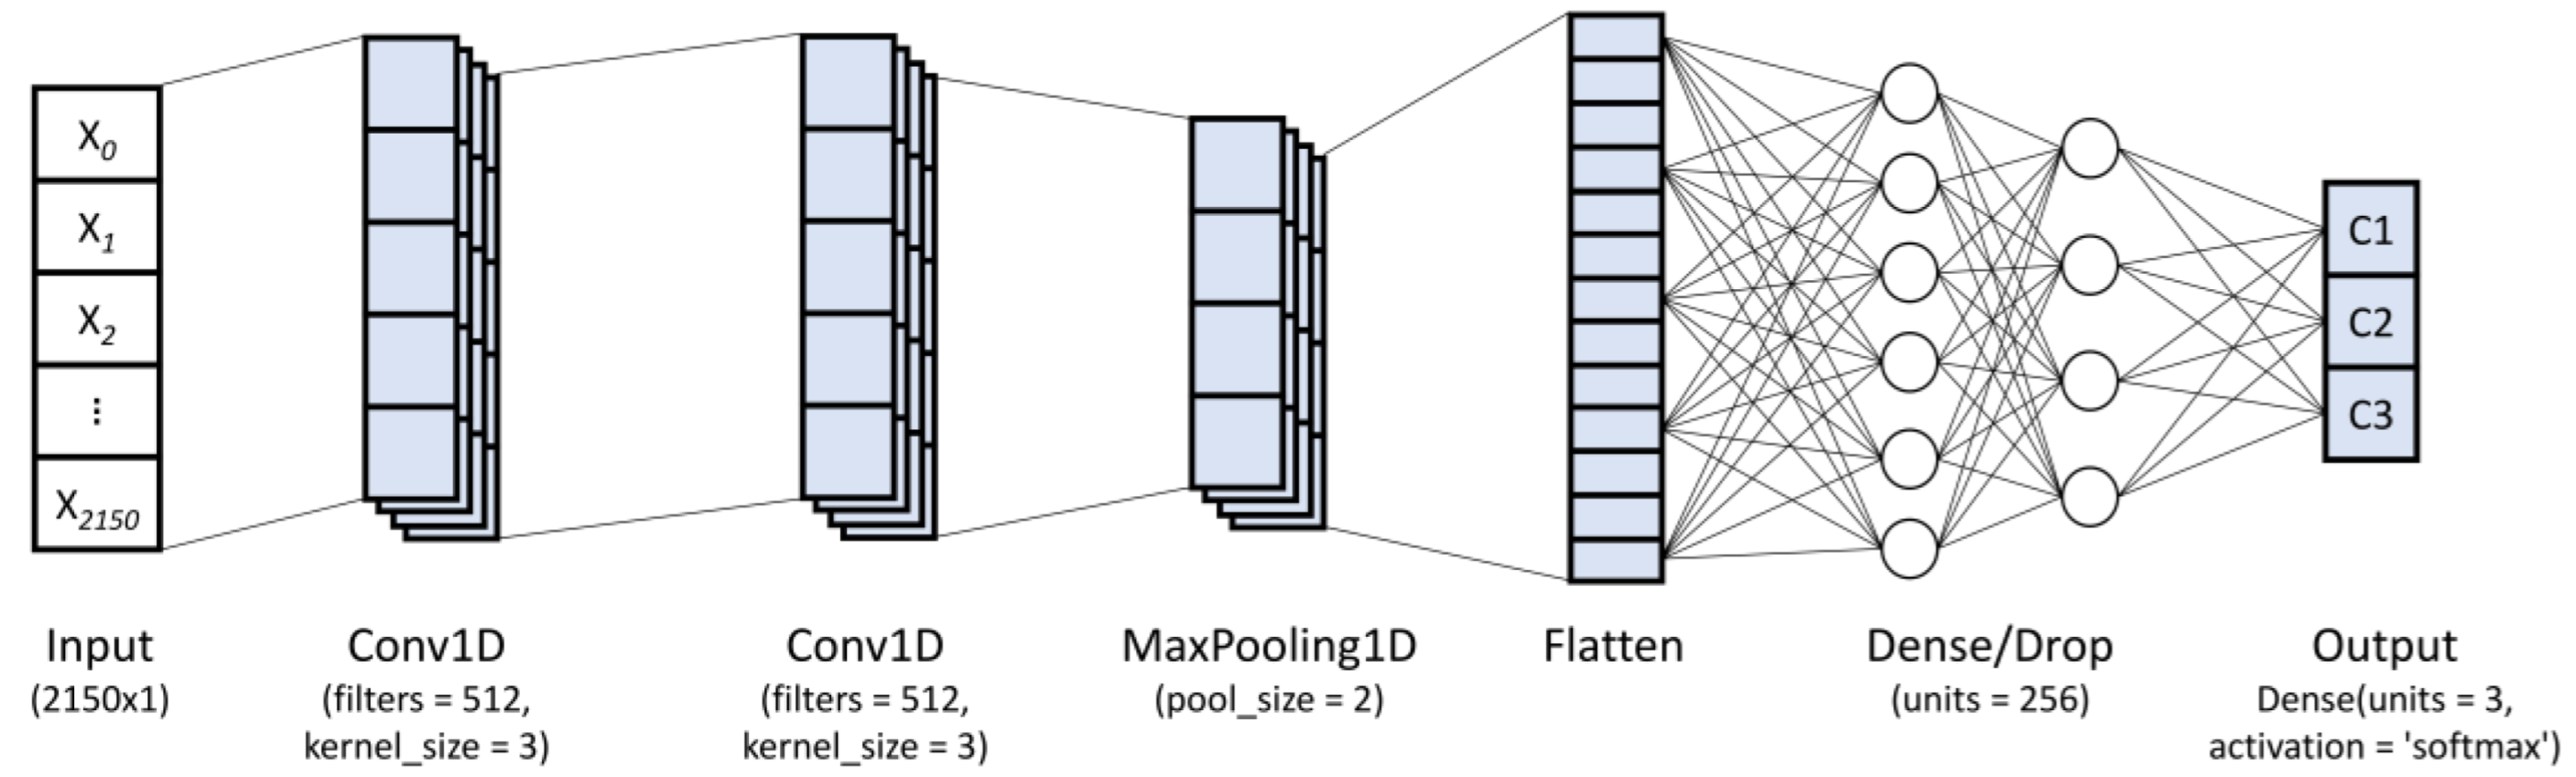
2.4.2. Convolutional Neural Network (CNN)

A Conv1D is a type of deep learning approach designed to capture the features of near-infrared spectroscopy by means of several convolutional and pooling operations [52,53,54]. The layers of this approach follow a hierarchical structure, which has a tremendous capability of extracting robust features at each of the layers through the learning process. By such means, the input features extracted in the higher layers are combined into more complex features in the lower layers [55,56]. The architecture of the CNN used in this study was based on Conv1D to perform the data feature extraction. The model used was composed of two Conv1D layers, one connected deeply (dense layers), a maximum one-dimensional sampling (MaxPooling1D) layer, a flatten layer, and, finally, a softmax layer, which sets the predictions of the model. A schematic diagram is shown in Figure 2. The ReLU (rectified linear unit), Sigmoid, and Tanh (hyperbolic tangent) activation functions were tested in the Conv1D and dense layers, while in the output layer the softmax activation function was used. In order to track the loss values, the categorical cross entropy (categorical_crossentropy) was tested as a loss function with Adam and rmsprop optimizers. The training was realized with 500 epochs, testing batch sizes of 10, 20, and 40.
The CNN architecture consisted of the following layers: (I) Input layer, (II) Conv1D layer, (III) dense layer (1 or 2), (IV) Maxpool1D layer, (V) flatten layer and dropout, and (VI) output layer (dense layer for classification). Briefly, the layers considered in this study were:
(I)
Input layer: used to load the input data.
(II)
Conv1D layer: In this layer, the high-level features from the spectral data are extracted through a kernel matrix (or weight matrix). For this, the weights rotate over the spectral matrix in a sliding window from which the convolved output is obtained and the weights are learned in order to minimize the loss function. This layer utilizes the following parameters:
Kernels: The convolution output c[n] is given as:
c [ n ] = x [ n ] * k [ n ] = m = 0 v 1 x [ m ] * k [ n m ]
where x[n] and k[n] denote the input vector and convolution kernel, respectively, while ∗ denotes the convolution operation between both. In general, the convolved feature in the output of lth layer can be written as:
c i ' = δ ( b i ' + j c i l 1 × k i j l )
where c i ' and c j l 1 denote the ith and jth features of the lth and (l − 1)th layers, respectively; k i j l represents the kernel linked from the ith to jth features; b i l represents the bias for the corresponding feature; and δ represents the activation function used (ReLU, Sigmoid, or Tanh), which is in charge of capturing the nonlinearity of the input signal.
Filters: The He uniform variance scaling initializer was used to initialize the filter weights, while the bias vector was set to zero.
(III)
Dense layer: The dense layer represents a deeply connected neural network layer (fully connected layer) with its preceding layer, which means the neurons between this layer and its preceding layer are fully connected. In general, the dense layer operation can be represented as:
o u t p u t = δ ( d o t ( i n p u t , w d ) + b d
where d o t ( i n p u t , w d ) represents a dot product between the weight vector w d of this layer and the i n p u t , b d denotes the bias vector for this layer, and δ is the activation function (ReLU, Sigmoid, or Tanh) used.
(IV)
1D max pooling layer (Maxpool1D): This layer reduces the resolution by dividing the input into 1D pooling regions and then computing the maximum value of the feature map in each region. The operation of max pooling is given as:
c h l = max p r h c p l 1
where r h   represents the pooling region with index h .
(V)
Flatten layer and dropout: This layer is used to flatten the input, creating a one-dimensional vector through the input data. The dropout parameter helps reduce overfitting in the training process.
(VI)
Output layer (dense layer for classification): This layer employs the softmax activation function for multi-class classification problem. The softmax activation function is given by:
softmax ( z ) i = p i = exp ( z i ) j = 1 M exp ( z j )
where z is an input vector, which represents the elements of the output vector of the previous layer, M is the number of categories, and pi denotes the output domain of categorical probabilities.

2.4.3. Multilayer Perceptron (MLP)

MLP is a simple, deep, feed forward artificial neural network, in which there are at least three layers (input, hidden, and output layers) and the neurons of a layer are fully connected with all neurons of the neighboring layers [56]. The architecture of MLP in this study was composed of one or two dense hidden layers and an output layer (dense layer for classification), which is sufficient to perform classification spectral patterns. In a similar way to CNN, the ReLU, Sigmoid, and Tanh activation functions were used in the dense hidden layers of MLP, while softmax was used in the output layer. Categorical_cross-entropy was used to track the loss function with the Adam and rmsprop optimizers (Table 1).
The implementation of the CNN and MLP classifiers was carried out in Python v3.6.6, Tensorflow-gpu v1.13.1, and Keras v2.2.4.

2.4.4. Performance Metric

The present study used a dataset that comprised 310 samples of trees (each with 2150 spectral measures) partitioned into three different classes. The performances of the proposed CNN and MLP architectures were assessed in terms of classification accuracy (CA) as follows:
C A = c = 1 n T P c N S
where T P c represents the number of individuals assigned correctly to class c (where c = 1, 2, …, n classes). NS is total number of individuals. This metric was used in CNN and MLP models.
A 10-fold cross-validation was applied to fit the tuning of the hyperparameters in the CNN and MLP networks and the later comparison of the models (PLS-DA, CNN, and MLP). To select the best hyperparameters in each fold, 80%, 10% and 10% of the samples were randomly assigned to training, validating and testing the model, respectively. After the hyperparameters were tuned, the performances of the proposed architectures were tested using, in each fold, 80% and 20% of the samples for training and testing, respectively.
The methods (i.e., MLP, CNN, and PLS-DA) used in this study involved preprocessing of the raw data, where the spectral values were corrected by calculating the second derivative of Savitzky–Golay. For each method, to assess the performance of the classifiers, the 10-fold cross-validation technique was used according to Taravat et al. [57]. By such means accuracy was determined as the number of individuals well classified divided by the total number of individuals.

3. Results

This section mainly shows the eucalyptus leaf spectral-based classification accuracy obtained from the three proposed methods (PLS-DA, MLP and CNN). Section 3.1 presents the classification accuracy for the hyperparameter combinations in the neural network models (MLP and CNN), while Section 3.2 shows the comparison of the PLS-DA, MLP and CNN models based on classification accuracy.

3.1. Hyperparameter Optimization in the MLP and CNN Models

Table 2 shows the classification accuracy of the CNN and MLP neural networks, obtained from 10-fold cross-validations of the different hyperparameter combinations. The ReLU activation function produced, on average, the highest classification accuracy for the study population, in both the MLP and CNN models. This finding could reflect the fact that ReLU networks improve the accuracy of the model due to its nonlinearity property, with the receptive fields of the layers remaining unaffected [52]. In the CNN and MLP methods, the use of Adam as an optimizer was, on average, more effective in terms of classification accuracy. Particularly in the CNN, the use of one extra dense layer and a batch size of 10 improved classification accuracy in the population tested. On the contrary, MLP was more effective using only one dense layer. Moreover, the use of one dense layer was more effective when the ReLU and Adam hyperparameters were used.
The above results indicate that the best hyperparameter combination for the classification of the study population was ReLU as an activation function, Adam as the method for adaptive learning rate optimization, a batch size of 10, and only one dense layer, due to its high classification accuracy in both neural network models (MLP and CNN). Furthermore, this hyperparameter combination also showed the highest classification accuracy in the assignment of individuals to subpopulation memberships.

3.2. Spectral-Based Classification

The effectiveness of the MLP, CNN, and PLS-DA methods in classifying individuals according to genetically different groups in the provenance–progeny trial of eucalyptus is shown in Table 3. Overall, the MLP model had the highest cross-validation accuracy (0.87 (0.03)), which indicates that this model has better feature extraction ability and classification performance for this type of data. The CNN and PLS-DA methods showed high effectiveness in the assignment of individuals to classes 1 and 3 (classes with larger numbers of individuals); however, these models exhibited lower effectiveness in terms of assigning individuals to class 2 (group with small number of individuals). Interestingly, MLP had the highest accuracy in class 2 (0.92 (0.08)), indicating that this model is suitable for datasets with unbalanced classes.

4. Discussion

Population structure analysis is an important tool in the fields of population and evolutionary genetics, as it enables a better comprehension of the evolutionary processes and changes in the geographical distribution of plant species that natural populations have been facing [4,58]. The present study proposed a supervised classification approach based on neural network models and spectral observations to assign individuals to genetic subpopulation memberships, which have previously been defined by a Bayesian model by using SNP molecular markers. For this, models were trained considering the genetic structure as the “target value” (i.e., the class labels), and spectral reflectance information as the “attributes” (i.e., features of the observed variables). The results showed that the neural network models produced a higher accuracy than the PLS-DA approach in assigning individuals to population memberships. This result highlights the potential of CNNs and MLP as a new inference framework for assigning individuals to subpopulations, since these models have a higher ability for feature extraction and learning in comparison to PLS-DA models. These findings agree with those of Zeng et al. [59], who reported that the CNN algorithm provides better results than PLS-DA in the evaluation of seed viability in corn plants through spectral classification. Similarly, Britz et al. [60] found that MLP outperformed the PLS-DA and random forest procedures in the spectral classification of species groups and plant parts of grassland vegetation.
The most common procedure for inferring population structure is the use of genetic data with clustering algorithms based on, for instance, Markov Chain Monte Carlo algorithms [61]. As Markov Chain Monte Carlo-based clustering methods are computationally expensive [1,62], alternative procedures have been proposed, such as fastStructure [63], ADMIXTURE [64], self-organizing maps [65,66,67], and k-means (as implemented by López-Cortés et al. [4] and Jombart [68]). However, these methods have the limitation that they require genotypic information from the individuals to be assessed. Furthermore, each time new individuals of unknown origin are to be classified, the model must be re-run again with all data (old and new individuals together), which is a constraint for monitoring population genetic structure on a large scale. Recently, novel methods have emerged that implement diversity analysis through spectral reflectance providing an effective approach for biodiversity assessments of plant species at both local and global scales [58,69,70]. For instance, Hauser et al. [58] assessed the relationships between taxonomic, spectral, and trait diversity, evaluating the effect of vegetation cover (shrublands, forested areas, and chestnut plantations), landscape morphology, and other confounding factors. The authors found that spectral diversity based on a satellite remote sensing system (Sentinel-2) is effective in estimating taxonomic diversity. Similarly, Schwager and Berg [71] employed spectral reflectance indexes, land surface temperatures, and topographic and geological variables to train distribution models of alpine plant species, showing detailed predictions of plant species in the federal state of Styria. Moreover, the authors pointed out that models based on spectral information could help to find rare plant species populations in remote mountainous regions (which are often difficult to access), helping to collect seeds from several plant species for conservation and restoration. In contrast, Monteiro et al. [72] observed that the use of a species–energy theoretical framework based on satellite observations produced an effective spatial pathway for monitoring plant diversity and species richness in mountain grasslands. Despite the encouraging results of these methodologies, Monteiro et al. [72] pointed out that further research on spatial biodiversity monitoring is needed to improve the accuracy of model predictions. Similarly, Hauser et al. [58] mentioned that plant diversity does not necessarily have a significant correlation with spectral diversity and, therefore, further studies and experiments are needed.
The results showed that the spectral variability found was useful in comparing the accuracy of different models that enable the assignation of individuals to subpopulations, in accordance with the genetic diversity of the study population. Interestingly, neural network-based spectral classification has previously been used to discriminate between crop species [73,74,75,76]. According to Yu et al. [74], hyperspectral imaging platforms integrated with deep learning methods, such as CNNs, enable the identification of hybrid okra seeds with a high accuracy. Similarly, Qiu et al. [75] observed that seed varieties of rice are classified more effectively with the use of CNN models trained with hyperspectral images. In contrast, Naeem et al. [76] carried out a spectral discrimination analysis of medicinal species leaves based on machine learning classifiers, including the MLP method. They [76] showed that the MLP classifier had an accuracy of 99.01%, outperforming other important classification methods. Notably, in the present study, the MLP model achieved a higher classification accuracy than the CNN and PLS-DA, particularly in the assignment of individuals to class 2, in which MLP was superior to both methods. Similar results were reported by Yu et al. [77] for disease classification, in which MLP, CNN, and other supervised methods were used in combination with omics data. These authors found that MLP is robust and effective for unbalanced classes, with a higher disease classification accuracy in comparison to the other methods. Fernandez et al. [78] mentioned that a class with a small number of individuals (class 2 in the present study, for instance) has a major negative impact on the general classification performance, since, without a sufficiently large training dataset, a classifier may not generalize the data characteristics. Therefore, this indicates that MLP is an effective approach for analyzing spectral data, mainly for unbalanced datasets.
Although our findings confirm the great potential of neural network models for tree classification based on leaf spectral reflectance information, this study has certain limitations that need to be addressed. First, although spectral reflectance measures were robust in classifying plants, the molecular data can be seen as the key input in the inference of population structure, being used for class labels in model training and validating. By such means, machine-learning models can classify individuals into classes defined by population structure. Moreover, it is necessary to estimate the population structure with a representative sample of the target population to define the correct number of classes (or subpopulations). On the other hand, it should be noted that the leaf samples described in this article were derived from the uppermost part of the canopy trees and analyzed by a portable spectrometer, a procedure which can make it difficult to collect samples and obtain their spectral reflectance information. In this regard, the spectral information could be obtained from hyperspectral images taken by aerial vehicles, or from satellite imagery, which may help tree classifications at larger scales.
In the present study, different machine learning models were trained with leaf spectral reflectance information to discriminate subpopulations in a structured population of a forest species. Our hypothesis was confirmed, which may prove useful for a reference population with the presence of genetic structure, due to the time-consuming and cost-intensive genotyping process. Our findings are in agreement with Rincent et al. [79], who proposed the use of spectral reflectance to indirectly detect endophenotypic differences among individuals in breeding populations. Considering that the neural network models gave good results for discriminating and assigning individuals to a given subpopulation in eucalyptus, we can expect these models to work for many other forest tree species. Finally, this study constitutes a first attempt to experimentally test models trained with spectral information to classify individuals into genetic classes which have been previously defined using molecular markers. Therefore, we recommend this novel practical approach as a complementary procedure for studying genetic population structures.

5. Conclusions

In this article, supervised clustering procedures based on neural networks (multi-layer perceptron and convolutional neural network) and leaf spectral observations were carried out for the assignment of individual trees to their respective genetic subpopulations. To this end, the models were trained considering the genetic structure—previously defined by genotypic data—and leaf spectral reflectance observations. Our findings confirm the suitability of supervised neural network-based spectral models for discriminating and assigning individuals to subpopulation memberships considering only their spectral information. In particular, multilayer perceptron was robust in the allocation of individuals in datasets with unbalanced units (number of individuals within each class). As illustrated in our study, this methodology can be used to quickly discover the population membership of individuals through its use of spectral reflectance information, facilitating the implementation and application of population structure studies on a large scale.
Given the high classification accuracy obtained with neural network models described here, these models can be adopted for future research on the identification of subpopulations in others forest tree species. Moreover, this proposed approach may be integrated into operational programs dedicated to forest species identification and monitoring based on spectral observations, providing guidance for carrying out automatic forest inventories, for ecological assessment, and for forest conservation.

Supplementary Materials

The following supporting information can be downloaded at: https://www.mdpi.com/article/10.3390/rs14122898/s1, Figure S1: Location of the study area (Los Vilos, Choapa Province, Chile).

Author Contributions

Conceptualization, C.M., R.B. and F.M.-P.; methodology, C.M., R.B., R.I.C.-S., C.E., F.M.-P., G.A.L. and A.T.d.A.J.; software, C.M., P.H., G.A.L. and R.B.; validation, R.I.C.-S., C.E. and C.T.-D.; formal analysis, C.M., F.M.-P. and R.B.; investigation, C.M., C.E., C.T.-D., F.M.-P. and P.H.; resources, F.M.-P.; data curation, C.M., R.B. and F.M.-P.; writing—original draft preparation, C.M. and F.M.-P.; writing—review and editing, F.M.-P., C.E., P.H. and A.T.d.A.J.; visualization, C.M., R.B., R.I.C.-S. and A.T.d.A.J.; supervision, F.M.-P. and R.B.; project administration, F.M.-P.; funding acquisition, F.M.-P. All authors have read and agreed to the published version of the manuscript.

Funding

This study was funded by ANID, FONDECYT, grant number 120197.

Data Availability Statement

The data presented in this study are available upon request from the corresponding author.

Acknowledgments

We are very grateful to the owner of the field experiment, Eduardo Collantes.

Conflicts of Interest

The authors declare no conflict of interest.

Abbreviations

AbbreviationDefinition
AdamStochastic gradient descent method that is based on adaptive estimation of first-order and second-order moments
CNNConvolutional Neural Network
Conv1D1D Convolutional Neural Network
Dense layersRegular deeply connected neural network layer
MaxPooling1DMaximum one-dimensional sampling
MLPMultilayer Perceptron
PLS-DAPartial Least Squares Discriminant Analysis
ReLURectified linear unit activation function
rmspropRoot Mean Square Propagation
SNPSingle-Nucleotide Polymorphisms
softmaxNormalized exponential function activation function
TanhHyperbolic tangent activation function

References

  1. Stift, M.; Kolář, F.; Meirmans, P.G. Structure is more robust than other clustering methods in simulated mixed-ploidy populations. Heredity 2019, 123, 429–441. [Google Scholar] [CrossRef] [PubMed]
  2. Perez, S.D.; Grummer, J.A.; Fernandes-Santos, R.C.; Jose, C.T.; Medici, E.P.; Marcili, A. Phylogenetics, patterns of genetic variation and population dynamics of Trypanosoma terrestris support both coevolution and ecological host-fitting as processes driving trypanosome evolution. Parasit. Vectors 2019, 12, 473. [Google Scholar] [CrossRef] [PubMed] [Green Version]
  3. Feng, H.; Guo, Z.; Yang, W.; Huang, C.; Chen, G.; Fang, W.; Xiong, X.; Zhang, H.; Wang, G.; Xiong, L.; et al. An integrated hyperspectral imaging and genome-wide association analysis platform provides spectral and genetic insights into the natural variation in rice. Sci. Rep. 2017, 7, 4401. [Google Scholar] [CrossRef] [PubMed] [Green Version]
  4. Lopez-Cortes, X.A.; Matamala, F.; Maldonado, C.; Mora-Poblete, F.; Scapim, C.A. A Deep Learning Approach to Population Structure Inference in Inbred Lines of Maize. Front. Genet. 2020, 11, 543459. [Google Scholar] [CrossRef] [PubMed]
  5. Alhusain, L.; Hafez, A.M. Nonparametric approaches for population structure analysis. Hum. Genet. 2018, 12, 25. [Google Scholar] [CrossRef] [Green Version]
  6. Aalbers, S.E.; Hipp, M.J.; Kennedy, S.R.; Weir, B.S. Analyzing population structure for forensic STR markers in next generation sequencing data. Forensic Sci. Int. Genet. 2020, 49, 102364. [Google Scholar] [CrossRef]
  7. Luo, Z.; Brock, J.; Dyer, J.M.; Kutchan, T.; Schachtman, D.; Augustin, M.; Ge, Y.; Fahlgren, N.; Abdel-Haleem, H. Genetic diversity and population structure of a Camelina sativa spring panel. Front. Plant Sci. 2019, 10, 184. [Google Scholar] [CrossRef] [Green Version]
  8. Porras-Hurtado, L.; Ruiz, Y.; Santos, C.; Phillips, C.; Carracedo, Á.; Lareu, M. An overview of STRUCTURE: Applications, parameter settings, and supporting software. Front. Genet. 2013, 4, 98. [Google Scholar] [CrossRef] [Green Version]
  9. Wambugu, P.W.; Ndjiondjop, M.N.; Henry, R.J. Role of genomics in promoting the utilization of plant genetic resources in genebanks. Brief. Funct. Genom. 2018, 17, 198–206. [Google Scholar] [CrossRef]
  10. Khadka, K.; Torkamaneh, D.; Kaviani, M.; Belzile, F.; Raizada, M.N.; Navabi, A. Population structure of Nepali spring wheat (Triticum aestivum L.) germplasm. BMC Plant Biol. 2020, 20, 530. [Google Scholar] [CrossRef]
  11. Tehseen, M.M.; Istipliler, D.; Kehel, Z.; Sansaloni, C.P.; da Silva Lopes, M.; Kurtulus, E.; Muazzam, S.; Nazari, K. Genetic diversity and population structure analysis of Triticum aestivum L. landrace panel from Afghanistan. Genes 2021, 12, 340. [Google Scholar] [CrossRef] [PubMed]
  12. Gordon, E.; Kaviani, M.; Kagale, S.; Payne, T.; Navabi, A. Genetic diversity and population structure of synthetic hexaploid-derived wheat (Triticum aestivum L.) accessions. Genet. Resour. Crop. Evol. 2018, 66, 335–348. [Google Scholar] [CrossRef]
  13. Ballesta, P.; Mora, F.; Del Pozo, A. Association mapping of drought tolerance indices in wheat: QTL-rich regions on chromosome 4A. Sci. Agric. 2020, 77, e20180153. [Google Scholar] [CrossRef] [Green Version]
  14. Emanuelli, F.; Lorenzi, S.; Grzeskowiak, L.; Catalano, V.; Stefanini, M.; Troggio, M.; Myles, S.; Martinez-Zapater, J.M.; Zyprian, E.; Moreira, F.M.; et al. Genetic diversity and population structure assessed by SSR and SNP markers in a large germplasm collection of grape. BMC Plant Biol. 2013, 13, 39. [Google Scholar] [CrossRef] [Green Version]
  15. Sant'Ana, G.C.; Espolador, F.G.; Granato, Í.S.C.; Mendonça, L.F.; Fritsche-Neto, R.; Borém, A. Population structure analysis and identification of genomic regions under selection associated with low-nitrogen tolerance in tropical maize lines. PLoS ONE 2020, 15, e0239900. [Google Scholar] [CrossRef] [PubMed]
  16. Tsykun, T.; Rellstab, C.; Dutech, C.; Sipos, G.; Prospero, S. Comparative assessment of SSR and SNP markers for inferring the population genetic structure of the common fungus Armillaria cepistipes. Heredity 2017, 119, 371–380. [Google Scholar] [CrossRef]
  17. Badu-Apraku, B.; Garcia-Oliveira, A.L.; Petroli, C.D.; Hearne, S.; Adewale, S.A.; Gedil, M. Genetic diversity and population structure of early and extra-early maturing maize germplasm adapted to sub-Saharan Africa. BMC Plant Biol. 2021, 21, 96. [Google Scholar] [CrossRef]
  18. Yang, X.; Tan, B.; Liu, H.; Zhu, W.; Xu, L.; Wang, Y.; Kang, H. Genetic Diversity and Population Structure of Asian and European Common Wheat Accessions Based on Genotyping-By-Sequencing. Front. Genet. 2020, 11, 1157. [Google Scholar] [CrossRef]
  19. Soumya, P.R.; Burridge, A.J.; Singh, N.; Batra, R.; Pandey, R.; Kalia, S.; Rai, V.; Edwards Edwards, K.J. Population structure and genome-wide association studies in bread wheat for phosphorus efficiency traits using 35 K Wheat Breeder’s Affymetrix array. Sci. Rep. 2021, 11, 7601. [Google Scholar] [CrossRef]
  20. Tekeu, H.; Ngonkeu, E.L.; Bélanger, S.; Djocgoué, P.F.; Abed, A.; Torkamaneh, D.; Boyle, B.; Tsimi, P.M.; Tadesse, W.; Jean, M.; et al. GWAS identifies an ortholog of the rice D11 gene as a candidate gene for grain size in an international collection of hexaploid wheat. Sci. Rep. UK 2021, 11, 19483. [Google Scholar] [CrossRef]
  21. Vejchasarn, P.; Shearman, J.R.; Chaiprom, U.; Phansenee, Y.; Suthanthangjai, A.; Jairin, J.; Chamarerk, V.; Tulyananda, T.; Amornbunchornvej, C. Population structure of nation-wide rice in Thailand. Rice 2021, 14, 88. [Google Scholar] [CrossRef] [PubMed]
  22. Aesomnuk, W.; Ruengphayak, S.; Ruanjaichon, V.; Sreewongchai, T.; Malumpong, C.; Vanavichit, A.; Toojinda, T.; Wanchana, S.; Arikit, S. Estimation of the genetic diversity and population structure of Thailand’s rice landraces using SNP markers. Agronomy 2021, 11, 995. [Google Scholar] [CrossRef]
  23. Pailles, Y.; Ho, S.; Pires, I.S.; Tester, M.; Negrão, S.; Schmöcke, S.M. Genetic diversity and population structure of two tomato species from the galapagos islands. Front. Plant Sci. 2017, 8, 138. [Google Scholar] [CrossRef] [PubMed] [Green Version]
  24. Wang, X.; Gao, L.; Jiao, C.; Stravoravdis, S.; Hosmani, P.S.; Saha, S.; Zhang, J.; Mainiero, S.; Strickler, S.R.; Catala, C.; et al. Genome of Solanum pimpinellifolium provides insights into structural variants during tomato breeding. Nat. Commun. 2020, 11, 5817. [Google Scholar] [CrossRef] [PubMed]
  25. Mora-Poblete, F.; Ballesta, P.; Lobos, G.A.; Molina-Montenegro, M.; Gleadow, R.; Ahmar, S.; Jimenez-Aspee, F. Genome-wide association study of cyanogenic glycosides, proline, sugars, and pigments in Eucalyptus cladocalyx after 18 consecutive dry summers. Physiol. Plant. 2021, 172, 1550–1569. [Google Scholar] [CrossRef]
  26. Valenzuela, C.E.; Ballesta, P.; Ahmar, S.; Fiaz, S.; Heidari, P.; Maldonado, C.; Mora-Poblete, F. Haplotype-and SNP-Based GWAS for Growth and Wood Quality Traits in Eucalyptus cladocalyx Trees under Arid Conditions. Plants 2021, 10, 148. [Google Scholar] [CrossRef]
  27. Yang, H.; Xu, F.; Liao, H.; Zhang, W.; Yang, X.; Xu, B.; Pan, W. Correction to: Genome-wide assessment of population structure and genetic diversity of Eucalyptus urophylla based on a multi-species single-nucleotide polymorphism chip analysis. Tree Genet. Genomes 2020, 16, 39. [Google Scholar] [CrossRef]
  28. Kitada, S.; Nakamichi, R.; Kishino, H. Understanding population structure in an evolutionary context: Population-specific FST and pairwise FST. G3 2021, 11, jkab316. [Google Scholar] [CrossRef]
  29. Keller, S.R.; Olson, M.S.; Silim, S.; Schroeder, W.; Tiffin, P. Genomic diversity, population structure, and migration following rapid range expansion in the Balsam poplar, Populus balsamifera. Mol. Ecol. 2010, 19, 1212–1226. [Google Scholar] [CrossRef]
  30. Chen, C.; Chu, Y.; Ding, C.; Su, X.; Huang, Q. Genetic diversity and population structure of black cottonwood (Populus deltoides) revealed using simple sequence repeat markers. BMC Genet. 2020, 21, 2. [Google Scholar] [CrossRef] [Green Version]
  31. Gogolev, Y.V.; Ahmar, S.; Akpinar, B.A.; Budak, H.; Kiryushkin, A.S.; Gorshkov, V.Y.; Hensel, G.; Demchenko, K.N.; Kovalchuk, I.; Mora-Poblete, F.; et al. Omics, epigenetics, and genome editing techniques for food and nutritional security. Plants 2021, 10, 1423. [Google Scholar] [CrossRef] [PubMed]
  32. Costa, C.; Schurr, U.; Loreto, F.; Menesatti, P.; Carpentier, S. Plant Phenotyping Research Trends, a Science Mapping Approach. Front. Plant Sci. 2019, 9, 1933. [Google Scholar] [CrossRef] [PubMed] [Green Version]
  33. Pérez-Valencia, D.M.; Rodríguez-Álvarez, M.X.; Boer, M.P.; Kronenberg, L.; Hund, A.; Cabrera-Bosquet, L.; Millet, E.J.; van Eeuwijk, F.A. A two-stage approach for the spatio-temporal analysis of high-throughput phenotyping data. Sci. Rep. 2021, 12, 3177. [Google Scholar] [CrossRef] [PubMed]
  34. Awad, M.M.; Alawar, B.; Jbeily, R. A new crop spectral signatures database interactive tool (CSSIT). Data 2019, 4, 77. [Google Scholar] [CrossRef] [Green Version]
  35. Huang, A.; Zhou, Q.; Liu, J.; Fei, B.; Sun, S. Distinction of three wood species by Fourier transform infrared spectroscopy and two-dimensional correlation IR spectroscopy. J. Mol. Struct. 2008, 883, 160–166. [Google Scholar] [CrossRef]
  36. Duca, D.; Mancini, M.; Rossini, G.; Mengarelli, C.; Pedretti, E.F.; Toscano, G.; Pizzi, A. Soft independent modelling of class analogy applied to infrared spectroscopy for rapid discrimination between hardwood and softwood. Energy 2016, 117, 251–258. [Google Scholar] [CrossRef]
  37. Liu, J.; Zhang, K.; Wu, S.; Shi, H.; Zhao, Y.; Sun, Y.; Zhuang, H.; Fu, E. An Investigation of a Multidimensional CNN Combined with an Attention Mechanism Model to Resolve Small-Sample Problems in Hyperspectral Image Classification. Remote Sens. 2022, 14, 78. [Google Scholar] [CrossRef]
  38. Hu, X.; Li, T.; Zhou, T.; Peng, Y. Deep Spatial-Spectral Subspace Clustering for Hyperspectral Images Based on Contrastive Learning. Remote Sens. 2022, 13, 4418. [Google Scholar] [CrossRef]
  39. Lin, M.; Jing, W.; Di, D.; Chen, G.; Song, H. Multi-Scale U-Shape MLP for Hyperspectral Image Classification. IEEE Geosci. Remote Sens. Lett. 2022, 19, 6006105. [Google Scholar] [CrossRef]
  40. Torada, L.; Lorenzon, L.; Beddis, A.; Isildak, U.; Pattini, L.; Mathieson, S.; Fumagalli, M. ImaGene: A convolutional neural network to quantify natural selection from genomic data. BMC Bioinform. 2019, 20, 337. [Google Scholar] [CrossRef]
  41. Arriagada, O.; Mora, F.; Amaral Junior, A.T. Thirteen years under arid conditions: Exploring marker-trait associations in Eucalyptus cladocalyx for complex traits related to flowering, stem form and growth. Breed. Sci. 2018, 68, 367–374. [Google Scholar] [CrossRef] [PubMed] [Green Version]
  42. Ballesta, P.; Bush, D.; Silva, F.F.; Mora, F. Genomic predictions using low-density SNP markers, pedigree and GWAS information: A case study with the non-model species Eucalyptus cladocalyx. Plants 2020, 9, 99. [Google Scholar] [CrossRef] [PubMed] [Green Version]
  43. R Core Team. R: A Language and Environment for Statistical Computing; R Foundation for Statistical Computing: Vienna, Austria, 2018. [Google Scholar]
  44. Ballesta, P.; Ahmar, S.; Lobos, G.A.; Mieres-Castro, D.; Jiménez-Aspee, F.; Mora-Poblete, F. Heritable Variation of Foliar Spectral Reflectance Enhances Genomic Prediction of Hydrogen Cyanide in a Genetically Structured Population of Eucalyptus. Front. Plant Sci. 2022, 13, 769. [Google Scholar] [CrossRef] [PubMed]
  45. Porebski, S.; Bailey, L.G.; Baum, B.R. Modification of a CTAB DNA extraction protocol for plants containing high polysaccharide and polyphenol components. Plant Mol. Biol. Rep. 1997, 15, 8–15. [Google Scholar] [CrossRef]
  46. Doyle, J.J.; Doyle, J.L. Isolation of plant DNA from fresh tissue. Focus 1990, 12, 13–15. [Google Scholar]
  47. Bradbury, P.J.; Zhang, Z.; Kroon, D.E.; Casstevens, T.M.; Ramdoss, Y.; Buckler, E.S. TASSEL: Software for association mapping of complex traits in diverse samples. Bioinformatics 2007, 23, 2633–2635. [Google Scholar] [CrossRef]
  48. Evanno, G.; Regnaut, S.; Goudet, J. Detecting the number of clusters of individuals using the software STRUCTURE: A simulation study. Mol. Ecol. 2005, 14, 2611–2620. [Google Scholar] [CrossRef] [Green Version]
  49. Mora, F.; Castillo, D.; Lado, B.; Matus, I.; Poland, J.; Belzile, F.; Von Zitzewitz, J.; Del Pozo, A. Genome-wide association mapping of agronomic traits and carbon isotope discrimination in a worldwide germplasm collection of spring wheat using SNP markers. Mol. Breed. 2015, 35, 69. [Google Scholar] [CrossRef]
  50. Lottering, R.T.; Govender, M.; Peerbhay, K.; Lottering, S. Comparing Partial Least Squares (PLS) Discriminant Analysis and Sparse PLS Discriminant Analysis in Detecting and Mapping Solanum Mauritianum in Commercial Forest Plantations Using Image Texture. ISPRS J. Photogramm. Remote Sens. 2020, 159, 271–280. [Google Scholar] [CrossRef]
  51. Sanchez, G. Package ‘DiscriMiner’. 2013. Available online: https://citeseerx.ist.psu.edu/viewdoc/download?doi=10.1.1.408.5145&rep=rep1&type=pdf (accessed on 3 January 2022).
  52. Nezami, S.; Khoramshahi, E.; Nevalainen, O.; Pölönen, I.; Honkavaara, E. Tree species classification of drone hyperspectral and rgb imagery with deep learning convolutional neural networks. Remote Sens. 2020, 12, 1070. [Google Scholar] [CrossRef] [Green Version]
  53. Kawamura, K.; Nishigaki, T.; Andriamananjara, A.; Rakotonindrina, H.; Tsujimoto, Y.; Moritsuka, N.; Rabenarivo, M.; Razafimbelo, T. Using a One-Dimensional Convolutional Neural Network on Visible and Near-Infrared Spectroscopy to Improve Soil Phosphorus Prediction in Madagascar. Remote Sens. 2021, 13, 1519. [Google Scholar] [CrossRef]
  54. Zhang, L.; Ding, X.; Hou, R. Classification modeling method for near-infrared spectroscopy of tobacco based on multimodal convolution neural networks. J. Anal. Methods Chem. 2020, 22, 1–13. [Google Scholar] [CrossRef] [PubMed]
  55. Peng, D.; Liu, Z. A Novel Deeper One-Dimensional CNN with Residual Learning for Fault Diagnosis of Wheelset Bearings in High-Speed Trains. IEEE Access 2018, 99, 10278–10293. [Google Scholar] [CrossRef]
  56. Botalb, A.; Moinuddin, M.; Al-Saggaf, U.M.; Ali, S.S.A. Contrasting convolutional neural network (CNN) with multi-layer perceptron (MLP) for big data analysis. In Proceedings of the 2018 International Conference on Intelligent and Advanced System, Kuala Lumpur, Malaysia, 13–14 August 2018. [Google Scholar]
  57. Taravat, A.; Proud, S.; Peronaci, S.; Del Frate, F.; Oppelt, N. Multilayer Perceptron Neural Networks Model for Meteosat Second Generation SEVIRI Daytime Cloud Masking. Remote Sens. 2015, 7, 1529–1539. [Google Scholar] [CrossRef] [Green Version]
  58. Hauser, L.T.; Timmermans, J.; van der Windt, N.; Sil, Â.F.; César de Sá, N.; Soudzilovskaia, N.A.; van Bodegom, P.M. Explaining discrepancies between spectral and in-situ plant diversity in multispectral satellite earth observation. Remote Sens. Environ. 2021, 265, 112684. [Google Scholar] [CrossRef]
  59. Zeng, F.; Peng, W.; Kang, G.; Feng, Z.; Yue, X. Spectral Data Classification by One-Dimensional Convolutional Neural Networks. In Proceedings of the 2021 IEEE International Performance, Computing, and Communications Conference (IPCCC), Austin, TX, USA, 29–31 October 2021; pp. 1–6. [Google Scholar]
  60. Britz, R.; Barta, N.; Schaumberger, A.; Klingler, A.; Bauer, A.; Pötsch, E.M.; Gronauer, A.; Motsch, V. Spectral-Based Classification of Plant Species Groups and Functional Plant Parts in Managed Permanent Grassland. Remote Sens. 2022, 14, 1154. [Google Scholar] [CrossRef]
  61. Pritchard, J.K.; Stephens, M.; Donnelly, P. Inference of population structure using multilocus genotype data. Genetics 2000, 155, 945–959. [Google Scholar] [CrossRef]
  62. Tonkin-Hill, G.; Lees, J.A.; Bentley, S.D.; Frost, S.D.; Corander, J. Fast hierarchical Bayesian analysis of population structure. Nucleic Acids Res. 2019, 47, 5539–5549. [Google Scholar] [CrossRef] [Green Version]
  63. Raj, A.; Stephens, M.; Pritchard, J.K. fastSTRUCTURE: Variational inference of population structure in large SNP data sets. Genetics 2014, 197, 573–589. [Google Scholar] [CrossRef] [Green Version]
  64. Alexander, D.H.; Novembre, J.; Lange, K. Fast model-based estimation of ancestry in unrelated individuals. Genome Res. 2009, 19, 1655–1664. [Google Scholar] [CrossRef] [Green Version]
  65. Ferreira, F.; Scapim, C.A.; Maldonado, C.; Mora, F. SSR-based genetic analysis of sweet corn inbred lines using artificial neural networks. Crop Breed. Appl. Biotechnol. 2018, 18, 309–313. [Google Scholar] [CrossRef]
  66. Kulka, V.P.; Silva, T.A.D.; Contreras-Soto, R.I.; Maldonado, C.; Mora, F.; Scapim, C.A. Diallel analysis and genetic differentiation of tropical and temperate maize inbred lines. Crop Breed. Appl. Biotechnol. 2018, 18, 31–38. [Google Scholar] [CrossRef] [Green Version]
  67. Costa, M.O.; Capel, L.S.; Maldonado, C.; Mora, F.; Mangolin, C.A.; Machado, M.D. High genetic differentiation of grapevine rootstock varieties determined by molecular markers and artificial neural networks. Acta Sci. Agron. 2019, 42, e43475. [Google Scholar] [CrossRef] [Green Version]
  68. Jombart, T. adegent: A R package for the multivariate analysis of genetic markers. Bioinformatics 2008, 24, 1403–1405. [Google Scholar] [CrossRef] [Green Version]
  69. Jetz, W.; Cavender-Bares, J.; Pavlick, R.; Schimel, D.; Davis, F.W.; Asner, G.P.; Guralnick, R.; Kattge, J.; Latimer, A.M.; Moorcroft, P.; et al. Monitoring plant functional diversity from space. Nat. Plants 2016, 2, 16024. [Google Scholar] [CrossRef] [Green Version]
  70. Wang, R.; Gamon, J.A. Remote sensing of terrestrial plant biodiversity. Remote Sens. Environ. 2019, 231, 111218. [Google Scholar] [CrossRef]
  71. Schwager, P.; Berg, C. Remote sensing variables improve species distribution models for alpine plant species. Basic Appl. Ecol. 2021, 54, 1–13. [Google Scholar] [CrossRef]
  72. Monteiro, A.T.; Alves, P.; Carvalho-Santos, C.; Lucas, R.; Cunha, M.; Marques da Costa, E.; Fava, F. Monitoring Plant Diversity to Support Agri-Environmental Schemes: Evaluating Statistical Models Informed by Satellite and Local Factors in Southern European Mountain Pastoral Systems. Diversity 2021, 14, 8. [Google Scholar] [CrossRef]
  73. Zhang, J.; He, Y.; Yuan, L.; Liu, P.; Zhou, X.; Huang, Y. Machine Learning-Based Spectral Library for Crop Classification and Status Monitoring. Agronomy 2019, 9, 496. [Google Scholar] [CrossRef] [Green Version]
  74. Yu, Z.; Fang, H.; Zhangjin, Q.; Mi, C.; Feng, X.; He, Y. Hyperspectral imaging technology combined with deep learning for hybrid okra seed identification. Biosyst. Eng. 2021, 212, 46–61. [Google Scholar] [CrossRef]
  75. Qiu, Z.J.; Chen, J.; Zhao, Y.Y.; Zhu, S.S.; He, Y.; Zhang, C. Variety Identification of Single Rice Seed Using Hyperspectral Imaging Combined with Convolutional Neural Network. Appl. Sci. 2018, 8, 212. [Google Scholar] [CrossRef] [Green Version]
  76. Naeem, S.; Ali, A.; Chesneau, C.; Tahir, M.H.; Jamal, F.; Sherwani, R.A.K.; Ul Hassan, M. The Classification of Medicinal Plant Leaves Based on Multispectral and Texture Feature Using Machine Learning Approach. Agronomy 2021, 11, 263. [Google Scholar] [CrossRef]
  77. Yu, H.; Samuels, D.C.; Zhao, Y.Y.; Guo, Y. Architectures and accuracy of artificial neural network for disease classification from omics data. BMC Genom. 2019, 20, 167. [Google Scholar] [CrossRef] [PubMed] [Green Version]
  78. Fernandez, A.; Garcìa, S.; Galar, M.; Prati, R.C.; Krawczyk, B.; Herrera, F. Learning from Imbalanced Data Sets; Springer: New York, NY, USA, 2018; ISBN 978-3-319-98073-7. [Google Scholar]
  79. Rincent, R.; Charpentier, J.; Faivre-Rampant, P.; Paux, E.; Le Gouis, J.; Bastien, C.; Segura, V. Phenomic Selection Is a Low-Cost and High-Throughput Method Based on Indirect Predictions: Proof of Concept on Wheat and Poplar. G3 Genes Genomes Genet. 2018, 8, 3961–3972. [Google Scholar] [CrossRef] [Green Version]
Figure 1. A comprehensive data processing workflow from data acquisition to model validation. Data collection: a reference population was phenotyped and genotyped using a portable spectrometer and a set of molecular markers, respectively. Data preprocessing: Spectral reflectance data were centered and scaled, and their first derivative was computed (attributes), while genotypic data were filtered and imputed. Then, the population genetic structure was inferred (target values). Cross-validation: the training dataset was used to train the machine learning models, while the test dataset was used for validating the models. PLS-DA—partial least squares discriminant analysis; MLP—multilayer perceptron; CNN—convolutional neural network.
Remotesensing 14 02898 g001
Figure 2. A schematic representation of the proposed Conv1D model architecture.
Remotesensing 14 02898 g002
Table 1. Values used for each hyperparameter in this study.
ParameterValues Used
Activation functionsReLU, Tanh and Sigmoid
Dense layersMLP: 1 or 2; CNN: 1 or 2 extra
Optimizer algorithmAdam and rmsprop
Batch size10, 20 and 40
Table 2. Classification accuracy of genetic subpopulation memberships performed in a provenance–progeny trial of eucalyptus. Thirty-six MLP (multilayer perceptron) and CNN (convolutional neural network) models were trained considering the following hyperparameters: activation function (ReLU, Tanh, and Sigmoid), number of layers (one or two dense layers in MLP and one or two extra dense layers in the CNN), optimizer (Adam or rmsprop), and batch size (10, 20, and 40).
Activation FunctionLayers (N°)OptimizerBatch SizeMLPCNN
ReLu1Adam100.87 *0.85 *
200.820.82
400.840.77
rmsprop100.660.76
200.730.78
400.670.72
2Adam100.800.69
200.840.8
400.790.78
rmsprop100.660.78
200.700.79
400.630.8
Sigmoid1Adam100.840.78
200.730.63
400.790.51
rmsprop100.800.76
200.770.72
400.640.63
2Adam100.620.49
200.630.52
400.730.54
rmsprop100.640.5
200.850.51
400.790.49
Tanh1Adam100.690.77
200.770.76
400.680.74
rmsprop100.790.74
200.650.66
400.630.78
2Adam100.820.8
200.750.75
400.680.74
rmsprop100.790.7
200.810.69
400.810.67
* Highest classification accuracy. For all models, the rmsprop optimizer was implemented with a learning rate of 0.001, rho = 0.9, momentum = 0.0 and epsilon = 1 × 10⁻⁷, while the Adam optimizer was implemented with a learning rate of 0.001, beta 1 = 0.9, beta 2 = 0.999 and epsilon = 1 × 10⁻⁷.
Table 3. Accuracy results of the spectral-based classification of genetically differentiated groups (subpopulations or genetic classes) performed in a provenance–progeny trial of eucalyptus.
Classification Accuracy *
ModelOverallClass 1Class 2Class 3
Multilayer Perceptron0.87 (0.03)0.84 (0.05)0.92 (0.08)0.91 (0.08)
Convolutional Neural Network0.86 (0.03)0.87 (0.07)0.76 (0.14)0.88 (0.10)
Partial Least-Squares Discriminant Analysis0.81 (0.03)0.82 (0.05)0.78 (0.14)0.82 (0.09)
Individuals in class2961555289
* Classification accuracy of the test dataset for 10 repetitions.
Publisher’s Note: MDPI stays neutral with regard to jurisdictional claims in published maps and institutional affiliations.

