1. Introduction
The microphysical processes of clouds and precipitation play vital roles in the formation and development of precipitation and the prediction of severe weather. Raindrop size distribution (DSD) is an important feature that characterizes the microphysical process of precipitation [
1,
2,
3] and is mainly affected by climatic characteristics and precipitation types [
3,
4,
5,
6,
7,
8,
9]. In recent years, disdrometer DSD measurements have been widely used to study the microphysical characteristics of precipitation [
4,
10,
11,
12,
13,
14]. Many DSD observations and analyses have been carried out in different regions of China. Based on the OTT Particle Size Velocity (PARSIVEL) disdrometer data from Nagqu (4500 m above sea level (ASL)) over the Tibetan Plateau (TP), Chen et al. [
15] reported that the discrepancy in DSDs between day and night is nonsignificant in stratiform rainfall but obvious in convective rainfall. The DSDs of different precipitation types (stratiform and convective) between Nagqu over the TP and Yangjiang in southern China were compared and showed that all three gamma parameters for stratiform precipitation over the TP are larger than those in southern China, while the normalized intercept parameter
Nw and the shape parameter
for convective precipitation are less than those in southern China [
16]. DSD statistical analysis was also conducted in Yining, Xinjiang, an arid region of China, and it showed that convective precipitation was neither continental-like nor maritime-like [
17]. In addition, the same location will display significant seasonal differences in the microphysical processes of precipitation [
18]. The precipitation over the South China Sea (SCS) is dominated by small (midsize) drops during the premonsoon (monsoon) period, while it has the lowest concentration of raindrops in the postmonsoon season [
18]. Monsoon precipitation at Thiruvananthapuram, a coastal tropical station in India, has a higher concentration of small drops than in the other three seasons [
3]. Krishna et al. [
6] found that the mean concentrations of medium and large raindrops in the west monsoon season are higher than those in the east monsoon season in the Palau Islands.
The TP is located in western China, with an average elevation of approximately 4000 m. It is important to the climate and ecosystems of the Asian continent and even the world [
19]. The TP is also known as the Water Tower of Asia due to the origination of seven important Asian rivers, including the Yellow River, the Yangtze River, the Yarlung Zangbo River, etc. The westerlies–monsoon synergy zone covers the TP and the surrounding areas. Climate warming has led to anomalies in westerlies–monsoons and an imbalance in the Water Tower of Asia. The Yarlung Zangbo Grand Canyon (YGC), with a total length of 496.3 km and a depth of up to 6009 m [
20], is located in the southeast TP and is the largest channel for transporting water vapor to the TP. During the Indian summer monsoon period, warm and wet water vapor is transported northward to the TP along the YGC. The water vapor transport intensity (nearly 2000
) is equivalent to that from the south bank of the Yangtze River to the north bank in summer [
21]. The YGC plays an important role in climate change in the TP and is a typical unit in the TP climate system.
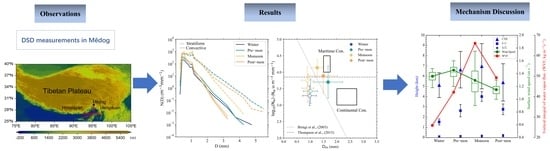
Mêdog, with a mean altitude of 1200 m, is located at the entrance of the YGC. The humid air from the Indian Ocean flows straight into the gorge, giving Mêdog the most annual accumulated precipitation on the TP [
22]. Due to inconvenient transportation and frequent debris flows in the rainy season, in situ observation data are lacking along the YGC, especially in Mêdog. To explore the causes and related mechanisms of water resource changes in the Yarlung Zangbo River basin under the synergistic action of westerlies–monsoons in the southeast TP, a comprehensive cloud precipitation observation test base was established at the Mêdog Climate Observatory (95.32°E, 29.31°N), supported by “the Second Tibetan Plateau Scientific Expedition” and “the Earth-Atmosphere Interaction in the TP and its Influence on the Weather and Climate in the Lower Reaches” projects. A Ka-band cloud radar, a micro rain radar, an OTT PARSIVEL disdrometer and other instruments were deployed at Mêdog National Climate Observatory to obtain the three-dimensional structure of clouds and precipitation characteristics in the YGC. Based on Ka-band cloud radar measurements, the vertical structure characteristics and diurnal variation in clouds over Mêdog in the southeast TP were analyzed [
23]. In addition, precipitation in Mêdog was dominated by small and medium drops, and the convective rain in this region could be classified as maritime-like [
24]. However, the seasonal variation characteristics of the raindrop spectrum were not analyzed due to the short observation period. In this study, DSD data collected from an OTT PARSIVEL disdrometer during the period of July 2019 to June 2020 were used to study the seasonal variation in microphysical characteristics for different precipitation intensities and precipitation types. In addition, the European Centre for Medium-Range Weather Forecasts (ECMWF) Reanalysis version 5 (ERA5) data, Fengyun-4A (FY-4A) satellite products and automatic weather station (AWS) observations were used to address the possible reasons for the seasonal differences in DSDs in Mêdog. This study aimed to better understand the seasonal variation in the microphysical characteristics of precipitation processes at the entrance of the water vapor channel in the YGC and its relationship with westerlies–monsoon synergy and water vapor transport, which is beneficial for improving the microphysical parameterization scheme and the precipitation forecast of the models in the TP.
The instruments, data and methods adopted in this study are provided in
Section 2. The properties of DSDs and microphysics parameters for different rain rate classes and precipitation types in different seasons are reported in
Section 3.
Section 4 discusses the possible reasons for the seasonal variations in DSDs. The major conclusions are given in the final section.
3. Result
3.1. Statistical Characteristics
Table 3 shows the maximum, mean and standard deviation (SD) of
R,
Dm and
NT calculated by using 1 min DSD disdromter samples in different seasons. The maximum rainfall rate of 56.643 mm h
−1 was in the premonsoon season, indicating that the strongest convective precipitation occurred in the premonsoon season. The mean
R was highest in the monsoon season, followed by the premonsoon season, and the weakest in winter. The sequence was in line with that of the accumulated rainfall amount in the four seasons. The low value of SD in all the seasons indicated a small variation in precipitation intensity in Mêdog. The lowest SD in winter may be related to uniform stratiform precipitation and minimal convective precipitation. The higher SD was more or less in the premonsoon and monsoon seasons, showing that convective precipitation mainly occurred in the two seasons.
The maximum, mean and SD of
Dm were found to be larger in the premonsoon season, which indicates stronger convective actions. During the monsoon season, the mean and SD of
Dm were smaller, probably due to precipitation dominated by warm rain processes and the relative consistency of precipitation [
3,
24]. The maximum, mean and SD of
NT were the highest in the monsoon season, which indicates that the raindrop concentration was the highest with larger dispersion.
In general, the monsoon exhibited the largest values for the mean and SD of R, the smallest values for the mean and SD of Dm, and the highest values for the maximum, mean and SD of NT. All these features showed that rainfall during the monsoon period is characterized by abundant, smaller drops, which may be attributed to the sufficient warm and humid air flows from the Indian Ocean. In addition, the Dm of premonsoon precipitation registered larger values in the maximum, mean and SD, as well as the highest value of the maximum R. Therefore, stronger convective activities probably occurred in the premonsoon season.
3.2. Seasonal Variation in DSDs
Figure 4 shows the DSDs of different seasons from mean spectra. Drops with
D ≤ 1 mm were regarded as small raindrops,
D > 3 mm as large raindrops, and 1 <
D ≤ 3 mm as medium raindrops [
18]. As seen from
Figure 4, the DSDs in Mêdog exhibited bimodal distribution with peaks at 0.4 mm and 1.1 mm. This characteristic of the multipeak raindrop spectrum has been discussed [
35]. In terms of small raindrops, the highest concentration was in the monsoon season and the lowest was in winter, and the premonsoon season was similar to the postmonsoon season. As raindrop diameter increased, the concentration of medium raindrops was slightly higher in the monsoon and premonsoon seasons than in the postmonsoon and winter seasons. The concentration of large raindrops was the highest (lowest) in the premonsoon (monsoon) season. The results showing that the concentration of large (small) raindrops was the highest in the premonsoon season (monsoon) were consistent with those found in tropical coastal areas, which are also dominated by the Indian Ocean monsoon in summer [
3]. Unlike the SCS, Zeng et al. [
18] reported that small drops predominate in precipitation during the premonsoon period, while large drops prevail in the postmonsoon season.
To further analyze the DSD characteristics in different seasons, the DSD data used in this study were divided into six categories, as shown in
Table 2. The DSDs of different rainfall rate categories from mean spectra for different seasons are shown in
Figure 5. As the rainfall rate increased, the spectra width in all seasons became wider, and the difference in DSDs among the four seasons gradually increased. For
R ≤ 5 mm h
−1 (usually corresponding to stratiform precipitation [
13]), the concentration of large raindrops was the highest in winter. Precipitation with
R ≥ 10 mm h
−1 (usually corresponding to convective rainfall [
36,
37]) occurred mainly in the premonsoon and monsoon seasons. The concentration of large raindrops in the premonsoon season was significantly greater than that in the monsoon season, indicating stronger convective rainfall in the premonsoon season.
Table 4 gives the average rainfall microphysical parameters for each of the six rainfall rate categories from 1 min DSD samples in different seasons. The mean values of
Z, LWC,
NT and
Dm increased with increasing rain rate in all seasons. The log
10(
Nw) tended to decrease with the increasing rain rate in winter, indicating that the increase in precipitation intensity was mainly attributed to the increase in raindrop size. During other periods, log
10(
Nw) tended to increase with increasing rain rate until
R > 20 mm h
−1. For the same rainfall rate categories, monsoon precipitation was characterized by the smallest mean
Dm value and the highest mean log
10(
Nw) value.
3.3. Distribution of Dm, R, and NT
Figure 6 shows the percentage of occurrence (bar) and relative contribution to the total rainfall (line) for the different
Dm bins in the four seasons. Mêdog rainfall in all the seasons was dominated by raindrops with
Dm < 2 mm. The distribution of the occurrence frequency of
Dm was similar in all seasons except for a slight difference in the premonsoon season. The occurrence frequency of D
m1 was the highest, followed by D
m2 for all four seasons. During the winter, monsoon and postmonsoon seasons, the occurrence percentage of D
m1 was more than 60%, whereas it was less than 60% during the premonsoon period. On the other hand, the percentage occurrence of D
m2 was more than 40% in the premonsoon season, while it was approximately 30% in the other three seasons. The deceased D
m1 in the premonsoon season was compensated by the increase in D
m2. This result indicated that the occurrence frequency of larger raindrops was higher in the premonsoon season than in the other three seasons.
The distribution of the relative contribution to the rainfall totals was different from that of the occurrence frequency. The Dm2 category produced a greater contribution to rainfall by 50–70%, although it had a lower occurrence frequency than the Dm1 category. The rainfall rate was proportional to the third power of raindrop diameter. The larger raindrops with 2 ≤ Dm < 3 mm only contributed to the total rainfall by approximately 5% in the winter and premonsoon seasons, and there were hardly any larger raindrops with 2 ≤ Dm < 3 mm during the monsoon and postmonsoon periods.
The percentage of occurrence (bar) and relative contribution to the total rainfall (line) from the different rain rate categories in the four seasons are shown in
Figure 7. Weak rainfall with
R < 1 mm h
−1 was dominant in the four seasons, which was evident from the occurrence frequency of the R1 category exceeding 60%, especially more than 80% in the winter season. The occurrence frequencies of R2 and R3 were higher in the monsoon season than in the other three seasons. Considering the relative contribution to total rainfall, the relative contribution to rainfall by R1 was largest and exceeded 60% in the winter season. Similarly, the R1 category also made the largest relative contribution to rainfall in the postmonsoon season. However, the relative contributions to rainfall by the R1, R2, and R3 categories were comparable in the premonsoon season. During the monsoon season, the R3 category made the highest contribution to total rainfall, although its occurrence frequency was lower than that of the R1 and R2 categories.
Figure 8 shows the percentage of occurrence (bar) and relative contribution to the total rainfall (line) from the different
NT classes in the four seasons. The occurrence frequencies decreased with the increase in drop number, and the N
T1 class predominated in the four seasons. The drop concentration in Mêdog was mostly below 250 m
−3, followed by 250–500 m
−3, and a drop concentration of more than 1000 m
−3 rarely occurred. The occurrence frequency of N
T1 was lower in the monsoon season (approximately 57%) than in the other three seasons (an average of approximately 88%), and the occurrence frequency of N
T2 in the monsoon season (approximately 30%) was higher than in the other three seasons (an average of approximately 9.5%). The relative contribution to the total rainfall monotonically decreased with increasing
NT in all seasons except the monsoon season. During the monsoon season, N
T2 made a larger relative contribution (38%) to the total rainfall than the N
T1 class (28%).
3.4. Characteristics of DSDs in Stratiform and Convective Rainfall
Previous studies have shown that the microphysical process of stratiform rainfall is significantly different from that of convective rainfall [
34,
38]. Therefore, the 1 min DSD samples were classified into stratiform rainfall and convective rainfall. Consequently, the stratiform/convective precipitation samples/percentages were 6130/5 (99.6%/0.1%), 24,155/286 (97.1%/1.1%), 33,468/763 (94.2%/2.1%) and 6930/69 (97.1%1.0%) in the winter, premonsoon, monsoon and postmonsoon seasons, respectively. Considering only five samples, the DSD of convective rainfall in winter was not considered.
Figure 9 shows the DSDs of stratiform rainfall and convective rainfall from mean spectra during different periods. Compared to stratiform rainfall, convective rainfall had a broader spectrum width and a higher concentration of drops. Bimodal distribution could also be seen in both DSDs of stratiform rain and convective rain, and the concentration of the second peak at 1.1 mm was comparable to that of the first peak at 0.4 mm for convective rainfall.
For stratiform rainfall (
Figure 9a), the DSD peaked at 0.4 mm in all four seasons and then decreased rapidly. The precipitation in the monsoon season (winter) was characterized by a higher (lower) concentration of drops with sizes less than 1.1 mm. The winter and premonsoon precipitation had higher concentrations of drops with sizes larger than 2.1 mm than the monsoon and postmonsoon precipitation. The precipitation in the four seasons had comparable concentrations of drops with diameters of 1.1–2.1 mm. For convective rainfall (
Figure 9b), the highest concentration of raindrop diameters less than 1.1 mm occurred in the monsoon season, and the highest concentration of drops larger than 1.7 mm appeared in the premonsoon season. On the other hand, convective rain in the monsoon season had the lowest concentration of larger drops with
D > 2 mm, and the lowest concentration of small drops occurred in the premonsoon season. The concentrations of raindrops with sizes of 1.1–1.7 mm were very similar for the three seasons considered.
The average microphysical parameters of stratiform rain and convective rain from 1 min DSD samples during the four periods are given in
Table 5. For stratiform rain, the mean LWC,
NT,
R,
Nw and
were the highest in the monsoon season. The largest mean
Dm value was observed in the premonsoon season, followed by the winter season, and the smallest mean
Dm value was observed in the monsoon season. The highest mean
Z in the premonsoon season was mainly attributed to the largest
Dm because the reflectivity factor is proportional to the sixth power of drop diameter. During the winter period, the lowest mean
R and LWC were probably related to the lowest concentration of drops. For convective rain, the mean
R,
Z, LWC and
Dm were the largest in the premonsoon period. The highest mean values of
NT,
Nw and
were found in the monsoon period, followed by the postmonsoon period, and the lowest mean values of
NT and
Nw were found in the premonsoon period.
Figure 10 shows the average log
10(
Nw) versus average
Dm value (along with
SD bars) for stratiform rain and convective rain during different periods. The two outlined squares represent the maritime-like and continental-like convective events reported by Bringi et al. [
34]. In general, the average
Dm versus average log
10(
Nw) showed evident seasonal differences in Mêdog. In terms of convective rain, monsoon precipitation had the smallest (highest) mean
Dm (log
10(
Nw)) value of 1.26 mm (4.14), while premonsoon precipitation was characterized by the largest (lowest) mean
Dm (log
10(
Nw)) value of 1.67 mm (3.70). Convective rain in the monsoon and postmonsoon seasons was similar to maritime-like events, exhibiting smaller
Dm and higher log
10(
Nw). The convective precipitation during the monsoon and postmonsoon seasons also conformed to the C–S separation line from Thompson et al. [
5] for the tropics. Convective events during the premonsoon period were considered to be between maritime- and continental-like events. For stratiform rain, the average
Dm versus log
10(
Nw) values appeared on the left side (underside) of the C–S separation line, as reported by Bringi et al. [
34] (Thompson et al. [
5]). The differences in the mean
Dm values among the four seasons were relatively slight, whereas the mean log
10(
Nw) displayed an evident discrepancy. For example, the mean log
10(
Nw) value of 3.75 in the monsoon season was much higher than that in the winter period, with a value of 3.28.
For comparison with other regions in China,
Figure 10 is also superimposed with the mean
Dm and log
10(
Nw) values of different seasons from previous studies, including the SCS [
18], Nanjing [
39] and Beijing [
40]. Compared with these regions, the stratiform precipitation in Mêdog showed smaller mean
Dm and mean log
10(
Nw) values in all seasons, except the monsoon season, which had a similar mean log
10(
Nw) value. The mean
Dm value of the premonsoon convective precipitation in Mêdog was similar to that in the SCS, and the mean log
10(
Nw) value was similar to that in Beijing. Mêdog convective rain in the monsoon season was similar to Nanjing, which may have been due to abundant water vapor in the two regions during this period. The mean
Dm (log
10(
Nw)) of Mêdog convective rain was much smaller (higher) than that in the SCS and Beijing in the monsoon season. This finding was probably related to the predominant warm (cold) rain processes in Mêdog (SCS and Beijing). Similarly, the postmonsoon convective cluster in Mêdog was similar to Nanjing but had a smaller (higher)
Dm (log
10(
Nw)) than Beijing and the SCS.
3.5. The μ–Λ Relationships
The
μ–
Λ relationship is closely related to the DSD and varies with rain types, climatic characteristics and terrain [
38,
41]. Zhang et al. [
38] proposed the quadratic fitting formula in Florida as follows:
To minimize the scatter, the samples in Mêdog with rain rates > 5 mm h
−1 and drop counts > 300 were used to derive
μ and
Λ [
15,
38].
Figure 11 shows the scatterplots of
μ and
Λ for three seasons due to minimal convective precipitation in winter. The fitted
μ–Λ relationships for the premonsoon, monsoon and postmonsoon periods are given as follows:
and
The
µ–
Λ relationships in Mêdog exhibited little variation among the different periods, especially for
Λ < 13. The shape factor
μ in the postmonsoon season gradually became lower than that in other seasons when
Λ > 13, which may be related to the few samples of convective precipitation with increasing
Λ during the postmonsoon period. Notably, the
μ–
Λ relationships in different seasons were similar to the Florida (subtropical environment) relationship reported by Zhang et al. [
38]. This finding might indicate that climatic characteristics may play an important role in the determination of the
μ–
Λ relationship.
3.6. Quantitative Precipitation Estimation (QPE)
An important application of DSD is quantitative precipitation estimation (QPE). The power-law relationship of
is widely used in radar meteorology and changes with rainfall type, atmospheric conditions and geographic location [
42]. The new-generation weather radar system in China uses the empirical relationships of
and
to describe midlatitude convection [
43] and stratiform precipitation [
44], respectively. Wu and Liu [
16] proposed that coefficient A (exponent b) is 170.7 (1.31) and 69.83 (1.83) for summer convection precipitation and stratiform precipitation in Nagqu, respectively, based on disdrometer measurements. Wang et al. [
24] gave the relationships of
and
for convection precipitation and stratiform precipitation in rainy seasons in Mêdog, respectively. The equivalent radar reflectivity factor (
Ze, in mm
6 m
−3) based on observed DSDs can be expressed according to Zhang et al. [
45]:
where
λ indicates the radar wavelength and was set to 5 cm, considering that C-band Doppler weather radars were deployed over the TP.
Kw is the water dielectric factor, and
is set to 0.93 by convention.
f (
D) is the backscattering amplitude for a raindrop of size
D, which is calculated by using the extended boundary condition method (EBCM) [
46].
Considering the evident seasonal variation in DSD characteristics in Mêdog, the
Z–
R relationships for the four seasons are discussed in this section.
Figure 12 shows the scatter plots of
Z and
R superimposed with the fitted
Z–
R relationships using the least squares method for stratiform rain and convective rain, respectively. The fitted coefficient A and exponent b for different rainfall types in the four seasons are given in
Table 6. Following Zeng et al. [
18], the normalized mean biases (NBs) of the fitted
Z–
R relations and empirical relations at midlatitudes for different precipitation types were calculated to evaluate the accuracies of different
Z–
R relationships (
Table 7).
For stratiform precipitation, a small discrepancy in fitted Z–R relationships among the different seasons could be noted. Winter precipitation had larger A and b values than those of the empirical relationship in midlatitudes, while precipitation in other seasons had smaller A and b values. This result may be related to the fact that winter stratiform precipitation had more (less) large (small) drops than in other seasons. The empirical relationship of Z = 200R1.6 underestimated rainfall in the premonsoon, monsoon and postmonsoon seasons by 1.74%, 27.24%, and 14.32%, respectively, while it overestimated winter rainfall by 21.51%. The fitted Z–R relationships reduced the NB to less than 10% for all of the considered seasons.
For convective precipitation, the fitted coefficient A (exponent b) in the premonsoon, monsoon and postmonsoon seasons was much less (larger) than that of the empirical relation at midlatitudes. Monsoon precipitation had a minimum coefficient A (50.91) and exponent b (1.70), which might have been attributed to the large number of small raindrops during this period. That is, the same reflectivity factor would derive the highest rain rate in the monsoon season. Given a radar reflectivity factor value of 40 dBZ, the corresponding rainfall rates were 15.24 mm h−1, 22.33 mm h−1 and 18.20 mm h−1 in the premonsoon, monsoon and postmonsoon seasons, respectively. The empirical relationship of Z = 300R1.4 underestimated convective rainfall up to 51.38% in the monsoon season, followed by 26.87% in the postmonsoon season and then 12.27% in the premonsoon season. However, the fitted Z–R relationships significantly reduced the NB in all of the considered seasons. In particular, the NB decreased from 51.38% to 2.98% in the monsoon season. The distinct seasonal variation in DSDs in Mêdog convective rain determined the evident discrepancy in Z–R relationships among the different seasons. Therefore, the fitted Z–R relationships for different seasons could significantly improve the accuracy of radar-based QPEs.
4. Discussion
The significant seasonal variations in DSDs in Mêdog could provide a better understanding of the microphysical process of precipitation at the entrance of the vapor channel in the YGC and improve the parameterization schemes in numerical models over the TP. The possible causative mechanisms of the distinct DSD variability over seasons may be addressed from the standpoint of the meteorological environments of rainfall [
13]. To explore the possible causes of seasonal variations in the DSD in Mêdog, meteorological conditions of rainy days from ERA5 reanalysis data, AWS and TBB and CTH products of the FY-4A satellite were collected. The lifting condensation level (LCL), 0 °C isotherm layer height, CTH, TBB probability density function, surface wind speed box diagram and the vertical integral of water vapor flux of rainy days in the four seasons are shown in
Figure 13 and
Figure 14.
Due to the lack of radiosonde and ceilometer observations in Mêdog, the LCLs calculated from AWS data were approximately considered as cloud base height (CBH). The average LCL was calculated using the surface temperature (
T), surface dew point temperature (
Td) and surface pressure (
p) according to the empirical formula (Equations (21)–(23)) given by Barnes [
47]:
and indicate the temperature and pressure at LCL height, respectively. a = 1/273, t = TLCL-T (unit: °C). The calculated average LCL heights were 0.12 km, 0.13 km, 0.16 km and 0.20 km in the winter, premonsoon, monsoon and postmonsoon periods, respectively, exhibiting a negligible difference in the four seasons. The average heights of the 0 °C isotherm layer from ERA5 in the winter, premonsoon, monsoon and postmonsoon periods were 1.53 km, 2.67 km, 4.01 km and 2.81 km, respectively, and the average CTHs were 5.13 km, 6.64 km, 6.97 km and 5.39 km, respectively.
Clouds between LCL and the 0 °C isotherm layer level are defined as warm clouds, and those between the 0 °C isotherm layer level and CTH are considered cold clouds [
18]. The cloud rain process is predominant during the winter precipitation period, which is evident from the significant cold cloud depth of 3.60 km compared to the relatively short warm cloud depth of 1.41 km. The microphysical and dynamic mechanisms (e.g., updraft, particle formation and particle growth processes) in the cold rain process are different from those in the warm rain process, leading to significant discrepancies in DSD characteristics [
39]. Ice crystals grow quickly above the 0 °C isotherm level in the winter precipitation process. The higher concentration of large drops found in winter precipitation may be attributed to melted ice particles, such as low-density, large snow particles, and/or graupel (e.g.,
Figure 5 and
Figure 9a). In addition, wind and humidity are two important meteorological elements affecting the evaporation process [
48]. Stronger evaporation is expected in the winter season due to a larger wind speed and less water vapor (
Figure 14), reducing the concentration of small raindrops (e.g.,
Figure 5 and
Figure 9a).
The premonsoon precipitation was characterized by a high concentration of large drops (e.g.,
Figure 4,
Figure 5 and
Figure 9). The average cold cloud depth (3.97 km) was much larger than the average warm cloud depth (2.54 km) in the premonsoon season, indicating that the cold rain process is also predominant in this period. The melted ice particles (e.g., graupel and/or snow particles) could result in the formation of larger drops [
49]. Convective activity frequently occurs in the premonsoon season, as evidenced by the probability density function (PDF) of TBB (
Figure 13b), which is often used to assess the intensity of convective activity [
50]. The smaller the TBB value is, the deeper the development of convective clouds. The threshold of TBB ≤ −32 °C is often used to differentiate the development of convection. The probability of TBB ≤ −32 °C was the highest in the premonsoon season, indicating that intense convective activity occurs more frequently during this period. The westerly winds prevail over the TP during this period, and cold air masses can easily invade the middle to upper troposphere. In addition, solar radiation causes an increase in surface heating in the daytime. This destabilization of the troposphere would be beneficial to the formation of dry convection in the premonsoon season [
51].
In addition, the largest surface wind speed (e.g.,
Figure 14a) among the four seasons may lead to relatively strong evaporation in the premonsoon season, which was partly responsible for the relatively low concentration of small drops. Thus, a higher concentration of larger raindrops and a lower concentration of small raindrops were observed for higher rainfall rate categories (e.g.,
R > 5 mm h
−1) and convective rainfall types (e.g.,
Figure 5d–f and
Figure 9b). Therefore, the intensity increase in premonsoon precipitation was more attributed to the increase in drop diameter (e.g.,
Table 4).
During the monsoon season, although the CTH was highest, the average thickness of warm clouds (3.85 km) was significantly larger than that of cold clouds (2.96 km) (
Figure 13a). Therefore, monsoon rainfall was dominated by warm rain processes, which tended to produce higher concentrations of small raindrops owing to collisional and coalescence processes (e.g.,
Figure 4,
Figure 5 and
Figure 9). A large amount of water vapor is carried to Mêdog by the Indian Ocean monsoon in this season (
Figure 14b), which is conducive to the formation of warm clouds and the production of abundant small raindrops. Weak evaporation is expected in the monsoon season due to the smaller wind speed and wet environment, contributing to the production of small raindrops. The increase in precipitation intensity in the monsoon season may be mainly attributed to the significant increase in the concentration of raindrops (
Table 4).
The postmonsoon precipitation had less rainfall total and was also characterized by a higher concentration of small drops (i.e.,
Figure 4 and
Figure 5b–d). Although the mean depth of warm clouds (2.61 km) was similar to that of cold clouds (2.58 km) in this season,
Figure 14 exhibits humid and weak wind atmospheric conditions, which are favorable to the production of small drops.
5. Conclusions
In this paper, the seasonal variation in DSDs and microphysical parameters among the winter, premonsoon, monsoon, and postmonsoon periods were investigated using PARSIVEL disdrometer data from July 2019 to June 2020 in Mêdog, which is located in the southeast of the TP and at the entrance of the vapor channel in the YGC. In addition, EAR5 reanalysis data, FY-4A satellite products and AWS observations were used to address the possible causative factors for the distinct seasonal variation in DSDs. The conclusions of this study are outlined as follows:
(1) Precipitation mainly occurs during the monsoon period in Mêdog, contributing approximately 57% to the annual rainfall totals, and small drops are dominant in the four seasons. Weak rainfall (i.e., R < 1 mm h−1) with small drops (i.e., Dm < 1 mm) and low concentrations (i.e., NT < 250 m−3) occurs frequently in the four seasons in Mêdog. However, taking the contributor to rainfall into account, drops with 1 ≤ Dm < 2 mm are the largest contributor in the four seasons, and the weak rainfall with R < 1 mm h−1 is the largest contributor in Mêdog except during the monsoon season, during which, rainfall with 2 ≤ R < 5 mm h−1 is the largest contributor. For the average spectrum of the four seasons, the monsoon season precipitation has the narrowest spectrum width and is characterized by the highest (lowest) concentration of small (large) drops. The winter (postmonsoon) precipitation has the lowest (highest) concentration of small (large) drops. In terms of rain rate classes, a higher (lower) concentration of small (large) raindrops can be found in the monsoon season for all the considered rainfall rate classes in this study. More large drops and fewer small drops are observed in winter precipitation with R < 5 mm h−1. For heavy rainfall (i.e., R > 5 mm h−1), the premonsoon precipitation exhibits a higher concentration of large drops.
(2) Mêdog stratiform precipitation in the four seasons has a similar mean Dm value of approximately 1.0 mm but exhibits a distinct difference in the mean value of log10(Nw). Monsoon stratiform rain has the highest mean log10(Nw) value of 3.75, followed by postmonsoon rain, and the winter season has the lowest mean log10(Nw) value of 3.28. The convective rainfall during the monsoon season is characterized by the highest concentration of limited-size drops and is identified as maritime-like. Premonsoon convective rain has predominantly larger drops than other seasons. The largest mean Dm (1.67 mm) and the lowest mean log10(Nw) (3.70) are observed in the premonsoon convective rainfall, which could be considered a transition between maritime-like and continental-like conditions.
(3) The relationships of µ–Λ and Z–R corresponding to different seasons were also fitted. The µ–Λ relationships of the different periods show little discrepancy. The fitted Z–R relationships for stratiform precipitation exhibit little seasonal variation, and winter stratiform rain has a larger coefficient A and exponent b. The fitted Z–R relationships for convective precipitation show evident discrepancies among the premonsoon, monsoon, and postmonsoon periods. The Z–R relationship in monsoon convective rainfall has a smaller (larger) coefficient A (exponent b) than in other seasons, indicating a higher rain rate in monsoon convective precipitation for a given radar reflectivity. The empirical relationship of Z = 300R1.4 at midlatitudes would cause the severe underestimation of convective rain in Mêdog, especially during the monsoon period.
(4) The possible causative meteorological environments responsible for the seasonal variation in DSDs in Mêdog were discussed. Westerlies prevail over the whole TP in the premonsoon season, and rainfall is dominated by cold rain processes, resulting in the formation of large raindrops via the melting of frozen particles. In addition, less water vapor and a larger wind speed contribute to stronger evaporation, which probably leads to a lower concentration of small drops in the premonsoon precipitation. During the monsoon period, abundant warm and humid mass air intrudes from the Indian Ocean into Mêdog, and warm rain processes prevail in this period, producing many small raindrops via active collision and coalescence processes. Atmospheric conditions are characterized by humid and weak winds in the postmonsoon season, which is favorable to the production of small drops.
Notably, this work focused on the seasonal variation in DSD based on disdrometer data in Mêdog. The parameters of gamma distribution model of DSDs are trying to be used to improve the microphysical parameterization scheme of precipitation in the local numerical model. The detailed performance of the model will be evaluated later. Furthermore, disdrometer observations at more locations over the TP will be used to explore the temporal and spatial variation in DSDs. In addition, the vertical structure of DSDs in different seasons will be explored in future research by jointly using K-band Micro Rain Radar and X-band dual-polarization radar observations.


