
An SAR Ship Object Detection Algorithm Based on Feature Information Efficient Representation Network


1
College of Automation, Chongqing University of Posts and Telecommunications, Chongqing 400065, China
2
College of Computer Science, Chongqing University, Chongqing 400044, China
3
School of Science, Chongqing University of Posts and Telecommunications, Chongqing 400065, China
*
Author to whom correspondence should be addressed.
Remote Sens. 2022, 14(14), 3489; https://doi.org/10.3390/rs14143489
Submission received: 27 June 2022
/
Revised: 15 July 2022
/
Accepted: 16 July 2022
/
Published: 21 July 2022
(This article belongs to the Topic Artificial Intelligence in Sensors)
Abstract
:In the synthetic aperture radar (SAR) ship image, the target size is small and dense, the background is complex and changeable, the ship target is difficult to distinguish from the surrounding background, and there are many ship-like targets in the image. This makes it difficult for deep-learning-based target detection algorithms to obtain effective feature information, resulting in missed and false detection. The effective expression of the feature information of the target to be detected is the key to the target detection algorithm. How to improve the clear expression of image feature information in the network has always been a difficult point. Aiming at the above problems, this paper proposes a new target detection algorithm, the feature information efficient representation network (FIERNet). The algorithm can extract better feature details, enhance network feature fusion and information expression, and improve model detection capabilities. First, the convolution transformer feature extraction (CTFE) module is proposed, and a convolution transformer feature extraction network (CTFENet) is built with this module as a feature extraction block. The network enables the model to obtain more accurate and comprehensive feature information, weakens the interference of invalid information, and improves the overall performance of the network. Second, a new effective feature information fusion (EFIF) module is proposed to enhance the transfer and fusion of the main information of feature maps. Finally, a new frame-decoding formula is proposed to further improve the coincidence between the predicted frame and the target frame and obtain more accurate picture information. Experiments show that the method achieves 94.14% and 92.01% mean precision (mAP) on SSDD and SAR-ship datasets, and it works well on large-scale SAR ship images. In addition, FIERNet greatly reduces the occurrence of missed detection and false detection in SAR ship detection. Compared to other state-of-the-art object detection algorithms, FIERNet outperforms them on various performance metrics on SAR images.
1. Introduction
In recent years, target detection technology based on deep learning has made great breakthroughs in detection performance, gradually replacing traditional methods, and is widely used in autonomous driving [1,2], face recognition [3,4], remote sensing object detection [5,6], pose detection [7,8], and many other fields. Among them, the target detection algorithm application of deep learning in synthetic aperture radar (SAR) ship detection has received extensive attention. Object detection methods are generally divided into two-stage detection and single-stage detection. The two-stage detection first generates a preselected box through the proposal region network, and then the detection network realizes the classification and regression of the preselected box, so it has a high target recognition accuracy, but the detection speed is slow, see R-CNN series [9,10,11]. Single-stage detection can directly get the detection results through the detection network, so the inference speed is faster. Typical examples are YOLO series [12,13,14,15], Retinanet [16], and SSD [17]. Among them, YOLOv4 proposed in 2020 can achieve a good balance between detection speed and accuracy in the process of practical application and has become one of the most widely used target detection algorithms.
Although the above methods can achieve good results when applied to SAR ship detection, due to the unique imaging mechanism of SAR images, these images are more susceptible to the influence of the atmosphere, background clutter, and illumination differences, with fewer feature details and unclear target feature information. At the same time, ship targets in SAR images are dense, and various ships are very small and blurred, and even submerged in extremely complex backgrounds, so the target detection algorithm based on deep learning misses detection and false detection in practical applications. In fact, the effective acquisition of target feature information is the key to all target detection, not only SAR ship detection. Therefore, it is necessary to construct an algorithm that can greatly enhance the expression of feature information.
Aiming at the problem of SAR target information ambiguity, some scholars [18,19] proposed optimizing the SAR image acquisition process and using the information-rich polarization method to enhance the identifiability of SAR target features. The echo intensity of the same target under different polarization methods is different, and the obtained target characteristic information is also different. The polarization method with better performance can obtain more target information. Therefore, using a reasonable polarization method in SAR can reduce the existence of interference data in the image and enhance the presentation of effective information, thereby improving the target detection performance. This is indeed a good approach. However, in the field of ship detection, the most important thing is to build an excellent target detection model, which can obtain ideal target feature information from complex image data, thereby greatly improving the effect of ship detection. At present, to obtain powerful features of image context information, the improvement of target detection algorithms mainly includes using basic neural networks that can extract richer features, fusing multiscale features, and weighting feature information. Liu et al. [20] proposed the composite backbone network, which assembled multiple identical backbones through composite connections between adjacent backbones to form a deeper backbone network for feature extraction, which improved the detection performance of the network. Liu et al. [21] proposed a path aggregation network (PANet), which fused high-level semantic information and low-level location information to obtain more feature details, thereby enhancing the feature information transmission capability of the network feature fusion module. In order to further improve the small target detection performance, Xu et al. [22] increased the number of network detection layers from three to four to obtain more feature information. Yuan et al. [23] introduced a receptive field block into the network to increase the receptive field and retain detailed feature information, generate feature maps with local context information, and improve the accuracy of the detection. Gao et al. [24] added a channel attention module (CAM) attention mechanism to the bidirectional feature pyramid network module to help the network focus on more interesting targets and improve the effectiveness of feature fusion. The above works have improved the performance of detection algorithms from different perspectives. In general, the above methods improve the network detection performance by enhancing the effective expression of image feature information.
Through the above analysis, we know that there are generally two ways to enhance feature information: a new backbone network and an optimized feature fusion network. A backbone network with a reasonable architecture and excellent application effect can indeed greatly improve the model detection performance. However, how to design a suitable network is a difficult problem. In response to this problem, this paper proposes a new feature extraction convolutional transform feature extraction network (CTFENet), which is mainly composed of convolutional transform feature extraction (CTFE) modules. The design concept of the CTFE module comes from the Swin Transformer block [25]. The Swin Transformer is mainly composed of a Swin Transformer block, which has excellent global feature capture ability, and has achieved state-of-the-art results in image classification, object detection and instance segmentation tasks. These experimental results confirm the superiority of the Swin Transformer block structure. At present, most people directly introduce the Swin Transformer to improve network performance [26,27,28], and the experimental results further prove the effectiveness of the Swin Transformer block architecture. However, few have used convolutional networks to build architecturally similar modules. Therefore, we gradually analyze the architectural composition of the Swin Transformer block to propose the CTFE block.
Introducing modules to enhance the representation of feature information in the network can indeed improve the performance of the model. For example, channel and spatial attention mechanisms are introduced in the feature fusion module. In addition to the introduction of the module, it is also a good idea to optimize the convolution extraction block in the feature fusion module. Therefore, we propose the information hybrid convolutional block(IHCB) module as a convolutional feature extraction block to enhance information exchange and enhance the integrity of information transmission and feature uniqueness.
In fact, in addition to improving the network model, improving the bounding box regression decoding formula can also enhance the effective expression of feature information, thereby greatly improving network performance, and this method does not have such problems as network complexity and model design, its implementation method is simple, and it has great results.
In view of the above ideas, this paper proposes a new feature information efficient representation network (FIERNet), conducts comparative experiments on various real complex situations and different detection algorithms, and finally confirms the effectiveness of the proposed algorithm. The main contributions of this work are listed as follows.
- This work analyzes the architecture of the Swin Transformer block, proposes the CTFE module, and then constructs the CTFENet. It further improves the feature extraction capability of the backbone network, enhances the breadth and accuracy of model feature details, weakens the interference of similar information and background information, and greatly reduces the occurrence of missed detection and false detection, thereby improving the accuracy of model detection.
- We propose the efficient feature information fusion (EFIF) module. Specifically, first of all, this module uses IHCB to realize the mixing of spatial dimension and channel dimension, strengthen the exchange of information, and further ensure the richness and integrity of feature information. Second, the EFIF module cleverly uses the channel and spatial attention mechanism to filter invalid information hierarchically and strengthen the expression of semantic information and location information, thereby improving the detection accuracy and generalization performance of the network.
- For SAR ship detection, this paper introduces and improves a new method of boundary regression decoding equation, and proposes a new decoding formula to enhance the decoding effect.
- We incrementally give the optimal combination of network modules, resulting in FIERNet. This paper demonstrates the effectiveness of the method through test results on SSDD, SAR-ship datasets, and large-scale SAR ship images.
2. Related Work
2.1. Triplet Attention Mechanism
Triplet attention [29] is a lightweight but effective module that enables cross-dimensional information interaction through rotation operations, providing significant performance gains at a reasonable computational cost. This module mainly contains three branches, two of which are used to capture the cross-channel interaction between the channel C dimension and the spatial dimension , respectively, and the remaining one is the calculation of the traditional spatial attention weight. For example, the interaction process of channel C and space W dimension is as follows: first, perform a permute operation on the input feature () to yield a dimension feature, and then perform Z-pool, convolution, and sigmoid activation function operations on the H dimension, generate spatial attention weights, and finally generate output features () through permutation. Among them, Z-pool consists of average pooling and max pooling. The interaction process of channel C and spatial H dimension is similar. The traditional spatial attention branch has no permutation operation, and other operations are similar. Finally, the output information of the three branches is added, and the average value is the final module output. The model structure diagram is shown in Figure 1.
2.2. Convolutional Block Attention Module (CBAM)
CBAM [30] is a simple and efficient convolutional neural network attention module containing two independent submodules, CAM and SAM, focusing on channels and spatial features, respectively, by which independent information inhibits and enhances the expression of the main information in the feature map [31], as shown in Figure 2, Figure 3 and Figure 4. For any given input feature map , the channel attention module presses the feature map by using global maximum pooling and mean pooling to obtain two channel descriptions, and , adds the two pooled one-dimensional vectors to the full connection layer operation, and then passes a sigmoid activation function to obtain the weight factor . After this, the weight factor F is multiplied by the element of the original feature graph to get the new feature graph . The spatial attention module performs global max pooling and average pooling on according to the space to obtain two two-dimensional vectors and . After splicing the two two-dimensional vectors generated by the pooling, a 7 × 7 convolution operation is performed, the activation function is sigmoid, and the weight coefficient is obtained. Finally, the weight coefficient and are multiplied element by element.
3. Feature Information Efficient Representation Network (FIERNet)
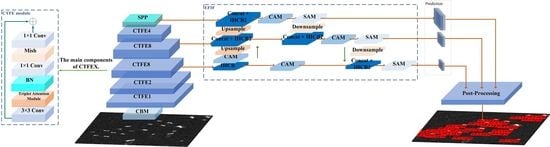
This paper proposes a target detection algorithm suitable for SAR ships. The algorithm is generally composed of a CTFENet, SPPNet, EFIF module, prediction module, and the BBRD method. The algorithm loss function consists of a regression loss function, confidence loss function, and classification loss function. Among them, the CIoU [32] loss function is used as the regression loss function, and the cross-entropy loss function is used as the confidence loss function and the classification loss function, respectively. Experiments show that the detection effect of the network on different datasets is excellent in complex environments. The network structure is shown in Figure 5.
3.1. Backbone Network
3.1.1. Convolution Transformer Feature Extraction Network (CTFENet)
The Swin Transformer model is an improved model based on the Transformer recently proposed by Microsoft. It achieves better results in vision tasks through the Swin Transformer module and can be applied to various vision tasks. Meanwhile, extensive experiments are also conducted to demonstrate the superiority of the Swin Transformer block architecture. The Swin Transformer module is mainly composed of windowed multihead self-attention (W-MSA), shifted windowed multihead self-attention (SW-MSA), layer normalization, and a multilayer perceptron (MLP). Among them, the W-MSA models the input image locally according to a fixed window, the SW-MSA realizes the interactive connection of adjacent window information, and the MLP is composed of a fully connected layer and a GELU activation function.
Inspired by the Swin Transformer block, this paper proposes a convolutional feature extraction module suitable for SAR ship target detection: the convolutional transformer feature extraction (CTFE). This module consists of a 3 × 3 convolution, triplet attention, the Mish activation function, an MLP, and a residual structure. To realize the information integration of different feature channels, the network depth and complexity are normalized. This paper uses 1 × 1 convolutions to build MLPs instead of fully connected layers, because the fully connected layer cannot realize the increase or decrease of the dimension of the feature channel. The overall structure of the module is shown in Figure 6.
This module can extract richer target feature details, resulting in better detection results. From the later experimental results, this module achieves the original intention of this paper. Specifically, the extraction operation for the input image information of this module is mainly composed of the following steps.
- (1)
- Use a 3 × 3 convolution to extract more image information and better global features, and pass this extracted information into the module. At the same time, the input channel is dimensionally reduced to further reduce the network parameters of the model and increase the practicability of the network.
- (2)
- Use triplet attention to achieve cross-dimensional information interaction, and weight the corresponding feature information to highlight important image feature details and enhance the network’s recognition ability.
- (3)
- Batch-normalize the output of the attention module to make the distribution of the output data more stable, accelerate the learning speed of the model, and alleviate the problem of gradient disappearance.
- (4)
- Using two 1 × 1 convolution and Mish activation functions (), realize the dimensionality reduction and increase the number of channels in the feature map of the entire module, enhance the information interaction between channels, and improve the nonlinear expression ability of the model.
The instructions for using the 3 × 3 convolution and triplet attention are as follows: Use the 3 × 3 convolution kernel as a sliding window to convolve the input image to extract feature information. Then, the triplet attention is used to realize cross-dimensional information interaction and enhance the richness of feature information. The description of the batch normalization and activation function is as follows: the module abandons a large number of batch normalization and activation function combination operations between traditional convolution blocks, and only performs separate corresponding operations between 1 × 1 convolutions, and the follow-up experiments show that the method is effective. That is, the higher detection efficiency is achieved with a more streamlined architecture. This module innovatively integrates Swin’s architecture and convolution method, and thus proposes a convolution module with a better extraction effect, which has a good effect on SAR ship detection.
In this paper, a CTFE Network (CTFENet) is constructed based on the CTFE module, and the network is used as the extraction backbone of SAR ship target features to obtain more detailed feature information. Specifically, CTFENet consists of five modules: CTFE1, CTFE2, CTFE8, CTFE8, and CTFE4. At the same time, in order to further enhance the learning ability of the network and retain more feature details, this paper refers to the practice of YOLOv4, and introduces a cross stage partial (CSP) [33] connection structure for each module. Taking CTFE2 as an example, we use the CSP structure to divide the module into two parts. The main part continues to stack the CTFE, and another part is directly mapped and merged with the main part to form a larger residual edge. As shown in Figure 7. This method can not only solve the problem of gradient disappearance and enhance the learning ability of the model, but also reduce the network parameters and reduce the cost of model training.
3.1.2. Spatial Pyramid Pooling (SPP) Network
SPPNet [34] uses four different scales of maximum pooling to process the feature map. The size of the pooling kernel of the maximum pooling is 1 × 1, 5 × 5, 9 × 9, and 13 × 13, and the 1 × 1 pooling kernel operation can be regarded as no processing, as shown in Figure 8. In this paper, SPPNet is placed in the last layer of the backbone extraction network as a pooling layer, and multiple pooling windows are used to process the feature information to separate the feature information of the significant upper and lower layers, thereby greatly increasing the network receptive field.
3.2. Effective Feature Information Fusion (EFIF) Module
3.2.1. Information Hybrid Convolutional Block (IHCB)
To better realize the mixing of spatial and channel dimensions during convolution and further ensure the richness and integrity of feature information, this paper proposes an information hybrid convolutional block (IHCB). This module consists of a 1 × 1 convolution, LeakyRelu activation function, batch normalization, and ConvMixer [35]. Among them, the ConvMixer consists of a depthwise separable convolution, GELU activation function, residual structure, and batch normalization. The IHCB is shown in Figure 9. This paper applies the IHCB and IHCB-2 modules, respectively, where the number 2 represents the “X” in the figure.
3.2.2. EFIF Module
The path aggregation network (PANet) module is often used for feature fusion, superimposing feature information, and improving network performance. However, when the module performs feature fusion, it does not perform weighting processing on different regions in the feature map, that is, it is considered that the contributions of different feature map regions to the final prediction of the network are the same. This is unreasonable because, in real-life scenarios, the objects to be detected often have rich and complex contextual information. The operation of the direct feature fusion of the PANet module leads to the repeated superposition of a large amount of irrelevant information, which affects the network’s judgment of the main feature information of the target to be detected, resulting in missed detection and false detection.
The special semantic and location information of images is the basis for network recognition and localization. In a deep convolutional neural network, the shallow features contain location information, which is universal and conforms to the general characteristics of the target to be detected. The deep features contain rich semantic information, are more abstract and complex, have the uniqueness of the target to be detected, and are more suitable for adding attention mechanisms to enhance the expression of target semantic information and suppress irrelevant information.
In view of the above analysis, this paper proposes an effective feature information fusion (EFIF) module. This module uses IHCB as a feature acquisition convolution block, and at the same time comprehensively considers the influence of overlapping feature information of each feature layer of the network, cleverly uses the channel attention and spatial attention mechanism to filter invalid information hierarchically, and strengthens the expression of semantic information and location information.
Firstly, the channel attention module is introduced into the semantic information path with high-level features, which explicitly models the interdependence between channels, determines the content that needs to be focused on the feature map of each layer, and assists in completing the target recognition task. Secondly, a spatial attention module is introduced before each head network, the spatial attention matrix is extracted based on the preserved spatial position information, and the extracted matrix is used on the corresponding feature map of the semantic information path to determine the need to focus on a position to assist in the completion of target positioning tasks. The module structure is shown in Figure 10. We describe the detailed operation below.
Given different input feature maps , , and , is a high-level feature map, which contains the most semantic information, which helps the network to identify the target to be detected. First, we perform IHCB on to obtain the feature map . We use CAM to perform the first information weighting on many feature channels in to obtain . This operation focuses on “what” is meaningful, given an input image, that is, the weighted processing of important semantic information. Secondly, is upsampled and is superimposed on the channel dimension, the superimposed feature map is subjected to IHCB2, and then upsampling is performed again to obtain . Finally, the information of and is superimposed, and then the information is extracted to obtain after IHCB2. aggregates feature information from different feature layers, resulting in rich and complex semantic information and location information. Then, we add the CBAM attention mechanism to , weight the channel and space, respectively, pay attention to the meaningful features in the channel and space, and obtain the network output feature information . The rest of the and acquisition process is similar to . In short, the EFIF module output is computed as:
3.3. Prediction Module
The prediction module mainly consists of a 3 × 3 convolution, batch normalization, LeakyReLU, and 1 × 1 convolution. This module processes the multiscale feature information output by the EFIF module, and obtains three output feature layers with different scales, respectively. Three kinds of anchors are set on each feature layer, and K-means clustering is used to obtain anchors according to different datasets and image input sizes. The smallest feature layer has the largest receptive field, applies larger anchors, and detects larger objects. The medium feature layer has a medium receptive field, applies medium-sized anchors, and detects medium-sized objects. Larger feature layers have smaller receptive fields, apply smaller anchors, and detect smaller objects. The specific dimensions of the prior boxes on the three prediction feature layers are shown in Table 1.
3.4. Postprocessing—BBRD Method
The bounding box regression is to obtain the final prediction box. The decoding process of the predicted value can further improve the performance of the object detection. In Figure 11, the purple box represents the real box, and when the prediction box is not positioned, i.e., , even if the target in the real box is a dog, when the dog is identified by the classifier, it can still not be detected. If we fine-tune the prediction box to adjust the frame closer to the real frame of the target, we can improve the positioning accuracy, and thus improve the detection performance. Joseph Redmon et al. then proposed a border regression method based on previous work, which is also the main method introduced in the rest of this section.
Object detection edges are generally represented by a four-dimensional vector , representing the central point coordinates and width and height of the edges, respectively. In Figure 11, the red box O, represents the original prediction box and the purple box G represents the real box of the target. The bounding box regression refers to finding a relationship, so that the predicted candidate box O can get a regression bounding box S that is closer to the real box G through mapping.
Given , we search for the mapping relation such that and .
The main steps of finding the mapping relationship are the border center point translation and wide height scaling; the formula can be given as:
(1) Central point translation
(2) Scale down
Where is the predictive value of the network output, is the upper left coordinate of the grid cell at the center point of the candidate target box , is the sigmoid function, and . The control offset is within the range (0, 1), and the final obtained is the parameter value of the final predicted box. Because the value domain of the sigmoid function is an open interval, the or cannot take the boundary value, therefore or . When the central point coordinates of the regression box need to be offset to the critical point, and the adjustment range is unable to take the boundary value, it is difficult to predict the corresponding information, which consequently affects the target detection performance.
Therefore, we introduce a method [36] to improve the center point translation of the original formulation, which we formulate as
Although the above method can solve the problem of and simultaneously, the penalty term added to the central point translation formula is relatively too large, resulting in a too large frame offset range and unsatisfactory actual effect. In this case, the present paper improves the formula penalty term to reduce the order of magnitude and further obtain a precise offset range.
The central point formula presented in this paper is as follows:
In this formula, the is taken as . It is evident from the formula that the coordinate offset of the center point of the candidate target box is multiplied by , and minus , changing from the original value domain to , making it easier to predict the center point in the candidate target box of the grid boundary, and at the same time, we avoid the value domain being so large as to cause an excessive candidate box offset, which affects the detection performance. The bounding box regression decoding (BBRD) process is shown in Figure 12.
4. Experimental Results and Analysis
4.1. Dataset and Experimental Conditions
We apply FIERNet to the SAR Ship Detection Dataset (SSDD) [37] and SAR-ship [38] dataset to test the detection performance of the network.
SSDD dataset: SSDD is the first publicly available dataset for SAR ship target detection. It consists of 1160 images containing 2456 ship targets with a resolution of 1–15 m. The dataset is divided into many different scenes, including simple scenes with clean backgrounds, complex scenes with obvious noise, dense scenes with complex environments, and near-coastal buildings disturbing scenes. However, the results obtained on such a dataset are more credible. We set the ratio of training and test sets to 8:2.
SAR-ship dataset: The SAR-ship dataset is composed of 102 Gaofen-3 and 108 Sentinel-1 sliced images, the image size is 256 × 256, the total number of images is 43,819, and the number of ships is 59,535, which are annotated in the Pascal VOC format. The ship slice pictures in this dataset have complex environments and changeable scenes, and most of the ships are fused with the background, making them difficult to detect. The ship target has fewer feature details and weak feature information, which is beneficial to reflect the powerful feature information acquisition capability of the network proposed in this paper. We divide the dataset into a training set and test set with an 8:2 distribution ratio.
The hardware and software platform parameters implemented in this algorithm are shown in Table 2.
In the early stage of the model training built in this paper, the model hyperparameters need to be initialized [39]. The model hyperparameter initialization based on SSDD is shown in Table 3. The model hyperparameter initialization for the SAR-ship dataset was similar to that of the SSDD dataset. It is only because the scales of the two datasets are different that some parameters of FIERNet on the SAR-ship dataset are different. The input size in the SAR-ship dataset was 256 × 256, the training steps were 100, and the batch size was 16.
4.2. Experimental Evaluation Metrics
In order to evaluate the effectiveness and performance of FIERNet more scientifically, this paper selected performance indicators such as Precision (P), Recall (R), F1 score, Average Precision (AP) and mean Average Precision (mAP) for testing and verification.
The formulas for calculating P and R are as follows.
where TP and FP represent the number of correctly classified positive samples and the number of misclassified positive samples, respectively. FN is the number of missed samples.
The F1 score is often used as the final measure for multiclassification problems, i.e., the harmonic mean of precision and recall. The larger the F1 value, the better the model performance, and the smaller the value, the worse the model performance. The formula for calculating the F1 score for each detection category is as follows.
The formula for calculating AP is
Taking the mean value of AP of all categories to get mAP, its calculation formula is as follows.
The log-average miss rate (LAMR) represents the missed detection rate of the test set in the dataset. The larger the LAMR, the more missed targets are represented, whereas the smaller the LAMR, the stronger the model detection performance.
4.3. Ablation Experiments
In this section, ablation experiments are performed on the methods proposed in this paper, and the advantages and disadvantages of each method and their impact on the performance of the algorithm are discussed in detail. This experiment used the general dataset SSDD for validation. The FIERNet proposed in this paper was designed based on the architecture of YOLOv4. Therefore, in the following experiments, we used YOLOv4 as the benchmark module for experimental comparison.
As shown in Table 4, the performance metrics change when the different modules combine, but not all module combinations can bring about a performance improvement. For example, the Recall of the combined module using the CTFENet + BBRD was decreased by 1.65% compared to the performance of the BBRD module alone, the reason being that each improvement technique is not completely independent and even though some techniques are effective when used alone, they are not effective in combination. Therefore, here we gave an incremental order of optimal network performance for various performance metrics [36]: benchmark module + EFIF module + CTFENet + BBRD(FIERNet).
Benchmark module + BBRD(FIERNet-B): First, we considered optimizing the postprocessing method of the network model to improve the localization accuracy of detection boxes, because in general, improving the BBRD method only affects the network decoding process, and has little or no impact on the number of network parameters and inference time. We optimized the original boundary regression decoding formula and the mAP, Recall, Precision, and F1 increased by 0.79%, 0.37%, 0.41%, and 1.00%, respectively, and the LAMR decreased by 2.00%.
Benchmark module + BBRD + CTFENet (FIERNet-BC): Next, since it is difficult to continue to improve the model performance without changing the network structure, we proposed a new backbone network CTFENet to strengthen the feature extraction effect and bring about an effective improvement in performance. Among them, the mAP, Precision, and LAMR had the best effect. The mAP and Precision increased by 1.28% and 1.76%, respectively, and the LAMR decreased by 2.00%.
Benchmark module + BBRD + CTFENet + EFIF (FIERNet): The transmission and fusion module of feature information is an indispensable part of the network model, which has a great impact on the performance of the model. Therefore, this paper proposed the EFIF module as the feature transmission and fusion module of FIERNet to reduce missed and false detection and enhance network performance. After experimental verification, the performance of this module met our expectations, and the addition of EFIF could improve the Recall by 4.77% and the LAMR by 4.00%.
Finally, compared with the benchmark model, FIERN was proposed; its mAP, Recall, Precision, and F1 were improved by 2.96%, 3.49%, 3.12%, and 4.00%, respectively, and the LAMR was reduced by 8.00%.
In Figure 13, we selected ship target images in different situations for a heatmap visualization. The brighter the color of an area in the heatmap, the more interested the model is in that area, and the more likely the target is. For ship targets that are difficult to detect and easy to miss, FIERNet can accurately obtain the rich feature details of small ship targets and give correct judgments. However, it is difficult for YOLOv4 to capture the feature information of small targets, so the detection effect is not ideal, as shown in the blue and green boxes in Figure 13. In the detection of near-shore ship targets, it is prone to misdetection, that is, a nonship target is mistaken for a ship target. FIERNet can effectively weaken background information, focus on effective information, give clear ship characteristics, and finally obtain ideal detection performance. YOLOv4 is easily disturbed by background information, so it gives wrong judgments, as shown in the red box in Figure 13.
4.4. Experimental Analysis of BBRD Decoding Formula
In order to facilitate the experimental analysis, this paper calls the original BBRD method BBRD-1, the method introduced from [36] is called BBRD-2, and the method proposed in this paper is called BBRD-N.
The bounding box regression decoding is related to the presentation of the network output information and is one of the key steps of the target detection algorithm. Therefore, we proposed a new decoding formula to enhance the decoding effect. As shown in Table 5, the bounding box decoding formula proposed here achieves good results, confirming the effectiveness of reducing the order of magnitude of the penalty terms. At the same time, BBRD-2 also achieved good results, indicating that the improvement of BBRD is necessary.
Figure 14 shows the experimental results for different a and N. It can be seen from Figure 14 that the improvement of the penalty item is necessary, and the overall performance indicators after the improvement are improved to varying degrees. This paper selected 11 different values for verification. It can be seen from Figure 14a that when a is 1.03, 1.04, and 1.05, the overall performance index is the best. Therefore, based on these three values, we selected 13 different N values for the experiments, as shown in Figure 14b–d. We evaluated these three curves as a whole, and we found that when a = 1.04 and N = 12, the mAP (94.14), Recall (87.89) and Precision (98.16) achieved their maximum value. Therefore, this paper selected a = 1.04 and N = 12 to construct the BBRD-N formula for bounding box regression decoding. In addition, it can be seen from Figure 14b–d that when N = 2, no matter what the value of a is, the maximum value of the current performance index cannot be reached. This verifies the idea proposed in this paper when optimizing the BBRD-2 formula: the penalty term is too large, which leads to reduced model performance.
4.5. Analysis of Experimental Results Based on SSDD Dataset
The comparison of evaluation indicators between FIERNet and multiple models is shown in Table 6. It is obvious that the method proposed in this paper is excellent, and the model achieves amazing detection results. Our method obtains the best mAP (94.14%), Recall (87.89%), and F1 score (93%). Specifically, the mAP of FIERNet is 22.24% higher than Faster RCNN, 2.97% higher than YOLOv4, and 5.22% higher than YOLOX [40]. The Recall of FIERNet is 14.68% higher than SSD512 and 11.59% higher than SAR-ShipNet [41]. In addition, compared to other methods, the F1 of FIERNet is at least 4% higher. To sum up, the performance of FIERNet is amazing, and it also demonstrates the effectiveness and applicability of the method proposed in this paper.
Figure 15 shows the PR and F1 curves for different models. The PR curve represents the relationship between precision and recall, and the area enclosed by it and the coordinate axis is the mAP value of each model. The F1 curve is an average of precision and recall, which represents the overall performance of the model. It can be intuitively seen from the figure that the F1 and mAP values of FIERNet are higher, which strongly demonstrates the effectiveness and superiority of the model. Figure 16 shows the visual detection results of FIERNet, CenterNet [42], and YOLOX. It can be seen that FIERNet has excellent application effects for ship detection in complex environments. For example, CenterNet and YOLOX experience false detections, mistaking ship-like targets for ships, as shown in the yellow boxes. Ships in SAR images belong to the category of small targets, occupying fewer pixels, and are easily affected by background factors, making it difficult to detect targets. During the detection process of CenterNet and YOLOX, missed detection occurred, as shown in the green box in Figure 16. However, FIERNet can obtain the contextual information of the target from the complex background, and then detect the ship target. FIERNet also has performance that is not inferior to other algorithms for dense target detection. The above conclusions prove that FIERNet can be applied to SAR ship detection in various scenarios.
To further dissect the FIERNet detection process, we show the feature information changes of the FIERNet network during the ship detection process in Figure 17. From Figure 17b we can clearly see that all three detection heads of FIERNet capture the main feature information that is beneficial for ship detection. Even the eigenhead (16 × 16), which is mainly used for large target detection, obtains obvious target information, marking the approximate location of the ship target. Combining the other two detection heads with more explicit ship feature information, we can finally get Figure 17c. Comparing Figure 17a, we find that FIERNet detected all the targets, and we compared the position and size of the detection box and the real box to find that they were basically the same. This verifies the validity and soundness of the method proposed in this paper.
4.6. Analysis of Experimental Results Based on SAR-Ship Dataset
The SAR-ship dataset is large in scale, the ship target environment is complex, there are many negative samples, the target is dense, and the detection is extremely difficult. However, such a dataset can better reflect the superiority of the network and the credibility of the experimental results. Therefore, this paper applied FIERNet to this dataset for testing.
The input size of the image affects the detection accuracy of the network model. Many researchers [16,17,44] have demonstrated that the larger the size of the input image, the better the detection effect of the network model on the target. Therefore, it was reasonable for us to use FIERNet with an input size of 256 in Table 7 to compare with other advanced object detection algorithms that used larger input sizes. Such comparative experiments are challenging and better demonstrate the effectiveness of FIERNet. As shown in Table 7, the overall performance of FIERNet on large-scale datasets is better than that of other advanced target detection algorithms, and all performance indicators have reached an ideal state. Overall, FIERNet’s mAP is 1.81~16.82% higher, its Recall is 8.05~22.61% higher, and its F1 is 6~14% higher. This shows that FIERNet has good generalization performance and applicability. It is not limited to a single dataset, but also has the potential for generalization to more complex datasets.
To further highlight the strong detection performance of FIERNet, we deliberately selected multiple sets of hard-to-detect images to visualize the detection effect. The ship target pointed by the yellow arrow in Figure 18 is integrated with the surrounding background, and the feature information is difficult to extract and easy to miss. However, FIERNet can extract unique ship features with a powerful network model, and then accurately detect ship targets. Due to the small size of SAR targets and too many similar targets, it is easy to lose ship feature information during the network detection process, resulting in false detection. For such problems, FIERNet still has good performance, as shown in the blue box in Figure 18. FIERNet has excellent detection performance for hard-to-detect and easy-to-misdetect objects, so it should also have good detection results for ship objects in other situations. To test this idea, we continuously detected nearshore building disturbances and dense target images, as shown in the second row of Figure 18. We can see that FIERNet still performs well with a strong object detection ability.
4.7. Verification Based on Complex and Large-Scene SAR Images
In this section, we used large-scale complex SAR ship images from two different scenes from the LS-SSDD-v1.0 dataset [45] to verify the practicability and generalization of FIERNet. The picture scenes were: Campeche and Singapore Strait, with resolutions of 25,629 × 16,742 and 25,650 × 16,768, respectively. In this verification link, in order to further evaluate the generalization and soundness of FIERNet, instead of using the LS-SSDD-v1.0 dataset as the training set for training, we used the FIERNet trained on the SSDD dataset with a resolution of 512 × 512 as the test model. Due to limited computer performance, it could not support the testing of large-scale SAR images. Thus, each large-scale SAR image was divided into 600 subimages of 800 × 800 size. We separately fed the subimages of each SAR image into the FIERNet network to detect the performance.
Compared with other advanced target detection methods, the performance indicators of FIERNet on large-scale SAR images were still excellent. For example, the mAP of FIERNet was 4.69% and 7.5% higher than that of YOLOv4, the Recall was 6.65% and 8.79% higher than that of YOLOVX, and the F1 indicator was also much higher than that of the other methods, as shown in Table 8. This also proves that FIERNet has strong generalization performance and soundness, and has the potential for large-scale dataset promotion.
As can be seen from Figure 19, these two images have very complex backgrounds, large scales, and a high detection difficulty. However, under such conditions, FIERNet can still detect many small ship targets and give correct detection results, with few missed detection and false detection. This is shown by the enlarged area of the blue box in Figure 19.
5. Conclusions
Aiming at the problems of fuzzy feature information, complex background, and difficulty in distinguishing ship targets in SAR images, a deep learning-based detection method for ship SAR images in the marine environment was proposed. We constructed a feature information efficient representation network (FIERNet) to achieve an efficient representation of the target information to be detected.
Firstly, this paper proposed CTFENet as a feature extraction network to extract broader and richer feature details. The network was built on the CTFE module, a module that implemented the Swin Transformer module architecture using convolutions. The CTFE module mainly consisted of a 3 × 3 convolution, triplet attention, Mish activation function, MLP, and a residual structure.
Secondly, the EFIF module was used to enhance the effective fusion and transfer of feature information. First, IHCB was used to realize the mixing of spatial and channel dimensions, strengthen the exchange of information in different dimensions, and further enrich the feature information of the target. Then, we used the channel and spatial attention mechanism to filter invalid information hierarchically and strengthen the expression of semantic information and location information.
Thirdly, the new BBRD method was used to optimize the postprocessing process of the network, strengthen the decoding effect, and further clarify the position of the prediction frame, thereby enhancing the performance of the target detection.
The FIERNet method proposed by the above methods could obtain powerful feature information, thereby greatly improving the network performance. In this paper, we successively used SSDD, SAR-ship datasets, and large-scale SAR ship images to demonstrate the superiority and applicability of the FIERNet method. In the future, we will explore lightweight processing of the network, hoping to achieve excellent accuracy and detection speed at the same time. For example, applying a Ghost [46] convolution instead of the 3 × 3 convolution, appropriately reducing the number of backbone network layers, pruning the channels’ branch operations, using the Focal-EIOU [47] regression loss function, etc.
Author Contributions
Conceptualization, J.Y. and T.W.; methodology, J.Y. and T.W.; software, T.W., X.Z. and W.Z.; validation, J.Y., T.W., S.Z. and H.P.; formal analysis, T.W., H.P., X.Z. and W.Z.; investigation, T.W.; resources, J.Y. and S.Z.; data curation, T.W.; writing—original draft preparation, T.W.; writing—review and editing, J.Y., T.W., S.Z. and H.P.; visualization, T.W.; supervision, J.Y.; project administration, J.Y.; funding acquisition, J.Y. All authors have read and agreed to the published version of the manuscript.
Funding
This research was funded by “EEG recognition and service robot control based on structure optimization deep network in the background of high noise”, grant number 61673079.
Institutional Review Board Statement
Not applicable.
Informed Consent Statement
Not applicable.
Data Availability Statement
The data presented in this study are available upon request from the corresponding author.
Conflicts of Interest
The authors declare no conflict of interest.
Abbreviations
The following abbreviations are used in this manuscript:
| FIERNet | Feature information efficient representation network |
| CTFE | Convolution transformer feature extraction |
| CTFENet | Convolution transformer feature extraction network |
| CIoU | Complete Intersection over Union |
| EFIF | Effective feature information fusion |
| IHCB | Information hybrid convolutional block |
| CBAM | Convolutional block attention module |
| CAM | Channel attention mechanism |
| SAM | Spatial attention mechanism |
| PANet | Path aggregation network |
| BBRD | Bounding box regression decoding |
| SSDD | SAR Ship Detection Dataset |
References
- Wei, J.; He, J.; Zhou, Y.; Chen, K.; Tang, Z.; Xiong, Z. Enhanced Object Detection with Deep Convolutional Neural Networks for Advanced Driving Assistance. IEEE Trans. Intell. Transp. Syst. 2020, 21, 1572–1583. [Google Scholar] [CrossRef] [Green Version]
- Palffy, A.; Dong, J.; Kooij, J.F.P.; Gavrila, D.M. CNN Based Road User Detection Using the 3D Radar Cube. IEEE Robot. Autom. Lett. 2020, 5, 1263–1270. [Google Scholar] [CrossRef] [Green Version]
- Liang, L.; Lang, C.; Li, Y.; Feng, S.; Zhao, J. Fine-Grained Facial Expression Recognition in the Wild. IEEE Trans. Inf. Forensics Secur. 2021, 16, 482–494. [Google Scholar] [CrossRef]
- Wu, X.; He, R.; Sun, Z.; Tan, T. A Light CNN for Deep Face Representation with Noisy Labels. IEEE Trans. Inf. Forensics Secur. 2018, 13, 2884–2896. [Google Scholar] [CrossRef] [Green Version]
- Yu, J.; Wu, T.; Zhang, X.; Zhang, W. An Efficient Lightweight SAR Ship Target Detection Network with Improved Regression Loss Function and Enhanced Feature Information Expression. Sensors 2022, 22, 3447. [Google Scholar] [CrossRef]
- Wu, F.; Zhou, Z.; Wang, B.; Ma, J. Inshore Ship Detection Based on Convolutional Neural Network in Optical Satellite Images. IEEE J. Sel. Top. Appl. Earth Obs. Remote Sens. 2018, 11, 4005–4015. [Google Scholar] [CrossRef]
- Sengupta, A.; Jin, F.; Zhang, R.; Cao, S. mm-Pose: Real-Time Human Skeletal Posture Estimation Using mmWave Radars and CNNs. IEEE Sens. J. 2020, 20, 10032–10044. [Google Scholar] [CrossRef]
- Yan, S.; Smith, J.S.; Lu, W.; Zhang, B. Multibranch Attention Networks for Action Recognition in Still Images. IEEE Trans. Cogn. Dev. Syst. 2018, 10, 1116–1125. [Google Scholar] [CrossRef]
- Girshick, R.; Donahue, J.; Darrell, T.; Malik, J. Rich Feature Hierarchies for Accurate Object Detection and Semantic Segmentation. In Proceedings of the 2014 IEEE Conference on Computer Vision and Pattern Recognition, Columbus, OH, USA, 23–28 June 2014; pp. 580–587. [Google Scholar]
- Girshick, R. Fast R-CNN. arXiv 2015, arXiv:1504.08083. [Google Scholar]
- Ren, S.; He, K.; Girshick, R.; Sun, J. Faster R-CNN: Towards Real-Time Object Detection with Region Proposal Networks. IEEE Trans. Pattern Anal. Mach. Intell. 2017, 39, 1137–1149. [Google Scholar] [CrossRef] [Green Version]
- Redmon, J.; Divvala, S.; Girshick, R.; Farhadi, A. You Only Look Once: Unified, Real-Time Object Detection. arXiv 2015, arXiv:1506.02640. [Google Scholar]
- Redmon, J.; Farhadi, A. YOLO9000: Better, Faster, Stronger. In Proceedings of the 2017 IEEE Conference on Computer Vision and Pattern Recognition (CVPR), Honolulu, HI, USA, 21–26 July 2017; pp. 6517–6525. [Google Scholar]
- Redmon, J.; Farhadi, A. YOLOv3: An Incremental Improvement. arXiv 2018, arXiv:1804.02767. [Google Scholar]
- Bochkovskiy, A.; Wang, C.Y.; Liao, H.Y.M. YOLOv4: Optimal Speed and Accuracy of Object Detection. arXiv 2020, arXiv:2004.10934. [Google Scholar]
- Lin, T.Y.; Goyal, P.; Girshick, R.; He, K.; Dollár, P. Focal Loss for Dense Object Detection. In Proceedings of the 2017 IEEE International Conference on Computer Vision (ICCV), Venice, Italy, 22–29 October 2017; pp. 2999–3007. [Google Scholar] [CrossRef] [Green Version]
- Liu, W.; Anguelov, D.; Erhan, D.; Szegedy, C.; Reed, S.; Fu, C.Y.; Berg, A.C. SSD: Single Shot MultiBox Detector. In Proceedings of the Computer Vision—ECCV 2016, Glasgow, UK, 23–28 August 2016; Leibe, B., Matas, J., Sebe, N., Welling, M., Eds.; Springer International Publishing: Cham, Switzerland, 2016; pp. 21–37. [Google Scholar]
- Touzi, R. Target Scattering Decomposition in Terms of Roll-Invariant Target Parameters. IEEE Trans. Geosci. Remote Sens. 2007, 45, 73–84. [Google Scholar] [CrossRef]
- Muhuri, A.; Manickam, S.; Bhattacharya, A. Scattering Mechanism Based Snow Cover Mapping Using RADARSAT-2 C-Band Polarimetric SAR Data. IEEE J. Sel. Top. Appl. Earth Obs. Remote Sens. 2017, 10, 3213–3224. [Google Scholar] [CrossRef]
- Liu, Y.; Wang, Y.; Wang, S.; Liang, T.; Zhao, Q.; Tang, Z.; Ling, H. CBNet: A Novel Composite Backbone Network Architecture for Object Detection. arXiv 2019, arXiv:1909.03625. [Google Scholar] [CrossRef]
- Liu, S.; Qi, L.; Qin, H.; Shi, J.; Jia, J. Path Aggregation Network for Instance Segmentation. arXiv 2018, arXiv:1803.01534. [Google Scholar]
- Xu, D.; Wu, Y. MRFF-YOLO: A Multi-Receptive Fields Fusion Network for Remote Sensing Target Detection. Remote Sens. 2020, 12, 3118. [Google Scholar] [CrossRef]
- Yuan, Z.; Liu, Z.; Zhu, C.; Qi, J.; Zhao, D. Object Detection in Remote Sensing Images via Multi-Feature Pyramid Network with Receptive Field Block. Remote Sens. 2021, 13, 862. [Google Scholar] [CrossRef]
- Gao, Y.; Wu, Z.; Ren, M.; Wu, C. Improved YOLOv4 Based on Attention Mechanism for Ship Detection in SAR Images. IEEE Access 2022, 10, 23785–23797. [Google Scholar] [CrossRef]
- Liu, Z.; Lin, Y.; Cao, Y.; Hu, H.; Wei, Y.; Zhang, Z.; Lin, S.; Guo, B. Swin Transformer: Hierarchical Vision Transformer using Shifted Windows. In Proceedings of the 2021 IEEE/CVF International Conference on Computer Vision (ICCV), Montreal, QC, Canada, 10–17 October 2021; pp. 9992–10002. [Google Scholar] [CrossRef]
- Xia, R.; Chen, J.; Huang, Z.; Wan, H.; Wu, B.; Sun, L.; Yao, B.; Xiang, H.; Xing, M. CRTransSar: A Visual Transformer Based on Contextual Joint Representation Learning for SAR Ship Detection. Remote Sens. 2022, 14, 1488. [Google Scholar] [CrossRef]
- Zhang, P. RSTC: A New Residual Swin Transformer for Offline Word-Level Writer Identification. IEEE Access 2022, 10, 57452–57460. [Google Scholar] [CrossRef]
- Bountos, N.I.; Michail, D.; Papoutsis, I. Learning From Synthetic InSAR with Vision Transformers: The Case of Volcanic Unrest Detection. IEEE Trans. Geosci. Remote Sens. 2022, 60, 1–12. [Google Scholar] [CrossRef]
- Misra, D.; Nalamada, T.; Uppili Arasanipalai, A.; Hou, Q. Rotate to Attend: Convolutional Triplet Attention Module. arXiv 2020, arXiv:2010.03045. [Google Scholar]
- Woo, S.; Park, J.; Lee, J.Y.; Kweon, I.S. CBAM: Convolutional Block Attention Module. arXiv 2018, arXiv:1807.06521. [Google Scholar]
- Hu, C.; Wang, Y. An Efficient Convolutional Neural Network Model Based on Object-Level Attention Mechanism for Casting Defect Detection on Radiography Images. IEEE Trans. Ind. Electron. 2020, 67, 10922–10930. [Google Scholar] [CrossRef]
- Zheng, Z.; Wang, P.; Liu, W.; Li, J.; Ye, R.; Ren, D. Distance-IoU Loss: Faster and Better Learning for Bounding Box Regression. arXiv 2019, arXiv:1911.08287. [Google Scholar] [CrossRef]
- Wang, C.Y.; Mark Liao, H.Y.; Wu, Y.H.; Chen, P.Y.; Hsieh, J.W.; Yeh, I.H. CSPNet: A New Backbone that can Enhance Learning Capability of CNN. In Proceedings of the 2020 IEEE/CVF Conference on Computer Vision and Pattern Recognition Workshops (CVPRW), Seattle, WA, USA, 14–19 June 2020; pp. 1571–1580. [Google Scholar] [CrossRef]
- He, K.; Zhang, X.; Ren, S.; Sun, J. Spatial Pyramid Pooling in Deep Convolutional Networks for Visual Recognition. IEEE Trans. Pattern Anal. Mach. Intell. 2015, 37, 1904–1916. [Google Scholar] [CrossRef] [Green Version]
- Trockman, A.; Zico Kolter, J. Patches Are All You Need? arXiv 2022, arXiv:2201.09792. [Google Scholar]
- Long, X.; Deng, K.; Wang, G.; Zhang, Y.; Dang, Q.; Gao, Y.; Shen, H.; Ren, J.; Han, S.; Ding, E.; et al. PP-YOLO: An Effective and Efficient Implementation of Object Detector. arXiv 2020, arXiv:2007.12099. [Google Scholar]
- Li, J.; Qu, C.; Shao, J. Ship detection in SAR images based on an improved faster R-CNN. In Proceedings of the 2017 SAR in Big Data Era: Models, Methods and Applications (BIGSARDATA), Beijing, China, 13–14 November 2017; pp. 1–6. [Google Scholar] [CrossRef]
- Wang, Y.; Wang, C.; Zhang, H.; Dong, Y.; Wei, S. A SAR Dataset of Ship Detection for Deep Learning under Complex Backgrounds. Remote Sens. 2019, 11, 765. [Google Scholar] [CrossRef] [Green Version]
- Yu, J.; Zhang, W. Face Mask Wearing Detection Algorithm Based on Improved YOLO-v4. Sensors 2021, 21, 3263. [Google Scholar] [CrossRef] [PubMed]
- Ge, Z.; Liu, S.; Wang, F.; Li, Z.; Sun, J. YOLOX: Exceeding YOLO Series in 2021. arXiv 2021, arXiv:2107.08430. [Google Scholar]
- Deng, Y.; Guan, D.; Chen, Y.; Yuan, W.; Ji, J.; Wei, M. Sar-Shipnet: Sar-Ship Detection Neural Network via Bidirectional Coordinate Attention and Multi-Resolution Feature Fusion. In Proceedings of the ICASSP 2022—2022 IEEE International Conference on Acoustics, Speech and Signal Processing (ICASSP), Virtual, 7–13 May 2022; pp. 3973–3977. [Google Scholar] [CrossRef]
- Zhou, X.; Wang, D.; Krähenbühl, P. Objects as Points. arXiv 2019, arXiv:1904.07850. [Google Scholar]
- Guo, H.; Yang, X.; Wang, N.; Gao, X. A CenterNet++ model for ship detection in SAR images. Pattern Recognit. 2021, 112, 107787. [Google Scholar] [CrossRef]
- Redmon, J.; Divvala, S.; Girshick, R.; Farhadi, A. You Only Look Once: Unified, Real-Time Object Detection. In Proceedings of the 2016 IEEE Conference on Computer Vision and Pattern Recognition (CVPR), Vegas, NV, USA, 27–30 June 2016; pp. 779–788. [Google Scholar] [CrossRef] [Green Version]
- Zhang, T.; Zhang, X.; Ke, X.; Zhan, X.; Shi, J.; Wei, S.; Pan, D.; Li, J.; Su, H.; Zhou, Y.; et al. LS-SSDD-v1.0: A Deep Learning Dataset Dedicated to Small Ship Detection from Large-Scale Sentinel-1 SAR Images. Remote Sens. 2020, 12, 2997. [Google Scholar] [CrossRef]
- Han, K.; Wang, Y.; Tian, Q.; Guo, J.; Xu, C.; Xu, C. GhostNet: More Features from Cheap Operations. arXiv 2019, arXiv:1911.11907. [Google Scholar]
- Zhang, Y.F.; Ren, W.; Zhang, Z.; Jia, Z.; Wang, L.; Tan, T. Focal and Efficient IOU Loss for Accurate Bounding Box Regression. arXiv 2021, arXiv:2101.08158. [Google Scholar]
Figure 1.
Triplet attention model structure.

Figure 2.
Channel attention module.

Figure 3.
Spatial attention module.

Figure 4.
Convolution block attention module.

Figure 5.
FIERNet overall network model structure.

Figure 6.
Convolution transformer feature extraction (CTFE) module composition.

Figure 7.
CTFEX network structure.

Figure 8.
SPPNet structure composition.

Figure 9.
Information hybrid convolutional block (IHCB) network structure. DWC stands for depthwise convolution, PWC stands for pointwise convolution.
Figure 9.
Information hybrid convolutional block (IHCB) network structure. DWC stands for depthwise convolution, PWC stands for pointwise convolution.

Figure 10.
Effective feature information fusion (EFIF) module.

Figure 11.
Bounding box regression.

Figure 12.
BBRD diagram.

Figure 13.
Feature heatmaps for different networks. There are 3 columns of pictures in the figure, from left to right, the visualization of the ground truth, the visualization of the YOLOv4 heatmaps, and the visualization of the FIERNet heatmaps.
Figure 13.
Feature heatmaps for different networks. There are 3 columns of pictures in the figure, from left to right, the visualization of the ground truth, the visualization of the YOLOv4 heatmaps, and the visualization of the FIERNet heatmaps.

Figure 14.
The performance comparison of different and N. (a) Performance comparison of different values of . (b) Comparison of mAP with different N values. (c) Comparison of Recall with different N values. (d) Comparison of Precision with different N values.
Figure 14.
The performance comparison of different and N. (a) Performance comparison of different values of . (b) Comparison of mAP with different N values. (c) Comparison of Recall with different N values. (d) Comparison of Precision with different N values.

Figure 15.
Comparison of different target detection performance. (a) PR curves; (b) F1 curves.

Figure 16.
Comparison of visual detection results of different target detection algorithms. (a) Visualization of the ground truth based on SSDD dataset labels. (b) FIERNet. (c) CenterNet. (d) YOLOX.
Figure 16.
Comparison of visual detection results of different target detection algorithms. (a) Visualization of the ground truth based on SSDD dataset labels. (b) FIERNet. (c) CenterNet. (d) YOLOX.

Figure 17.
Visual analysis of FIERNet network detection process. (a) Visualization of the ground truth. (b) Visualized feature maps for different detection heads. From left to right, they are 64 × 64, 32 × 32, and 16 × 16. (c) FIERNet finally visualizes the detection results. The left one is the visual image after the three detection heads are combined. The right one is the visual detection result.

Figure 18.
Visualization of detection results. The first behavior is difficult-to-detect and easily misdetected targets, and the second behavior is dense targets. (a) Visualization of the ground truth based on SAR-ship dataset labels. (b) FIERNet practical application effect.
Figure 18.
Visualization of detection results. The first behavior is difficult-to-detect and easily misdetected targets, and the second behavior is dense targets. (a) Visualization of the ground truth based on SAR-ship dataset labels. (b) FIERNet practical application effect.


Figure 19.
Detection results in complex and large-scene SAR images. To better observe the detection results of large-scale SAR images, specific regions marked with blue rectangles are enlarged. (a) Visualization of detection results based on Campeche. (b) Visualization of detection results based on Singapore Strait.


Table 1.
A prior box size based on different datasets.
| Feature Map | Receptive Field | Prior Box Size | |
|---|---|---|---|
| 16 × 16 | Large object | (117,61), (60,155), (52,41) | |
| SSDD | 32 × 32 | Medium object | (29,28), (27,83), (19,20) |
| 64 × 64 | Small object | (15,52), (13,35), (10,17) | |
| 8 × 8 | Large object | (53,51), (24,61), (47,28) | |
| SAR-ship | 16 × 16 | Medium object | (35,37), (37,18), (25,26) |
| 32 × 32 | Small object | (14,32), (20,16), (9,11) |
Table 2.
The specific configuration parameters of the experimental platform.
| Name | Configuration |
|---|---|
| CPU | Intel (R) Core (TM) [email protected] GHz |
| GPU | NVIDIA GeForce RTX 3060 12 GB |
| Operating system | Window 10 |
| Deep learning framework | Pytorch 1.9.0 |
| Programming language | Python 3.7 |
| Dependent package | CUDA 11.1 + CUDNN 8.0.4 |
Table 3.
Initial setting of network hyperparameters based on SSDD.
| Hyperparameter | Initialization |
|---|---|
| Learning rate | 0.001 |
| Image size | 512 |
| Batch size | 4 |
| Train epoch | 100 |
| Weight decay | 0.0005 |
| Momentum | 0.937 |
| Label smoothing | 0.005 |
Table 4.
Network model performance for different combination modules. "🗸" indicates that the current module or method is used.
Table 4.
Network model performance for different combination modules. "🗸" indicates that the current module or method is used.
| CTFENet | EFIF | BBRD | mAP | Recall | Precision | F1 | LAMR |
|---|---|---|---|---|---|---|---|
| 91.17 | 84.40 | 95.04 | 89 | 20 | |||
| 🗸 | 93.12 | 82.94 | 97.00 | 89 | 17 | ||
| 🗸 | 91.62 | 86.79 | 94.41 | 90 | 19 | ||
| 🗸 | 91.96 | 84.77 | 95.45 | 90 | 18 | ||
| 🗸 | 🗸 | 93.74 | 87.34 | 97.54 | 92 | 13 | |
| 🗸 | 🗸 | 93.24 | 83.12 | 97.21 | 90 | 16 | |
| 🗸 | 🗸 | 91.88 | 86.97 | 94.61 | 91 | 19 | |
| 🗸 | 🗸 | 🗸 | 94.14 | 87.89 | 98.16 | 93 | 12 |
Table 5.
Performance analysis of decoding formulas with different boundaries.
| Method | Different BBRD | mAP | Recall | Precision |
|---|---|---|---|---|
| FIERNet-1 | BBRD-1 | 93.74 | 87.34 | 97.54 |
| FIERNet-2 | BBRD-2 | 93.78 | 87.34 | 97.54 |
| FIERNet | BBRD-N | 94.14 | 87.89 | 98.16 |
Table 6.
Comparison of performance indicators of different models based on SSDD. Results marked with “*” are from [41]. Results marked with “**” are from [43]. The best performing methods are marked in bold.
| Method | Backbone | Size | mAP | Recall | F1 |
|---|---|---|---|---|---|
| SSD | VGG-16 | 512 | 89.55 | 73.21 | 81 |
| RetinaNet | ResNet-50 | 512 | 63.71 | 52.29 | 68 |
| CenterNet | ResNet-50 | 512 | 83.31 | 66.79 | 78 |
| Faster RCNN * | ResNet-50 | 600 | 71.90 | 75.00 | 71 |
| EfficientDet * | EfficientNet | 512 | 68.27 | 39.78 | 56 |
| YOLOv3 * | Darknet-53 | 416 | 79.06 | 67.61 | 77 |
| YOLOv4 | CSPDarknet-53 | 512 | 91.17 | 84.40 | 89 |
| YOLOv4-tiny | CSPDarknet-53 | 512 | 82.85 | 75.41 | 80 |
| SAR-ShipNet * | ResNet50 | 512 | 89.08 | 76.30 | 85 |
| DCMSNN ** | ResNet101 | 512 | 89.60 | 83.40 | 84 |
| NNAM ** | Inception-ResNet | 512 | 84.30 | 85.70 | 85 |
| YOLOX | Modified CSP v5 | 512 | 88.92 | 83.67 | 87 |
| FIERNet | CTFENet | 416 | 90.66 | 79.24 | 87 |
| FIERNet | CTFENet | 512 | 94.14 | 87.89 | 93 |
Table 7.
Comparison of performance indicators of different models based on SAR-Ship. Results marked with “*” are from [41]. The best performing methods are marked in bold.
Table 7.
Comparison of performance indicators of different models based on SAR-Ship. Results marked with “*” are from [41]. The best performing methods are marked in bold.
| Method | Backbone | Size | mAP | Recall | F1 |
|---|---|---|---|---|---|
| SSD * | VGG-16 | 300 | 82.90 | 72.48 | 79 |
| SSD * | VGG-16 | 512 | 84.42 | 74.58 | 81 |
| RetinaNet * | ResNet-50 | 600 | 88.37 | 73.24 | 81 |
| CenterNet * | ResNet-50 | 512 | 87.44 | 60.02 | 74 |
| Faster RCNN * | ResNet-50 | 600 | 75.19 | 70.95 | 73 |
| EfficientDet * | EfficientNet | 512 | 85.20 | 71.77 | 80 |
| YOLOv3 * | Darknet-53 | 416 | 87.24 | 70.12 | 80 |
| YOLOv4 * | CSPDarknet-53 | 416 | 88.76 | 70.36 | 81 |
| SAR-ShipNet * | ResNet50 | 512 | 90.20 | 71.31 | 81 |
| YOLOX * | Modified CSP v5 | 640 | 88.21 | 67.51 | 78 |
| FIERNet | CTFENet | 256 | 92.01 | 82.63 | 87 |
Table 8.
Comparison of experimental results.
| Method | Campeche | Singapore Strait | ||||
|---|---|---|---|---|---|---|
| mAP | Recall | F1 | mAP | Recall | F1 | |
| SSD | 76.81 | 54.29 | 68 | 58.43 | 42.91 | 56 |
| CenterNet | 68.26 | 48.49 | 63 | 55.87 | 35.16 | 50 |
| YOLOv4-Tiny | 68.89 | 59.49 | 70 | 56.90 | 49.46 | 61 |
| YOLOv4 | 76.60 | 66.63 | 78 | 60.82 | 51.98 | 64 |
| YOLOX | 73.45 | 66.87 | 75 | 55.97 | 51.67 | 62 |
| FIERNet | 81.29 | 73.52 | 81 | 68.32 | 60.46 | 72 |
Publisher’s Note: MDPI stays neutral with regard to jurisdictional claims in published maps and institutional affiliations. |
© 2022 by the authors. Licensee MDPI, Basel, Switzerland. This article is an open access article distributed under the terms and conditions of the Creative Commons Attribution (CC BY) license (https://creativecommons.org/licenses/by/4.0/).
Share and Cite
MDPI and ACS Style
Yu, J.; Wu, T.; Zhou, S.; Pan, H.; Zhang, X.; Zhang, W. An SAR Ship Object Detection Algorithm Based on Feature Information Efficient Representation Network. Remote Sens. 2022, 14, 3489. https://doi.org/10.3390/rs14143489
AMA Style
Yu J, Wu T, Zhou S, Pan H, Zhang X, Zhang W. An SAR Ship Object Detection Algorithm Based on Feature Information Efficient Representation Network. Remote Sensing. 2022; 14(14):3489. https://doi.org/10.3390/rs14143489
Chicago/Turabian StyleYu, Jimin, Tao Wu, Shangbo Zhou, Huilan Pan, Xin Zhang, and Wei Zhang. 2022. "An SAR Ship Object Detection Algorithm Based on Feature Information Efficient Representation Network" Remote Sensing 14, no. 14: 3489. https://doi.org/10.3390/rs14143489
Note that from the first issue of 2016, this journal uses article numbers instead of page numbers. See further details here.