
A Bibliometric and Visualized Analysis of Research Progress and Trends in Rice Remote Sensing over the Past 42 Years (1980–2021)


1
Key Laboratory of Agricultural Remote Sensing and Information System, Zhejiang University, Hangzhou 310058, China
2
Institute of Applied Remote Sensing & Information Technology, Zhejiang University, Hangzhou 310058, China
3
Ministry of Education Key Laboratory of Environmental Remediation and Ecological Health, Zhejiang University, Hangzhou 310058, China
4
State Key Laboratory of Desert and Oasis Ecology, Xinjiang Institute of Ecology and Geography, Chinese Academy of Sciences, Urumqi 830011, China
*
Author to whom correspondence should be addressed.
Remote Sens. 2022, 14(15), 3607; https://doi.org/10.3390/rs14153607
Submission received: 21 June 2022
/
Revised: 21 July 2022
/
Accepted: 24 July 2022
/
Published: 28 July 2022
(This article belongs to the Special Issue Crop Growth Monitoring Using Remote Sensing: Progress, Challenges and Opportunities)
Abstract
:Rice is one of the most important food crops around the world. Remote sensing technology, as an effective and rapidly developing method, has been widely applied to precise rice management. To observe the current research status in the field of rice remote sensing (RRS), a bibliometric analysis was carried out based on 2680 papers of RRS published during 1980–2021, which were collected from the core collection of the Web of Science database. Quantitative analysis of the number of publications, top countries and institutions, popular keywords, etc. was conducted through the knowledge mapping software CiteSpace, and comprehensive discussions were carried out from the aspects of specific research objects, methods, spectral variables, and sensor platforms. The results revealed that an increasing number of countries and institutions have conducted research on RRS and a great number of articles have been published annually, among which, China, the United States of America, and Japan were the top three and the Chinese Academy of Sciences, Zhejiang University, and Nanjing Agricultural University were the first three research institutions with the largest publications. Abundant interest was paid to “reflectance”, followed by “vegetation index” and “yield” and the specific objects mainly focused on growth, yield, area, stress, and quality. From the perspective of spectral variables, reflectance, vegetation index, and back-scattering coefficient appeared the most frequently in the frontiers. In addition to satellite remote sensing data and empirical models, unmanned air vehicle (UAV) platforms and artificial intelligence models have gradually become hot topics. This study enriches the readers’ understanding and highlights the potential future research directions in RRS.
1. Introduction
Rice (Oryza sativa L.) is one of the most widely cultivated crops, with over half of the world population regarding it as their staple food [1]. As one of the most important crops in food safety, rice plays an irreplaceable role in reducing the pressure on food demand caused by population growth and maintaining social stability [2]. Consequently, real-time monitoring of rice growth and sustainable management of rice production has practical research value.
In the past, statistics such as rice area and yield were obtained through field surveys, which were always time-consuming, costly, labor-intensive, and difficult to achieve large-scale monitoring [3]. Satellite remote sensing appeared in the 1960s and was firstly deployed in military reconnaissance [4]. With the development of science and technology, remote sensing with the characteristics of large coverage and dynamic monitoring has been gradually used in the agricultural field [5]. Rice, as a critical agricultural vegetation, has an irreplaceable position in vegetation remote sensing. Rice remote sensing (RRS) is a research field that applies remote sensing technology to the rice field ecosystem [6]. It uses multi-platform, multi-sensor, multi-spatiotemporal remote sensing data to provide quantitative agronomic information of rice plants [6,7]. RRS technology has been widely utilized by research institutions all over the world since the 1980s. Many studies have used remote sensing data for rice area extraction, rice planting structure transformation, rice yield estimation, etc. [6,8]. With the enrichment of data and methods, RRS has become an indispensable approach to achieving sustainable development of rice nowadays [7]. The vigorous development of RRS has attracted numerous scientific interest and an increasing number of publications related to RRS have emerged. In view of this, an efficient literature analysis method is required to summarize the historical development, explore the hot spots, and provide support for future research [9]. Bibliometric analysis has powerful quantitative functions, which owns the characteristics of computer science, math and statistics, etc., providing statistical analysis of publications comprehensively and systematically [10]. Bibliometric analysis can not only represent the evolutions of research institutions, researchers, and research teams intuitively but also sort out the key research content and the emerging hot spots, helping readers enhance their understanding of a certain field [11]. Bibliometric analysis was widely applied to natural sciences and social sciences [12,13]. Similar studies have been conducted in rice research such as rice genome [14], rice diseases [15], etc. In the field of remote sensing, bibliometric analysis was utilized in grassland remote sensing [16], human health [17], forest remote sensing [18], crop condition monitoring [19], etc.
Although there were a few review publications on RRS research, different scholars had a varied understanding of the research results, leading to diverse conclusions. Additionally, the differences in authors’ knowledge structure tended to result in inconsistency in the literature evaluation methods [19]. This is the exact problem that can be solved by bibliometric analysis, which is helpful in overcoming the shortcomings of the imperfection and non-objectivity of review articles [20]. A comprehensive review can be obtained from extensive documents using bibliometric analysis, which makes the conclusions of evolutionary progress in a certain research field more reliable.
So far, no bibliometric analysis has been put forward to explore the developing background and research status of RRS precisely. Therefore, this research mined a large number of publications using the bibliometric method to (1) reveal and understand the evolutionary history of RRS; (2) explore the developing trend, including the main research contents, categories, hot spots, etc. in RRS research; (3) identify the active countries and research institutions engaged in RRS to strengthen the international collaborations; and (4) discover the existing issues and current deficiencies to provide support for the further improvement of RRS.
2. Materials and Methods
2.1. Software Selection
With the fast advent of the quantitative research of documents, scholars have explored various methods to visualize the knowledge graph of literature, the development of research theories, and the transformation of research models. The widely used analytical software are HistCite [21], VOSviewer [22], and CiteSpace [23], etc. The software used in this article was CiteSpace (ver. 6.1. R2), which is a powerful document visualization analysis software developed by Professor Chaomei Chen from the School of Information Science and Technology of Drexel University in the United States of America. This software was employed for document processing, data mining, and visual quantitative analysis of RRS. It excavated logical relationships among the collected documents to analyze the historical development and provide insights into the frontiers in the field [24]. The dynamic knowledge map presented the development route and research framework of RRS, and identified the changes of research hot spots more intuitively [25].
2.2. Data Collection and Methodology
2.2.1. Data Collection
The research focused on the RRS research published by scholars around the world in the past 42 years (1980–2021). Journal papers were downloaded from the core source of the Web of Science (WOS) database. All records contained authors, titles, publication resources, and abstracts.
Boolean expressions were utilized to create search formulas for the advanced search. The principle of the Boolean search formula setting was as follows: RRS must involve the word “rice” in the title. “Remote sensing” was represented by many search topics. When carrying out the trial experiments, we found that separate vocabulary always led to misunderstanding; therefore, they needed to be changed into phrases. The general rule of disambiguation was combining multiple words to replace specific words. To prevent incomplete collections, these topics were divided into several sections before selection, including:
(1) Remote sensing variables: reflectance, hyperspectral, multi-spectral, back-scattering coefficient, etc.
(2) Remote sensing platform and sensors: satellites, sensors, unmanned aircraft vehicles (UAVs), and proximal ground platform sensors. Due to the ambiguity of “satellite” in the search results, “satellite” was not selected as a THEME word, but several commonly used satellite platforms were selected as alternatives to satellite, including Landsat, Moderate Resolution Imaging Spectrometer (MODIS), Sentinel, etc. Some high-resolution satellites were taken into account such as WorldView, GeoEye, RapidEye, etc. UAVs included drone, unmanned aircraft or unmanned aerial vehicle, etc.; the ground platform included ASD, GreenSeeker, etc.
(3) Remote sensing bands: near-infrared, red-edge, short-wave infrared, microwave (including “polarization” or ”polarimetric”), etc.
(4) Other: For example, “Image” was a keyword for remote sensing. “Satellite” was changed into “image and satellite”. “GF and satellite” was used to eliminate the ambiguity of “GF”. Combinations such as “SPOT and satellite” were employed to avoid the misunderstanding of “SPOT”. “HJ and satellite” and “image and OLI” were used to eliminate ambiguity. “Sensor” was also ambiguous in the search; therefore, the combinations of satellite and sensor were utilized, such as (image and TM) or (image and ETM+).
The formula analyzed the research content of RRS from many perspectives, aiming to fully cover its main research content. After the research topic “rice remote sensing” was repeatedly tested and modified, the final search formula was determined to search for the publications related to the bibliometric analysis (Table 1). The formula is as follows: TI = (rice) and TS = (remote sensing OR Landsat OR NOAA OR ASTER OR ENVISAT OR Sentinel OR UAV OR UAS OR RPAS OR drone OR unmanned aircraft OR unmanned aerial vehicle OR TRMM OR MODIS OR spectrometer OR ASD OR analytical spectral device OR (satellite and image) OR (satellite and imagery) OR reflectance OR hyperspectral OR multispectral OR back-scattering OR microwave OR near-infrared OR red-edge OR short wave infrared OR radar OR SAR OR Lidar OR polarization OR polarimetric OR (image and TM) OR (image and ETM+) OR (image and OLI) OR AVHRR OR (HJ and satellite) OR (GF and satellite) or (satellite and SPOT) OR CBERS OR (WorldView and satellite) OR (GeoEye and satellite) or (RapidEye and satellite) OR (ALOS and satellite) OR (QuickBird and satellite) OR (TerraSAR-X Radar) OR (IKONOS and satellite) OR (ZY and satellite) OR (aerial orthophoto) OR (aerial data) OR (aerial orthoimages) OR synthetic aperture radar OR NIR OR active sensor OR optical sensor OR GreenSeeker OR proximal ground platform). The selected document types included articles and review papers.
2.2.2. Analysis Methods
In this research, all retrieved data were processed by operations such as deduplication, sorting, and manual identification. After removing the irrelevant documents, the collected documents were transported into the CiteSpace software for analysis. Consequently, 2680 records about RRS were obtained.
The indicators of the literature measurement in this study included the number of documents, research countries, research institutions, keywords, research hot spots, etc. Among them, the number of documents, discipline categories, countries, and institutions were obtained from the Web of Science. The information units in the scientific literature were extracted by a series of algorithms in CiteSpace and were then reconstructed according to the type and strength. One of the most powerful functions of CiteSpace software is the analysis of the co-occurrence network. The occurrence of lexical pairs or noun phrases in the collected documents was utilized to accomplish the co-occurrence network [24]. Co-word networks are formed by counting the frequency of theme words in the same literature [25]. The first step of the implementation process was to extract the keywords of the specific analysis object, and then automatically separate and classify the keywords. The log-likelihood ratio (LLR) algorithm was utilized to generate the clustering tags from the relevant citations [16,26]. The knowledge structure of a certain study can be revealed by analyzing the key nodes of the co-occurrence network [27].
Another function is citation burst analysis, which was used to detect the amount of sharply changing references in a certain period of time. Utilization of the mutation detection algorithm designed by Kleinberg can identify the emergencies in the frontiers and extract explosive nodes from big data [28]. Citation burst analysis can demonstrate the evolutionary progress in a certain period of time. The word frequency analysis function in CiteSpace was also used in this research, which is inseparable from the above two analysis processes. Extracting the frequency distribution of keywords condenses the core content of the literature information. The analysis can express the distribution of keywords of the core content of the literature, helping clarify the research context [29].
Co-authorship among different countries and institutions was analyzed by choosing the node types “Country” and “Institution” in the built-in functions of CiteSpace [30]. Only the first author was considered in the calculation. If only a single author existed, one needed to be added to the number of publications in the belonging institutions and countries, respectively. For multi-author papers from different institutions and countries, the number of papers issued by the corresponding institutions and countries was increased by one, respectively [24,25]. If one author was cited many times in the same document, the frequency was calculated only once. The co-authorship analysis can reveal the academic communities in a specific research field [31].
3. Results and Discussion
3.1. Analysis of Publishing Status
The number of published papers reflects the enthusiasm of scholars in a certain field. Based on the search results of “rice remote sensing” publications in the past 42 years, statistical analysis was conducted based on the published papers. It is demonstrated in Figure 1 that the number and velocity of papers published on RRS showed an increasing trend. The number of papers increased from 22 (during 1980–1990) to 133 (during 1990–2000), 445 (during 2000–2010), and finally 2080 (during 2010–2021).
This research field experienced three outbreak periods around 1997, 2006, and 2015. Before 2000, there were few publications. This period was regarded as the initial stage of RRS. The large-scale applications of spectrometers, especially ASD, promoted the development of rice hyperspectral remote sensing at the canopy level, leading to the first outbreak in 1997. The theoretical system of RRS began to take shape, and commentary papers began to appear frequently. With the development of remote sensing technology, the number of publications increased rapidly in 2006. The MODIS data, with higher temporal resolution and easy data availability, provided opportunities to monitor rice at the landscape, regional, and global scales [32]. The third outbreak period occurred in 2015 with the flourishing trend of publications. Deep learning methods matured during this period. Unmanned aerial vehicle (UAV) remote sensing has also been widely employed in precise rice observation [33]. This illustrated that RRS developed vigorously with the advancement of remote sensing sensors and computer technology.
In conclusion, the rapid development of remote sensing devices and the growing demand for precision agriculture promoted the vigorous development of RRS. Comparing the average number of countries and institutions involved in the annual literature through the co-authorship analysis, the closer collaborations among international scholars were found to be closely related to this trend.
3.2. Analysis of Category
The results show that 125 sub-categories were relevant to these documents. The top 10 disciplines are displayed in Figure 2. The graph indicates RRS is a typical interdisciplinary subject covering a wide range of disciplines, reflecting the characteristics of multiple disciplines such as agriculture, geology, ecology, computer science, etc. Agriculture is the predominant category with the largest publications because rice itself is a vital crop in agricultural production and food science. Remote sensing is a subject closely related to imaging science and photographic technology [34]. Nowadays, many engineering programs such as satellite building and construction of navigation satellite systems have been proposed, accelerating the research process of RRS [35]. Geographic Information Science always assists the analysis and mapping in RRS [36]. Monitoring the growth conditions and chemical properties of rice is also crucial to the environmental ecology and plant sciences [6,37]. Many technologies in computer science have been introduced into RRS [38].
3.3. Analysis of Country
The number of papers published by a country represents its needs and scientific research capabilities in a certain field [39]. Centrality is a quantitative index used to measure the connecting degree between nodes in the network, which is the most direct indicator for describing the importance of elements [40]. The greater the number of published papers, the greater the interest of a country in this field, and higher centrality reflects that more frequent collaborations are carried out through the node [41]. Precision agriculture has attracted attention from many countries [42]. In Table 2, the top three countries with the largest publications are China (n = 1137), the United States of America (n = 374), and Japan (n = 283), with a total of 1794 issued papers, accounting for more than 50% of the total amount. It can be inferred that there existed an imbalance in the publications among different countries. China (centrality = 0.12), the United States of America (centrality = 0.84), and Japan (centrality = 0.10) showed strong centralities, which signified extensive collaborations and communications between these three countries with others.
Figure 3 shows the visualization of the number of published documents. China is a country with big rice production and consumption [43]. The rice-harvesting area is mainly concentrated in the south-central and northeastern regions of China [44,45]. Policies such as the grain security line and subsidies for rice planting made rice cultivation reach the level of national food security [46,47,48]. Government support assisted the rapid and high-quality development of RRS in China [49,50].
The United States of America (USA) was the original place of remote sensing and was one of the prime countries to apply remote sensing to rice monitoring [51]. Rice-planting areas in the United States are mainly concentrated in the lower reaches of the Mississippi River, such as Texas and Louisiana, etc. [52]. As the world’s largest and most influential grain-trading country, the USA has utilized many kinds of satellite remote sensing data and meteorological data to assess the world’s crop yields, which is helpful for the USA to adjust its planting structure and agricultural trade policies, and to occupy a more active position in the global grain market [53,54]. Additionally, the large plains and high-level agricultural mechanization provided favorable conditions for the development of RRS in the USA [55].
Rice is widely cultivated throughout Honshu Island [56]. In the mid-to-late 1990s, Japanese scientific institutions began to carry out the “agriculture machinery emergency development project of the 21st century” (the 21st Emergency Project), raising technologies such as RRS to the national strategic level [57].
Figure 4 demonstrates that India (n = 273, centrality = 0.05), as the country with the largest rice-harvested area, cultivates rice almost all over the country. India with its monsoon climate and vast planting fields provides a basis for the development of RRS. New South Wales and Victoria in Australia have advanced rice-growing industries [58,59]. Spain and Italy, located in the temperate zone of southern Europe, are the major rice-producing countries in the European Union [60]. The three countries had relatively high centralities and 215 papers in total, which indicates these countries had great potential in RRS. South American countries along the Amazon and Paraguay rivers also own a large number of rice fields [61]. Brazil (n = 72, centrality = 0.01) has been interested in RRS research, largely due to the excellent local agricultural production conditions [62]. Except for the vast publications in the above countries, of the remaining, about 30 came from Canada in North America; the Netherlands in Europe; the Philippines, Vietnam, Pakistan, Turkey, Indonesia, and Iran in Asia; and Egypt in Africa. Above all, these countries have similar characteristics: they either have advanced remote sensing technology (such as The Netherlands, Canada) or are large rice-producing countries (such as the Philippines, Vietnam, etc.).
In Table 2, six of the top ten countries were Asian countries. The reasons why Asian countries published extensive papers are as follows: (1) History: the rice planting industry appeared in China more than 6000 years ago, and then spread to other Asian countries [63]. Asia has a large rice-harvested area and the local people maintain long-term habits in eating rice [64]; (2) climate: Southeast Asia, South Asia, and East Asia with a monsoon climate and some regions in Southeast Asia with a tropical rainforest climate are characterized by warm temperatures and abundant precipitation, which provide favorable conditions for rice growth [65]; (3) geography: Rice-planting areas are mostly concentrated along the banks of rivers [66]. Asia is located in the middle and low latitudes of Earth with abundant water resources, which bring adequate irrigation for rice growth [67]; (4) and population: The high-density population in Asia meets the needs of a high-intensity labor force for rice cultivation [68]. Above all, the strong demand for rice prompts the vigorous development of RRS.
3.4. Analysis of Institutions
Scientific research institutions are the main force that carry out RRS research, and scholars play a significant role in the development of a discipline [69]. The author and institution information from the published papers characterize the social relationships between scholars in the subject field [70]. An institution with more authoritative scholars means it has a stronger scientific research capability [71]. This part helps readers understand the main institutions engaged in RRS and their regional distributions.
In Table 3, the Chinese Academy of Sciences, as one of the highest academic institutions in China, ranked first, with 220 published papers. It has a strong scientific research ability and plays an important role in major national scientific and technological tasks. Most of the papers were contributed by the Institute of Aero Information Research of Science and the Institute of Geographic Science and Natural Resources Research. The Institute of botany also has strong professional strength in RRS research.
Zhejiang University ranked second with 152 published papers. The majority of the papers were contributed by the Department of Agriculture, Biotechnology, and Environmental Sciences of Zhejiang University. The Key Laboratory of Agricultural Remote Sensing and Information Technology Application, with Renchao Wang and Jingfeng Huang as the experts in this research field, carried out a lot of work on rice-planting area extraction, rice yield estimation, rice grain quality monitoring, rice biophysical parameter monitoring, and rice monitoring information system construction.
Nanjing Agricultural University, which relies on the National Engineering and Technology Center for Information Agriculture, with Weixing Cao, Yan Zhu, and Yongchao Tian as its leading team, ranked third with 92 publications. It developed rapidly in the diagnosis of nitrogen, growth monitoring, and construction of agricultural information platforms.
Chinese research institutions have a large voice in the field of RRS. Such research institutions are mainly located in Beijing, the capital of China, and the remaining are mostly located in rice-producing provinces in southern China such as Jiangsu, Zhejiang, and Hubei, where RRS provides scientific support for the local rice-planting industry [72,73].
The Indian Council of Agricultural Research (ICAR) and the Indian Institute of Technology System (IIT SYSTEM), with 54 and 46 publications, respectively, have advanced technologies in RRS and contribute a lot to the development of rice production in Indian agricultural management.
The Consultative Group on International Agricultural Research (CGIAR) is an international organization that promotes the applications of precise agriculture. They often adopt remote sensing to monitor changes in rice-planting areas and predict worldwide rice production. Farmland datasets were produced to strengthen the connectivity of global farmland, with the aim of reducing the poor population and seeking happiness for humankind [74].
The United States Department of Agriculture (USDA) is the largest official agricultural organization in the United States of America [75]. It has an edge in utilizing remote sensing technologies and artificial statistics to predict crop yields and areas [76]. It provides statistics on rice production and the planting structure for the government [75]. Cropland Data Layer (CDL) data is a typical crop-specific coverage data layer, which is produced for the continental United States, using the annual-medium resolution satellite images and agricultural ground measurement points [77]. The CDLs were made by the USDA and other American scientific institutions such as the National Agricultural Statistics Service (NASS) [78]. Such datasets encourage global scholars to devote themselves to agricultural scientific research.
3.5. Analysis of Keywords
Keywords are the core of academic papers, which can highly refine the academic content [79]. Keyword co-occurrence analysis was conducted by merging similar keywords after statistical analysis [24]. The top 10 keywords are exhibited in Table 4. Publications represent the number of papers with the keyword. Percentages represent the proportion of the papers with certain keywords among the top 10. Year stands for the time when the first paper with the keyword appeared.
The above table shows that the keyword “reflectance” had the largest outputs with 361 papers, followed by “vegetation index” (272 papers) and “model” (248 papers). Reflectance is the basic variable of remote sensing and the premise of quantitative remote sensing [80]. The reflectance of rice leaves is similar to that of green vegetation [81]. Vegetation indices are generally constructed by different band combinations to enhance the monitoring capability of vegetation, which respond more sensitively than individual bands [82]. Vegetation indices were widely applied in RRS due to their simplicity and easy operability [83]. In the early stage of RRS, vegetation indices were always constructed in a rather conventional manner. Combinations of two bands and their difference, their ratio, or normalized type were mostly considered [84]. Further analysis revealed that the normal difference vegetation index (NDVI) was the most common vegetation index in the identification of the state of the plant [85,86]. With the deepening of scholars’ understanding, some innovative approaches such as multi-band (band ≥ 3) vegetation indices and complex band combination methods gradually appeared [84,87]. To avoid interference information such as soil background and cloud, improved vegetation indices were invented such as the modified soil adjusted vegetation index (MSAVI) [88], atmospherically resistant vegetation index (ARVI) [89], etc. Monitoring of different vegetation parameters requires varied vegetation indices [90]. Some vegetation indices were invented and proved to be more suitable for monitoring specific research targets, such as PRI for monitoring photosynthesis [91] and the normalized differential phenology index (NDPI) for monitoring biomass [92]. Visible light and near-infrared bands are widely used in RRS, and red-edge bands play an increasingly important role in monitoring rice growth [93,94]. For example, the red-edge position index (REP) [95] and normalized difference red edge index (NDRE) [96] are proposed to be effective in RRS. The development of hyperspectral remote sensing also provides possibilities for band selection in vegetation indices [87]. Therefore, the sum of their occurrences resulted in the leadership of the vegetation index. The top 10 keywords of RRS provided a preliminary understanding of the research concept: “Vegetation index”, “reflectance”, and “MODIS” were defined as remote sensing variables. “Yield” (223 papers), “classification” (179 papers), ”biomass” (136 papers), “chlorophyll content” (124 papers), and “phenology” (108 papers) were classified as agricultural parameters. The general definition of RRS can be illustrated by summarizing these ten keywords: Multiple remote sensing variables, including vegetation indices, reflectance, and MODIS data are used to establish various models, and these models are utilized to carry out research on rice area extraction, crop classification and predictions of yield, leaf area index, phenological period, pigment content, and other parameters, etc.
3.6. Analysis of Research Hot Spots
Research hot spots are regarded as the most active part of the current research field and an important component in the formation of the knowledge network of a subject [24]. They are expressed in the form of keywords with high publications and strength. Strength reflects the emergence rate. The higher the strength, the more attention the topic has received in a certain period of time [97]. The fast growth in the number of publications can be regarded as a signal of the burst of research interest [98].
The function of statistical measurement in the CiteSpace software was employed to create the keywords strength map [99,100]. The keyword strength map was categorized into four types through the analysis of the statistical results, including research objects, spectral variables, research methods, and sensor platforms.
From the perspective of the research objects (Table 5), the publications were divided into five research parts: growth, yield, planting area, stress, and quality. Studies on monitoring rice growth have mainly focused on the leaf area index (LAI), biomass, chlorophyll, phenology period, nitrogen, etc. Among them, 108 papers focused on the phenology, with a strength of 2.97. Identification of the growth stages laid a foundation for monitoring rice growth [101]. LAI, nitrogen, chlorophyll, and biomass were important parameters for characterizing rice growth [33,81,87,102]. Monitoring these parameters accurately guided the rice planting management. Since LAI and biomass could be measured directly, they were the hot spots in the early research [103]. With the evolution of RRS, monitoring of chlorophyll (124 papers, strength = 2.15) and nitrogen (103 papers, strength = 4.69) gradually become research hot spots.
There were 223 publications on rice yield, with an outbreak period occurring in 2006. Rice yield estimations were mainly based on NOAA/AVHRR data at the early time; however, due to the low spatial resolution, the accuracy of yield estimation was not ideal. With the wider applications of the medium-resolution Landsat and MODIS data, the accuracy of rice yield continuously improved. The prerequisite for rice yield remote sensing is identifying the rice planting fields [104]. Therefore, many publications focused on rice area extractions (125 papers, strength = 0.41).
Rice growth responds sensitively to temperature [105] and requires a large amount of water supply such as rainfall and irrigation, etc. [106]. External environmental interferences often affect the growth of rice. Remote sensing monitoring of rice stress mainly includes five types: agro-meteorological disasters (72 papers, strength = 2.64), heavy metals (44 papers, strength = 5.10), pest diseases (44 papers, strength = 4.50), rice diseases (30 papers, strength = 2.64), and salinization (8 papers, strength = 1.97). The above stresses in rice are mostly natural disasters. Agro-meteorological disasters include low-temperature frost and high-temperature heat damages [107,108] and floods and droughts pose threats to rice production and economic development [8]. The frequent occurrence of extreme weather in recent years increased the importance of RRS [107,109,110]. Diseases in rice such as rice blast, bacterial blight, etc. cause crop failure [111,112]. Rice pests such as brown rice plant-hopper [113], nematode [114], etc. also pose threats to rice growth. Soil salinity hinders the nutrient absorption of rice [115,116].
As more attention was paid to food safety, the monitoring of heavy metal stress in rice became a new research hot spot, with an outbreak in 2016 [117,118,119]. China Geoscience University conducted extensive research in this field. Rice quality detection (135 papers, strength = 3.25) is an essential part of food science, as it affects the taste of rice to a great extent [120,121].
The hot spots of RRS from the perspective of spectral variables are shown in Table 6. The reflectance and vegetation index are the most important and frequently used spectral variables in RRS [122,123], with 361 and 272 published papers and intensities of 1.61 and 2.83, respectively. Reflectance is the basic variable of optical remote sensing [124]. It contains rich information about pigments, tissue structure and canopy structure, etc. [125].
Vegetation indices are widely used in monitoring rice growth and yield prediction [126], especially long time series of vegetation indices, which normally consist of a series of vegetation indices arranged in chronological order [127]. There were 103 documents related to time series of vegetation indices with a strength of 2.97. Some researchers regarded time-series variables as another type of vegetation index [128]. The dynamic changes in the time series could characterize the crop phenological phases [129].
Another hotspot is the back-scattering coefficients, which is an optical variable affected by three parts (the bulk scattering, layer scattering, multiple scattering of the canopy) [130,131]. To explore influencing factors on the rice back-scattering coefficient, scholars have conducted some research on its mechanism [132]. There were 116 publications related to back-scattering coefficients with a strength of 2.61. Red-edge spectral, featured by a sudden change in the reflectivity of leaves, is a sensitive spectral region in monitoring rice growth [133]. A large number of studies (29 publications, strength = 1.34) prove the red-edge variables are useful in RRS [94,134].
Various models were actively tried in RRS. The methods used in RRS can be divided into three categories: mechanic models, empirical models, and semi-empirical models (Table 7). Statistical models, including linear regression [135] and multiple regression methods [136], etc., had the largest number of publications. Artificial intelligence models such as deep learning [137] and machine learning [138] were introduced into RRS. Random forest [139], neural network [140], support vector [141], decision tree [142], etc. have achieved great results.
In the early stage of RRS, statistical models were utilized in most cases. With the advancement of computer science, artificial intelligence models became increasingly popular. As artificial intelligence models have a higher fault tolerance, they normally achieve higher accuracy than statistical models [143]. Especially, the deep neural network further enhances the recognition ability of rice [144]. Radiation transfer models such as the PROSPECT model [145], SAIL model [146], and LEAFMOD model [147] were put forward to investigate the relationship between the radiation signals and the vegetation parameters.
Sensor platforms for RRS can be categorized into satellite platforms, unmanned aerial vehicles (UAV) platforms, and ground platforms (Table 8). Initially, ground platforms were employed in RRS, then satellite platforms gradually occupied a larger proportion of the publications [148]. In recent years, UAV platforms showed great potential in RRS [149]. It was worth affirming that joint platforms such as satellite-ground-UAV would be popularly adopted in future rice sustainable management [150].
In terms of satellite platforms, the accuracies of the research results were significantly improved with the launch of the medium-spatial resolution Landsat satellites (94 papers, strength = 1.29) [151], and MODIS (187 papers, strength = 3.84) satellites opened a new era of large-area, long-term monitoring of rice parameters. With high temporal resolution, MODIS data was not only utilized in rice classifications but also applied to phenology extractions [152]. MODIS data has been developed into multiple types of products, bringing great conveniences to scholars [6]. The launch of the European Sentinel series satellites (39 papers, strength = 5.43) has further enhanced the capability of RRS in the medium-resolution level [6,153].
Since the rice growing seasons always coincide with the cloudy and rainy period, these weather conditions interfere with the quality of optimal images. Radar remote sensing (97 papers, strength = 2.94) can avoid disturbances from weather and clouds. It is able to acquire the whole-day images and spectral properties of specific ground objects [154].
UAVs (60 papers, strength = 1.69) are not only economical and practical solutions to gain the overall information of the rice plant canopy but also new approaches to capture high-resolution images at the centimeter level without strict restrictions on weather conditions [123]. UAV remote sensing has been gradually used in RRS since 2018. On the ground platform, hyperspectral sensors were mainly occupied to capture the reflectance of leaves or canopies. Rich spectral information provides a basis for crop nutrition diagnosis [155].
4. Perspectives
At present, RRS benefits a lot from the advances of vegetation remote sensing. Some innovative technologies and methods in vegetation remote sensing are widely applied to RRS. With the development of remote sensing technology, the emergence of high-spatiotemporal-resolution images, sensors with richer bands, etc. are driving forces in the development of RRS [156,157]. Lidar can obtain the three-dimensional structure parameters of rice such as height and volume using an intelligent approach [158]. Big data methods and mature mechanism models increase the accuracy of rice research [159,160]. Following the above burst information in Table 5, Table 6, Table 7 and Table 8, a conclusion can be drawn that integrating multiple data resources (such as satellite, UAV, Lidar), multiple methods (such as artificial intelligence technology and cloud computing), and multiple temporal data (such as time series) to promote the automation of RRS is a major direction in RRS. In the process, the problems of the inconsistency of the view illumination, scale conversion, and solar radiation angle caused by various platforms needs to be considered [161]. How to explain the black box issues in big data models and how to promote the application of RRS, such as generating open-access products, establishing universal models, etc., are also research trends in the future.
Additionally, WebGIS technology opens a new era for establishing real-time monitoring platforms for rice [162]. Integrating rice growth information with multi-source information into a historical rice database promotes the automation of rice management.
5. Conclusions
This study used the information analysis software CiteSpace to conduct a comprehensive bibliometric analysis of publications related to RRS during the period of 1980 to 2021. The research carried out summarization from the perspectives of the involved categories, countries, institutions, etc., and further analyzed the evolutionary path from the points of research objects, spectral variables, modeling methods, and sensor platforms.
The results showed that the number of publications presented an increasing trend over the past 42 years. RRS has interdisciplinary characteristics such as agriculture, geography, ecology, engineering, etc. The top three countries with the largest publications are China, the USA, and Japan, which are either major rice-producing countries or have strong technological power in remote sensing. Asian countries have exhibited great enthusiasm for RRS, followed by countries in North America and Europe. Almost all global institutions were engaged in RRS and the top three are the Chinese Academy of Sciences, Zhejiang University, and Nanjing Agricultural University. The first ten keywords can define the main research contents in RRS as “use multiple remote sensing variables and various models to conduct research on area extraction and growth monitoring, etc.”. The key monitoring parameters were growth, yield, plant area, disasters, and quality. RRS models gradually evolved from statistical models to artificial intelligence models. Satellites were the main platform occupied in RRS during the past decades while UAVs were widely adopted due to their performances in obtaining high-resolution data. Ground platforms further improved the real-time management of rice. Artificial intelligence models support more accurate monitoring. Heavy metals, nutrient parameters, and disasters of rice attracted lots of attention. It is anticipated that the combination of multi-platforms, multi-data, and multi-methods will be the research focus in RRS.
On the whole, the bibliometric and visualized analysis of publications carried out by this study provides a quantitative and clear concept of RRS to enhance people’s perceptions. The comprehensive summarization of the applications implemented in RRS can provide references for other crops, helping to achieve wider technological innovations in precise agriculture.
Author Contributions
Conceptualization, T.X. and F.W.; Data curation, T.X.; Funding acquisition, F.W.; Investigation, T.X. and F.W.; Methodology, T.X. and F.W.; Project administration, F.W.; Software, T.X.; Supervision, L.X. and X.Y.; Validation, L.X. and X.Y.; Writing—original draft, T.X.; Writing—review and editing, F.W. and Q.Y. All authors have read and agreed to the published version of the manuscript.
Funding
This work was financially supported by the National Natural Science Foundation of China (41871328).
Conflicts of Interest
The authors declare that they have no conflict of interest.
References
- Khush, G.S. Origin, dispersal, cultivation and variation of rice. Plant Mol. Biol. 1997, 35, 25–34. [Google Scholar] [CrossRef] [PubMed]
- Matsumura, K.; Hijmans, R.J.; Chemin, Y.; Elvidge, C.D.; Sugimoto, K.; Wu, W.B.; Lee, Y.W.; Shibasaki, R. Mapping the global supply and demand structure of rice. Sustain. Sci. 2009, 4, 301–313. [Google Scholar] [CrossRef]
- Peprah, C.O.; Yamashita, M.; Yamaguchi, T.; Sekino, R.; Takano, K.; Katsura, K. Spatio-Temporal Estimation of Biomass Growth in Rice Using Canopy Surface Model from Unmanned Aerial Vehicle Images. Remote Sens. 2021, 13, 2388. [Google Scholar] [CrossRef]
- Madry, S. Introduction and History of Space Remote Sensing. In Handbook of Satellite Applications; Springer: New York, NY, USA, 2017; pp. 823–832. [Google Scholar] [CrossRef]
- Ozdogan, M.; Yang, Y.; Allez, G.; Cervantes, C. Remote Sensing of Irrigated Agriculture: Opportunities and Challenges. Remote Sens. 2010, 2, 2274–2304. [Google Scholar] [CrossRef] [Green Version]
- Zhao, R.K.; Li, Y.C.; Ma, M.G. Mapping Paddy Rice with Satellite Remote Sensing: A Review. Sustainability 2021, 13, 503. [Google Scholar] [CrossRef]
- Hatfield, J.L.; Cryder, M.; Basso, B. Remote Sensing: Advancing the Science and the Applications to Transform Agriculture. It Prof. 2020, 22, 42–45. [Google Scholar] [CrossRef]
- Karthikeyan, L.; Chawla, I.; Mishra, A.K. A review of remote sensing applications in agriculture for food security: Crop growth and yield, irrigation, and crop losses. J. Hydrol. 2020, 586, 124905. [Google Scholar] [CrossRef]
- Hou, L.X.; Mao, L.X.; Liu, H.C.; Zhang, L. Decades on emergency decision-making: A bibliometric analysis and literature review. Complex Intell. Syst. 2021, 7, 2819–2832. [Google Scholar] [CrossRef]
- Yang, G.J.; Liu, J.G.; Zhao, C.J.; Li, Z.H.; Huang, Y.B.; Yu, H.Y.; Xu, B.; Yang, X.D.; Zhu, D.M.; Zhang, X.Y.; et al. Unmanned Aerial Vehicle Remote Sensing for Field-Based Crop Phenotyping: Current Status and Perspectives. Front. Plant Sci. 2017, 8, 26. [Google Scholar] [CrossRef]
- Zhang, Y.; Chen, Y.P. Research trends and areas of focus on the Chinese Loess Plateau: A bibliometric analysis during 1991–2018. Catena 2020, 194, 104798. [Google Scholar] [CrossRef]
- Zhong, S.Z.; Geng, Y.; Liu, W.J.; Gao, C.X.; Chen, W. A bibliometric review on natural resource accounting during 1995–2014. J. Clean. Prod. 2016, 139, 122–132. [Google Scholar] [CrossRef]
- Ye, N.; Kueh, T.B.; Hou, L.S.; Liu, Y.X.; Yu, H. A bibliometric analysis of corporate social responsibility in sustainable development. J. Clean. Prod. 2020, 272, 122679. [Google Scholar] [CrossRef]
- Liu, B.; Zhang, L.; Wang, X.W. Scientometric profile of global rice research during 1985-2014. Curr. Sci. 2017, 112, 1003–1011. [Google Scholar] [CrossRef]
- Ashfaq, M.Y.; Da’na, D.A.; Al-Ghouti, M.A. Application of MALDI-TOF MS for identification of environmental bacteria: A review. J. Environ. Manag. 2022, 305, 114359. [Google Scholar] [CrossRef] [PubMed]
- Li, T.; Cui, L.Z.; Xu, Z.H.; Hu, R.H.; Joshi, P.K.; Song, X.F.; Tang, L.; Xia, A.Q.; Wang, Y.F.; Guo, D.; et al. Quantitative Analysis of the Research Trends and Areas in Grassland Remote Sensing: A Scientometrics Analysis of Web of Science from 1980 to 2020. Remote Sens. 2021, 13, 1279. [Google Scholar] [CrossRef]
- Viana, J.; Santos, J.V.; Neiva, R.M.; Souza, J.; Duarte, L.; Teodoro, A.C.; Freitas, A. Remote Sensing in Human Health: A 10-Year Bibliometric Analysis. Remote Sens. 2017, 9, 1225. [Google Scholar] [CrossRef] [Green Version]
- Dos Santos, S.M.B.; Bento-Goncalves, A.; Vieira, A. Research on Wildfires and Remote Sensing in the Last Three Decades: A Bibliometric Analysis. Forests 2021, 12, 604. [Google Scholar] [CrossRef]
- Wang, L.; Zhang, G.; Wang, Z.; Liu, J.; Shang, J.; Liang, L. Bibliometric Analysis of Remote Sensing Research Trend in Crop Growth Monitoring: A Case Study in China. Remote Sens. 2019, 11, 809. [Google Scholar] [CrossRef] [Green Version]
- Abati, R.; Sampaio, A.R.; Maciel, R.M.A.; Colombo, F.C.; Libardoni, G.; Battisti, L.; Lozano, E.R.; Ghisi, N.D.; Costa-Maia, F.M.; Potrich, M. Bees and pesticides: The research impact and scientometrics relations. Environ. Sci. Pollut. Res. 2021, 28, 32282–32298. [Google Scholar] [CrossRef] [PubMed]
- Garfield, E. From the science of science to Scientometrics visualizing the history of science with HistCite software. J. Informetr. 2009, 3, 173–179. [Google Scholar] [CrossRef] [Green Version]
- Van Eck, N.J.; Waltman, L. Software survey: VOSviewer, a computer program for bibliometric mapping. Scientometrics 2010, 84, 523–538. [Google Scholar] [CrossRef] [PubMed] [Green Version]
- Chen, C.M. Searching for intellectual turning points: Progressive knowledge domain visualization. Proc. Natl. Acad. Sci. USA 2004, 101, 5303–5310. [Google Scholar] [CrossRef] [PubMed] [Green Version]
- Chen, C. Hindsight, insight, and foresight: A multi-level structural variation approach to the study of a scientific field. Technol. Anal. Strateg. Manag. 2013, 25, 619–640. [Google Scholar] [CrossRef]
- Chen, C. Science Mapping: A Systematic Review of the Literature. J. Data Inf. Sci. 2017, 2, 1–40. [Google Scholar] [CrossRef] [Green Version]
- Lin, H.X.; Wang, X.T.; Huang, M.L.; Li, Z.G.; Shen, Z.; Feng, J.J.; Chen, H.M.; Wu, J.J.; Gao, J.Y.; Wen, Z.; et al. Research hotspots and trends of bone defects based on Web of Science: A bibliometric analysis. J. Orthop. Surg. Res. 2020, 15, 463. [Google Scholar] [CrossRef]
- Lee, K.; Lee, S. Knowledge Structure of the Application of High-Performance Computing: A Co-Word Analysis. Sustainability 2021, 13, 11249. [Google Scholar] [CrossRef]
- Kleinberg, J. Bursty and hierarchical structure in streams. Data Min. Knowl. Discov. 2003, 7, 373–397. [Google Scholar] [CrossRef]
- Shi, Y.L.; Liu, X.P. Research on the Literature of Green Building Based on the Web of Science: A Scientometric Analysis in CiteSpace (2002–2018). Sustainability 2019, 11, 3716. [Google Scholar] [CrossRef] [Green Version]
- Hu, Z.W.; Lin, A.; Willett, P. Identification of research communities in cited and uncited publications using a co-authorship network. Scientometrics 2019, 118, 1–19. [Google Scholar] [CrossRef]
- Chen, C.M.; Song, M. Visualizing a field of research: A methodology of systematic scientometric reviews. PLoS ONE 2019, 14, e0223994. [Google Scholar] [CrossRef] [Green Version]
- Doraiswamy, P.C.; Sinclair, T.R.; Hollinger, S.; Akhmedov, B.; Stern, A.; Prueger, J. Application of MODIS derived parameters for regional crop yield assessment. Remote Sens. Environ. 2005, 97, 192–202. [Google Scholar] [CrossRef]
- Li, S.Y.; Yuan, F.; Ata-Ui-Karim, S.T.; Zheng, H.B.; Cheng, T.; Liu, X.J.; Tian, Y.C.; Zhu, Y.; Cao, W.X.; Cao, Q. Combining Color Indices and Textures of UAV-Based Digital Imagery for Rice LAI Estimation. Remote Sens. 2019, 11, 1763. [Google Scholar] [CrossRef] [Green Version]
- Zhuang, Y.H.; Liu, X.J.; Nguyen, T.; He, Q.Q.; Hong, S. Global remote sensing research trends during 1991–2010: A bibliometric analysis. Scientometrics 2013, 96, 203–219. [Google Scholar] [CrossRef]
- Toth, C.; Jozkow, G. Remote sensing platforms and sensors: A survey. ISPRS J. Photogramm. Remote Sens. 2016, 115, 22–36. [Google Scholar] [CrossRef]
- Chau, V.N.; Holland, J.; Cassells, S.; Tuohy, M. Using GIS to map impacts upon agriculture from extreme floods in Vietnam. Appl. Geogr. 2013, 41, 65–74. [Google Scholar] [CrossRef]
- Huang, Y.; Ryu, Y.; Jiang, C.; Kimm, H.; Kim, S.; Kang, M.; Shim, K. BESS-Rice: A remote sensing derived and biophysical process-based rice productivity simulation model. Agric. For. Meteorol. 2018, 256, 253–269. [Google Scholar] [CrossRef]
- Xu, C.; Du, X.P.; Fan, X.T.; Yan, Z.Z.; Kang, X.J.; Zhu, J.J.; Hu, Z.Y. A Modular Remote Sensing Big Data Framework. IEEE Trans. Geosci. Remote Sens. 2022, 60, 3000311. [Google Scholar] [CrossRef]
- Yang, L.Y.; Yue, T.; Ding, J.L.; Han, T. A comparison of disciplinary structure in science between the G7 and the BRIC countries by bibliometric methods. Scientometrics 2012, 93, 497–516. [Google Scholar] [CrossRef] [Green Version]
- Mokhtarpour, R.; Khasseh, A.A. Twenty-six years of LIS research focus and hot spots, 1990–2016: A co-word analysis. J. Inf. Sci. 2021, 47, 794–808. [Google Scholar] [CrossRef]
- Tian, M.; Li, J. Knowledge mapping of protective clothing research-a bibliometric analysis based on visualization methodology. Text. Res. J. 2019, 89, 3203–3220. [Google Scholar] [CrossRef]
- Kirchmann, H.; Thorvaldsson, G. Challenging targets for future agriculture. Eur. J. Agron. 2000, 12, 145–161. [Google Scholar] [CrossRef]
- Peng, S.B.; Tang, Q.Y.; Zou, Y.B. Current Status and Challenges of Rice Production in China. Plant Prod. Sci. 2009, 12, 3–8. [Google Scholar] [CrossRef] [Green Version]
- Chen, J.S.; Huang, J.X.; Hu, J.X. Mapping rice planting areas in southern China using the China Environment Satellite data. Math. Comput. Model. 2011, 54, 1037–1043. [Google Scholar] [CrossRef]
- Yin, Q.; Liu, M.L.; Cheng, J.Y.; Ke, Y.H.; Chen, X.W. Mapping Paddy Rice Planting Area in Northeastern China Using Spatiotemporal Data Fusion and Phenology-Based Method. Remote Sens. 2019, 11, 1699. [Google Scholar] [CrossRef] [Green Version]
- Liu, Z.H.; Li, Z.G.; Tang, P.Q.; Li, Z.P.; Wu, W.B.; Yang, P.; You, L.Z.; Tang, H.J. Change analysis of rice area and production in China during the past three decades. J. Geogr. Sci. 2013, 23, 1005–1018. [Google Scholar] [CrossRef]
- Chen, A.Q.; He, H.X.; Wang, J.; Li, M.; Guan, Q.C.; Hao, J.M. A Study on the Arable Land Demand for Food Security in China. Sustainability 2019, 11, 4769. [Google Scholar] [CrossRef] [Green Version]
- Yang, L.B.; Wang, L.M.; Huang, J.F.; Mansaray, L.R.; Mijiti, R. Monitoring policy-driven crop area adjustments in northeast China using Landsat-8 imagery. Int. J. Appl. Earth Obs. Geoinf. 2019, 82, 101892. [Google Scholar] [CrossRef]
- Yu, Y.; Clark, J.S.; Tian, Q.S.; Yan, F.X. Rice yield response to climate and price policy in high-latitude regions of China. Food Secur. 2022, 1–15. [Google Scholar] [CrossRef]
- Wang, M.; Shi, P.J.; Ye, T.; Liu, M.; Zhou, M.Q. Agriculture Insurance in China: History, Experience, and Lessons Learned. Int. J. Disaster Risk Sci. 2011, 2, 10–22. [Google Scholar] [CrossRef] [Green Version]
- Liu, Y.C.; Jiao, W.J. Application of Remote Sensing Technology in Agriculture of the USA. In Proceedings of the 9th IFIP WG 5.14 International Conference on Computer and Computing Technologies in Agriculture (CCTA), China Agricultural University, Beijing, China, 27–30 September 2015; pp. 107–114. [Google Scholar]
- Quintana-Ashwell, N.; Gholson, D.M.; Krutz, L.J.; Henry, C.G.; Cooke, T. Adoption of Water-Conserving Irrigation Practices among Row-Crop Growers in Mississippi, USA. Agron.-Basel 2020, 10, 1083. [Google Scholar] [CrossRef]
- Basso, B.; Liu, L. Seasonal crop yield forecast: Methods, applications, and accuracies. In Advances in Agronomy; Sparks, D.L., Ed.; Academic Press: Cambridge, MA, USA, 2019; Volume 154, pp. 201–255. [Google Scholar]
- Carroll, S.R.; Le, K.N.; Moreno-Garcia, B.; Runkle, B.R.K. Simulating Soybean-Rice Rotation and Irrigation Strategies in Arkansas, USA Using APEX. Sustainability 2020, 12, 6822. [Google Scholar] [CrossRef]
- Schueller, J.K. Agricultural Mechanization in the United States of America. Ama-Agric. Mech. Asia Afr. Lat. Am. 2020, 51, 60–+. [Google Scholar]
- Oyoshi, K.; Tomiyama, N.; Okumura, T.; Sobue, S.; Sato, J. Mapping rice-planted areas using time-series synthetic aperture radar data for the Asia-RiCE activity. Paddy Water Environ. 2016, 14, 463–472. [Google Scholar] [CrossRef]
- Kako, T. Economic development and food security issues in Japan and South Korea. In Proceedings of the Taipei International Conference on East Asian Food Security Issues in the 21st Century, Taipei, Taiwan, 16–17 April 1998; pp. 119–140. [Google Scholar]
- Slafer, G.A.; Kernich, G.C. Have changes in yield (1900–1992) been accompanied by a decreased yield stability in Australian cereal production? Aust. J. Agric. Res. 1996, 47, 323–334. [Google Scholar] [CrossRef]
- Kuenzer, C.; Knauer, K. Remote sensing of rice crop areas. Int. J. Remote Sens. 2013, 34, 2101–2139. [Google Scholar] [CrossRef]
- Nowak, A.; Kaminska, A. Agricultural competitiveness: The case of the European Union countries. Agric. Econ. -Zemed. Ekon. 2016, 62, 507–516. [Google Scholar] [CrossRef]
- Iriarte, J.; Elliott, S.; Maezumi, S.Y.; Alves, D.; Gonda, R.; Robinson, M.; de Souza, J.G.; Watling, J.; Handley, J. The origins of Amazonian landscapes: Plant cultivation, domestication and the spread of food production in tropical South America. Quat. Sci. Rev. 2020, 248, 106582. [Google Scholar] [CrossRef]
- Pott, L.P.; Amado, T.J.C.; Schwalbert, R.A.; Corassa, G.M.; Ciampitti, I.A. Satellite-based data fusion crop type classification and mapping in Rio Grande do Sul, Brazil. ISPRS J. Photogramm. Remote Sens. 2021, 176, 196–210. [Google Scholar] [CrossRef]
- Fuller, D.Q. Pathways to Asian Civilizations: Tracing the Origins and Spread of Rice and Rice Cultures. Rice 2011, 4, 78–92. [Google Scholar] [CrossRef] [Green Version]
- Lal, R. Anthropogenic influences on world soils and implications to global food security. In Advances in Agronomy; Sparks, D.L., Ed.; Academic Press: Cambridge, MA, USA, 2007; Volume 93, pp. 69–93. [Google Scholar]
- Mirza, M.M.Q. Climate change, flooding in South Asia and implications. Reg. Environ. Chang. 2011, 11, S95–S107. [Google Scholar] [CrossRef]
- He, S.; Li, F.Y.; Liang, X.Q.; Li, H.; Wang, S.; Jin, Y.B.; Liu, B.Y.; Tian, G.M. Window phase analysis of nutrient losses from a typical rice-planting area in the Yangtze river delta region of China. Environ. Sci. Eur. 2020, 32, 10. [Google Scholar] [CrossRef]
- Ray, A.; Chakraborty, A. The edible biota in irrigated, deepwater, and rainfed rice fields of Asia: A neglected treasure for sustainable food system. Environ. Dev. Sustain. 2021, 23, 17163–17179. [Google Scholar] [CrossRef]
- Cheema, M.J.M.; Nauman, M.; Ghafoor, A.; Farooque, A.A.; Haydar, Z.; Ashraf, M.U.; Awais, M. Direct seeding of basmati rice through improved drills: Potential and constraints in pakistani farm settings. Appl. Eng. Agric. 2021, 37, 53–63. [Google Scholar] [CrossRef]
- Song, J.B.; Zhang, H.L.; Dong, W.L. A review of emerging trends in global PPP research: Analysis and visualization. Scientometrics 2016, 107, 1111–1147. [Google Scholar] [CrossRef]
- Hu, W.; Li, C.H.; Ye, C.; Wang, J.; Wei, W.W.; Deng, Y. Research progress on ecological models in the field of water eutrophication: CiteSpace analysis based on data from the ISI web of science database. Ecol. Model. 2019, 410, 108779. [Google Scholar] [CrossRef]
- Li, X.J.; Ma, E.; Qu, H.L. Knowledge mapping of hospitality research—A visual analysis using CiteSpace. Int. J. Hosp. Manag. 2017, 60, 77–93. [Google Scholar] [CrossRef]
- Frolking, S.; Xiao, X.M.; Zhuang, Y.H.; Salas, W.; Li, C.S. Agricultural land-use in China: A comparison of area estimates from ground-based census and satellite-borne remote sensing. Glob. Ecol. Biogeogr. 1999, 8, 407–416. [Google Scholar] [CrossRef] [Green Version]
- Zeng, Y.H.; Tan, X.M.; Zeng, Y.J.; Xie, X.B.; Pan, X.H.; Shi, Q.H.; Zhang, J. Changes in the rice grain quality of different high-quality rice varieties released in southern China from 2007 to 2017. J. Cereal Sci. 2019, 87, 111–116. [Google Scholar] [CrossRef]
- Reynolds, M.; Kropff, M.; Crossa, J.; Koo, J.; Kruseman, G.; Milan, A.M.; Rutkoski, J.; Schulthess, U.; Balwinder, S.; Sonder, K.; et al. Role of Modelling in International Crop Research: Overview and Some Case Studies. Agron.-Basel 2018, 8, 291. [Google Scholar] [CrossRef] [Green Version]
- Tack, J.; Coble, K.H.; Johansson, R.; Harri, A.; Barnett, B.J. The Potential Implications of “Big Ag Data” for USDA Forecasts. Appl. Econ. Perspect. Policy 2019, 41, 668–683. [Google Scholar] [CrossRef]
- Adjemian, M.K.; Smith, A. Using USDA Forecasts to Estimate the Price Flexibility of Demand for Agricultural Commodities. Am. J. Agric. Econ. 2012, 94, 978–995. [Google Scholar] [CrossRef]
- Lark, T.J.; Schelly, I.H.; Gibbs, H.K. Accuracy, Bias, and Improvements in Mapping Crops and Cropland across the United States Using the USDA Cropland Data Layer. Remote Sens. 2021, 13, 968. [Google Scholar] [CrossRef]
- Boryan, C.G.; Yang, Z.W.; Di, L.P.; Hunt, K. A New Automatic Stratification Method for US Agricultural Area Sampling Frame Construction Based on the Cropland Data Layer. IEEE J. Sel. Top. Appl. Earth Obs. Remote Sens. 2014, 7, 4317–4327. [Google Scholar] [CrossRef]
- Duan, P.L.; Wang, Y.Q.; Yin, P. Remote Sensing Applications in Monitoring of Protected Areas: A Bibliometric Analysis. Remote Sens. 2020, 12, 772. [Google Scholar] [CrossRef] [Green Version]
- Peddle, D.R.; White, H.P.; Soffer, R.J.; Miller, J.R.; LeDrew, E.F. Reflectance processing of remote sensing spectroradiometer data. Comput. Geosci. 2001, 27, 203–213. [Google Scholar] [CrossRef]
- Tian, Y.C.; Gu, K.J.; Chu, X.; Yao, X.; Cao, W.X.; Zhu, Y. Comparison of different hyperspectral vegetation indices for canopy leaf nitrogen concentration estimation in rice. Plant Soil 2014, 376, 193–209. [Google Scholar] [CrossRef]
- Guedes, J.C.F.; da Silva, S.M.P. Remote sensing in vegetation study: Physical principles, sensors and methods. Rev. Acta Geogr. 2018, 12, 127–144. [Google Scholar]
- Yang, K.L.; Gong, Y.; Fang, S.H.; Duan, B.; Yuan, N.G.; Peng, Y.; Wu, X.T.; Zhu, R.S. Combining Spectral and Texture Features of UAV Images for the Remote Estimation of Rice LAI throughout the Entire Growing Season. Remote Sens. 2021, 13, 3001. [Google Scholar] [CrossRef]
- Verrelst, J.; Camps-Valls, G.; Munoz-Mari, J.; Rivera, J.P.; Veroustraete, F.; Clevers, J.; Moreno, J. Optical remote sensing and the retrieval of terrestrial vegetation bio-geophysical properties—A review. ISPRS J. Photogramm. Remote Sens. 2015, 108, 273–290. [Google Scholar] [CrossRef]
- Guay, K.C.; Beck, P.S.A.; Berner, L.T.; Goetz, S.J.; Baccini, A.; Buermann, W. Vegetation productivity patterns at high northern latitudes: A multi-sensor satellite data assessment. Glob. Chang. Biol. 2014, 20, 3147–3158. [Google Scholar] [CrossRef] [PubMed]
- Pettorelli, N.; Ryan, S.; Mueller, T.; Bunnefeld, N.; Jedrzejewska, B.; Lima, M.; Kausrud, K. The Normalized Difference Vegetation Index (NDVI): Unforeseen successes in animal ecology. Clim. Res. 2011, 46, 15–27. [Google Scholar] [CrossRef]
- Xu, T.Y.; Wang, F.M.; Xie, L.L.; Yao, X.P.; Zheng, J.Y.; Li, J.L.; Chen, S.T. Integrating the Textural and Spectral Information of UAV Hyperspectral Images for the Improved Estimation of Rice Aboveground Biomass. Remote Sens. 2022, 14, 2534. [Google Scholar] [CrossRef]
- Guo, B.; Han, B.M.; Yang, F.; Fan, Y.W.; Jiang, L.; Chen, S.T.; Yang, W.N.; Gong, R.; Liang, T. Salinization information extraction model based on VI-SI feature space combinations in the Yellow River Delta based on Landsat 8 OLI image. Geomat. Nat. Hazards Risk 2019, 10, 1863–1878. [Google Scholar] [CrossRef] [Green Version]
- Kaufman, Y.J.; Tanre, D. Atmospherically resistant vegetation index (ARVI) for Eos-MODIS. IEEE Trans. Geosci. Remote Sens. 1992, 30, 261–270. [Google Scholar] [CrossRef]
- Kior, A.; Sukhov, V.; Sukhova, E. Application of Reflectance Indices for Remote Sensing of Plants and Revealing Actions of Stressors. Photonics 2021, 8, 582. [Google Scholar] [CrossRef]
- Rahimzadeh-Bajgiran, P.; Munehiro, M.; Omasa, K. Relationships between the photochemical reflectance index (PRI) and chlorophyll fluorescence parameters and plant pigment indices at different leaf growth stages. Photosynth. Res. 2012, 113, 261–271. [Google Scholar] [CrossRef] [PubMed]
- Xu, D.W.; Wang, C.; Chen, J.; Shen, M.G.; Shen, B.B.; Yan, R.R.; Li, Z.W.; Karnieli, A.; Chen, J.Q.; Yan, Y.C.; et al. The superiority of the normalized difference phenology index (NDPI) for estimating grassland aboveground fresh biomass. Remote Sens. Environ. 2021, 264, 112578. [Google Scholar] [CrossRef]
- Xue, J.R.; Su, B.F. Significant Remote Sensing Vegetation Indices: A Review of Developments and Applications. J. Sens. 2017, 2017, 1353691. [Google Scholar] [CrossRef] [Green Version]
- Kanke, Y.; Tubana, B.; Dalen, M.; Harrell, D. Evaluation of red and red-edge reflectance-based vegetation indices for rice biomass and grain yield prediction models in paddy fields. Precis. Agric. 2016, 17, 507–530. [Google Scholar] [CrossRef]
- Tian, Y.C.; Yao, X.; Yang, J.; Cao, W.X.; Zhu, Y. Extracting Red Edge Position Parameters from Ground- and Space-Based Hyperspectral Data for Estimation of Canopy Leaf Nitrogen Concentration in Rice. Plant Prod. Sci. 2011, 14, 270–281. [Google Scholar] [CrossRef]
- Zhang, K.; Ge, X.K.; Shen, P.C.; Li, W.Y.; Liu, X.J.; Cao, Q.; Zhu, Y.; Cao, W.X.; Tian, Y.C. Predicting Rice Grain Yield Based on Dynamic Changes in Vegetation Indexes during Early to Mid-Growth Stages. Remote Sens. 2019, 11, 387. [Google Scholar] [CrossRef] [Green Version]
- Hong, R.; Xiang, C.L.; Liu, H.; Glowacz, A.; Pan, W. Visualizing the Knowledge Structure and Research Evolution of Infrared Detection Technology Studies. Information 2019, 10, 227. [Google Scholar] [CrossRef] [Green Version]
- Wu, P.; Ata-Ul-Karim, S.T.; Singh, B.P.; Wang, H.; Wu, T.; Liu, C.; Fang, G.; Zhou, D.; Wang, Y.; Chen, W. A scientometric review of biochar research in the past 20 years (1998–2018). Biochar 2019, 1, 23–43. [Google Scholar] [CrossRef] [Green Version]
- Zhong, D.L.; Li, Y.X.; Huang, Y.J.; Hong, X.J.; Li, J.; Jin, R.J. Molecular Mechanisms of Exercise on Cancer: A Bibliometrics Study and Visualization Analysis via CiteSpace. Front. Mol. Biosci. 2022, 8, 797902. [Google Scholar] [CrossRef] [PubMed]
- Liu, J.; Wang, Y.J.; Zhang, Q.; Wei, J.X.; Zhou, H.H. Scientometric Analysis of Public Health Emergencies: 1994–2020. Int. J. Environ. Res. Public Health 2022, 19, 640. [Google Scholar] [CrossRef] [PubMed]
- Sakamoto, T.; Yokozawa, M.; Toritani, H.; Shibayama, M.; Ishitsuka, N.; Ohno, H. A crop phenology detection method using time-series MODIS data. Remote Sens. Environ. 2005, 96, 366–374. [Google Scholar] [CrossRef]
- An, G.Q.; Xing, M.F.; He, B.B.; Liao, C.H.; Huang, X.D.; Shang, J.L.; Kang, H.Q. Using Machine Learning for Estimating Rice Chlorophyll Content from In Situ Hyperspectral Data. Remote Sens. 2020, 12, 3104. [Google Scholar] [CrossRef]
- Casanova, D.; Epema, G.F.; Goudriaan, J. Monitoring rice reflectance at field level for estimating biomass and LAI. Field Crop. Res. 1998, 55, 83–92. [Google Scholar] [CrossRef]
- Zhang, Y.; Wang, D.; Zhou, Q.B. Advances in crop fine classification based on Hyperspectral Remote Sensing. In Proceedings of the 8th International Conference on Agro-Geoinformatics (Agro-Geoinformatics), Istanbul, Turkey, 16–19 July 2019. [Google Scholar]
- Cho, J.; Oki, T. Application of temperature, water stress, CO2 in rice growth models. Rice 2012, 5, 10. [Google Scholar] [CrossRef] [PubMed] [Green Version]
- Wu, S.J.; Chiueh, Y.W.; Hsu, C.T. Modeling risk analysis for rice production due to agro-climate change and uncertainty in irrigation water. Paddy Water Environ. 2018, 16, 35–53. [Google Scholar] [CrossRef]
- Dou, Y.J.; Huang, R.; Mansaray, L.R.; Huang, J.F. Mapping high temperature damaged area of paddy rice along the Yangtze River using Moderate Resolution Imaging Spectroradiometer data. Int. J. Remote Sens. 2020, 41, 471–486. [Google Scholar] [CrossRef] [Green Version]
- Zhang, L.W.; Huang, J.F.; Guo, R.F.; Li, X.X.; Sun, W.B.; Wang, X.Z. Spatio-temporal reconstruction of air temperature maps and their application to estimate rice growing season heat accumulation using multi-temporal MODIS data. J. Zhejiang Univ.-SCI. B 2013, 14, 144–161. [Google Scholar] [CrossRef] [Green Version]
- Ray, S.S.; Singh, S.K.; Neetu; Mamatha, S. Establishing an operational system for assessment and forecasting the impact of extreme weather events on crop production. Mausam 2016, 67, 289–296. [Google Scholar] [CrossRef]
- Wang, P.; Hu, T.G.; Kong, F.; Xu, J.F.; Zhang, D.R. Rice exposure to cold stress in China: How has its spatial pattern changed under climate change? Eur. J. Agron. 2019, 103, 73–79. [Google Scholar] [CrossRef]
- Liu, Z.Y.; Qi, J.G.; Wang, N.N.; Zhu, Z.R.; Luo, J.; Liu, L.J.; Tang, J.; Cheng, J.A. Hyperspectral discrimination of foliar biotic damages in rice using principal component analysis and probabilistic neural network. Precis. Agric. 2018, 19, 973–991. [Google Scholar] [CrossRef]
- Liu, Z.Y.; Wu, H.F.; Huang, J.F. Application of neural networks to discriminate fungal infection levels in rice panicles using hyperspectral reflectance and principal components analysis. Comput. Electron. Agric. 2010, 72, 99–106. [Google Scholar] [CrossRef]
- Liu, X.D.; Sun, Q.H. Early assessment of the yield loss in rice due to the brown planthopper using a hyperspectral remote sensing method. Int. J. Pest Manag. 2016, 62, 205–213. [Google Scholar] [CrossRef]
- Choudhury, B.U.; Bouman, B.A.M.; Singh, A.K. Yield and water productivity of rice-wheat on raised beds at New Delhi, India. Field Crop. Res. 2007, 100, 229–239. [Google Scholar] [CrossRef]
- Maki, M.; Sritumboon, S.; Srisutham, M.; Yoshida, K.; Homma, K.; Sukchan, S. Impact of changes in the relationship between salinity and soil moisture on remote sensing data usage in northeast Thailand. Hydrol. Res. Lett. 2022, 16, 54–58. [Google Scholar] [CrossRef]
- Hussain, S.; Zhang, J.H.; Zhong, C.; Zhu, L.F.; Cao, X.C.; Yu, S.M.; James, A.B.; Hu, J.J.; Jin, Q.Y. Effects of salt stress on rice growth, development characteristics, and the regulating ways: A review. J. Integr. Agric. 2017, 16, 2357–2374. [Google Scholar] [CrossRef] [Green Version]
- Zhang, B.Y.; Liu, X.N.; Liu, M.L.; Meng, Y.Y. Detection of Rice Phenological Variations under Heavy Metal Stress by Means of Blended Landsat and MODIS Image Time Series. Remote Sens. 2019, 11, 17. [Google Scholar] [CrossRef] [Green Version]
- Liu, F.; Liu, X.N.; Zhao, L.T.; Ding, C.; Jiang, J.L.; Wu, L. The Dynamic Assessment Model for Monitoring Cadmium Stress Levels in Rice Based on the Assimilation of Remote Sensing and the WOFOST Model. IEEE J. Sel. Top. Appl. Earth Obs. Remote Sens. 2015, 8, 1330–1338. [Google Scholar] [CrossRef]
- Zhao, S.; Qian, X.; Liu, X.N.; Xu, Z. Finding the Key Periods for Assimilating HJ-1A/B CCD Data and the WOFOST Model to Evaluate Heavy Metal Stress in Rice. Sensors 2018, 18, 18. [Google Scholar] [CrossRef] [Green Version]
- Liu, M.B.; Li, X.L.; Liu, Y.; Huang, J.F.; Tang, Y.L. Detection of Crude Protein, Crude Starch, and Amylose for Rice by Hyperspectral Reflectance. Spectrosc. Lett. 2014, 47, 101–106. [Google Scholar] [CrossRef]
- Ryu, C.; Suguri, M.; Iida, M.; Umeda, M.; Lee, C. Integrating remote sensing and GIS for prediction of rice protein contents. Precis. Agric. 2011, 12, 378–394. [Google Scholar] [CrossRef] [Green Version]
- Gnyp, M.L.; Miao, Y.X.; Yuan, F.; Ustin, S.L.; Yu, K.; Yao, Y.K.; Huang, S.Y.; Bareth, G. Hyperspectral canopy sensing of paddy rice aboveground biomass at different growth stages. Field Crop. Res. 2014, 155, 42–55. [Google Scholar] [CrossRef]
- Zhou, X.; Zheng, H.B.; Xu, X.Q.; He, J.Y.; Ge, X.K.; Yao, X.; Cheng, T.; Zhu, Y.; Cao, W.X.; Tian, Y.C. Predicting grain yield in rice using multi-temporal vegetation indices from UAV-based multispectral and digital imagery. ISPRS J. Photogramm. Remote Sens. 2017, 130, 246–255. [Google Scholar] [CrossRef]
- Han, Y.; Liu, H.J.; Zhang, X.L.; Yu, Z.Y.; Meng, X.T.; Kong, F.C.; Song, S.Z.; Han, J. Prediction Model of Rice Panicles Blast Disease Degree Based on Canopy Hyperspectral Reflectance. Spectrosc. Spectr. Anal. 2021, 41, 1220–1226. [Google Scholar] [CrossRef]
- Ryu, J.H.; Oh, D.; Cho, J. Simple method for extracting the seasonal signals of photochemical reflectance index and normalized difference vegetation index measured using a spectral reflectance sensor. J. Integr. Agric. 2021, 20, 1969–1986. [Google Scholar] [CrossRef]
- Shammi, S.A.; Meng, Q.M. Use time series NDVI and EVI to develop dynamic crop growth metrics for yield modeling. Ecol. Indic. 2021, 121, 12. [Google Scholar] [CrossRef]
- Wang, C.Z.; Zhang, Z.; Chen, Y.; Tao, F.L.; Zhang, J.; Zhang, W. Comparing different smoothing methods to detect double-cropping rice phenology based on LAI products—A case study in the Hunan province of China. Int. J. Remote Sens. 2018, 39, 6405–6428. [Google Scholar] [CrossRef]
- Dong, J.W.; Xiao, X.M.; Kou, W.L.; Qin, Y.W.; Zhang, G.L.; Li, L.; Jin, C.; Zhou, Y.T.; Wang, J.; Biradar, C.; et al. Tracking the dynamics of paddy rice planting area in 1986-2010 through time series Landsat images and phenology-based algorithms. Remote Sens. Environ. 2015, 160, 99–113. [Google Scholar] [CrossRef]
- Wang, Y.; Zang, S.Y.; Tian, Y. Mapping paddy rice with the random forest algorithm using MODIS and SMAP time series. Chaos Solitons Fractals 2020, 140, 110116. [Google Scholar] [CrossRef]
- Yang, S.B.; Zhao, X.Y.; Li, B.B.; Hua, G.Q. Interpreting RADARSAT-2 Quad-Polarization SAR Signatures From Rice Paddy Based on Experiments. IEEE Geosci. Remote Sens. Lett. 2012, 9, 65–69. [Google Scholar] [CrossRef]
- Oh, Y.; Hong, S.Y.; Kim, Y.; Hong, J.Y.; Kim, Y.H. Polarimetric Backscattering Coefficients of Flooded Rice Fields at L- and C-Bands: Measurements, Modeling, and Data Analysis. IEEE Trans. Geosci. Remote Sens. 2009, 47, 2714–2721. [Google Scholar] [CrossRef]
- Oza, S.R.; Panigrally, S.; Parihar, J.S. Concurrent use of active and passive microwave remote sensing data for monitoring of rice crop. Int. J. Appl. Earth Obs. Geoinf. 2008, 10, 296–304. [Google Scholar] [CrossRef]
- Jiang, X.Q.; Fang, S.H.; Huang, X.; Liu, Y.H.; Guo, L.L. Rice Mapping and Growth Monitoring Based on Time Series GF-6 Images and Red-Edge Bands. Remote Sens. 2021, 13, 579. [Google Scholar] [CrossRef]
- Li, S.Y.; Ding, X.Z.; Kuang, Q.L.; Ata-Ul-Karim, S.T.; Cheng, T.; Liu, X.J.; Tan, Y.C.; Zhu, Y.; Cao, W.X.; Cao, Q. Potential of UAV-Based Active Sensing for Monitoring Rice Leaf Nitrogen Status. Front. Plant Sci 2018, 9, 1834. [Google Scholar] [CrossRef] [Green Version]
- Paul, G.C.; Saha, S.; Hembram, T.K. Application of phenology-based algorithm and linear regression model for estimating rice cultivated areas and yield using remote sensing data in Bansloi River Basin, Eastern India. Remote Sens. Appl.-Soc. Environ. 2020, 19, 100367. [Google Scholar] [CrossRef]
- Nimon, K.F.; Oswald, F.L. Understanding the Results of Multiple Linear Regression: Beyond Standardized Regression Coefficients. Organ. Res. Methods 2013, 16, 650–674. [Google Scholar] [CrossRef] [Green Version]
- Zhong, L.H.; Hu, L.N.; Zhou, H. Deep learning based multi-temporal crop classification. Remote Sens. Environ. 2019, 221, 430–443. [Google Scholar] [CrossRef]
- Sonobe, R.; Yamashita, H.; Mihara, H.; Morita, A.; Ikka, T. Hyperspectral reflectance sensing for quantifying leaf chlorophyll content in wasabi leaves using spectral pre-processing techniques and machine learning algorithms. Int. J. Remote Sens. 2021, 42, 1311–1329. [Google Scholar] [CrossRef]
- Belgiu, M.; Csillik, O. Sentinel-2 cropland mapping using pixel-based and object-based time-weighted dynamic time warping analysis. Remote Sens. Environ. 2018, 204, 509–523. [Google Scholar] [CrossRef]
- Sarkar, T.K.; Ryu, C.S.; Kang, J.G.; Kang, Y.S.; Jun, S.R.; Jang, S.H.; Park, J.W.; Song, H.Y. Artificial Neural Network-based Model for Predicting Moisture Content in Rice Using UAV Remote Sensing Data. Korean J. Remote Sens. 2018, 34, 611–624. [Google Scholar] [CrossRef]
- Zha, H.N.; Miao, Y.X.; Wang, T.T.; Li, Y.; Zhang, J.; Sun, W.C.; Feng, Z.Q.; Kusnierek, K. Improving Unmanned Aerial Vehicle Remote Sensing-Based Rice Nitrogen Nutrition Index Prediction with Machine Learning. Remote Sens. 2020, 12, 215. [Google Scholar] [CrossRef] [Green Version]
- Mishra, V.N.; Prasad, R.; Kumar, P.; Srivastava, P.K.; Rai, P.K. Knowledge-based decision tree approach for mapping spatial distribution of rice crop using C-band synthetic aperture radar-derived information. J. Appl. Remote Sens. 2017, 11, 046003. [Google Scholar] [CrossRef]
- Lopez-Andreu, F.J.; Erena, M.; Dominguez-Gomez, J.A.; Lopez-Morales, J.A. Sentinel-2 Images and Machine Learning as Tool for Monitoring of the Common Agricultural Policy: Calasparra Rice as a Case Study. Agron.-Basel 2021, 11, 621. [Google Scholar] [CrossRef]
- Ndikumana, E.; Minh, D.H.T.; Baghdadi, N.; Courault, D.; Hossard, L. Deep Recurrent Neural Network for Agricultural Classification using multitemporal SAR Sentinel-1 for Camargue, France. Remote Sens. 2018, 10, 16. [Google Scholar] [CrossRef] [Green Version]
- Jacquemoud, S.; Baret, F. Prospect—A model of leaf optical-properties spectra. Remote Sens. Environ. 1990, 34, 75–91. [Google Scholar] [CrossRef]
- Verhoef, W. Light-scattering by leaf layers with application to canopy reflectance modeling—The sail model. Remote Sens. Environ. 1984, 16, 125–141. [Google Scholar] [CrossRef] [Green Version]
- Ganapol, B.D.; Johnson, L.F.; Hammer, P.D.; Hlavka, C.A.; Peterson, D.L. LEAFMOD: A new within-leaf radiative transfer model. Remote Sens. Environ. 1998, 63, 182–193. [Google Scholar] [CrossRef]
- Khanal, S.; Kushal, K.C.; Fulton, J.P.; Shearer, S.; Ozkan, E. Remote Sensing in Agriculture-Accomplishments, Limitations, and Opportunities. Remote Sens. 2020, 12, 3783. [Google Scholar] [CrossRef]
- Duan, B.; Fang, S.; Gong, Y.; Peng, Y.; Wu, X.; Zhu, R. Remote estimation of grain yield based on UAV data in different rice cultivars under contrasting climatic zone. Field Crop. Res. 2021, 267, 108148. [Google Scholar] [CrossRef]
- Hama, A.; Tanaka, K.; Mochizuki, A.; Tsuruoka, Y.; Kondoh, A. Improving the UAV-based yield estimation of paddy rice by using the solar radiation of geostationary satellite Himawari-8. Hydrol. Res. Lett. 2020, 14, 56–61. [Google Scholar] [CrossRef] [Green Version]
- Asgarian, A.; Soffianian, A.; Pourmanafi, S. Crop type mapping in a highly fragmented and heterogeneous agricultural landscape: A case of central Iran using multi-temporal Landsat 8 imagery. Comput. Electron. Agric. 2016, 127, 531–540. [Google Scholar] [CrossRef]
- Son, N.T.; Chen, C.F.; Chen, C.R.; Duc, H.N.; Chang, L.Y. A Phenology-Based Classification of Time-Series MODIS Data for Rice Crop Monitoring in Mekong Delta, Vietnam. Remote Sens. 2014, 6, 135–156. [Google Scholar] [CrossRef] [Green Version]
- Dong, J.W.; Xiao, X.M. Evolution of regional to global paddy rice mapping methods: A review. ISPRS J. Photogramm. Remote Sens. 2016, 119, 214–227. [Google Scholar] [CrossRef] [Green Version]
- Ishitsuka, N. Identification of Paddy Rice Areas Using SAR: Some Case Studies in Japan. Jarq-Jpn. Agric. Res. Q. 2018, 52, 197–204. [Google Scholar] [CrossRef] [Green Version]
- Lu, J.S.; Li, W.Y.; Yu, M.L.; Zhang, X.B.; Ma, Y.; Su, X.; Yao, X.; Cheng, T.; Zhu, Y.; Cao, W.X.; et al. Estimation of rice plant potassium accumulation based on non-negative matrix factorization using hyperspectral reflectance. Precis. Agric. 2021, 22, 51–74. [Google Scholar] [CrossRef]
- Huang, Y.B.; Chen, Z.X.; Yu, T.; Huang, X.Z.; Gu, X.F. Agricultural remote sensing big data: Management and applications. J. Integr. Agric. 2018, 17, 1915–1931. [Google Scholar] [CrossRef]
- Sishodia, R.P.; Ray, R.L.; Singh, S.K. Applications of Remote Sensing in Precision Agriculture: A Review. Remote Sens. 2020, 12, 3136. [Google Scholar] [CrossRef]
- Li, P.L.; Zhang, X.; Wang, W.H.; Zheng, H.B.; Yao, X.; Tian, Y.C.; Zhu, Y.; Cao, W.X.; Chen, Q.; Cheng, T. Estimating aboveground and organ biomass of plant canopies across the entire season of rice growth with terrestrial laser scanning. Int. J. Appl. Earth Obs. Geoinf. 2020, 91, 102132. [Google Scholar] [CrossRef]
- Han, X.; Liu, F.B.; He, X.L.; Ling, F.L. Research on Rice Yield Prediction Model Based on Deep Learning. Comput. Intell. Neurosci. 2022, 2022, 1922561. [Google Scholar] [CrossRef] [PubMed]
- Yao, J.X.; Wu, J.; Xiao, C.Z.; Zhang, Z.; Li, J.Z. The Classification Method Study of Crops Remote Sensing with Deep Learning, Machine Learning, and Google Earth Engine. Remote Sens. 2022, 14, 2758. [Google Scholar] [CrossRef]
- Jin, X.L.; Kumar, L.; Li, Z.H.; Feng, H.K.; Xu, X.G.; Yang, G.J.; Wang, J.H. A review of data assimilation of remote sensing and crop models. Eur. J. Agron. 2018, 92, 141–152. [Google Scholar] [CrossRef]
- Xie, X.; Yang, S.Q. An Warning Information System for Rice Disease Based on WebGIS. In Proceedings of the 8th International Conference on Applied Science, Engineering and Technology (ICASET), Qingdao, China, 25–26 March 2018; pp. 96–100. [Google Scholar]
- Li, X.Q.; Li, L.; Liu, X.N. Collaborative inversion heavy metal stress in rice by using two-dimensional spectral feature space based on HJ-1 A HSI and radarsat-2 SAR remote sensing data. Int. J. Appl. Earth Obs. Geoinf. 2019, 78, 39–52. [Google Scholar] [CrossRef]
Figure 1.
The number of papers on rice remote sensing published in journals from 1980–2021.
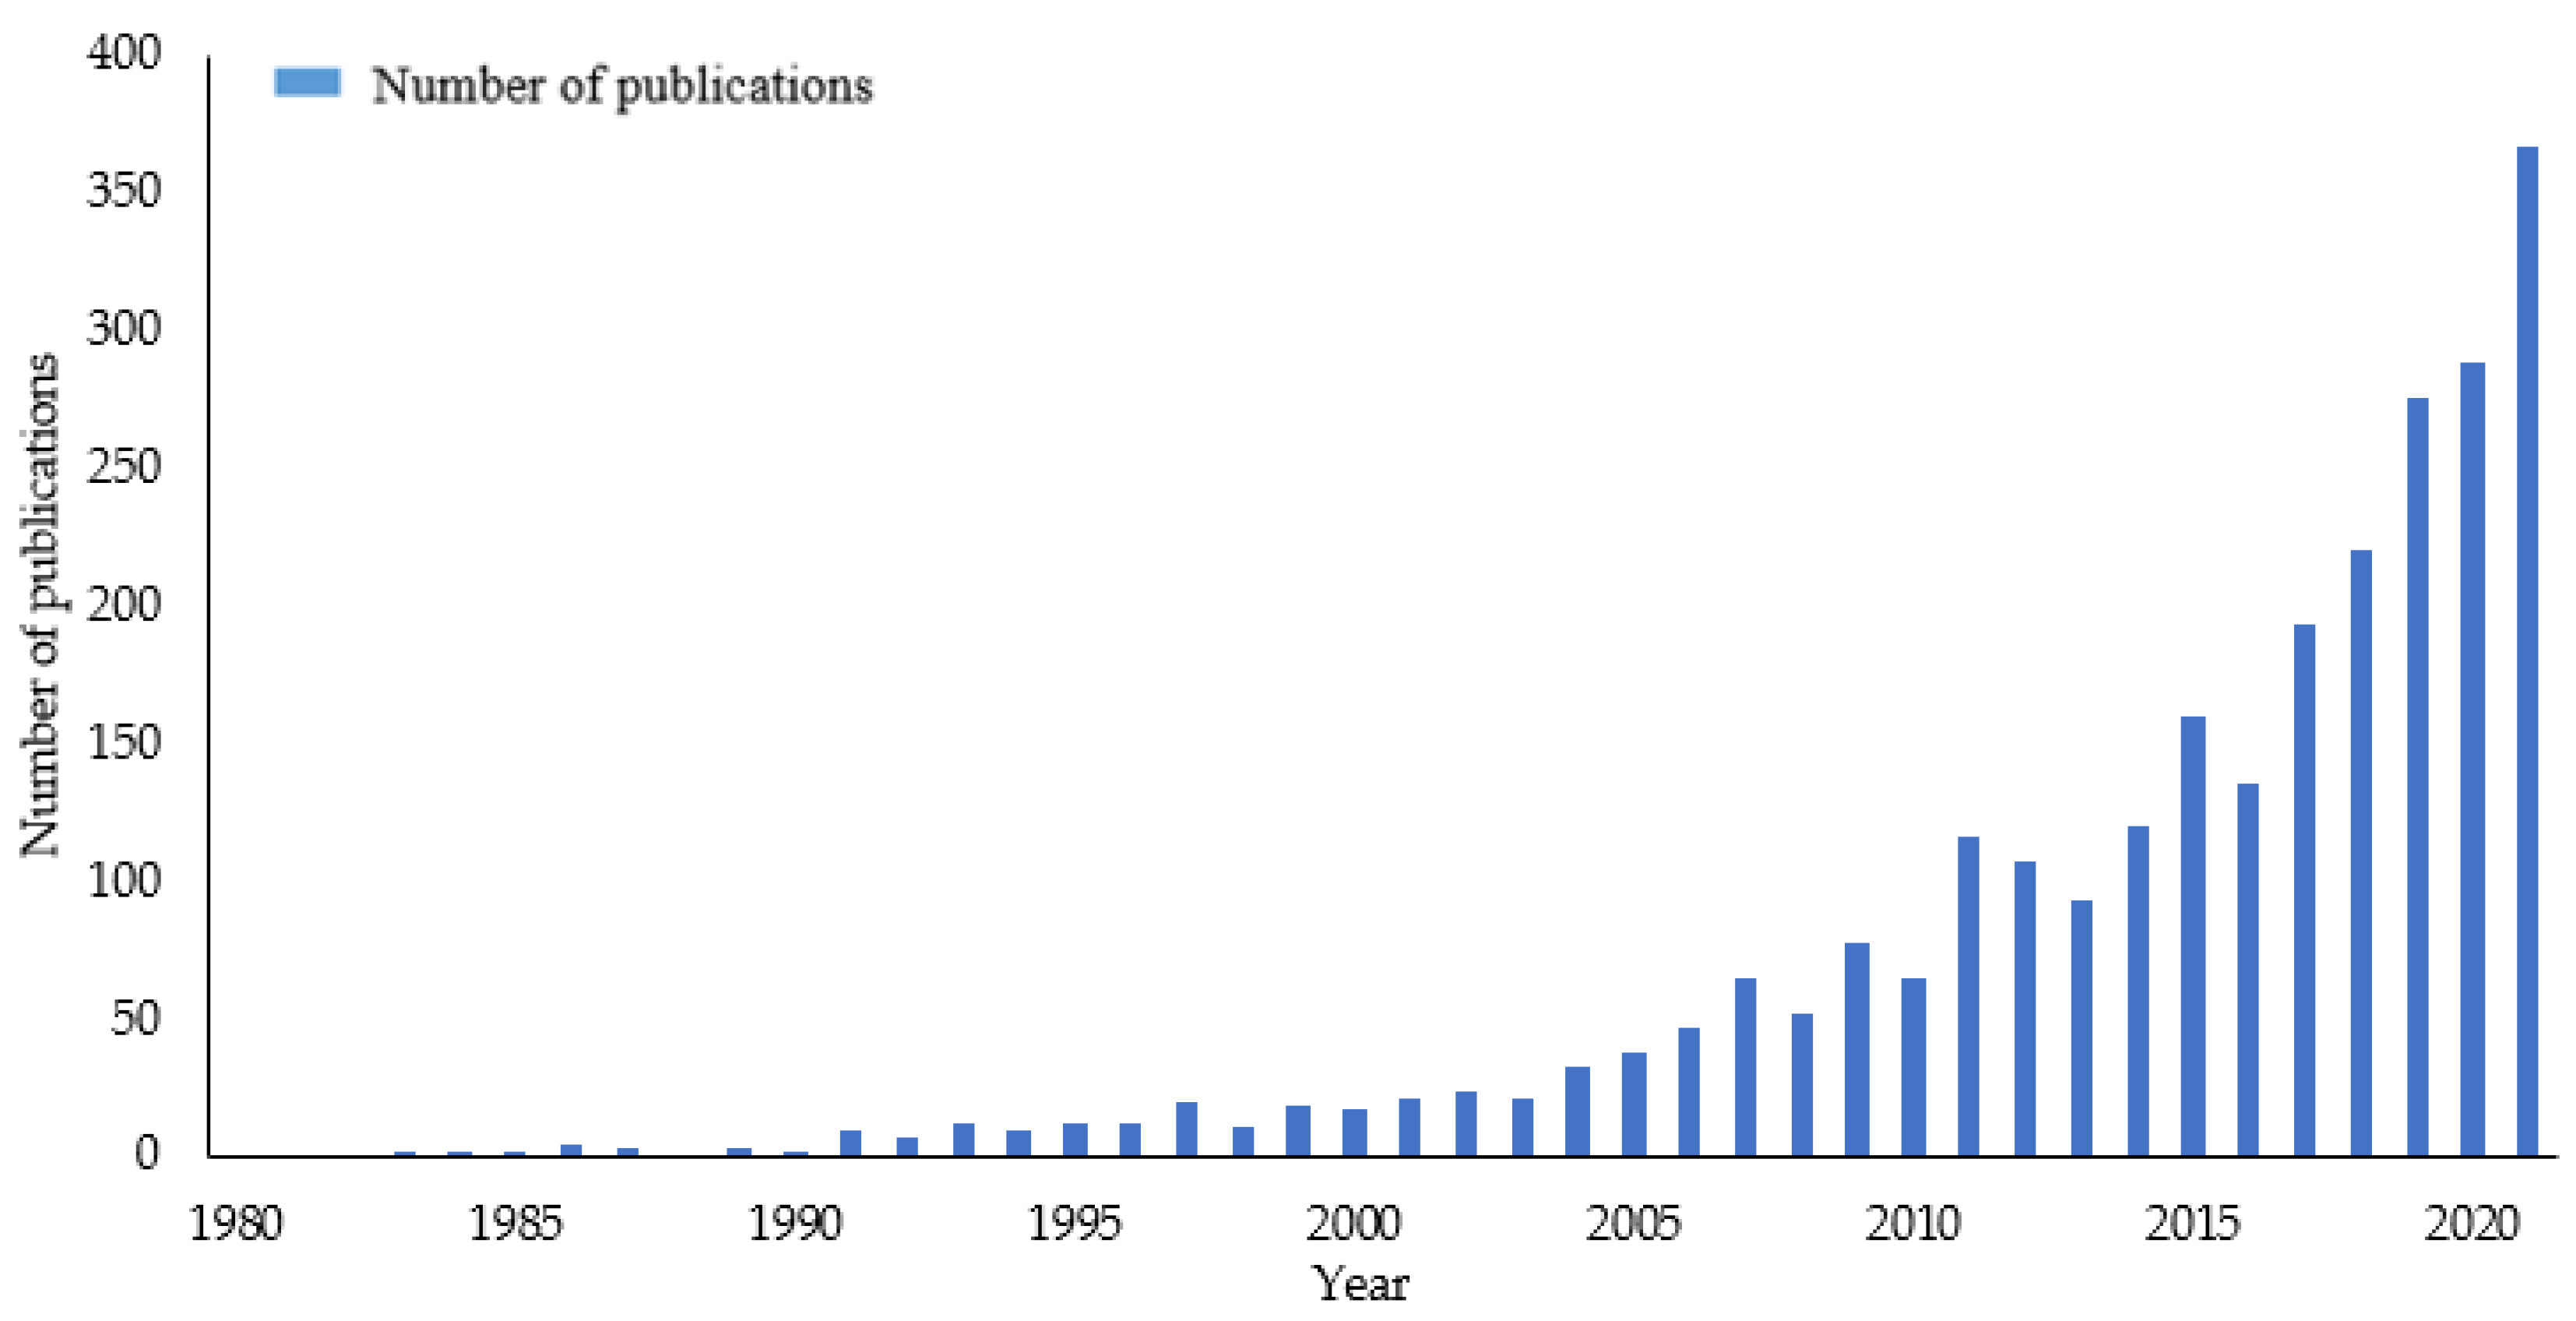
Figure 2.
Fields covered in the literature of rice remote sensing research in 1980–2021.

Figure 3.
Visualization of the number of published documents by country (a) and by continent (b).
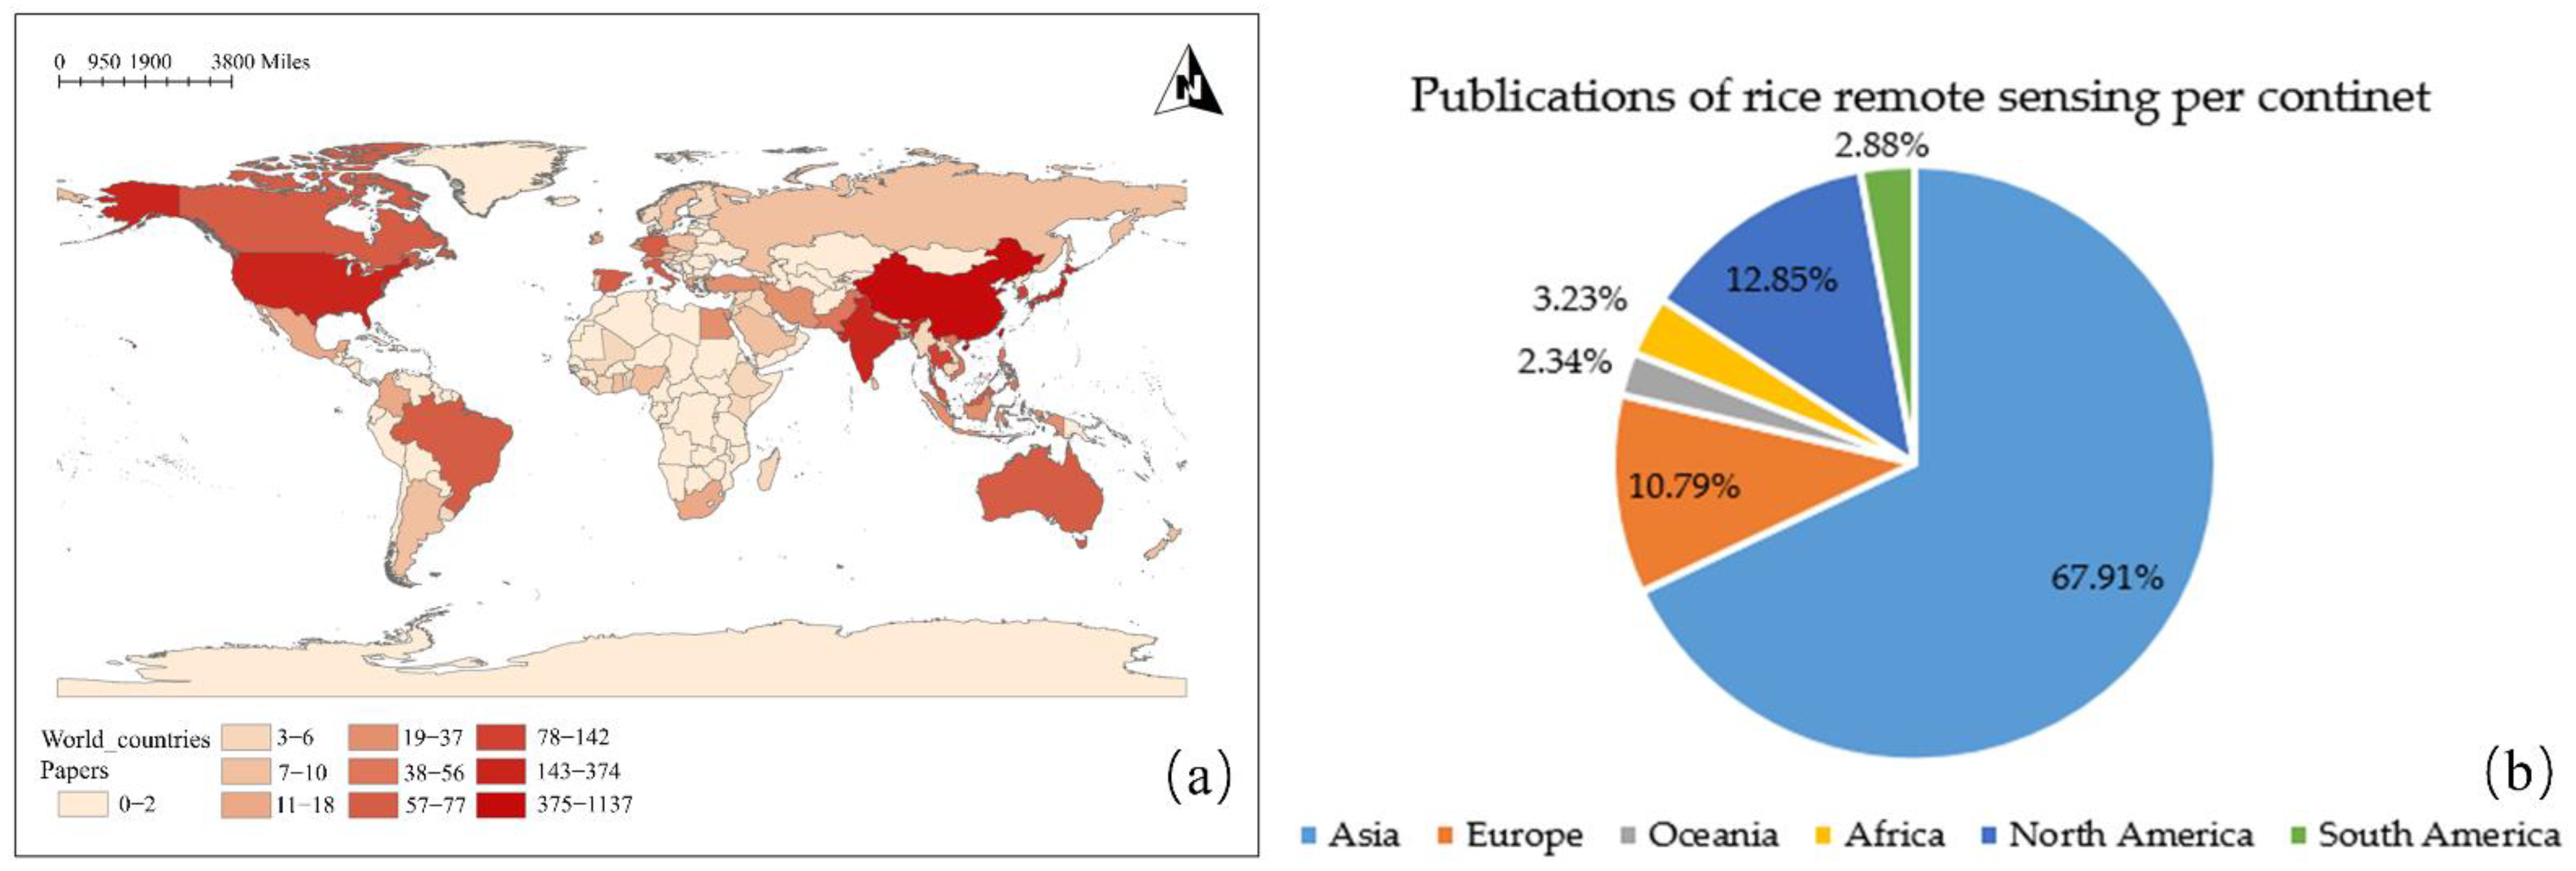
Figure 4.
Global rice-harvesting areas of 2020 (Note: the data was collected from the Food and Agriculture Organization (FAO) website).
Figure 4.
Global rice-harvesting areas of 2020 (Note: the data was collected from the Food and Agriculture Organization (FAO) website).
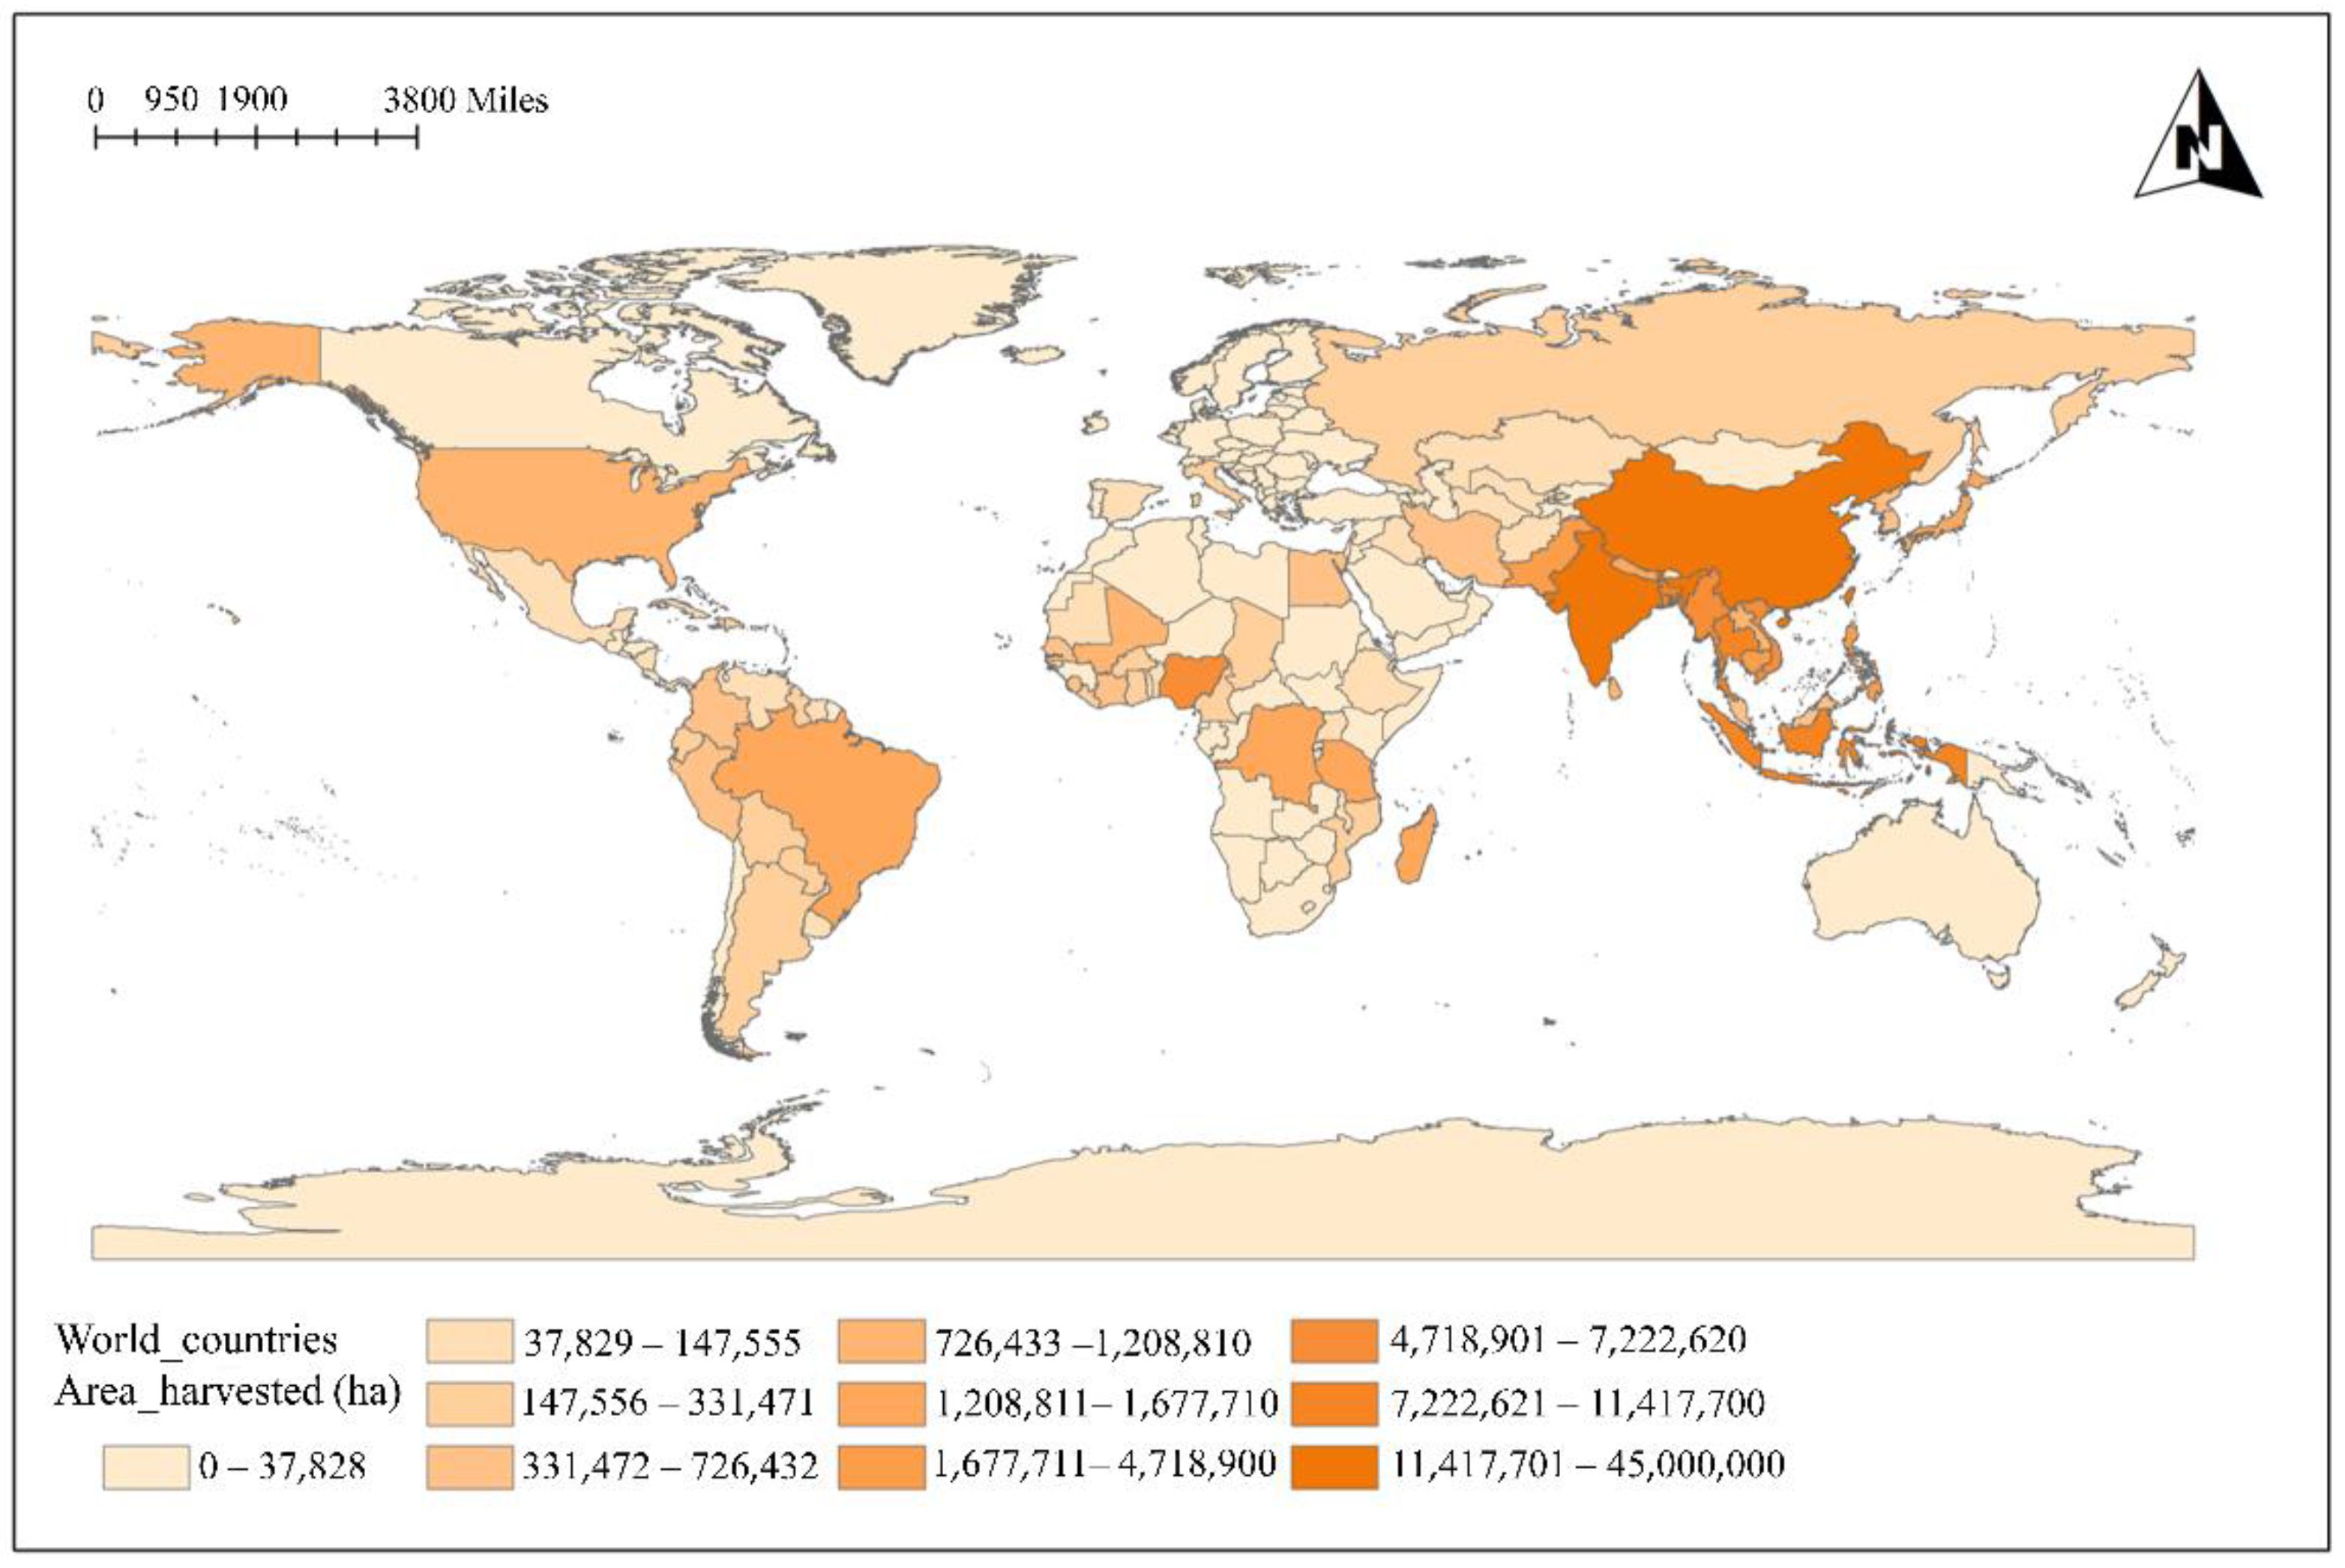

Table 1.
Search strategy of the Boolean formula.
| Search Plan | Design Perspective | Content Details |
|---|---|---|
| Title | Rice | |
| Topics | Main | Remote sensing |
| Satellite platform | “Landsat”, “NOAA”, “ASTER”, “ENVISAT”, “Sentinel”, “TRMM”, “MODIS”, “radar”, “SAR”, “synthetic aperture radar”, (satellite and image), (satellite and imagery), (HJ and satellite), (GF and satellite), (satellite and SPOT), “CBERS”, (WorldView and satellite), (GeoEye and satellite), (RapidEye and satellite), (ALOS and satellite), (QuickBird and satellite), (TerraSAR-X Radar), (IKONOS and satellite), (ZY and satellite) | |
| UAV platform | “UAV”, “UAS”, “RPAS”, “drone”, “unmanned aircraft”, “unmanned aerial vehicle”, “Lidar” | |
| Ground platform | “spectrometer”, “ASD”, “analytical spectral device”, “active sensor”, “optical sensor”, “GreenSeeker”, “proximal ground platform” | |
| Sensors | “AVHRR”, (image and TM), (image and ETM+), (image and OLI) | |
| Wavelength | “reflectance”, “hyperspectral”, “multispectral”, “back-scattering”, “microwave”, “near-infrared”, “red-edge”, “short wave infrared’’, “polarization”, “polarimetric”, “NIR” | |
| Images | (aerial orthophoto), (aerial data), (aerial orthoimages) |
Table 2.
Top 10 countries in the number of publications.
| Rank | Countries | Publications | Centrality |
|---|---|---|---|
| 1 | People’s Republic of China | 1137 | 0.12 |
| 2 | The United States of America (USA) | 374 | 0.84 |
| 3 | Japan | 283 | 0.10 |
| 4 | India | 273 | 0.05 |
| 5 | Thailand | 142 | 0.01 |
| 6 | South Korea | 116 | 0.02 |
| 7 | Malaysia | 77 | 0.02 |
| 8 | Australia | 74 | 0.06 |
| 8 | Italy | 74 | 0.06 |
| 9 | Brazil | 72 | 0.01 |
| 10 | Spain | 67 | 0.08 |
Table 3.
Statistics of the publications and research attentions of core research forces.
| Rank | Institutions | Publications | Focus |
|---|---|---|---|
| 1 | Chinese Academy of Sciences (CAS) | 220 | Rice growth, leaf area index (LAI), Radar, growth monitoring and yield estimation, etc. |
| 2 | Zhejiang University | 152 | Rice planting area, chlorophyll, rice yield estimation, etc. |
| 3 | Nanjing Agriculture University | 92 | Nitrogen nutrition, rice growth monitoring and product, rice growth model, etc. |
| 4 | Consultative Group on International Agricultural Research (CGIAR) | 71 | Rice mapping, rice meteorological remote sensing, rice phenology, etc. |
| 5 | China University of Geoscience | 56 | Heavy metal pollution, heavy metal stress, etc. |
| 5 | Chinese academy of agricultural sciences | 56 | Temporal and spatial pattern dynamics of rice, rice yield estimation, etc. |
| 6 | Wuhan University | 55 | Rice heterosis mechanism, data processing, rice parameters and yield, etc. |
| 7 | Indian Council of Agricultural Research (ICAR) | 54 | Rice gene, rice quality, etc. |
| 7 | United states department of agriculture (USDA) | 54 | Rice yield, rice quality, rice mapping, etc. |
| 8 | China agricultural University | 51 | Rice spectrum, rice identification, rice area extraction, etc. |
| 9 | Indian institute of technology system (IIT SYSTEM) | 46 | Rice nitrogen, rice spectrum, etc. |
| 10 | National agriculture food research organization Japan | 43 | Rice classification, rice disasters, etc. |
Table 4.
Statistics of the keywords in the papers on rice remote sensing.
| Rank | Keywords | Publications | Percentage | Year |
|---|---|---|---|---|
| 1 | Reflectance | 361 | 18.44% | 1991 |
| 2 | Vegetation index | 272 | 13.89% | 1991 |
| 3 | Model | 248 | 12.67% | 1992 |
| 4 | Yield | 223 | 11.39% | 1996 |
| 5 | Classification | 179 | 9.14% | 1991 |
| 6 | Leaf area index (LAI) | 165 | 8.43% | 1996 |
| 7 | Moderate Resolution Imaging Spectrometer (MODIS) | 142 | 7.25% | 2004 |
| 8 | Biomass | 136 | 6.95% | 1993 |
| 9 | Chlorophyll content | 124 | 6.33% | 1994 |
| 10 | Phenology | 108 | 5.52% | 2009 |
Table 5.
The hot spots of rice remote sensing from the perspective of research objects.
| Research Objects | Keywords | Publications | Strength | Burst Year |
|---|---|---|---|---|
| Growth | Leaf area index (LAI) | 165 | 1.97 | 2003 |
| Biomass | 136 | 5.82 | 1998 | |
| Chlorophyll | 124 | 2.15 | 2001 | |
| Phenology | 108 | 2.97 | 2015 | |
| Nitrogen | 103 | 4.69 | 2013 | |
| Yield | 223 | 2.12 | 2006 | |
| Area | Area extraction | 125 | 0.41 | 1997 |
| Planting area | 22 | 0.41 | 1998 | |
| Stress | Meteorological disaster | 72 | 2.64 | 2005 |
| Heavy metal | 44 | 5.10 | 2016 | |
| Pest | 44 | 4.50 | 2001 | |
| Disease | 30 | 2.64 | 1993 | |
| Salinization | 8 | 1.97 | 2006 | |
| Quality | 135 | 3.25 | 2010 |
Table 6.
The hot spots of rice remote sensing from the perspective of spectral variables.
| Spectral Variables | Publications | Strength | Begin | Burst Year |
|---|---|---|---|---|
| Reflectance | 361 | 1.61 | 1991 | 2001 |
| Vegetation Index | 272 | 2.83 | 1991 | 2005 |
| Back-scattering coefficient | 116 | 2.61 | 1997 | 2009 |
| Time series | 103 | 2.97 | 2010 | 2018 |
| Red edge | 29 | 1.34 | 2003 | 2011 |
Table 7.
Quantitative remote sensing modeling methods.
| Models | Publications | Strength | Begin | Burst Year |
|---|---|---|---|---|
| Statistical model | 165 | 2.23 | 1992 | 2005 |
| Artificial intelligence method | 152 | 2.02 | 1994 | 2009 |
| Radiation transfer model | 47 | 1.30 | 1996 | 1999 |
Table 8.
Analysis of the hot spots of rice research from the perspective of sensor platforms.
| Platforms | Keywords | Publications | Strength | Begin | Burst Year |
|---|---|---|---|---|---|
| Satellite | Moderate Resolution Imaging Spectrometer (MODIS) | 187 | 3.84 | 2004 | 2012 |
| RadarSat | 97 | 2.94 | 1999 | 1999 | |
| Landsat | 94 | 1.29 | 1991 | 2013 | |
| Sentinel | 39 | 5.43 | 2014 | 2018 | |
| Unmanned Aerial Vehicle (UAV) | 60 | 1.69 | 2016 | 2018 | |
| Ground | Hyperspectral | 71 | 5.02 | 1998 | 2004 |
| Canopy | 66 | 1.55 | 1996 | 2009 |
Publisher’s Note: MDPI stays neutral with regard to jurisdictional claims in published maps and institutional affiliations. |
© 2022 by the authors. Licensee MDPI, Basel, Switzerland. This article is an open access article distributed under the terms and conditions of the Creative Commons Attribution (CC BY) license (https://creativecommons.org/licenses/by/4.0/).
Share and Cite
MDPI and ACS Style
Xu, T.; Wang, F.; Yi, Q.; Xie, L.; Yao, X. A Bibliometric and Visualized Analysis of Research Progress and Trends in Rice Remote Sensing over the Past 42 Years (1980–2021). Remote Sens. 2022, 14, 3607. https://doi.org/10.3390/rs14153607
AMA Style
Xu T, Wang F, Yi Q, Xie L, Yao X. A Bibliometric and Visualized Analysis of Research Progress and Trends in Rice Remote Sensing over the Past 42 Years (1980–2021). Remote Sensing. 2022; 14(15):3607. https://doi.org/10.3390/rs14153607
Chicago/Turabian StyleXu, Tianyue, Fumin Wang, Qiuxiang Yi, Lili Xie, and Xiaoping Yao. 2022. "A Bibliometric and Visualized Analysis of Research Progress and Trends in Rice Remote Sensing over the Past 42 Years (1980–2021)" Remote Sensing 14, no. 15: 3607. https://doi.org/10.3390/rs14153607
Note that from the first issue of 2016, this journal uses article numbers instead of page numbers. See further details here.