

Validation and Analysis of MAIAC AOD Aerosol Products in East Asia from 2011 to 2020
by
 ,
,
Ping Wang
1, 
Qingxin Tang
1,*,
Yuxin Zhu
2,
Ke Zheng
1,
Tianquan Liang
1,
Quanzhou Yu
1 and
Yaqian He
3 1
College of Geography and Environment, Liaocheng University, Liaocheng 252059, China
2
School of Urban and Environmental Sciences, Huaiyin Normal University, Huai’an 223300, China
3
Department of Geography, University of Central Arkansas, Conway, AR 72034, USA
*
Author to whom correspondence should be addressed.
Remote Sens. 2022, 14(22), 5735; https://doi.org/10.3390/rs14225735
Submission received: 9 October 2022
/
Revised: 4 November 2022
/
Accepted: 9 November 2022
/
Published: 13 November 2022
Abstract
:East Asia is one of the most important sources of aerosols in the world. The distribution of aerosols varies across time and space. Accurate aerosol data is crucial to identify its spatiotemporal dynamics; thus, it is of great significance to obtain and verify new aerosol data for this region. Based on the Aerosol Optical Depth (AOD) data of the Aerosol Robotic Network (AERONET) program for 17 stations from 2011 to 2020, this study comprehensively verified the accuracy and applicability of the Multi-Angle Implementation of Atmospheric Correction (MAIAC) AOD 1 km products among different seasons, elevations, and climate zones over entire East Asia. The results showed that: (1) The overall accuracy of MAIAC AOD was high in East Asia, and the accuracy of Terra was slightly better than that of Aqua. MAIAC AOD showed significant heterogeneity among sites. MAIAC AOD performed well in areas with high vegetation cover and flat terrain, while the inversion accuracy was relatively low in areas with low vegetation cover and high terrain. (2) In general, MAIAC AOD and AERONET AOD showed good agreement in different seasons, presenting as winter > spring > autumn > summer. Yet the accuracy and consistency of Terra AOD product were better than Aqua product. (3) MAIAC AOD showed different accuracy at different elevations and climate zones. It had a high correlation and best inversion accuracy with AERONET AOD at low and medium elevations. MAIAC AOD had better inversion accuracy in the arid and warm temperate zones than that in the equatorial and cold temperate zones. (4) AOD distribution and its trend showed significant spatial differences in East Asia. The high AOD values were dominant in the Sichuan basin and the eastern plains of China, as well as in India and Bangladesh, while the relatively low AOD values were distributed in southwestern China and the areas north of 40°N. AOD in most parts of East Asia showed a negative trend, indicating a great improvement in air quality in these regions.

1. Introduction
Atmospheric aerosols are stable mixed systems of solid and liquid particles uniformly dispersed in the atmosphere, and the aerodynamic diameter of the particles ranges from 0.001 to 100 μm [1]. Aerosol sources and formation mechanisms are complex. The main sources can be divided into anthropogenic sources (e.g., industrial emissions, straw burning, vehicle exhaust, and construction) and natural sources (e.g., sea salt particles, forest wildfires, volcanic eruptions, and wind and sand dust) [2]. Due to the combination of local sources and long-range transport, aerosol aging [3,4] and interactions between different types of aerosols can lead to the formation of various mixed states (i.e., internal and external) of aerosols [5]. Different types of atmospheric aerosols directly affect the Earth’s climate system by scattering and absorbing solar radiation [6,7,8] and also impact visibility [9], air quality [10,11], and human health [12,13]. Thus, a better understanding of the distribution and variation of aerosols across different regions is essential to improve the quality of human life. Aerosol Optical Depth (AOD) is one of the important optical parameters to characterize aerosol properties. The physical meaning of AOD is the total weakening intensity of solar radiation by aerosol absorption and scattering per unit cross-section along the radiation transmission path, which is mainly used to describe the light attenuation effect of aerosols [14]. AOD, which reflects regional atmospheric pollution level and ground-level air quality, has been widely used for quantitative assessment of air quality [15]. Detailed, reliable, and continuous AOD monitoring is essential for air quality management and protection of human health.
AOD acquisition methods mainly include ground-based observation and satellite remote sensing [16]. Because of the small number and uneven distribution of ground-based observation stations, it is difficult to characterize and analyze the spatial and temporal distribution of AOD. Unlike ground-based observations, satellite remote sensing has largely compensated for the lack of aerosol observations and uneven distribution in the spatial dimension. It has been used widely to quantify and monitor aerosol distribution over a large area.
However, there are some differences between ground and remote sensing AOD due to topography, different inversion methods, and instrument degradation [17]. Validation of remotely sensed AOD is essential for surface characterization and atmospheric correction of air quality [18]. The Aerosol Robotic Network (AERONET) is a ground-based aerosol observation network jointly established by NASA and LOAPHOTONS (CNRS), providing high-quality data for major regions of the world. The data from AERONET has been used to verify satellite remote-sensing aerosol products [19]. For example, Che et al. [20] used AERONET and CARSNET data in China to evaluate the accuracy and adaptability of Moderate Resolution Imaging Spectroradiometer (MODIS) Aqua C 6 and C 6.1 dark target (DT) AOD products with a resolution of 10 km at different scales and sub-surfaces for the period of 2002–2014. Similarly, Aldabash et al. [21] used AERONET observations to verify the accuracy of MODIS C 6.1 and Modern-ERA Retrospective Analysis for Research and Application (MERRA-2) AOD in Turkey. They found that MODIS AOD accuracy was better, and the number of daily, monthly, and quarterly available AOD values increased significantly when MODIS Terra and Aqua observations were combined. Anoruo [22] used AERONET observations to validate the MODIS AOD and its characteristics over Italy during the monsoon season. The results have quantified an advancement to characterize trends in MODIS and AERONET AODs in monsoon periods in Italy. It was found that there were some differences between MODIS and AERONET AODs in monsoon periods. Therefore, it is quite important for validating AOD data among different seasons.
The MCD19A2 data is a Multi-Angle Implementation of Atmospheric Correction (MAIAC) terrestrial AOD gridded level 2 product with a spatial resolution of 1 km. The MCD19A2 data, combined with MODIS Terra and Aqua [23], performs well across the globe, such as in South America [24], South Asia [25], and Europe [26,27]. A number of studies have assessed the accuracy of MAIAC AOD data. Chen et al. [28] examined the applicability and distribution characteristics of MAIAC AOD in Central Asia based on the AOD data from remote sensing (i.e., MYD04_L2) and ground-based observations (i.e., AERONET and Microtop II). With the information entropy method, they showed that MAIAC AOD had strong applicability in describing the local fine-scale features and large interannual variability in most of the Central Asian regions over the past 20 years. Further, Falah et al. [29] comparatively explored the effects of different environments on MAIAC AOD inversions across North Africa, California, and Germany and suggested that the AOD inversions obtained in areas with higher vegetation cover (i.e., lower surface reflectance) were more accurate than those obtained in arid areas. They further demonstrated that the inversion accuracy had a large deviation between MAIAC and AERONET AOD at high aerosol loadings of coarse particles. Wu et al. [30] investigated the spatial distribution, interannual variation, and occurrence frequency of atmospheric aerosol optical properties at the regional scale in the city of Tianjin, China, from 2001 to 2020 using MAIAC AOD data. They revealed significant long-term variations of atmospheric aerosol optical properties in coastal areas. In summary, MAIAC AOD has great advantages and is more suitable for studies that aim to show comprehensive or spatial details, compared to the AOD inversion products generated by the DT and Deep Blue algorithms (DB) [25,31]. If the data inversion results prove to be reliable over a certain region, its high spatial resolution is a great advantage, making it possible to conduct AOD-related studies at a finer scale. It may also make the integration with other satellite data more convenient.
East Asia is one of the largest sources of aerosols and their precursors, which are mostly a complex mixture of coarse and fine particles [32]. As the most populous and fastest-growing region in the world, anthropogenic aerosol emissions are rapidly increasing [33], and aerosol composition and spatial distribution are rapidly changing [34,35]. This has exacerbated the impact of aerosols on human life and the climatic environment. As a result of increased pollutant emissions, the frequency of severe haze events in East Asia has increased substantially, especially under stagnant meteorological conditions that favor secondary aerosol formation and accumulation [36,37]. Therefore, it is important to investigate the spatial and temporal distribution patterns of aerosols in East Asia for the protection of the atmospheric environment and the health of life in the region. Yet there are relatively few studies using long-term time series data of MAIAC AOD in this region. One possible reason is due to a lack of accurate information on MAIAC AOD data in East Asia. To address this gap, this study assessed the applicability and accuracy of MCD19A2 AOD data based on AERONET AOD data, providing reliable data for subsequent atmospheric studies in East Asia.
2. Data and Methods
2.1. Study Area
The aim of this study is to investigate the accuracy and applicability of MAIAC AOD in East Asia from 2011 to 2020, including eastern and central China, Mongolia, North Korea, South Korea, Laos, Cambodia, the Philippines, Thailand, and Vietnam, and some regions in Myanmar, Japan, and Malaysia, as shown in Figure 1.
2.2. Data
2.2.1. MAIAC AOD
MCD19A2 (2011–2020) Collection 6 (MAIAC aerosol product) was obtained from the National Aeronautics and Space Administration (NASA) Goddard Space Flight Center (https://earthdata.nasa.gov/, accessed on 7 June 2021). This data with 1 km spatial resolution is a daily terrestrial atmospheric aerosol product generated by MODIS AOD product and a multi-angle atmospheric correction algorithm [38]. Compared with AOD products provided by other satellites, MCD19A2 has relatively better quality, wider coverage, and higher spatial and temporal resolutions [39].
2.2.2. Ground-Based AOD
AERONET (https://aeronet.gsfc.nasa.gov/, accessed on 20 June 2021) is a global ground-based aerosol observation network organized by NASA and CNRS. AERONET version 3 provides optical and physical properties of aerosols and publishes aerosol observations at three quality levels, including daily monitoring data at level 2 with high accuracy (error ±0.01~0.02). This can well reflect local aerosol characteristics and variations and thus is a good ground-based aerosol calibration data set. This study selected 17 ground-based AERONET stations, which are evenly distributed in the study area (Figure 1c and Table 1).
The AERONET instrument collects data at multiple wavelengths, and AERONET does not directly provide observations at 550 nm, which is slightly different from the MODIS channel (550 nm). Therefore, the AOD at 550 nm was obtained by interpolating the Ångstrom index (α) at 440 nm to 870 nm, as defined in Equations (1) and (2).
2.2.3. Auxiliary Data
The Digital Elevation Model (DEM) data used in this study is the Global Multi-resolution Terrain Elevation Data (GMTED) in 2010 with 200 m spatial resolution. We downloaded the data from the USGS and the NGA of the United States National Geological and Geographic Information Service (https://topotools.cr.usgs.gov/gmted_viewer/viewer.htm, accessed on 15 May 2021).
We also used the Köppen climate zones, the most widely used climate classification. It divides the world continent into five major climate zones (A, B, C, D, and E) based on vegetation distribution considering seasonal variations in monthly and annual temperature and rainfall in each zone (Table 2 and Figure 1c) [40]. Since the number of matchable point pairs at polar zone sites is small and discontinuous, AERONET sites in four different climatic zones (i.e., A, B, C, and D) were selected for this study to evaluate the accuracy of MAIAC AOD values in different climatic zones. The distribution of climate zones is shown in Figure 1c.
2.3. Evaluation Methods
AERONET provides repeated measurements at a fixed point, while the satellite provides measurements in a certain area at regular intervals. In order to match AERONET AOD and MAIAC AOD in space and time, the spatial average of MODIS AOD data within 25 km × 25 km centered at AERONET site and the temporal average of AERONET ground-based data before and after 30 min of satellite transit were selected in this study [24].
The study explored the correlation between MAIAC AOD products and AERONET AOD data by conducting multiple statistical analyses. We assessed the quality of MAIAC AOD products using the expected error (EE), which was calculated as EE = ±(0.05 + 0.15 × AOD). The accuracy of MAIAC AOD products is verified quantitatively using four other metrics: Pearson correlation coefficient (R), relative mean deviation (RMB), mean absolute error (MAE), and root mean square error (RMSE) [41].
- (1)
- Pearson correlation coefficient (R)
R is used to measure the degree of linear correlation between the inverse and true value, and a larger value of |R| indicates a higher correlation and more accurate inversion results. The calculation of R is shown in Equation (3).
- (2)
- Relative Mean Deviation (RMB)
RMB is used to evaluate the degree of deviation between the inverse value and the true value, and the closer RMB is to 1, the smaller the deviation is and the more accurate the inverse result is. The RMB is calculated as Equation (4).
- (3)
- Mean Absolute Error (MAE)
MAE indicates the average value of the absolute error between the inversion value and the measured value (Equation (5)). It is used to measure the overall magnitude of the absolute error of the inversion results; a smaller MAE indicates that the inversion results are more accurate.
- (4)
- Root Mean Square Error (RMSE)
RMSE represents the sample standard deviation of the difference (called residual) between the inverse and true value (Equation (6)). It is used to measure the deviation between the inverse and true value; a smaller RMSE indicates a more accurate inversion result.
A regression relationship was further established with AOD of AERONET as the independent variable and AOD of MCD19A2 as the dependent variable using a linear regression model (). The aerosol inversion expectation error (EE) was used to analyze the overall distribution between the inversion results and the true values (Equation (7)).
The value of k close to 1 indicates that the inversion value is more accurate, and the value of b close to 0 represents the deviation of the inversion value is smaller. The percentage of AOD inversion results within, above, and below the expected error EE is indicated by =, >, and <EE, respectively. The larger percentage of AOD = EE and the smaller percentage of AOD> or <EE indicate that the consistency of inversion results with the true value is better, and the inversion results are more accurate.
In Equations (3)–(7), x and y denote the AERONET true value and MCD19A2 inverse value, respectively. n denotes the number of validation groups. i is the selected validation point pair number. and denote the average of the observed and inverse values, respectively.
It is noteworthy that Pearson’s correlation coefficient is prone to be affected by isolated extreme data points, and as such, the linear regression may be of limited representativeness [29]. This study thus proposed an evaluation approach by combining R, RMB, MAE, and RMSE to determine the accuracy of the MAIAC AOD at all sites. This combination can intuitively show the difference in accuracy between sites in the study area (Table 3).
3. Results
Based on the statistical assessment methods, this study validated the accuracy of MAIAC AOD in different seasons, at different altitudes, and in different climate zones. The seasons were divided into spring (March to May), summer (June to August), autumn (September to November), and winter (December to February).
3.1. Overall Comparison between MAIAC and AERONET AOD at 550 nm
Figure 2 shows the correlation between MAIAC and AERONET AOD at 17 sites from 2011 to 2020. Both MAIAC’s Terra and Aqua products have a good correlation with AERONET site observations, with an R value larger than 0.85. RMB is 1.008 and 1.005, respectively, which are only 0.8% and 0.5% overestimated than AERONET AOD. This indicates that MAIAC AOD has better accuracy than many other AOD products [42]. In terms of MAE and RMSE, the inversion accuracy of the MAIAC product is relatively high, especially for the Terra product (RMSE = 0.137, MAE = 0.080). Around 71.53% of the data are within EE, which is slightly higher than that of Aqua (69.83%). The overall Bias was only 0.002 and 0.001 for Terra and Aqua. In summary, MAIAC AOD products demonstrate a high degree of accuracy and applicability in the eastern region of Asia.
As shown in Figure 3a–j, the inversion accuracy of Terra and Aqua products are different, but both MAIAC AOD products are highly correlated with AERONET AOD and have good inversion accuracy overall. Both Terra and Aqua AOD products have more than 58% of sites with R greater than 0.8, more than 76% of sites with MAE less than 0.1, more than half of sites with RMB between 0.9 and 1.1, and more than 64% of sites with RMSE less than 0.15. In general, the percentages of sites with good matching accuracy performance for both products are more than 82%. It denotes that MAIAC AOD products have good applicability in the study area and can meet the accuracy requirements for most applications.
3.2. Comparison of MAIAC and AERONET AOD at 550 nm in Different Seasons
Figure 4a–h shows the quality of MAIAC AOD in East Asia for all seasons in the last decade. It is found that the number of matching points between MAIAC Terra and Aqua products and AERONET data is high in four seasons. The number of effective matching points is highest in spring, followed by winter, and lowest in summer. Nevertheless, both MAIAC AOD products and ground measurements show good agreement. The R value of MAIAC’s Terra product is above 0.9 in all four seasons, and the R value of the Aqua product is above 0.8 in all seasons. For MAIAC’s Terra products, the R-values for all seasons show winter = spring > summer > autumn (R: 0.922 = 0.922 > 0.905 > 0.903), while the R value for summer is almost the same compared to that for autumn, which is only 0.002 higher. Terra products have more than 70% of sites within the EE in four seasons, while the Aqua product has good accuracy in all seasons, except for the summer when the proportion of samples within the EE is below 66%. Overall, the inversion results of both products are reliable and usable, although the accuracy and consistency of the AOD between the Terra product and AERONET AOD are better than those of the Aqua product.
MAE and RMSE are lower in autumn and winter, indicating the inversion results are more accurate during these two seasons. In summer, MAE and RMSE are larger. RMB is larger than 1, the proportion of sample points within EE is smaller, and the proportion of overestimation reaches 26.82% and 34.54%, respectively. Bias is less than 0 in winter and spring and greater than 0 in summer and autumn. During four seasons, MAIAC retrievals have an absolute Bias lower than 0.05. Especially for Terra product, their quality is better in the autumn than in summer according to values of RMB, MAE, RMSE, Bias, and Within EE. Collectively, the accuracy of MAIAC AOD in all seasons is as follows: winter > spring > autumn > summer.
3.3. Comparison of MAIAC and AERONET 550 nm AOD at Different Elevations
To explore the inversion accuracy and availability of MAIAC AOD at different elevations in complex terrain in East Asia, we validated MAIAC Terra and Aqua AOD with AERONET AOD at different elevation intervals from 2011 to 2020 (Figure 5). As the elevation increases, the values of R and RMB of Terra and Aqua AOD products consistently show a trend of raising–decreasing–raising–decreasing, and the values of MAE and RMSE both show a trend of increasing first and then decreasing.
The R and RMB values of Terra and Aqua AOD products are close to 1 when the elevation is less than 2000 m. The R is especially high in the interval of 50–200 m and 200–500 m, and both are above 0.9. Terra AOD product has the least deviation in the interval of below 50 m and 200–500 m, and Aqua has the least deviation in the interval of below 50 m and 500–1000 m. MAE and RMSE values are between 0 and 0.1 at elevations greater than 500 m, indicating that the inversion results are more accurate at the elevations. When the elevation is greater than 2000 m, MAE and RMSE have better accuracy, while R and RMB show poor values. Overall, MAIAC AOD shows different accuracy at different elevations. MAIAC AOD is highly correlated with AERONET AOD at low and medium elevations and thus has the best inversion accuracy in these elevations.
3.4. Comparison of MAIAC and AERONET 550 nm AOD in Different Climate Zones
Figure 6 shows the validation results of the MAIAC AOD for different climatic zones. Among the four climate types, Terra and Aqua AOD products have the best EE percentages in the arid zone, 82.21% and 79.09%, respectively, and poorer EE percentages in the equatorial zone with 61.52% and 60.03%, respectively. The R values are above 0.864, with the best one occurring in the cold temperate zone with 0.947 and 0.935, respectively. RMB is close to 1, with small deviations, and the best values occur in the warm temperate zone with 1.02 and 1, respectively. MAE and RMSE are much closer to 0 in the arid zone and warm temperate zone, with a small deviation. Overall, the inversion accuracy of MAIAC AOD in the arid zone and the warm temperate zone is better than that in the equatorial zone and cold temperate zone.
3.5. Spatial Patterns of MAIAC AOD
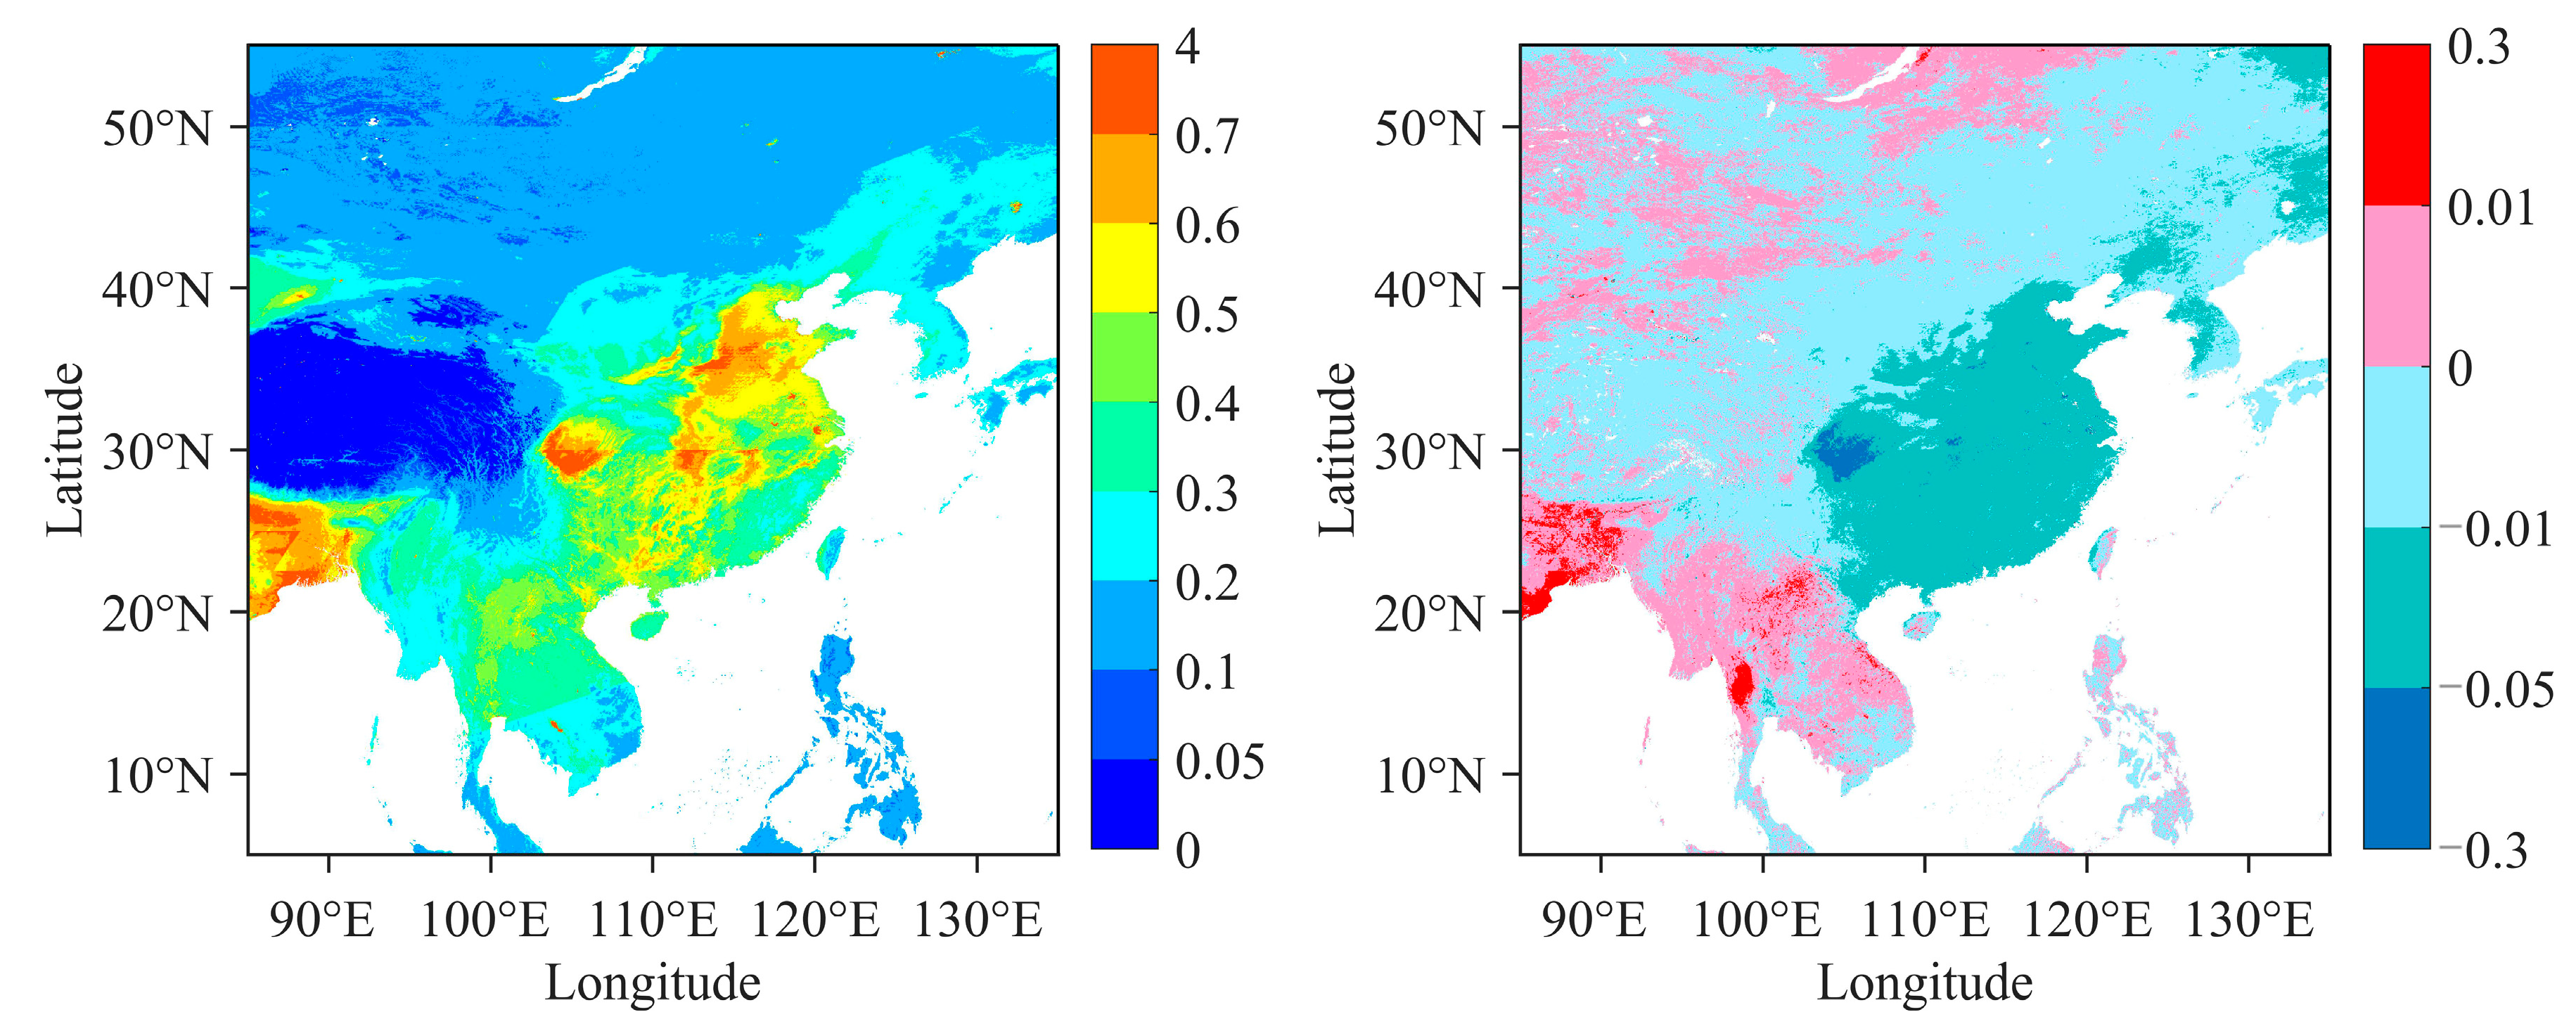
Figure 7 shows the spatial distribution and change rates of the average AOD values from 2011 to 2020. The results indicate that aerosols show significant regional differences in the distribution and trends in East Asia. High values of AOD are dominant in the Sichuan basin and eastern plains of China, as well as in India and Bangladesh. The relatively low AOD values are widely distributed in southwestern China and the areas north of 40°N. Most of the AOD in East Asia showed a significant negative trend. The improvement is most significant in central and eastern China. Southeast Asian regions such as India, Bangladesh, and Thailand show an increasing trend of AOD.
4. Discussion
The validation results in Figure 2 show that MAIAC AOD products demonstrate a high degree of accuracy and applicability in East Asia. What is worth mentioning is that the inversion accuracy of MAIAC’s Terra products is higher than that of the Aqua products. This may be due to the fact that the study area is located in the northern hemisphere, and Terra passes the equator from north to south and transits at 10:30 a.m. Considering the solar perspective, the satellite data acquired by Terra has a better spectral effect compared with Aqua, which makes the Terra product slightly better than Aqua in terms of inversion accuracy. Nevertheless, the points falling within the EE exceed 66% for both products, indicating both versions are reliable [43]. This is reinforced by Mhawish et al. [25], who confirmed that both terra and aqua of MAIAC provided good accuracy in South Asia, with Terra slightly outperforming Aqua.
To further examine the reliability of MAIAC AOD products, we compared and analyzed the accuracy at different sites. The results in Figure 3 indicate significant heterogeneity in MAIAC AOD inversion. In general, MAIAC AOD products perform well in Mongolia, Japan and Korea, northern China, and Southeast Asian countries such as Laos. Those regions are mostly covered by dark surfaces and dense vegetation that favor aerosol inversion. In contrast, the accuracy of MAIAC AOD inversion in southwest China, India, and the Philippines is relatively low. Southwest China is a plateau with thin air and glaciers all over, and India has many desert areas with bright surfaces. The sensitivity of top-of-atmosphere reflectivity (TOA) to aerosol changes under bright surfaces is low, resulting in high uncertainty in satellite monitoring [44]. The weather conditions in the Philippines, which are rainy and typhoon prone all year round, cause the uncertainty of satellite signals, resulting in slightly poor matching accuracy. On the contrary, the high cloudiness makes the aerosol inversion values easy to be overestimated due to the topography and airflow in the central as well as the eastern coastal regions of China.
The accuracy of MAIAC AOD varies in different seasons. Collectively, the accuracy of MAIAC AOD in all seasons is as follows: winter > spring > autumn > summer. RMB is slightly less than 1, and Bias is below 0 in spring and winter. This is mainly due to high winds, snow, and ice melting in that season, resulting in a very small portion of the satellite monitoring being underestimated. However, this is a great improvement compared with other data [45,46]. The percentage of points falling within the EE is low in both spring and summer, which may be because of the fact that more material burning and forest fires occur in that season, increasing the uncertainty of AOD fluctuations [47,48]. In addition, summer has the largest positive bias. This could be due to the cloudy and rainy summer season in East Asia. Among the eight different scenarios, the higher correlation R-values and lower error values in winter suggest that MAIAC AOD products perform better in winter. This is consistent with the results of previous studies [49]. With low temperatures, high winds, and low humidity in winter, the hygroscopic nature of aerosols has less impact on the accuracy of satellite monitoring.
The results shown in Figure 5 indicate that the retrieval performance of MAIAC AOD is closely related to altitude, in agreement with previous studies [49]. Both MAIAC’s Terra and Aqua products have the best correlation at low and medium elevations. However, the higher altitudes, mainly above 2000 m, the lower correlation R values. This reflects that MAIAC AOD has different advantages at different elevations. Moreover, due to the small number of matched point pairs in this interval, as well as sparse population, thin air, and low AOD values, there are some errors in the accuracy assessment at this elevation. Shi et al. [50] also found that complex surface features were able to produce a high AOD bias in the data.
Comparing the inversion accuracy of MAIAC Terra and Aqua products in different climate zones, we found that they shared similar characteristics. The arid and the warm temperate zones have the most percentages of AOD within EE, and the values of MAE and RMSE are closer to 0 with good accuracy. Lee et al. [51] found similar conclusions in their study. The clear weather makes the warm temperate zone better monitored, with RMB closest to 1 and the least bias. This is followed by the arid zone, where bright surfaces cause satellite monitoring to be prone to overestimation. The cold temperate zone has the best correlation, indicating that MAIAC AOD is still well-adapted in this region. This is possibly due to the relatively low temperature and humidity, which made the satellite monitoring less affected. With the above analyses, we conclude that MAIAC AOD has good applicability in East Asia.
Atmospheric aerosols are highly variable [52]. Together with Figure 1b, it is found that the AOD distribution is significantly influenced by topographic features. Because the plains of eastern and central China are economically developed, low-lying, and densely populated, those regions have large anthropogenic aerosol emissions. India and Bangladesh have high sources of aerosol precursor emissions due to industrial development, agricultural burning, large deserts, and dense population. In fact, India has become one of the most serious regions for aerosol pollution [53]. Mongolia and Russia have low AOD values due to their high latitude, alpine terrain, and sparse population under both small natural and anthropogenic influences. Qinghai Province and Tibet Autonomous Region are located in the Qinghai–Tibet Plateau with high altitude, low human activities, and thin atmosphere [54], thus the AOD values are extremely low. Most of the AOD in East Asia show a significant negative trend, indicating that aerosol pollution has reduced. In addition, the improvement is most significant in central and eastern China, due to high levels of original AOD, and measures of energy conservation and emission reduction [55]. Aerosol pollution has increased due to the large population base and economic development in Southeast Asian regions such as India, Bangladesh, and Thailand. It may also be influenced by coastal environments and extreme climates. It can be concluded that the variation characteristics of AOD in East Asia deserve an in-depth analysis, given its influencing factors and mechanisms varying across space and time. In the future study, we will comprehensively address this question.
5. Conclusions
(1) From the validation results of ground-based sites from 2011 to 2020, the overall accuracy of MAIAC AOD products showed high accuracy and applicability in East Asia. The inversion accuracy of Terra AOD was slightly better than that of Aqua. MAIAC and AERONET AOD were highly correlated and had good inversion accuracy overall, but MAIAC Terra and Aqua products had different inversions and showed significant heterogeneity among sites. Additionally, MAIAC AOD products performed well in areas with high vegetation cover and flat terrain, while the inversion accuracy was relatively low in areas with low vegetation cover and high terrain.
(2) MAIAC and AERONET AOD showed good agreement in different seasons. The accuracy of MAIAC AOD had the character of winter > spring > autumn > summer. The MAIAC Terra and Aqua products showed reliable inversion results and strong usability in general, although the accuracy and consistency of the AOD of the Terra product were better than that of the Aqua product.
(3) MAIAC AOD indicated different accuracy at different elevations. MAIAC and AERONET AOD were highly correlated and had the best inversion accuracy at low and medium elevations. The accuracy of MAIAC AOD was also influenced by different climate zones. The inversion accuracy of MAIAC AOD in the arid zone and the warm temperate zone was better than that in the equatorial zone and cold temperate zone.
(4) The patterns and trends of AOD in East Asia showed obvious regional differences. High AOD values were mainly distributed in the Sichuan basin and eastern plains of China as well as India and Bangladesh, while relatively low AOD values were distributed in southwestern China and the areas north of 40°N. Most AODs in East Asia showed a negative growth trend, with the most significant improvement in the central and eastern regions of China. India, Bangladesh, Thailand, and other Southeast Asian regions showed a positive growth trend in AOD; therefore, aerosol pollution has increased.
Author Contributions
Conceptualization, Q.T.; methodology, P.W. and Q.T.; software, P.W. and Q.T.; validation, P.W. and Q.T.; formal analysis, P.W.; investigation, P.W. and Q.T.; resources, P.W.; data curation, P.W. and Q.T.; writing—original draft preparation, P.W.; writing—review and editing, P.W., Q.T., Y.Z., K.Z., T.L., Q.Y. and Y.H.; visualization, P.W.; supervision, Q.T.; project administration, Q.T.; funding acquisition, T.L. and Q.Y. All authors have read and agreed to the published version of the manuscript.
Funding
This work was financially supported by the National Natural Science Foundation of China (31800367) and the Natural Foundation of Shandong province of China (ZR2021MD090).
Data Availability Statement
Datasets analyzed during the current study mainly include MCD19A2, Ground-based AOD, GMTED, and Köppen climate zones. The MCD19A2 dataset is available at the National Aeronautics and Space Administration (NASA) Goddard Space Flight Center (https://earthdata.nasa.gov/, accessed on 7 June 2021). Ground-based AOD is available in the AERONET established by NASA and PHOTONS (https://aeronet.gsfc.nasa.gov/, accessed on 20 June 2021). GMTED in 2010 is available in the USGS and the NGA of the United States National Geological and Geographic Information Service (https://topotools.cr.usgs.gov/gmted_viewer/viewer.htm, accessed on 15 May 2021). Köppen climate zones dataset can be obtained from National Earth System Science Data Center, National Science & Technology Infrastructure of China (http://www.geodata.cn, accessed on 23 May 2021).
Acknowledgments
We would like to thank the NASA Earth data website (https://search.earthdata.nasa.gov/search, accessed on 7 June 2021) for providing MODIS aerosol and auxiliary products and the NASA Goddard Space Flight Center (https://aeronet.gsfc.nasa, accessed on 20 June 2021) for providing AERONET ground measurements. We thank the (PI(s) and Co-I(s)) and their staff for establishing and maintaining the (#)sites used in this investigation. Acknowledgment for the data support from “National Earth System Science Data Center, National Science & Technology Infrastructure of China. (http://www.geodata.cn, accessed on 23 May 2021)”.
Conflicts of Interest
The authors declare no conflict of interest. The funders had no role in the design of the study; in the collection, analyses, or interpretation of data; in the writing of the manuscript, or in the decision to publish the results.
References
- Xie, Z.Y.; Liu, H.; Tang, X.M. Correlation analysis between MODIS aerosol optical depth and PM10 concentration over Beijing. Acta Sci. Circumst. 2015, 35, 3292–3299. [Google Scholar] [CrossRef]
- Luo, R.; Liu, Y.; Zhu, Q.; Tang, Y.; Shao, T. Effects of aerosols on cloud and precipitation in East-Asian drylands. Int. J. Climatol. 2021, 41, 4603–4618. [Google Scholar] [CrossRef]
- Kuniyal, J.C.; Guleria, R.P. The current state of aerosol-radiation interactions: A mini review. J. Aerosol Sci. 2019, 130, 45–54. [Google Scholar] [CrossRef]
- Pan, Y.-L.; Kalume, A.; Wang, C.; Santarpia, J. Atmospheric aging processes of bioaerosols under laboratory-controlled conditions: A review. J. Aerosol Sci. 2021, 155, 105767. [Google Scholar] [CrossRef]
- Devara, P.C.S.; Vijayakumar, K.; Safai, P.D. Multi-spectral nephelometer characterization of urban aerosols. Measurement 2020, 154, 107471. [Google Scholar] [CrossRef]
- Bzdek, B.R.; DePalma, J.W.; Johnston, M.V. Mechanisms of Atmospherically Relevant Cluster Growth. Acc. Chem. Res. 2017, 50, 1965–1975. [Google Scholar] [CrossRef] [PubMed]
- Su, H.; Cheng, Y.; Poschl, U. New Multiphase Chemical Processes Influencing Atmospheric Aerosols, Air Quality, and Climate in the Anthropocene. Acc. Chem. Res. 2020, 53, 2034–2043. [Google Scholar] [CrossRef]
- Bluvshtein, N.; Flores, J.M.; Segev, L.; Rudich, Y. A new approach for retrieving the UV–vis optical properties of ambient aerosols. Atmos. Meas. Tech. 2016, 9, 3477–3490. [Google Scholar] [CrossRef] [Green Version]
- Singh, T.; Khillare, P.S.; Shridhar, V.; Agarwal, T. Visibility impairing aerosols in the urban atmosphere of Delhi. Environ. Monit. Assess. 2008, 141, 67–77. [Google Scholar] [CrossRef]
- Wu, Z.; Chen, J.; Wang, Y.; Zhu, Y.; Liu, Y.; Yao, B.; Zhang, Y.; Hu, M. Interactions between water vapor and atmospheric aerosols have key roles in air quality and climate change. Natl. Sci. Rev. 2018, 5, 452–454. [Google Scholar] [CrossRef]
- Zhao, X.; Allen, R.J.; Thomson, E.S. An Implicit Air Quality Bias Due to the State of Pristine Aerosol. Earth’s Future 2021, 9, e2021EF001979. [Google Scholar] [CrossRef]
- Lelieveld, J.; Evans, J.S.; Fnais, M.; Giannadaki, D.; Pozzer, A. The contribution of outdoor air pollution sources to premature mortality on a global scale. Nature 2015, 525, 367–371. [Google Scholar] [CrossRef]
- Ouyang, R.; Yang, S.; Xu, L. Analysis and Risk Assessment of PM2.5-Bound PAHs in a Comparison of Indoor and Outdoor Environments in a Middle School: A Case Study in Beijing, China. Atmosphere 2020, 11, 904. [Google Scholar] [CrossRef]
- Wang, Y.; Yuan, Q.; Li, T.; Shen, H.; Zheng, L.; Zhang, L. Large-scale MODIS AOD products recovery: Spatial-temporal hybrid fusion considering aerosol variation mitigation. ISPRS J. Photogramm. Remote Sens. 2019, 157, 1–12. [Google Scholar] [CrossRef]
- Pan, X.; Uno, I.; Hara, Y.; Osada, K.; Yamamoto, S.; Wang, Z.; Sugimoto, N.; Kobayashi, H.; Wang, Z. Polarization properties of aerosol particles over western Japan: Classification, seasonal variation, and implications for air quality. Atmos. Chem. Phys. 2016, 16, 9863–9873. [Google Scholar] [CrossRef] [Green Version]
- Stachlewska, I.; Zawadzka, O.; Engelmann, R. Effect of Heat Wave Conditions on Aerosol Optical Properties Derived from Satellite and Ground-Based Remote Sensing over Poland. Remote Sens. 2017, 9, 1199. [Google Scholar] [CrossRef] [Green Version]
- Levy, R.C.; Mattoo, S.; Sawyer, V.; Shi, Y.; Colarco, P.R.; Lyapustin, A.I.; Wang, Y.; Remer, L.A. Exploring systematic offsets between aerosol products from the two MODIS sensors. Atmos. Meas. Tech. 2018, 11, 4073–4092. [Google Scholar] [CrossRef] [PubMed] [Green Version]
- Bright, J.M.; Gueymard, C.A. Climate-specific and global validation of MODIS Aqua and Terra aerosol optical depth at 452 AERONET stations. Sol. Energy 2019, 183, 594–605. [Google Scholar] [CrossRef]
- Korras-Carraca, M.B.; Hatzianastassiou, N.; Matsoukas, C.; Gkikas, A.; Papadimas, C.D. The regime of aerosol asymmetry parameter over Europe, the Mediterranean and the Middle East based on MODIS satellite data: Evaluation against surface AERONET measurements. Atmos. Chem. Phys. 2015, 15, 13113–13132. [Google Scholar] [CrossRef] [Green Version]
- Che, H.; Yang, L.; Liu, C.; Xia, X.; Wang, Y.; Wang, H.; Wang, H.; Lu, X.; Zhang, X. Long-term validation of MODIS C6 and C6.1 Dark Target aerosol products over China using CARSNET and AERONET. Chemosphere 2019, 236, 124268. [Google Scholar] [CrossRef] [PubMed]
- Aldabash, M.; Bektas Balcik, F.; Glantz, P. Validation of MODIS C6.1 and MERRA-2 AOD Using AERONET Observations: A Comparative Study over Turkey. Atmosphere 2020, 11, 905. [Google Scholar] [CrossRef]
- Anoruo, C.M. Monsoon-seasonal validation of MODIS aerosol optical depth and characterization using AERONET observation retrieve over Italy. Environ. Res. 2022, 204, 111985. [Google Scholar] [CrossRef] [PubMed]
- Lyapustin, A.; Wang, Y.; Korkin, S.; Huang, D. MODIS Collection 6 MAIAC algorithm. Atmos. Meas. Tech. 2018, 11, 5741–5765. [Google Scholar] [CrossRef] [Green Version]
- Martins, V.S.; Lyapustin, A.; de Carvalho, L.A.; Barbosa, C.C.F.; Novo, E.M.L.D.M. Validation of high-resolution MAIAC aerosol product over South America. J. Geophys. Res. Atmos. 2017, 122, 7537–7559. [Google Scholar] [CrossRef]
- Mhawish, A.; Banerjee, T.; Sorek-Hamer, M.; Lyapustin, A.; Broday, D.M.; Chatfield, R. Comparison and evaluation of MODIS Multi-angle Implementation of Atmospheric Correction (MAIAC) aerosol product over South Asia. Remote Sens. Environ. 2019, 224, 12–28. [Google Scholar] [CrossRef]
- Stafoggia, M.; Schwartz, J.; Badaloni, C.; Bellander, T.; Alessandrini, E.; Cattani, G.; De’ Donato, F.; Gaeta, A.; Leone, G.; Lyapustin, A.; et al. Estimation of daily PM10 concentrations in Italy (2006–2012) using finely resolved satellite data, land use variables and meteorology. Environ. Int. 2017, 99, 234–244. [Google Scholar] [CrossRef] [PubMed]
- Zhdanova, E.Y.; Chubarova, N.Y.; Lyapustin, A.I. Assessment of urban aerosol pollution over the Moscow megacity by the MAIAC aerosol product. Atmos. Meas. Tech. 2020, 13, 877–891. [Google Scholar] [CrossRef] [Green Version]
- Chen, X.; Ding, J.; Liu, J.; Wang, J.; Ge, X.; Wang, R.; Zuo, H. Validation and comparison of high-resolution MAIAC aerosol products over Central Asia. Atmos. Environ. 2021, 251, 118273. [Google Scholar] [CrossRef]
- Falah, S.; Mhawish, A.; Sorek-Hamer, M.; Lyapustin, A.I.; Kloog, I.; Banerjee, T.; Kizel, F.; Broday, D.M. Impact of environmental attributes on the uncertainty in MAIAC/MODIS AOD retrievals: A comparative analysis. Atmos. Environ. 2021, 262, 118659. [Google Scholar] [CrossRef]
- Wu, Z.; Zhao, H.; Hao, J.; Wu, G. Climatological Characteristics and Aerosol Loading Trends from 2001 to 2020 Based on MODIS MAIAC Data for Tianjin, North China Plain. Sustainability 2022, 14, 1072. [Google Scholar] [CrossRef]
- Jethva, H.; Torres, O.; Yoshida, Y. Accuracy assessment of MODIS land aerosol optical thickness algorithms using AERONET measurements over North America. Atmos. Meas. Tech. 2019, 12, 4291–4307. [Google Scholar] [CrossRef] [Green Version]
- Yang, M.; Howell, S.G.; Zhuang, J.; Huebert, B.J. Attribution of aerosol light absorption to black carbon, brown carbon, and dust in China—Interpretations of atmospheric measurements during EAST-AIRE. Atmos. Chem. Phys. 2009, 9, 2035–2050. [Google Scholar] [CrossRef] [Green Version]
- Krishnan, R.; Ramanathan, V. Evidence of surface cooling from absorbing aerosols. Geophys. Res. Lett. 2002, 29, 54-1–54-4. [Google Scholar] [CrossRef] [Green Version]
- Li, C.; McLinden, C.; Fioletov, V.; Krotkov, N.; Carn, S.; Joiner, J.; Streets, D.; He, H.; Ren, X.; Li, Z.; et al. India Is Overtaking China as the World’s Largest Emitter of Anthropogenic Sulfur Dioxide. Sci. Rep. 2017, 7, 14304. [Google Scholar] [CrossRef] [PubMed] [Green Version]
- Myhre, G.; Aas, W.; Cherian, R.; Collins, W.; Faluvegi, G.; Flanner, M.; Forster, P.; Hodnebrog, Ø.; Klimont, Z.; Lund, M.T.; et al. Multi-model simulations of aerosol and ozone radiative forcing due to anthropogenic emission changes during the period 1990–2015. Atmos. Chem. Phys. 2017, 17, 2709–2720. [Google Scholar] [CrossRef] [Green Version]
- Kim, H.-S.; Chung, Y.-S.; Yoon, M.-B. An analysis on the impact of large-scale transports of dust pollution on air quality in East Asia as observed in central Korea in 2014. Air Qual. Atmos. Health 2015, 9, 83–93. [Google Scholar] [CrossRef]
- Cai, W.; Li, K.; Liao, H.; Wang, H.; Wu, L. Weather conditions conducive to Beijing severe haze more frequent under climate change. Nat. Clim. Chang. 2017, 7, 257–262. [Google Scholar] [CrossRef]
- Li, L.; Franklin, M.; Girguis, M.; Lurmann, F.; Wu, J.; Pavlovic, N.; Breton, C.; Gilliland, F.; Habre, R. Spatiotemporal imputation of MAIAC AOD using deep learning with downscaling. Remote Sens. Environ. 2020, 237, 111584. [Google Scholar] [CrossRef]
- Kloog, I.; Sorek-Hamer, M.; Lyapustin, A.; Coull, B.; Wang, Y.; Just, A.C.; Schwartz, J.; Broday, D.M. Estimating daily PM2.5 and PM10 across the complex geo-climate region of Israel using MAIAC satellite-based AOD data. Atmos. Environ. 2015, 122, 409–416. [Google Scholar] [CrossRef] [Green Version]
- Peel, M.C.; Finlayson, B.L.; McMahon, T.A. Updated world map of the Köppen-Geiger climate classification. Hydrol. Earth Syst. Sci. 2007, 11, 1633–1644. [Google Scholar] [CrossRef]
- Wang, H.T.; Wang, Y.; Yuan, Q.Q. Validation and Spatiotemporal Analysis of MODIS Multi-angle Atmospheric Calibration Aerosol Products in China from 2008 to 2016. Remote Sens. Technol. Appl. 2021, 36, 217–228. [Google Scholar] [CrossRef]
- Bibi, H.; Alam, K.; Chishtie, F.; Bibi, S.; Shahid, I.; Blaschke, T. Intercomparison of MODIS, MISR, OMI, and CALIPSO aerosol optical depth retrievals for four locations on the Indo-Gangetic plains and validation against AERONET data. Atmos. Environ. 2015, 111, 113–126. [Google Scholar] [CrossRef]
- Levy, R.C.; Remer, L.A.; Kleidman, R.G.; Mattoo, S.; Ichoku, C.; Kahn, R.; Eck, T.F. Global evaluation of the Collection 5 MODIS dark-target aerosol products over land. Atmos. Chem. Phys. 2010, 10, 10399–10420. [Google Scholar] [CrossRef] [Green Version]
- Qin, W.; Fang, H.; Wang, L.; Wei, J.; Zhang, M.; Su, X.; Bilal, M.; Liang, X. MODIS high-resolution MAIAC aerosol product: Global validation and analysis. Atmos. Environ. 2021, 264, 118684. [Google Scholar] [CrossRef]
- Tan, Y.; Wang, Q.; Zhang, Z. Assessing spatiotemporal variations of AOD in Japan based on Himawari-8 L3 V31 aerosol products: Validations and applications. Atmos. Pollut. Res. 2022, 13, 101439. [Google Scholar] [CrossRef]
- Boiyo, R.; Kumar, K.R.; Zhao, T. Statistical intercomparison and validation of multisensory aerosol optical depth retrievals over three AERONET sites in Kenya, East Africa. Atmos. Res. 2017, 197, 277–288. [Google Scholar] [CrossRef]
- Yu, H.; Yang, Y.; Wang, H.; Tan, Q.; Chin, M.; Levy, R.C.; Remer, L.A.; Smith, S.J.; Yuan, T.; Shi, Y. Interannual variability and trends of combustion aerosol and dust in major continental outflows revealed by MODIS retrievals and CAM5 simulations during 2003-2017. Atmos. Chem. Phys. 2020, 20, 139–161. [Google Scholar] [CrossRef] [Green Version]
- Galytska, E.; Danylevsky, V.; Hommel, R.; Burrows, J.P. Increased aerosol content in the atmosphere over Ukraine during summer 2010. Atmos. Meas. Tech. 2018, 11, 2101–2118. [Google Scholar] [CrossRef] [Green Version]
- Chen, Q.-X.; Han, X.-L.; Gu, Y.; Yuan, Y.; Jiang, J.H.; Yang, X.-B.; Liou, K.-N.; Tan, H.-P. Evaluation of MODIS, MISR, and VIIRS daily level-3 aerosol optical depth products over land. Atmos. Res. 2022, 265, 105810. [Google Scholar] [CrossRef]
- Shi, Y.; Zhang, J.; Reid, J.S.; Hyer, E.J.; Eck, T.F.; Holben, B.N.; Kahn, R.A. Where do we need additional in situ aerosol and sun photometer data?: A critical examination of spatial biases between MODIS and MISR aerosol products. Atmos. Meas. Tech. Discuss. 2011, 4, 4295–4323. [Google Scholar] [CrossRef]
- Lee, S.; Pinhas, A.; Alexei, L.; Yujie, W.; Alexandra, C.A. An example of aerosol pattern variability over bright surface using high resolution MODIS MAIAC: The eastern and western areas of the Dead Sea and environs. Atmos. Environ. 2017, 165, 359–369. [Google Scholar] [CrossRef]
- Wang, Y.; Guo, W.; Yan, S.M.; Li, Y. Analysis of spatio-temporal variation of aerosol optical depth and climatic effects in Shanxi Province Ecol. Environ. Sci. 2018, 27, 900–907. [Google Scholar] [CrossRef]
- David, L.M.; Ravishankara, A.R.; Kodros, J.K.; Venkataraman, C.; Sadavarte, P.; Pierce, J.R.; Chaliyakunnel, S.; Millet, D.B. Aerosol Optical Depth Over India. J. Geophys. Res. Atmos. 2018, 123, 3688–3703. [Google Scholar] [CrossRef]
- Fang, H.; Qin, W.; Wang, L.; Zhang, M.; Yang, X. Solar Brightening/Dimming over China’s Mainland: Effects of Atmospheric Aerosols, Anthropogenic Emissions, and Meteorological Conditions. Remote Sens. 2020, 13, 88. [Google Scholar] [CrossRef]
- Sun, Z.B.; Cheng, X.F.; Xia, X.S. Spatial-temporaldistribution and impact factors of aerosol optical depth over China. China Environ. Sci. 2021, 41, 4466–4475. [Google Scholar] [CrossRef]
Figure 1.
(a) Location of the study area in a global map; (b) Relevant topography and major countries within the study area (RUS KAZ MNG CHN PRK KOR JPN BTN BGD IND MMR LAO THA KHM VNM PHL MYS PLW); and (c) Distribution of climate types and AERONET sites within the study area (Af: Tropical rainforest climate Aw: Tropical open forest climate Am: Tropical monsoon climate BS: Steppe climate BW: Desert climate Cf: Normally humid and warm climate Cs: Dry summer and warm climate Cw: Dry and warm climate in winter Df: Normally humid and cold temperature climate Ds: Subarctic continental climate Dw: Sub-frigid monsoon climate EF: Tundra climate ET: Ice climate).
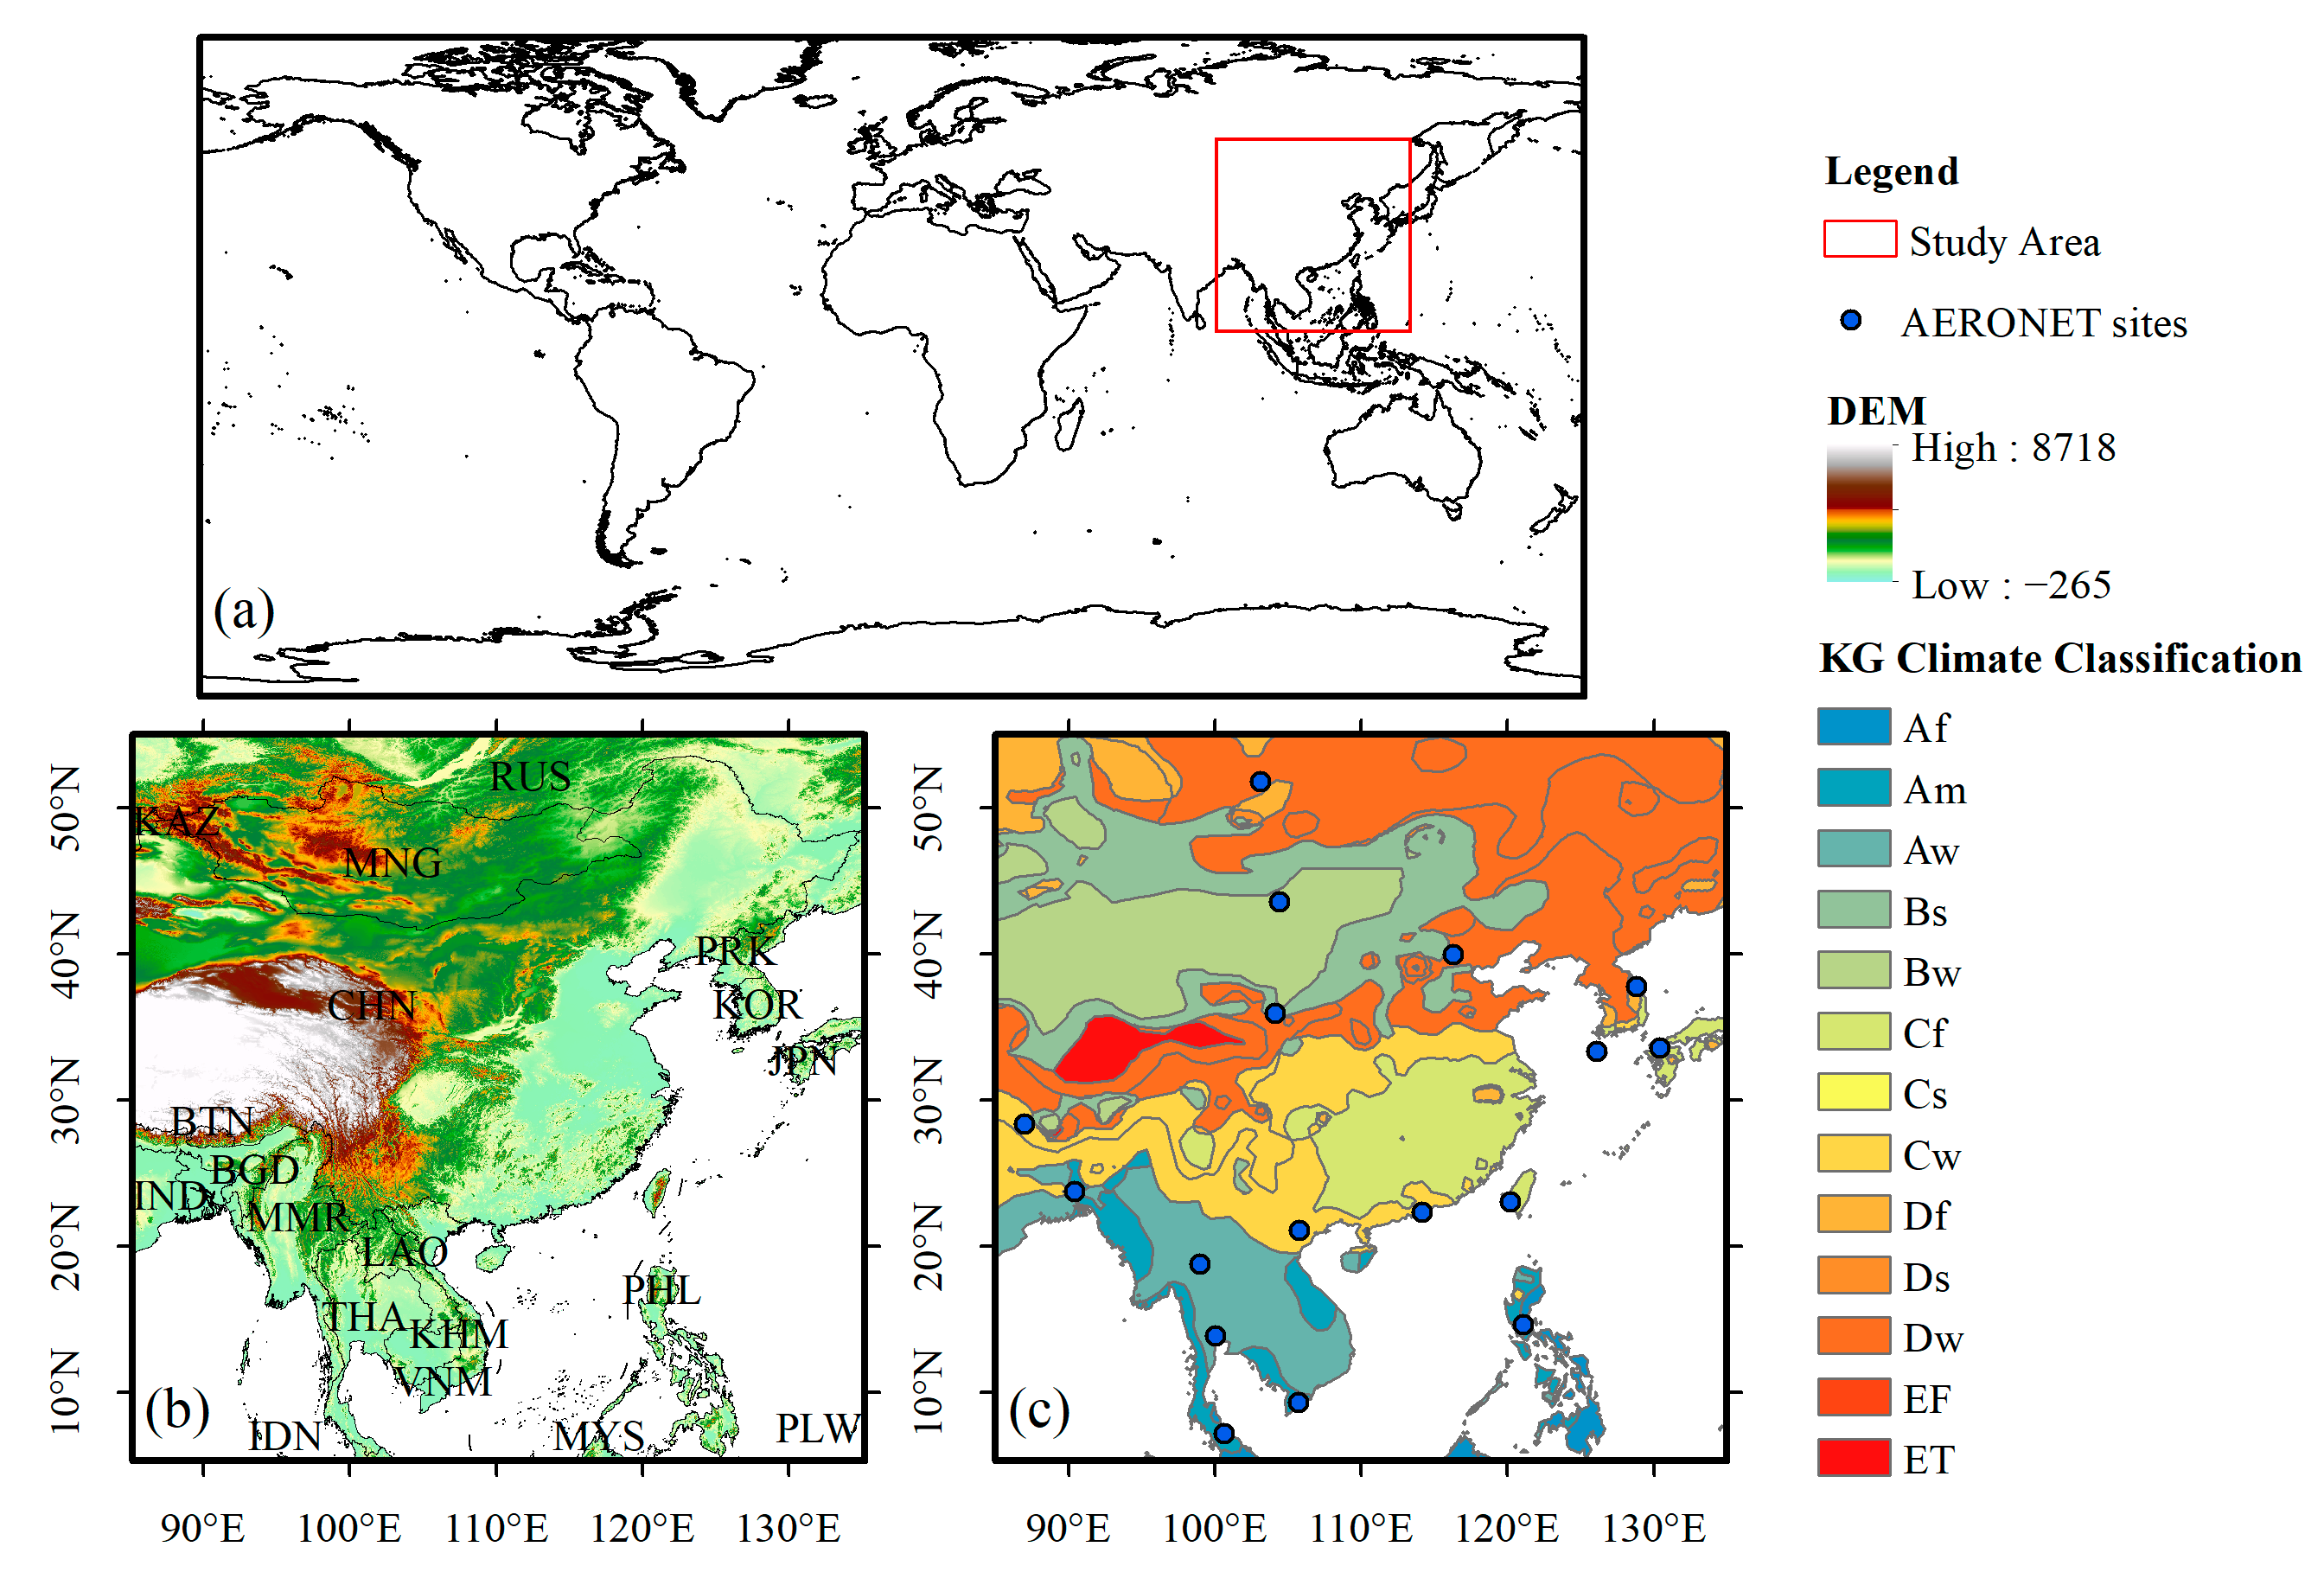
Figure 2.
Overall accuracy of MAIAC AOD. (a) MAIAC Terra vs. AERONET, (b) MAIAC Aqua vs. AERONET.
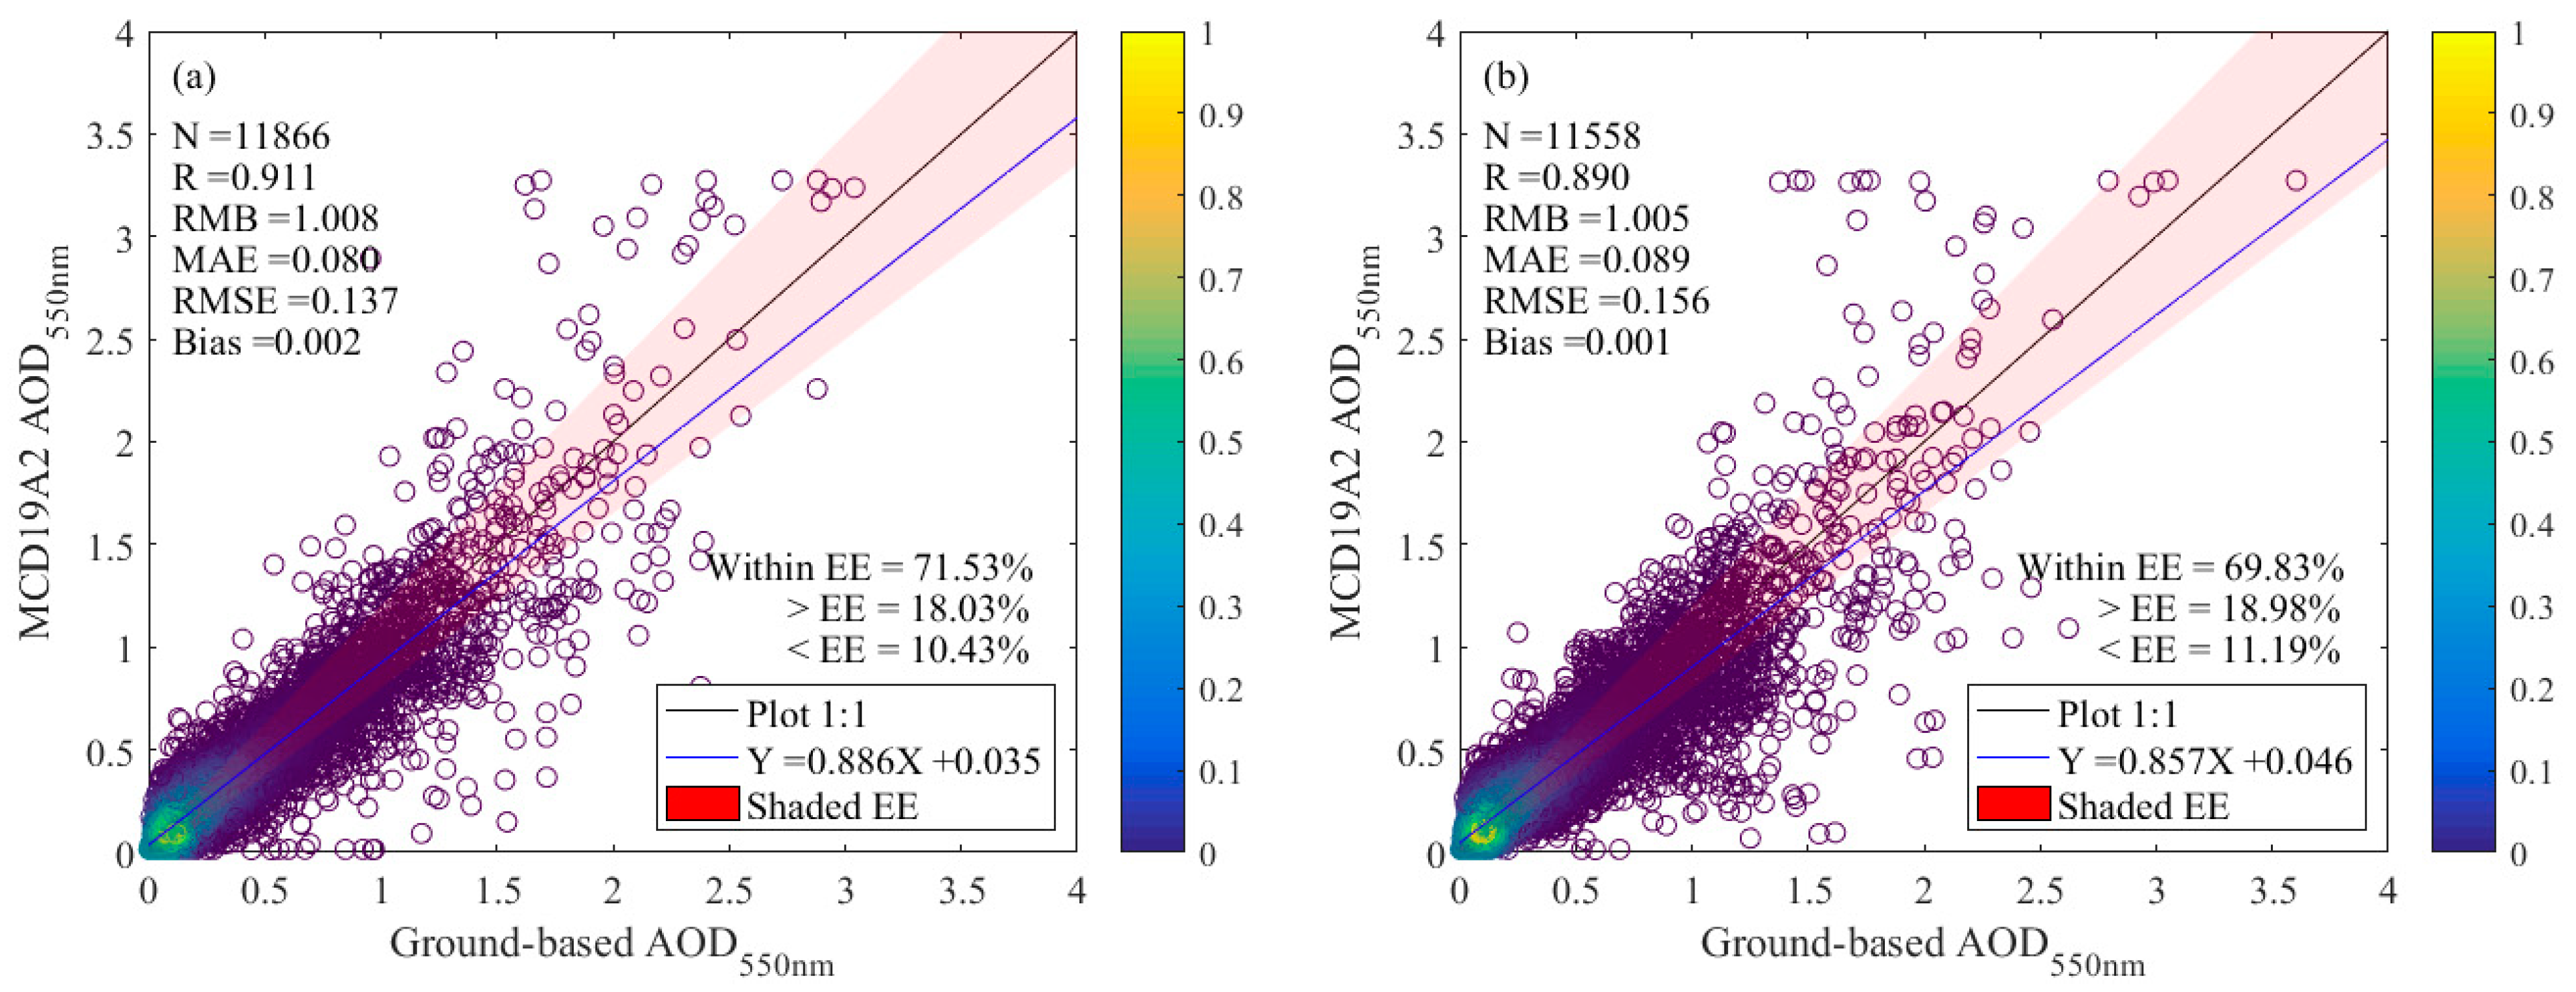
Figure 3.
Accuracy of AOD observations for MAIAC Terra (a–e) and Aqua (f–j) against AERONET measurements at each site. (a,f) R; (b,g) RMB; (c,h) MAE; (d,i) RMSE; (e,j) Matching accuracy.
Figure 3.
Accuracy of AOD observations for MAIAC Terra (a–e) and Aqua (f–j) against AERONET measurements at each site. (a,f) R; (b,g) RMB; (c,h) MAE; (d,i) RMSE; (e,j) Matching accuracy.
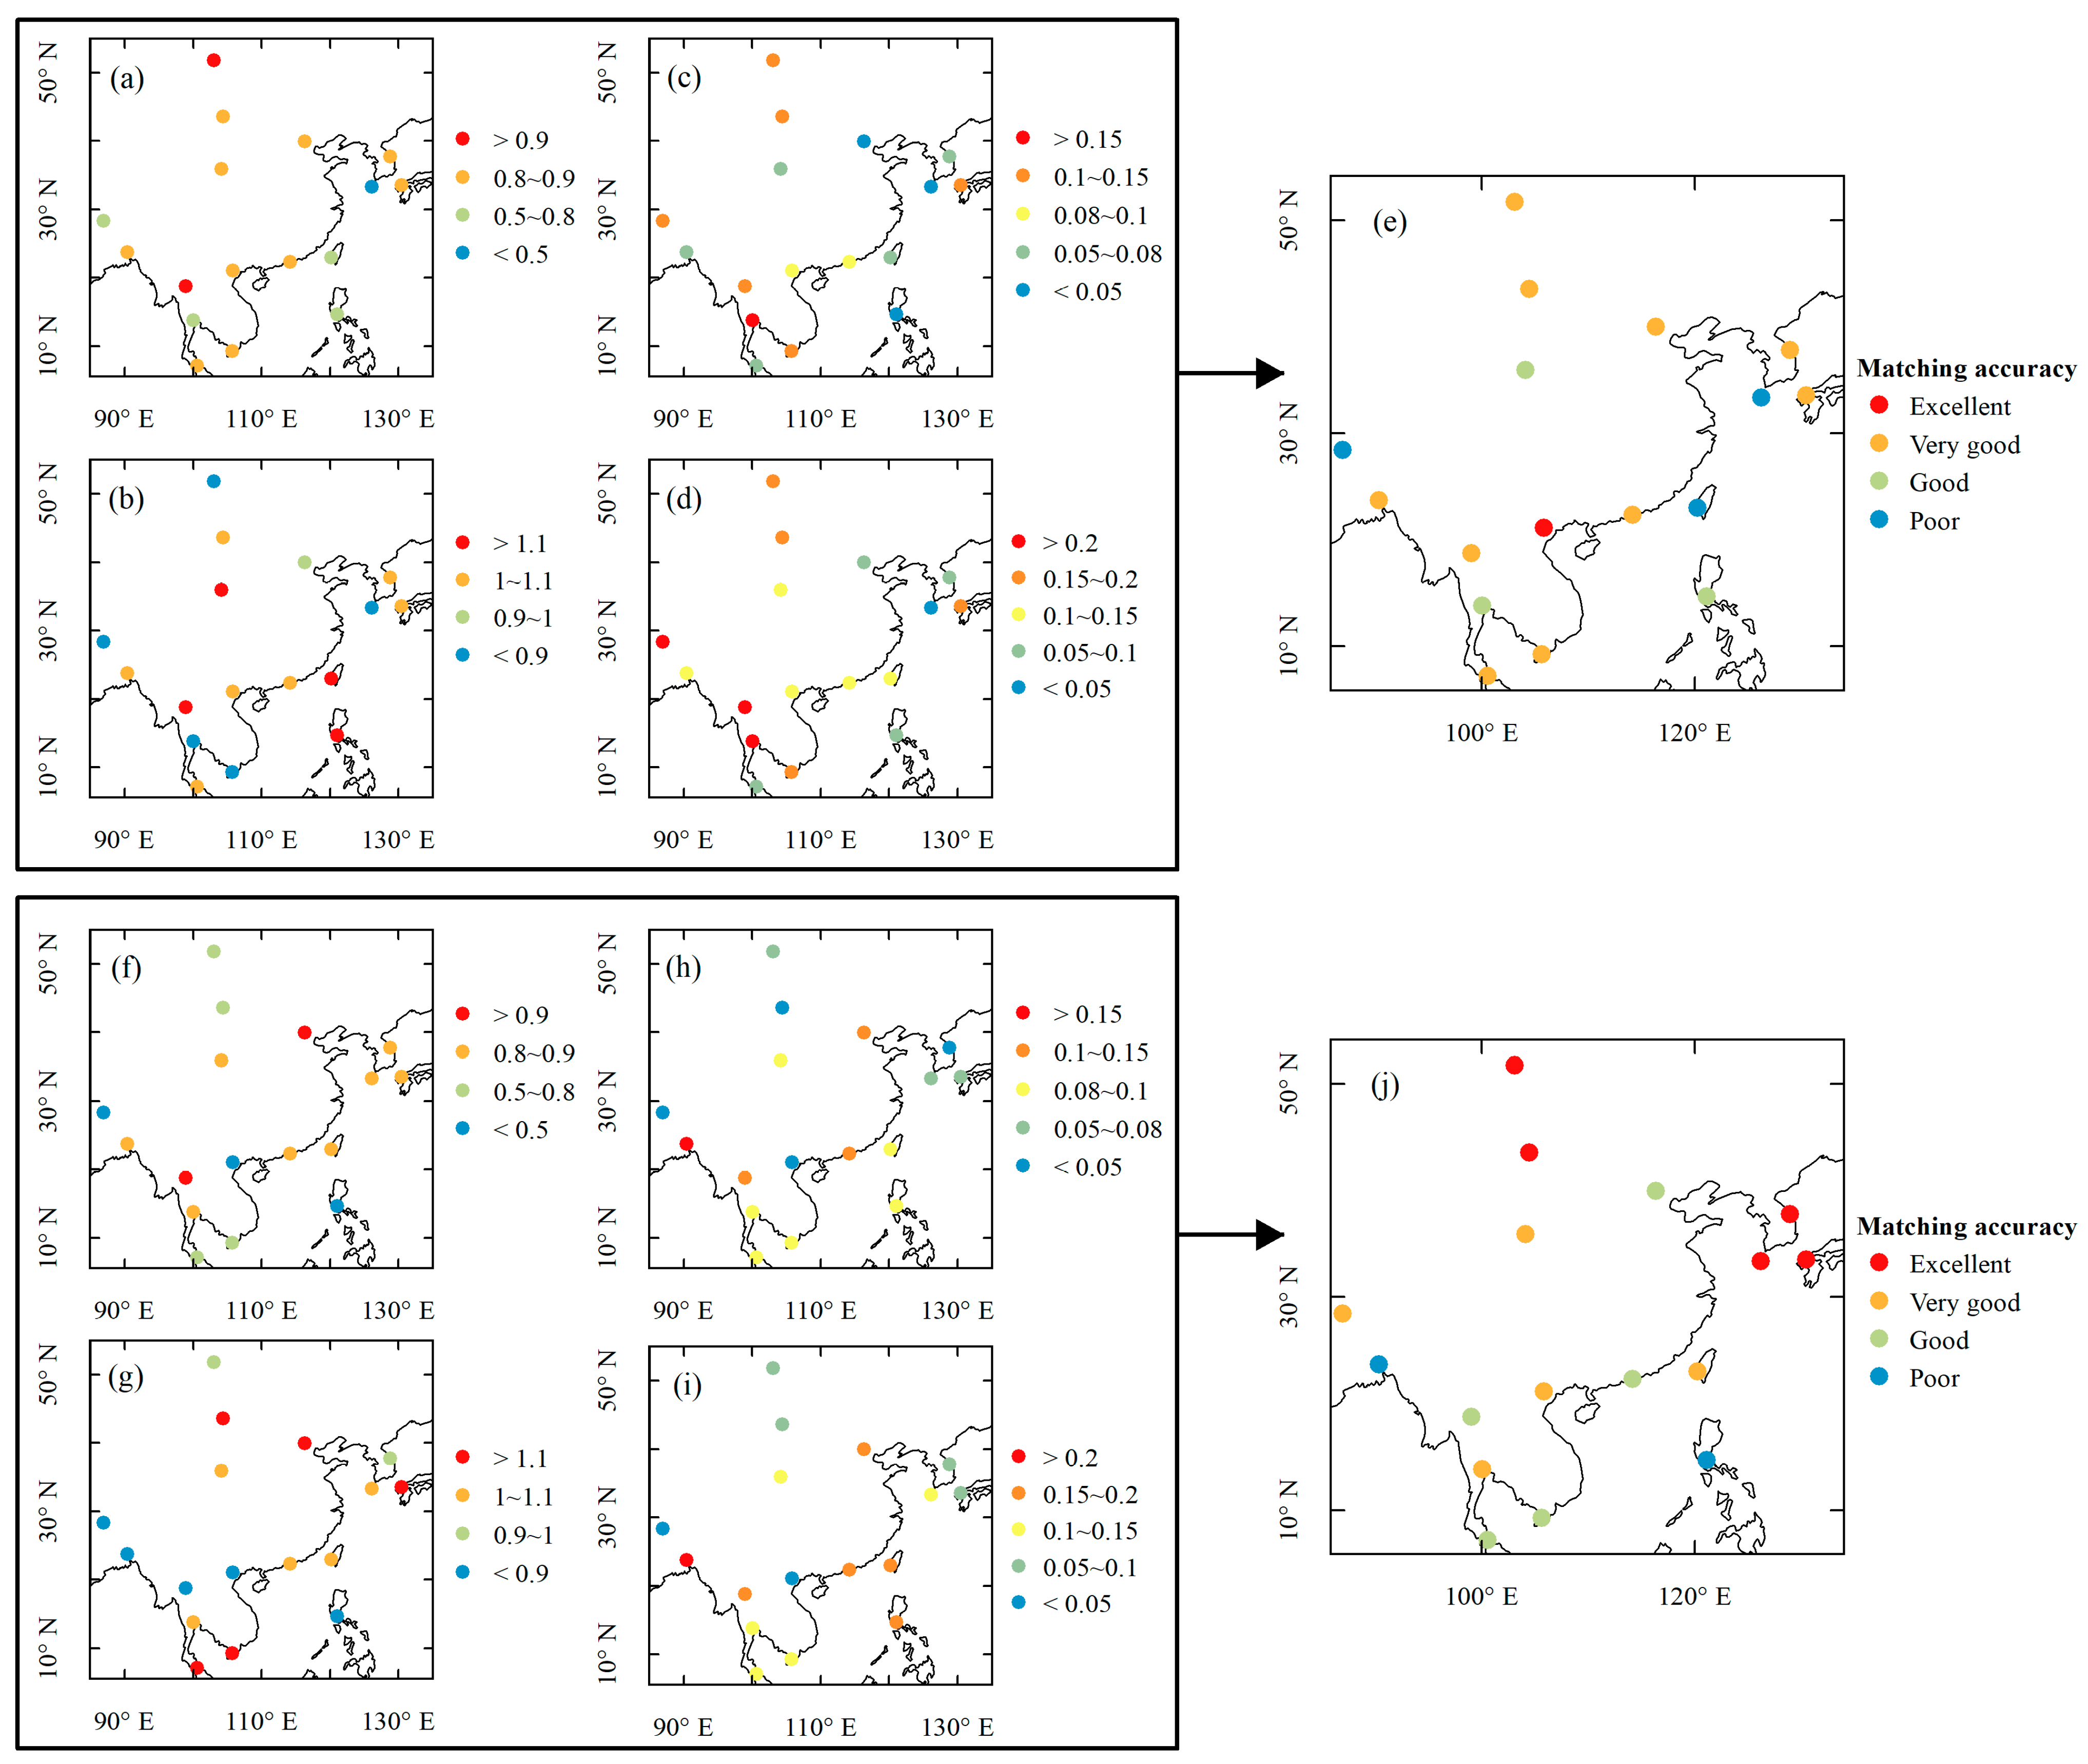
Figure 4.
Comparison of the accuracy of AOD observations for MAIAC Terra (a–d) and Aqua (e–h) against AERONET measurements in (a,e) spring; (b,f) summer; (c,g) autumn and (d,h) winter.
Figure 4.
Comparison of the accuracy of AOD observations for MAIAC Terra (a–d) and Aqua (e–h) against AERONET measurements in (a,e) spring; (b,f) summer; (c,g) autumn and (d,h) winter.

Figure 5.
Comparison of the accuracy of AOD observations for MAIAC Terra (a) and Aqua (b) against AERONET measurements at different elevations.
Figure 5.
Comparison of the accuracy of AOD observations for MAIAC Terra (a) and Aqua (b) against AERONET measurements at different elevations.
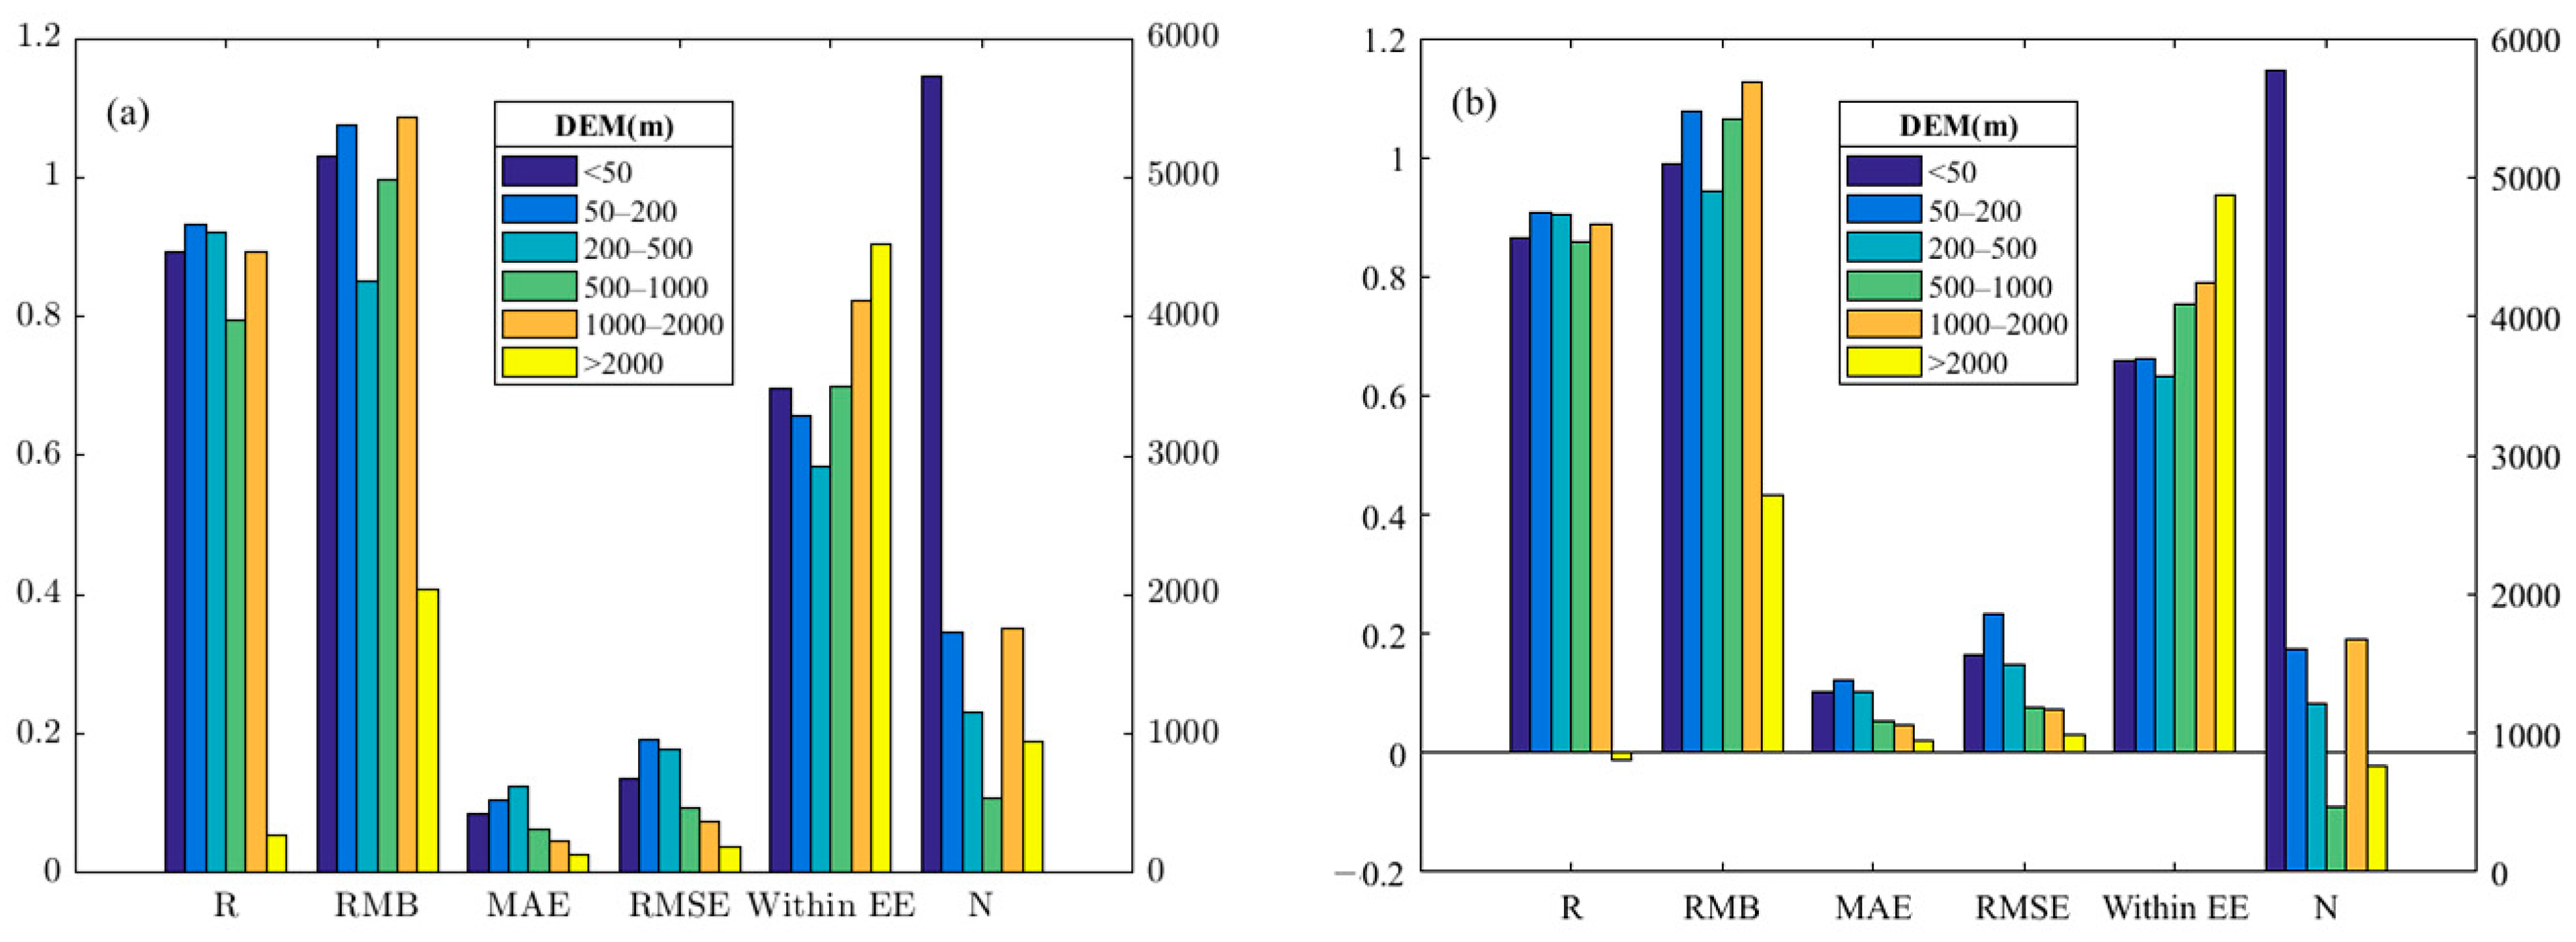
Figure 6.
Comparison of accuracy of AOD observations for MAIAC Terra (a) and Aqua (b) against AERONET measurements in different climate zones.
Figure 6.
Comparison of accuracy of AOD observations for MAIAC Terra (a) and Aqua (b) against AERONET measurements in different climate zones.
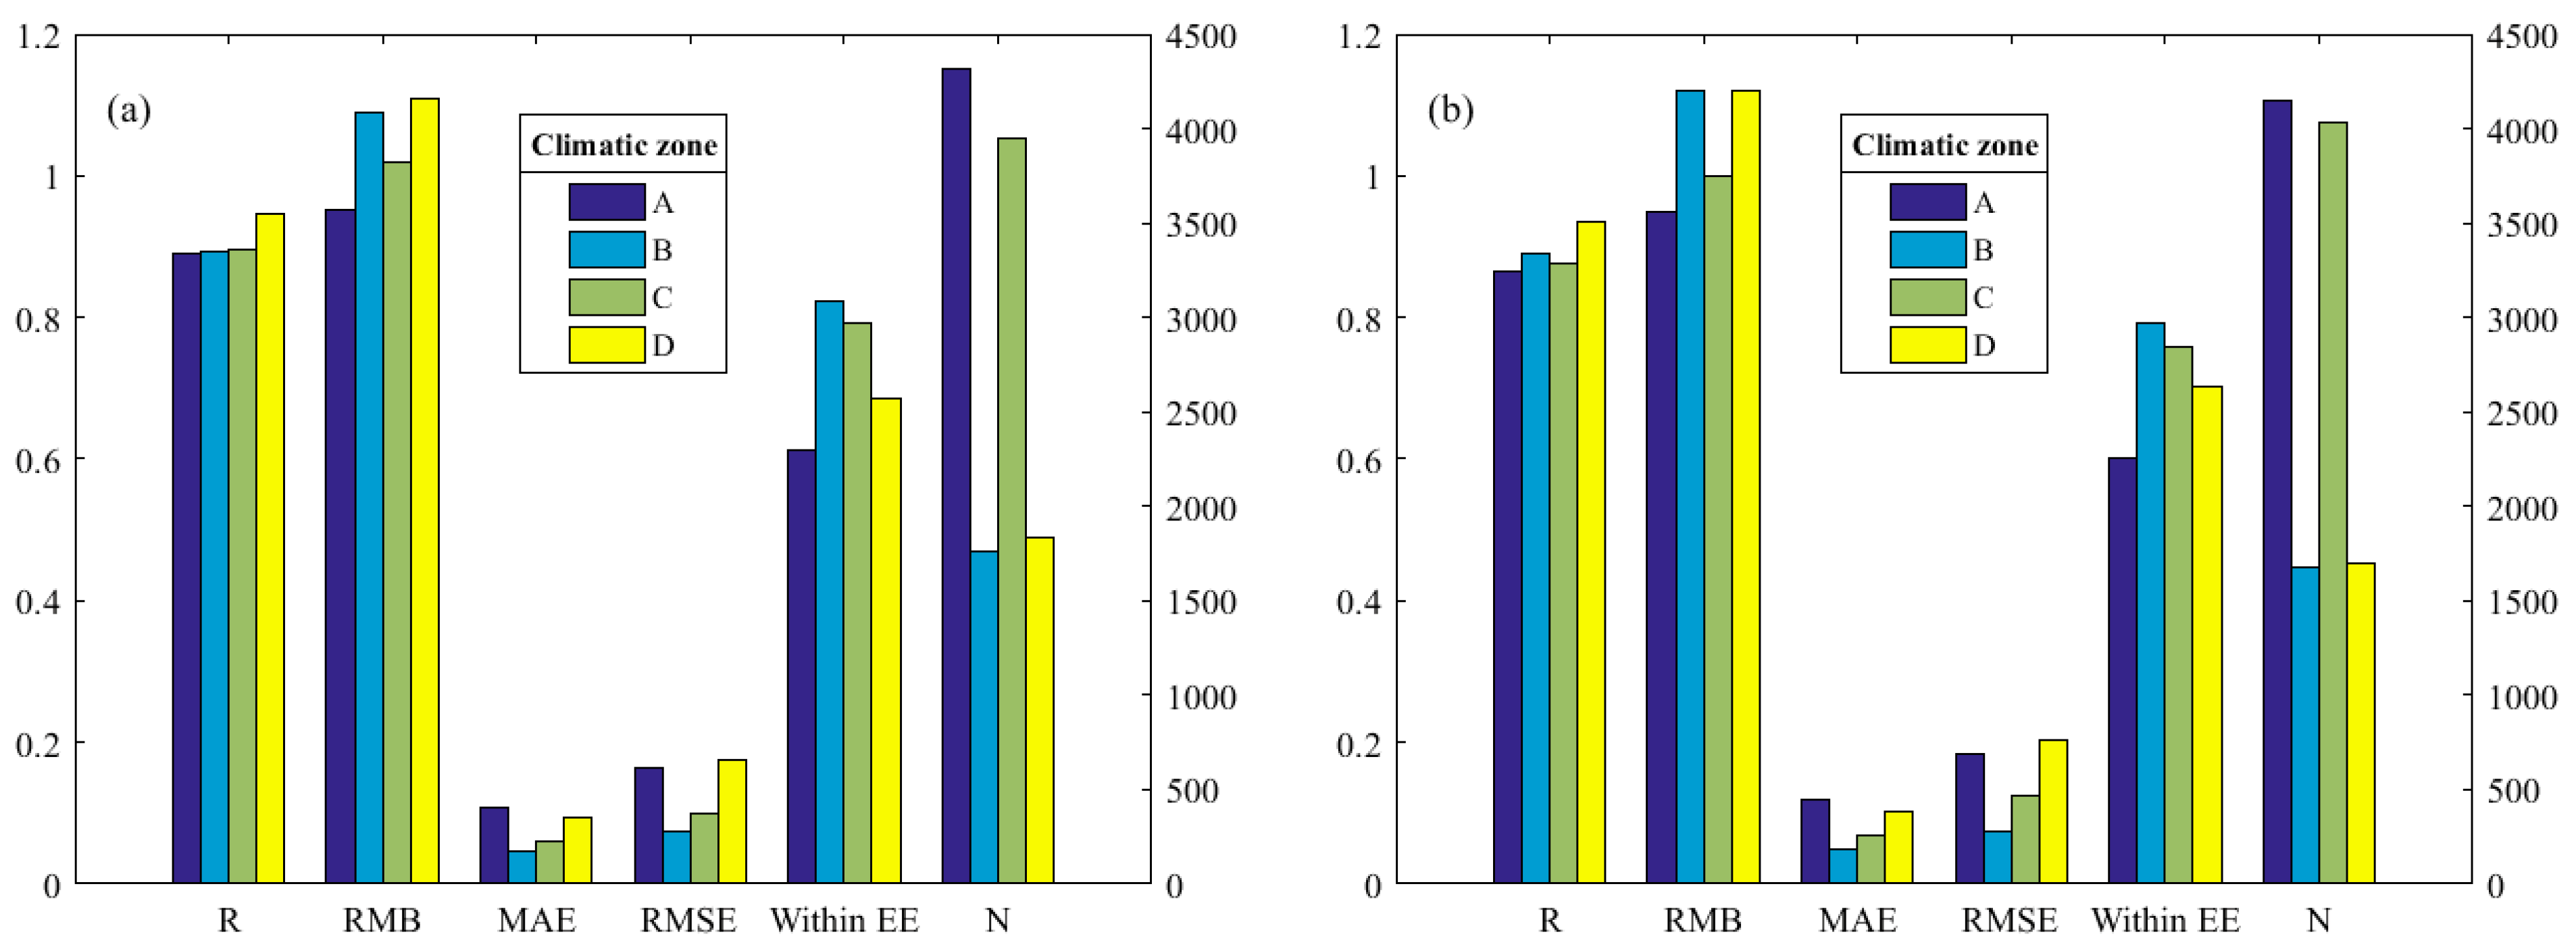
Figure 7.
Spatial distribution and change rate of MAIAC AOD from 2011 to 2020.

Table 1.
Information of AOD ground-based observation sites.
| Name of Station | Longitude (°E) | Latitude (°N) | Time Span | Elevation (m) |
|---|---|---|---|---|
| Bac_Lieu | 105.73 | 9.28 | 2011–2019 | <50 |
| Chen-Kung_Univ | 120.205 | 22.993 | 2011–2020 | |
| Dhaka_University | 90.398 | 23.728 | 2012–2020 | |
| Fukuoka | 130.475 | 33.524 | 2012–2020 | |
| Gangneung_WNU | 128.867 | 37.771 | 2012–2020 | |
| Gosan_SNU | 126.162 | 33.292 | 2011–2016 | |
| Hong_Kong_PolyU | 114.18 | 22.303 | 2011–2017 | |
| NGHIA_DO | 105.8 | 21.048 | 2011–2016, 2018–2019 | |
| Silpakorn_Univ | 100.041 | 13.819 | 2011–2020 | |
| Songkhla_Met_Sta | 100.605 | 7.184 | 2011–2020 | |
| Beijing-CAMS | 116.317 | 39.933 | 2012–2020 | 50–200 |
| Manila_Observatory | 121.078 | 14.635 | 2011–2020 | |
| Chiang_Mai_Met_Sta | 98.972 | 18.771 | 2011–2020 | 200–500 |
| Irkutsk | 103.087 | 51.8 | 2011–2020 | 500–1000 |
| Dalanzadgad | 104.419 | 43.577 | 2011–2020 | 1000–2000 |
| SACOL | 104.137 | 35.946 | 2011–2013 | |
| QOMS_CAS | 86.948 | 28.365 | 2011–2017 | >2000 |
Table 2.
Division and definition criteria of the Köppen climate zone *.
| Climatic Zone | Climatic Type | Climate Subtype | Characteristic |
|---|---|---|---|
| A: Equatorial zone | Tcold ≥ 18 | ||
| Af (Tropical rainforest climate) | Pdry ≥ 60 mm | ||
| Aw (Tropical open forest climate) | Pdry ≤ 60 mm and Pdry ≥ (100-MAP/25) mm | ||
| Am (Tropical monsoon climate) | Pdry ≤ 60 mm and Pdry ≤ (100-MAP/25) mm | ||
| B: Arid zone | MAP < 10 Pth | ||
| BS (Steppe climate) | MAP ≥ 5 Pth | ||
| BW (Desert climate) | MAP < 5 Pth | ||
| h k | MAT ≥ 18 °C MAT < 18 °C | ||
| C: Warm zone | Thot > 10 °C and 0 °C < Tcold < 18 °C | ||
| Cs (Dry summer and warm climate) | Psdry < 40 mm and Psdry < Pwwet/3 | ||
| Cw (Dry and warm climate in winter) | Pwdry < Pswet/10 | ||
| Cf (Normally humid and warm climate) | Neither Cw nor Cf | ||
| a b c | Thot ≥ 22 °C Thot < 22 °C and count (Tmon > 10 °C) ≥ 4 Tcold ≥ −38 °C and count (Tmon > 10 °C) < 4 | ||
| D: Cold temperate zone | Thot > 10 °C and Tcold ≤ 0 °C | ||
| Ds (Subarctic continental climate) | Psdry < 40 mm and Psdary < Pwwet/3 | ||
| Dw (Sub-frigid monsoon climate) | Pwdry < Pswet/10 | ||
| Df (Normally humid and cold temperature climate) | Neither Ds nor Dw | ||
| a b c d | Thot ≥ 22 °C Thot < 22 °C and count (Tmon > 10 °C) ≥ 4 Tcold ≥ −38 °C and count (Tmon > 10 °C) < 4 Tcold < −38 °C | ||
| E: Polar zone | Thot < 10 °C | ||
| ET (Tundra climate) | Thot > 0 °C | ||
| EF (Frost climate) | Thot ≤ 0 °C |
* Note: Tcold = the average temperature of the coldest month, Thot = the average temperature of the hottest month, Pdry = the driest monthly precipitation, Psdry = the driest monthly precipitation in summer (April to September), Pwdry = the driest monthly precipitation in winter (October to March), Pswet = the wettest monthly precipitation in summer, Pwwet = the wettest monthly precipitation in winter. MAP = the annual precipitation, MAT = the annual average temperature, Pth = if the regional summer precipitation is greater than or equal to 70% of MAP, then Pth = 2 × (MAT + 14) mm; if the regional winter precipitation is greater than or equal to 70% of the annual precipitation, then Pth = 2 × MAT mm; if it is less than the above proportion, then Pth = 2 × (MAT + 7) mm.
Table 3.
The division of evaluation indicators and accuracy, including R, RMB, MAE, RMSE, and Matching accuracy.
Table 3.
The division of evaluation indicators and accuracy, including R, RMB, MAE, RMSE, and Matching accuracy.
| R | RMB | MAE | RMSE | Reclassification |
|---|---|---|---|---|
| <0.5 | <0.8/>1.2 | >0.15 | >0.2 | 1 |
| 0.5–0.8 | 0.8–0.9/1.1–1.2 | 0.1–0.15 | 0.15–0.2 | 2 |
| 0.8–0.9 | 0.9–1.1 | 0.08–0.1 | 0.1–0.15 | 3 |
| >0.9 | 0.05–0.08 | 0.05–0.1 | 4 | |
| <0.05 | <0.05 | 5 | ||
| Summation of reclassification | Accuracy | |||
| >12 | Excellent | |||
| 9–12 | Very good | |||
| 7–9 | Good | |||
| <7 | Poor | |||
Publisher’s Note: MDPI stays neutral with regard to jurisdictional claims in published maps and institutional affiliations. |
© 2022 by the authors. Licensee MDPI, Basel, Switzerland. This article is an open access article distributed under the terms and conditions of the Creative Commons Attribution (CC BY) license (https://creativecommons.org/licenses/by/4.0/).
Share and Cite
MDPI and ACS Style
Wang, P.; Tang, Q.; Zhu, Y.; Zheng, K.; Liang, T.; Yu, Q.; He, Y. Validation and Analysis of MAIAC AOD Aerosol Products in East Asia from 2011 to 2020. Remote Sens. 2022, 14, 5735. https://doi.org/10.3390/rs14225735
AMA Style
Wang P, Tang Q, Zhu Y, Zheng K, Liang T, Yu Q, He Y. Validation and Analysis of MAIAC AOD Aerosol Products in East Asia from 2011 to 2020. Remote Sensing. 2022; 14(22):5735. https://doi.org/10.3390/rs14225735
Chicago/Turabian StyleWang, Ping, Qingxin Tang, Yuxin Zhu, Ke Zheng, Tianquan Liang, Quanzhou Yu, and Yaqian He. 2022. "Validation and Analysis of MAIAC AOD Aerosol Products in East Asia from 2011 to 2020" Remote Sensing 14, no. 22: 5735. https://doi.org/10.3390/rs14225735
Note that from the first issue of 2016, this journal uses article numbers instead of page numbers. See further details here.