Article

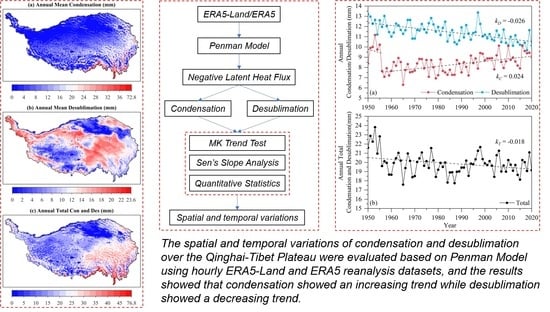
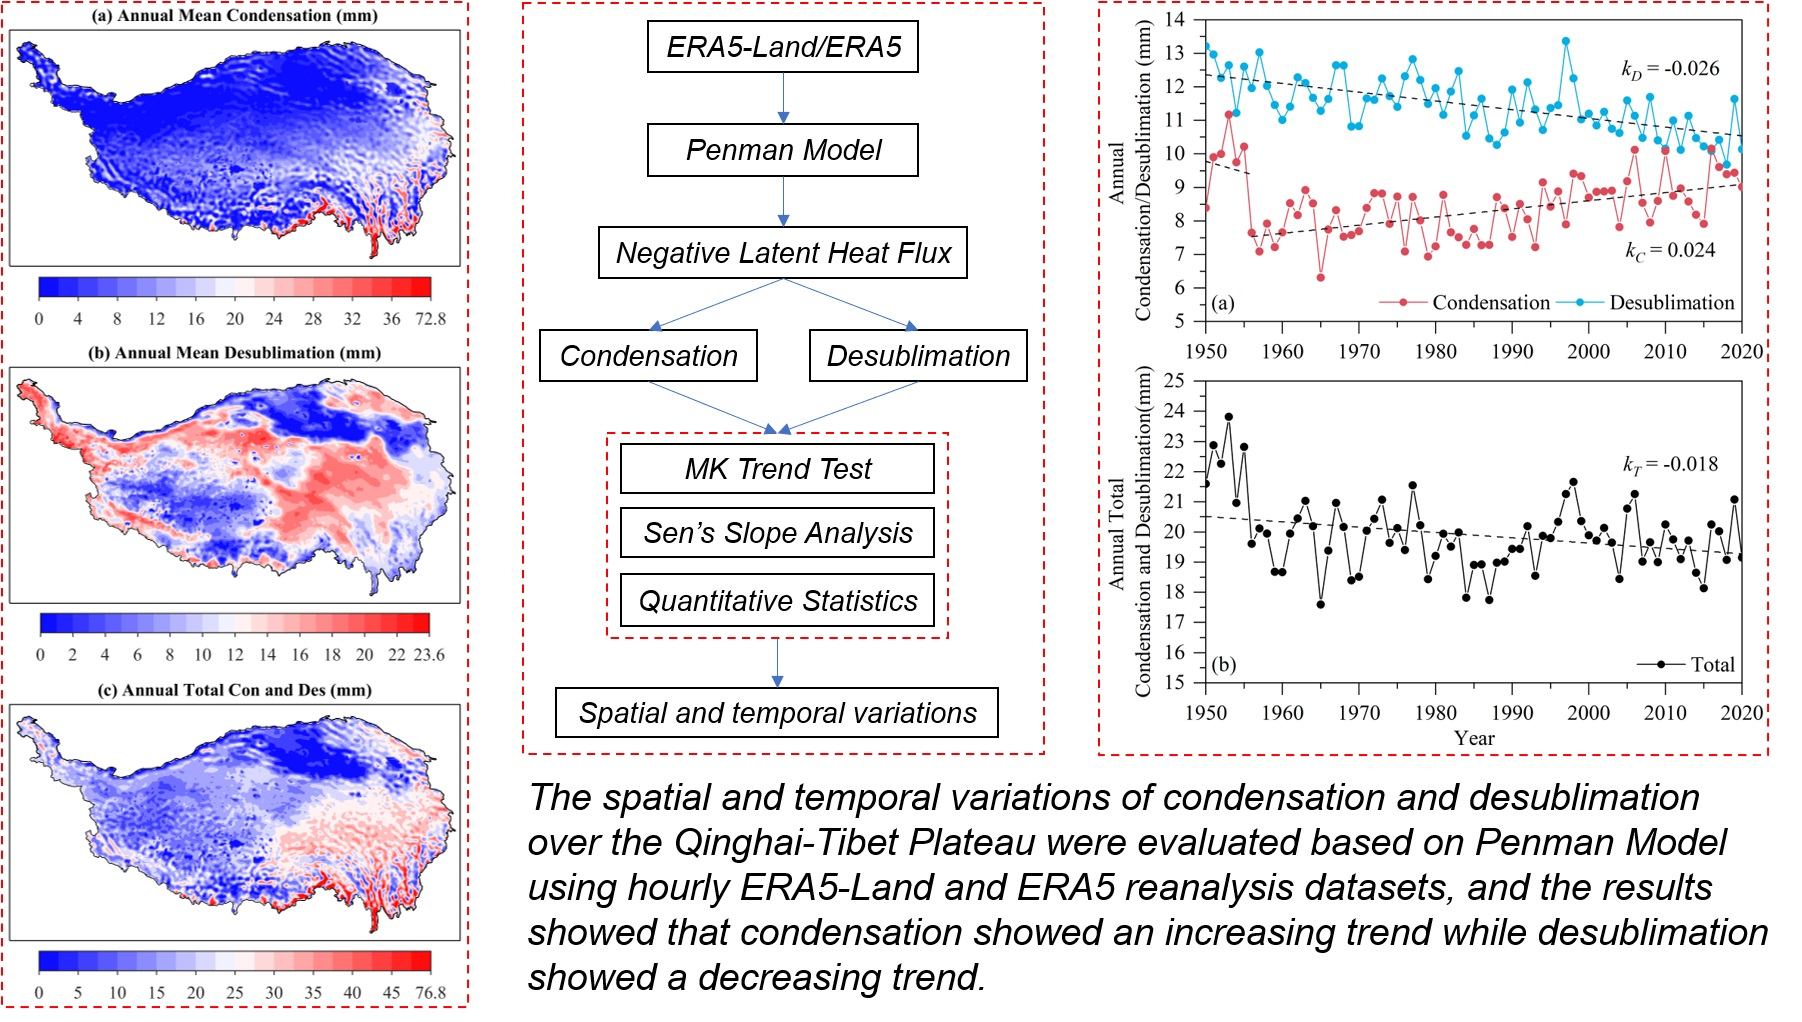
Evaluation of the Spatial and Temporal Variations of Condensation and Desublimation over the Qinghai–Tibet Plateau Based on Penman Model Using Hourly ERA5-Land and ERA5 Reanalysis Datasets

1
Qilian Alpine Ecology and Hydrology Research Station, Northwest Institute of Eco-Environment and Resources, Chinese Academy of Sciences, Lanzhou 730000, China
2
University of Chinese Academy of Sciences, Beijing 100049, China
3
College of Urban and Environmental Sciences, Northwest University, Xi’an 710000, China
*
Author to whom correspondence should be addressed.
Remote Sens. 2022, 14(22), 5815; https://doi.org/10.3390/rs14225815
Submission received: 30 August 2022 / Revised: 8 November 2022 / Accepted: 14 November 2022 / Published: 17 November 2022

Abstract

:
Condensation and desublimation are important processes of nocturnal land–atmosphere interactions, energy transfer, and the water cycle, and have important ecological and hydrological roles in mitigating physiological water deficits caused by low temperatures and reducing the risk of frost damage to plants, animals, and microorganisms near the surface in the Alpine Region. The aim of the present study is to evaluate the spatial and temporal variations of condensation and desublimation from 1950 to 2020 based on Penman model using hourly ERA5-Land and ERA5 reanalysis datasets on the Qinghai–Tibet Plateau (QTP), where condensation and desublimation occur frequently but lack quantitative evaluation. The results showed that: (1) Condensation showed a decreasing trend from southeast to northwest, with annual mean condensation ranging from 0 mm to 72.8 mm, while desublimation showed regional enrichment rather than zonal variation, with the annual mean desublimation ranging from 0 mm to 23.6 mm; (2) At 95% confidence level, condensation showed a significant increasing trend in the central and western QTP, while desublimation showed a significant decreasing trend in most regions of the QTP, and the decreasing trend of desublimation was more obvious than the increasing trend of condensation; (3) Both condensation and desublimation showed significant seasonal characteristics; the maximum monthly condensation was 2.37 mm and the monthly mean condensation was 0.70 mm, while the maximum monthly desublimation was 1.45 mm and the monthly mean desublimation was 0.95 mm; (4) The annual mean condensation was 8.45 mm, with an increasing trend of 0.24 mm/10a, the annual mean desublimation was 11.45 mm, with a decreasing trend of −0.26 mm/10a, and the total annual mean condensation and desublimation was 19.89 mm, with a weak decreasing trend on the QTP; (5) The increase in condensation is most associated with the increase in precipitation, while the decrease in desublimation is most associated with the increase in air temperature on the QTP.

Graphical Abstract

1. Introduction

Condensation and desublimation are both phase transition processes of gaseous water after radiation cooling, where condensation is the process of supersaturation of gaseous water to liquid water [1,2], while desublimation is the process of supersaturation of gaseous water to solid water directly [3]. The main difference between condensation and desublimation is whether the dew point temperature is above or below 0 °C when the gaseous water is supersaturated. That is, when the dew point temperature is equal to or greater than 0 °C, the supersaturation of gaseous water leads to condensation, while when the dew point temperature is below 0 °C, the supersaturation of gaseous water leads to desublimation [4]. Both condensation and desublimation are processes of water transfer from the air to the surface (downward water transfer), as opposed to evaporation and sublimation, which are processes of water transfer from the surface to the air (upward water transfer) [5]. Evaporation and sublimation occur mainly during the day and result in water loss near the surface, while condensation and desublimation occur mainly at night and result in water input near the surface [6,7]. Due to the large difference in the intensity of daytime and nighttime land–atmosphere interactions, results in condensation and desublimation are of a much smaller order of magnitude than evaporation and sublimation [5]. Therefore, condensation and desublimation are often neglected in the study of land–atmosphere interactions.
Although much smaller in order of magnitude than evaporation and sublimation, condensation and desublimation have specific ecological and hydrological roles. Condensation and desublimation are often specifically referred to as dew and hoarfrost, respectively, and are often considered to be important components of non-rainfall water inputs (NRWI) [8,9,10,11]. The ecological and hydrological roles of condensation and desublimation can usually be summarized in two aspects: on the one hand, condensation (dew) is an effective source of water for plants, animals, and microorganisms in arid and semi-arid regions and in other regions during the dry season, and is ecologically important for alleviating water stress and maintaining ecosystem functioning in these regions [4,11]. On the other hand, the release of large amounts of latent heat when condensation (dew) and desublimation (hoarfrost) occur can alleviate the temperature stress caused by low temperatures, and plays an ecological role in protecting plants, animals, and microorganisms from frost damage [4,12]. Therefore, the study of condensation and desublimation not only provides a clearer understanding of land–atmosphere interactions, energy transfer, and water cycles near the surface, but also contributes to the understanding of ecosystem functioning mechanisms.
The main limitations to the study of condensation and desublimation are not only their small magnitude, but also their difficulty of measurement [7,13,14]. For the measurement of condensation and desublimation, direct weighing of condensation and desublimation amounts is the more commonly used method [15,16,17], but this method is not suitable for long periods of time and large spatial scales. Due to condensation and desublimation both being phase transitions of gaseous water, which are accompanied by the release of latent heat, the observation or calculation of latent heat flux to estimate the condensation and desublimation iares the most effective indirect methods at present [4,13,18,19]. The common methods for estimating condensation and desublimation based on the observation or calculation of latent heat flux include the Eddy Covariance method [20,21], the Bowen Ratio Energy Balance method [7,18], the Aerodynamic method [22] and the Penman model [12,23,24]. Among these methods, the Penman model was chosen for the present study to calculate the latent heat flux because of its applicability and easy access to parameters. When the latent heat flux is negative, it indicates the occurrence of condensation or desublimation, while when the latent heat flux is positive, it indicates the occurrence of evaporation or sublimation.
Located in South-Central Asia, the QTP is the highest plateau in the world with its average altitude. The high altitude leads to a unique type of plateau climate on the QTP, characterized by strong radiation, low temperatures and greater diurnal temperature difference, which result in condensation and desublimation occurring more frequently [25]. However, the harsh environment and complex topography have led to the sparse meteorological stations, limiting the study of land–atmosphere interactions, such as condensation and desublimation on the QTP [26,27,28]. With the development of remote sensing and the data assimilation principle, the produced reanalysis datasets compensate for the scarcity of meteorological stations on the QTP, providing sufficient data support for large-scale, high-precision studies of land–atmosphere interactions, energy transfer and water cycle on the QTP [29]. In view of this, this study uses the ERA5-Land and ERA5 reanalysis datasets with high spatial and temporal resolution to conduct condensation and desublimation evaluation, which is useful for improving the understanding of land–atmosphere interactions, energy transfer, and water cycles on the QTP. Climate change and global warming are already indisputable facts nowadays, with the changes in temperature and precipitation having attracted widespread attention [30,31,32]. Climate change and global warming have caused changes in land surface processes such as evaporation and sublimation, however, the effects of climate change and global warming on condensation and desublimation processes are not yet known. The QTP is a sensitive area for climate change and global warming, and the effects of climate change and global warming on condensation and desublimation may be more significant, so it is necessary to quantitatively evaluate the variations of condensation and desublimation on the QTP under climate change.
In the present study, the spatial and temporal variations of condensation and desublimation on the QTP during 1950~2020 were evaluated based on the Penman model using the hourly meteorological variables from ERA5-Land and ERA5 reanalysis datasets. The main objectives of this study are (1) to evaluate the magnitude of condensation and desublimation, (2) to analyze the spatial variations of condensation and desublimation, (3) to quantify the temporal variations of condensation and desublimation, and (4) to discuss the impact of condensation and desublimation on alpine ecosystem on the QTP under climate change.

2. Materials and Methods

2.1. Study Area

Located in South-Central Asia, the QTP is the highest plateau in the world by average altitude, and has long been known as the Roof of the World. With an average altitude of over 4000 m, the QTP has developed an alpine climate characterized by strong radiation, low temperatures, and large temperature differences between day and night. The extremely cold climate has led to the widespread glaciers, snow cover, and permafrost on the QTP, which is the source of many rivers in Asia, so it is thus also known as the Water Tower of Asia [33].
The annual mean temperature of the QTP is approximately −2.5 °C and the annual mean precipitation is approximately 380 mm. Both temperature and precipitation show significant seasonal differences, with high temperature and high precipitation in summer and low temperature and low precipitation in winter. In addition, both temperature and precipitation have a decreasing trend from southeast to northwest, and the temperature has a clear tendency to decrease with increasing altitude, while precipitation has the characteristic of increasing with increasing altitude [34]. Due to the spatial pattern of temperature and precipitation, the vegetation cover also has a decreasing trend from southeast to northwest and decreasing with increasing altitude on the QTP [35].
Due to the complex topography and harsh climatic conditions, the meteorological stations are sparsely distributed within the QTP; therefore, the reanalysis datasets produced by the data assimilation principle based on models and observations, effectively complements the lack of data for land surface process studies, such as condensation, desublimation, evaporation, and sublimation.
The unique climatic characteristics lead to frequent water and heat exchange, especially influenced by climate warming in recent decades, which has accelerated the energy transfer and water cycle within the QTP, while the frequency and rate of condensation and desublimation, as well as evaporation and sublimation, are increasing. Therefore, it is important to evaluate the spatial and temporal variations of condensation and desublimation to improve the understanding of the variations in the land–atmosphere interactions, energy transfer, and water cycles on the QTP.

2.2. Datasets

2.2.1. ERA5-Land and ERA5 Reanalysis Datasets

Two reanalysis datasets, ERA5-Land and ERA5, were used as data input for this study. Among these, ERA5 is the fifth generation of the European Centre for Medium-range Weather Forecasts (ECMWF) reanalysis for the global climate and weather for the past 4 to 7 decades, which combines model data with observations from across the world into a globally complete and consistent dataset using data assimilation principle [36,37]. Compared to ERA5, ERA5-Land provides a consistent view of the evolution of land variables over several decades at an enhanced resolution [38,39,40]. ERA5 provides hourly estimates for a large number of atmospheric, ocean-wave, and land-surface quantities, while ERA5-Land has been produced by replaying the land component of the ERA5 climate reanalysis. Although no additional data assimilation was performed in ERA5-Land compared to ERA5, ERA5-Land produced at a higher resolution and forceed by ERA5 atmospheric parameters with lapse rate correction. Therefore, ERA5-Land has better applicability than ERA5 in the analysis of land surface processes [28]. According to the method of Penman model parameter calculation, eight variables from ERA5-Land and one variable from ERA5 were selected as meteorological variables needed for model parameter calculation in this study, and the details of all selected meteorological variables are listed in Table 1. In order to keep the spatial resolution uniform for all meteorological variables, the friction velocity from ERA5 was resampled to a spatial resolution of 0.1°. In addition, the total precipitation from ERA5-Land was used in order to assess the variations of precipitation on the QTP.

2.2.2. Observed Meteorological Variables

To verify the accuracy of the Penman model for estimating condensation and desublimation using nine meteorological variables as inputs from the ERA5-Land and ERA5 reanalysis datasets, the monthly and annual condensation and desublimation estimated by the Penman model were compared with those observed by the Eddy Covariance at nine flux stations on the QTP, respectively. The locations of the nine flux stations on the QTP are shown in Figure 1, and the basic information of each station is shown in Table 2. The meteorological variables observed by the nine flux stations used include temperature, relative humidity, and latent heat flux, which obtained from the datasets of a long-term dataset of integrated land-atmosphere interaction observations on the Tibetan Plateau (2005–2016) [41,42] and the datasets of Heihe integrated observatory network [43,44,45], at the National Tibetan Plateau Data Center.
For comparison, the latent heat flux observed by Eddy Covariance collected from the nine flux stations on the QTP was converted into condensation and desublimation as measured condensation and desublimation, based on the relationship between latent heat flux and moisture transport (Equation (5)). The reason why we choose the observed condensation and desublimation by Eddy Covariance as the measured condensation and desublimation is that the Eddy Covariance technique is currently recognized as a flux observation technique with a high degree of confidence [46]. The dew point temperature was used to distinguish between measured condensation and measured desublimation. When the dew point temperature is below 0 °C, the downward water transfer is condensation, while when the dew point temperature is greater than or equal to 0 °C, the downward water transfer is desublimation. The dew point temperature was calculated according to the method recommended by the FAO [47], which has the general form of:
T d = 116.91 + 237.3 ln ( e a ) 16.78 ln ( e a )
where ea is the actual water vapor pressure (kPa), which is calculated as follows:
e s = 0.6108 exp ( 17.27 T a 237.3 + T a )
e a = e s R H 100
where es is the saturation water vapor pressure (kPa), Ta is the air temperature (°C), and RH is the relative humidity (100%).

2.3. Methods

In the present study, the above-mentioned eight meteorological variables from the ERA5-Land reanalysis dataset and one meteorological variable from the ERA5 reanalysis dataset (Table 1) were used as inputs to calculate the latent heat flux based on the Penman model. According to the rules of the Penman model, when the latent heat flux is negative, it indicates the transport of moisture from the air to the surface, which represents the occurrence of condensation or desublimation.
The premise of calculating latent heat flux based on the Penman model is that the surface of ground or feature is in a sufficiently wet state; otherwise, both negative and positive latent heat flux represent potential latent heat flux, such as potential evaporation [48]. When the surface temperature is equal to or lower than the dew point temperature, the near-surface air reaches saturation and supersaturation, at which point the surface of the ground or feature can be considered to be in a wet state, satisfying the conditions for the applicability of the Penman model [4]. Therefore, the negative latent heat flux calculated based on the Penman model can represent the actual condensation and desublimation only when the surface temperature is equal to or lower than the dew point temperature. Where the negative latent heat flux represents the occurrence of condensation when the dew point temperature is greater than or equal to 0 °C, and the negative latent heat flux represents the occurrence of desublimation when the dew point temperature is lower than 0 °C.
Based on the results of condensation and desublimation calculated by the Penman model, the MK trend test and Sen’s slope analysis, as well as other common numerical statistical methods, were used to quantify the condensation and desublimation at different time scales, thus providing a more comprehensive understanding of the spatial and temporal variations of condensation and desublimation on the QTP during 1950~2020. The specific flow of this study is given by Figure 2.

2.3.1. Penman Model

The Penman model has a good physical basis with two parts, the thermal term on the left and the dynamic term on the right [48,49], with the form:
λ E = Δ ( R n G 0 ) Δ + γ + ρ a c p ( e s e a ) / r a Δ + γ
where λE (W m−2) is the latent heat flux, Δ (kPa °C−1) is the slope of the saturation vapor pressure curve, Rn (W m−2) is the net radiation flux, G0 (W m−2) is the surface soil heat flux, ρa (kg m−3) is the air density, cp (J kg−1 °C−1) is the specific heat of air at constant pressure, here the value of 1013 J kg−1 °C−1 is used. es (kPa) is the saturated vapor pressure, ea (kPa) is the actual vapor pressure, ra (m s−1) is the aerodynamic resistance of vapor transport, and γ (kPa °C−1) is the psychrometric constant. All the model parameters are on the hourly timescale. The negative latent heat flux is converted to condensation or desublimation by:
E = A ρ λ E λ
where E (mm) is the hourly water equivalent of condensation or desublimation, λ (MJ kg−1) is the latent heat of vaporization or sublimation, A (s) is the time interval of hourly meteorological variables, and ρ (kg m−3) is the water density. By accumulating the hourly condensation and desublimation, the monthly and annual condensation and desublimation used for quantitative analysis can be obtained. The parameters for the Penman model and their calculation methods are listed in detail by Table 3, and the required meteorological variables are listed in detail by Table 1.

2.3.2. MK Trend Test

To analyze the trend of condensation and desublimation, the Mann–Kendall (MK) trend test [57,58,59,60] was used to quantify the trend and its significance of condensation and desublimation on the QTP during 1950~2020. The MK trend test is performed as follows:
S = i = 1 n 1 j = i + 1 n sgn ( x j x i )
sgn ( x j x i ) = { 1 0 1 ( x j x i ) > 0 ( x j x i ) = 0 ( x j x i ) < 0
var ( S ) = n ( n 1 ) ( 2 n + 5 ) k = 1 m t k ( t k 1 ) ( 2 t k + 5 ) 18
Z c = { ( S 1 ) / var ( S ) 0 ( S + 1 ) / var ( S ) S > 0 S = 0 S < 0
where S is the statistic of the dataset, n is the length of the dataset, xi and xj are the sequential data values in time series i and j, m is the number of tied groups, and tk denotes the number of ties of extent k and a tied group is a set of sample data having the same value, Zc is the standardized statistics of the dataset, and the positive Zc indicates an increasing trend of the dataset, while the negative values Zc indicate a decreasing trend of the dataset. If |Zc| > Z1−α/2, the trend is statistically significant, otherwise, the trend is not statistically significant. Trend test of condensation and desublimation was done at the significance level of α = 0.05 (|Z1−α/2| = 1.96, 95% confidence level), i.e., when the Zc of condensation or coagulation was greater than 1.96, it indicates that condensation or desublimation shows a significant increasing trend, while when the Zc of condensation or desublimation was lower than −1.96, it indicates that condensation or desublimation shows a significant decreasing trend; otherwise, there was no significant trend of condensation or desublimation.

2.3.3. Sen’s Slope Analysis

The magnitude of the trend (i.e., slope in variation per unit time) of condensation and desublimation was determined using a non-parametric method known as Sen’s slope analysis [59,60,61], and the slope is expressed as:
β = Median ( x j x i j i )   1 < i < j < n
where β is the slope of the dataset, a positive β denotes an increasing trend of condensation or desublimation, while a negative β means a decreasing trend of condensation or desublimation. A larger value of |β| means a greater increase or decrease in condensation and desublimation.

3. Results

3.1. Accuracy of Estimated Condensation and Desublimation

The comparison of the monthly condensation and desublimation measured by the Eddy Covariance with those estimated by the Penman model at nine flux stations on the QTP is shown in Figure 3 and Figure 4, respectively. As can be seen from Figure 3, the coefficient of determination (R2) between estimated and measured monthly condensation is greater than or equal to 0.55 for all stations, indicating that the Penman model with nine meteorological variables from ERA5-Land and ERA5 reanalysis datasets as inputs has good applicability in estimating monthly condensation on the QTP. Among the nine flux stations on the QTP, the largest R2 between estimated and measured monthly condensation is 0.94 for Xiyinghe station, the smallest R2 between estimated and measured monthly condensation is 0.55 for Ngari station, and the average R2 between estimated and measured monthly condensation is 0.82 for all stations.
Compared with the R2 between estimated and measured monthly condensation, the R2 between estimated and measured monthly desublimation is much smaller at the nine flux stations on the QTP (Figure 4). As can be seen from Figure 4, the R2 between estimated and measured monthly desublimation is less than or equal to 0.71 for all stations, indicating that the Penman model with nine meteorological variables from ERA5-Land and ERA5 reanalysis datasets as inputs is less applicable in estimating monthly desublimation than in estimating monthly condensation on the QTP. Among the nine flux stations on the QTP, the largest R2 between estimated and measured monthly desublimation is 0.71 for Qomolangma station, the smallest R2 between estimated and measured monthly desublimation is 0.46 for Xiyinghe station, and the average R2 between estimated and measured monthly desublimation is 0.59 for all stations.
Although the R2 between estimated and measured monthly condensation is higher than the R2 between estimated and measured monthly desublimation, the R2 between estimated and measured annual condensation is much smaller than the R2 between estimated and measured annual desublimation, as shown in Figure 5. The average R2 between estimated and measured annual condensation for all stations is 0.56, while the average R2 between estimated and measured annual desublimation is 0.91.
Clearly, the Penman model with nine meteorological variables from ERA5-Land and ERA5 as inputs is more accurate for estimating monthly condensation than for estimating annual condensation, and less accurate for estimating monthly desublimation than for estimating annual desublimation. Overall, the accuracy of the estimated monthly and annual condensation and desublimation is adequate for the study.

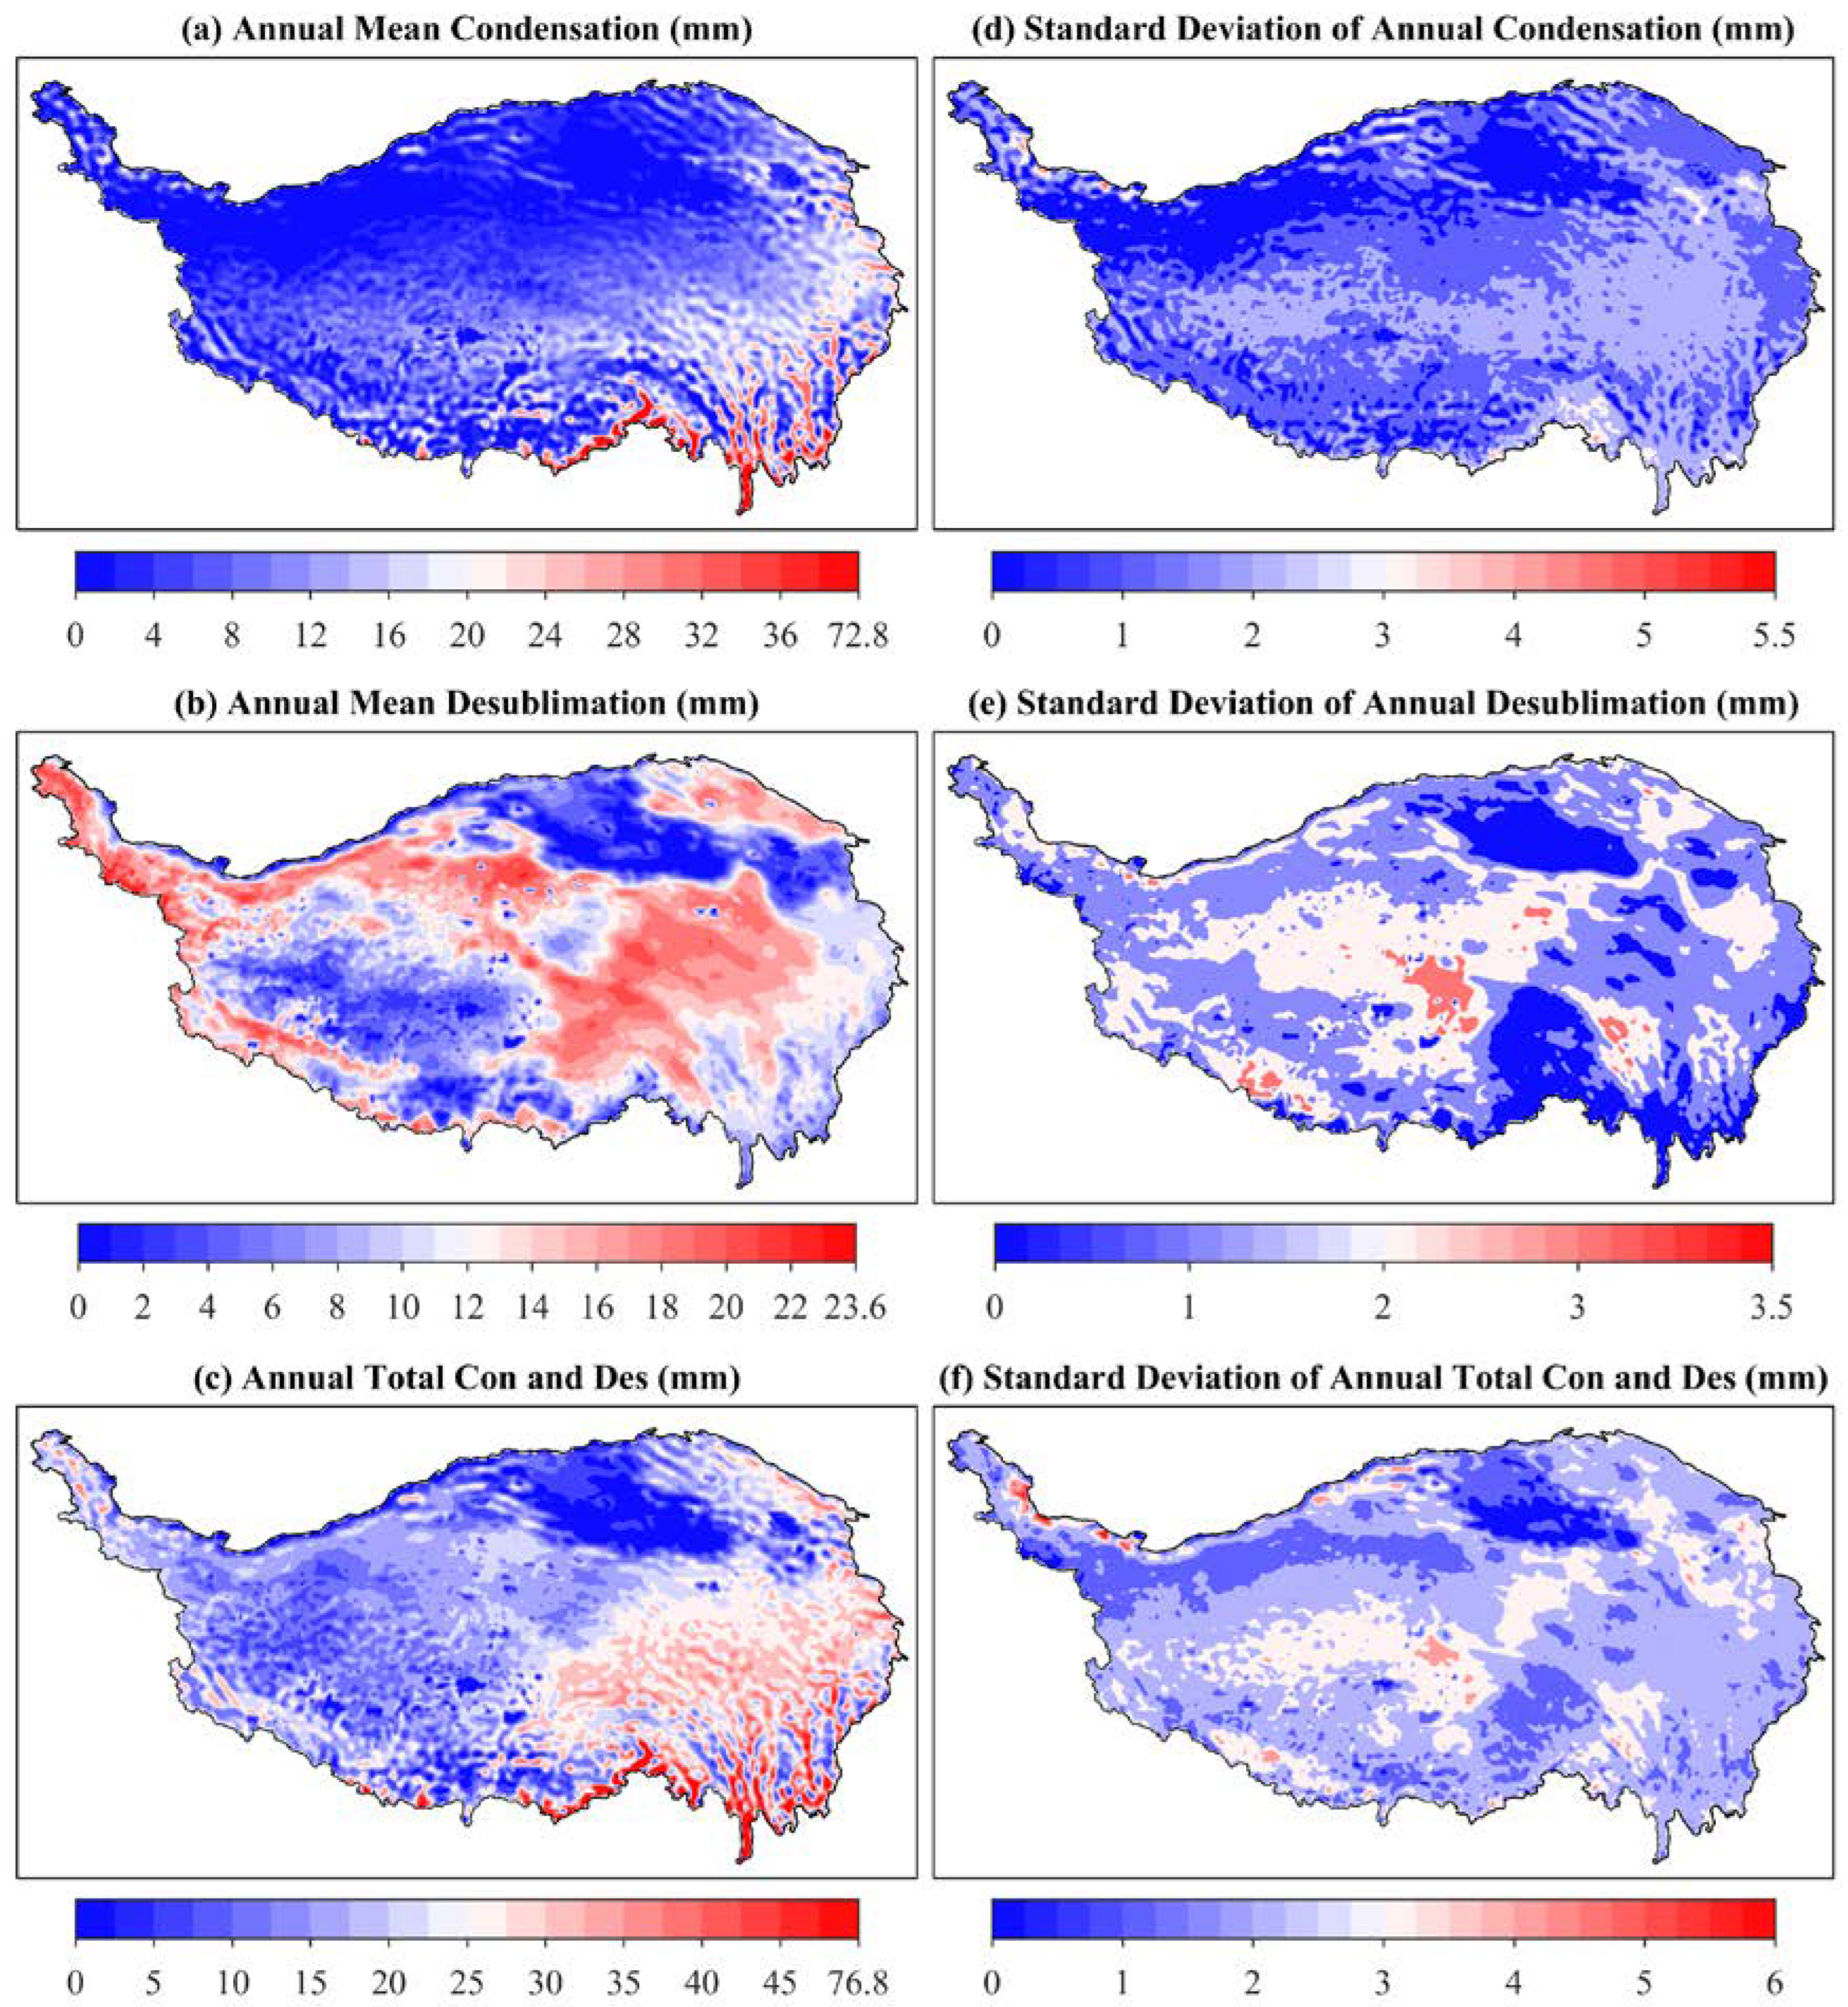
3.2. Spatial Distribution of Condensation and Desublimation

The spatial distribution characteristics of annual mean condensation, annual mean desublimation, and annual mean total condensation and desublimation on the QTP from 1950 to 2020 and their standard deviations are shown in Figure 6. As can be seen in Figure 6a, the annual mean condensation on the QTP showed a decreasing trend from southeast to northwest, with a large difference between the annual condensation in the southeast and northwest, and the annual mean condensation ranges from 0 mm to 72.8 mm. However, areas with condensation between 36 mm and 72.8 mm account for less than 5% of the total area of the QTP. The areas with the highest annual condensation were in the southeastern river valleys, and the areas with the lowest annual condensation were in the Northwest QTP and the Tsaidam Basin. The spatial distribution of the standard deviation of annual condensation was basically consistent with that of annual mean condensation, and the greater the annual mean condensation, the greater the standard deviation of annual condensation, and vice versa (Figure 6d).
Unlike the spatial distribution characteristics of annual mean condensation, the spatial distribution of annual mean desublimation did not have zonal characteristics seen in Figure 6b. The annual mean desublimation in the Qiangtang Plateau, Tsaidam Basin, and the eastern edge of the QTP were significantly lower than those in other regions. The annual mean desublimation on the QTP as a whole ranges from 0 mm to 23.6 mm, and the difference in annual mean desublimation between regions is much smaller than that of annual mean condensation. The spatial distribution of the standard deviation of the annual desublimation was not consistent with the spatial distribution of the annual mean desublimation, and the standard deviations were small overall (Figure 6e).
Influenced by the spatial distribution of annual mean condensation and annual mean desublimation, the spatial distribution of total annual mean condensation and desublimation showed obvious regional differences, i.e., the southeastern and northeastern parts of the QTP were the regions with the largest total condensation and desublimation, followed by the Qiangtang Plateau and the lowest in the Tsaidam Basin (Figure 6c). The range of the total annual mean condensation and desublimation for the whole QTP was from 0 mm to 76.8 mm, but only less than 5% of the areas have the total annual mean condensation and desublimation exceeding 45 mm. In addition, the spatial distribution characteristics of the standard deviation of the total annual condensation and desublimation were consistent with the spatial distribution of the annual condensation, with the Qiangtang Plateau being the region with the larger standard deviation of the total annual condensation and desublimation, and the Tsaidam Basin being the region with the smaller standard deviation of the total annual condensation and desublimation (Figure 6f).

3.3. Spatial Trends of Condensation and Desublimation

In order to quantify the spatial trends of condensation, desublimation, and total condensation and desublimation on the QTP, a significance analysis based on MK trend test and magnitude of the trends based on Sen’s slope analysis were conducted for annual condensation, annual desublimation, and total annual condensation and desublimation as shown in Figure 7. As can be seen from Figure 7a, the annual condensation showed a clear increasing trend in the central part of the QTP, and only a small part of the northeastern QTP showed a clear decreasing trend, while the annual condensation in other regions did not show a clear trend. In addition, it can also be seen from Figure 7d that the annual condensation showed an increasing trend in most regions of the QTP and a decreasing trend in the Tsaidam Basin and the eastern and southern margins of the QTP, with a maximum increase rate of 1.70 mm/10a and a maximum decrease rate of −1.16 mm/10a.
Figure 7b shows that the annual desublimation showed a significant decreasing trend in most regions of the QTP, and only in a very small part of the eastern QTP showed a significant increasing trend. The magnitude of the annual desublimation trend in Figure 7e also indicates that desublimation showed a decreasing trend in the majority of the QTP, with a maximum decrease rate of −0.9 mm/10a and a maximum increase rate of 0.43 mm/10a.
Since the decreasing trend of desublimation on the QTP was more significant than the increasing trend of condensation, the decreasing trend of total condensation and desublimation was more obvious than the increasing trend shown in Figure 7c. The total condensation and desublimation showed a regionally significant decreasing trend in the northeastern QTP, and southeastern QTP and the Qiangtang Plateau, while the increasing trend of total condensation and desublimation was not regional, and the maximum decreasing rate of annual condensation and desublimation was −1.49 mm/10a and the maximum increasing rate was 1.62 mm/10a.

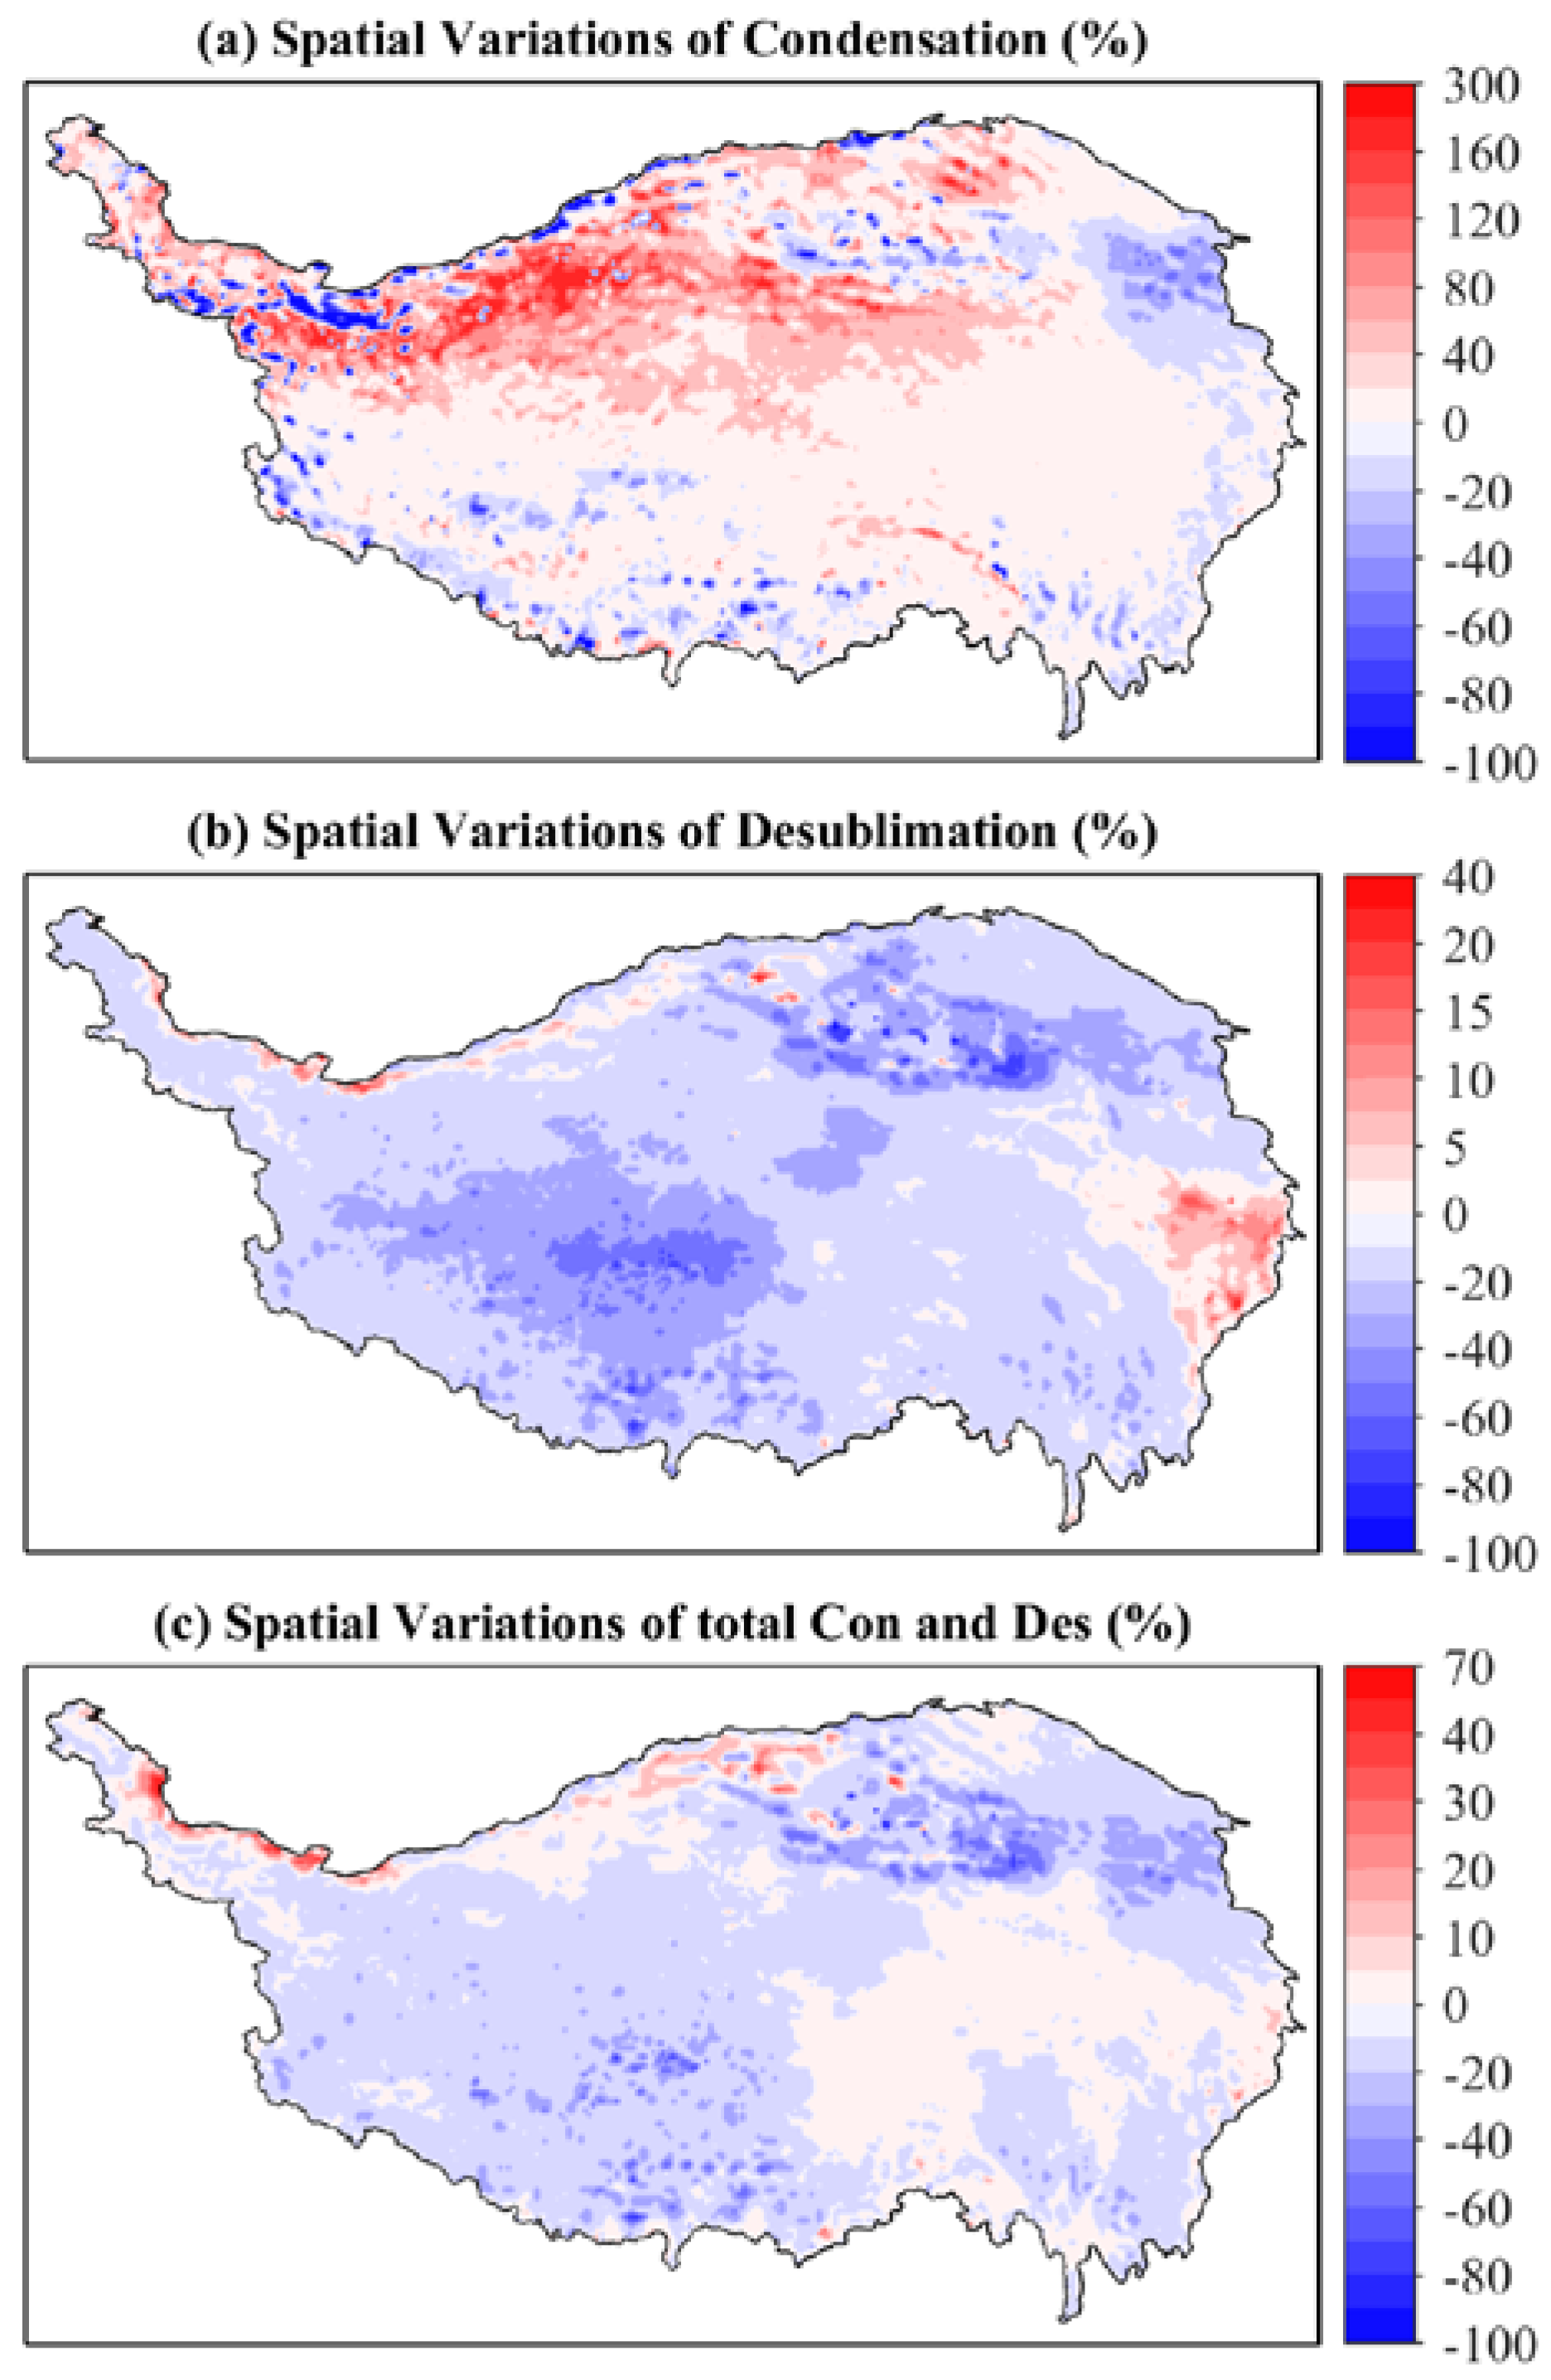
3.4. Spatial Variations in Condensation and Desublimation

To better visualize the spatial variation characteristics of condensation and desublimation on the QTP, the percentage change of condensation and desublimation in the last two decades compared to the first two decades of the study period from 1950 to 2020 was quantified, as shown in Figure 8. From Figure 8a,b, it is clear that the increasing proportion of annual condensation on the QTP has an increasing trend from southeast to northwest, while the decreasing proportion of annual desublimation and the decreasing proportion of total annual condensation and desublimation showed a regional rather than a zonal pattern. In general, in the last two decades compared to the first two decades of the QTP from 1950 to 2020, the mean percentage increase of annual condensation was 19.6%, the mean percentage decrease of annual desublimation was 11.5%, and the mean percentage decrease of annual total condensation and desublimation was 4.6%.

3.5. Monthly Variations in Condensation and Desublimation

Figure 9 shows the monthly variations of condensation, desublimation, and the total condensation and desublimation averaged over 1950~2020. From Figure 9a, it can be seen that condensation showed obvious seasonal differences, i.e., the summer was the season with the highest amount of condensation, while the winter was the season with the lowest amount of condensation. The August was the month with the highest amount of condensation of 2.37 ± 0.44 mm, and January was the month with the lowest amount of condensation of 0.02 mm, which was almost negligible. As can be seen from Figure 9b, the desublimation also showed a clear seasonality, but the seasonality of desublimation was different from the seasonality of condensation, i.e., there were two seasons in the year when desublimation was enriched, namely, spring and autumn, in which the month with the highest amount of desublimation was October of 1.45 ± 0.2 mm, and the month with the lowest amount of desublimation was July of 0.5 ± 0.15 mm. The monthly variations of the total condensation and desublimation was influenced by the monthly variations of condensation and desublimation, with July to September being the period of maximum total condensation and desublimation, while December to February of the following year was the period of minimum total condensation and desublimation (Figure 9c). The maximum amount of the total condensation and desublimation was in August, with an average value of 2.97 ± 0.37 mm, and the minimum amount of the total condensation and desublimation was in February, with an average value of 0.77 ± 0.10 mm.
Although the monthly maximum amount of condensation was much larger than the monthly maximum amount of desublimation, the monthly mean amount of desublimation was larger than the monthly mean amount of condensation. The monthly mean amount of condensation was 0.70 mm, the monthly mean amount of desublimation was 0.95 mm, and the monthly mean total amount of condensation and desublimation was 1.66 mm.

3.6. Annual Variations in Condensation and Desublimation

The variations of annual condensation, annual desublimation, and their sums for the entire region of the QTP are shown in Figure 10. From Figure 10a, it is clear that the annual desublimation showed a continuous decreasing trend, while the annual condensation fluctuated more in the initial years and then showed a continuous increasing trend. The rate of decrease of desublimation was −0.26/10a and the rate of increase of condensation in the later years was 0.24/10a. Since the absolute value of the decrease rate of annual desublimation was greater than the increase rate of annual condensation, the total annual condensation and desublimation also showed a weak decreasing trend, as shown in Figure 10b. Furthermore, it can be found from Figure 10a that the increase in annual condensation will exceed the decrease in annual desublimation in recent years, and the increase in condensation will dominate in the future, and the annual total condensation and desublimation will change from a decreasing trend to an increasing trend. It can also be found in Figure 10a that the annual mean desublimation was greater than the annual mean condensation, with annual mean desublimation of 11.45 ± 0.85 mm and annual mean condensation of 8.45 ± 0.94 mm, for annual mean total condensation and desublimation of 19.89 ± 1.2 mm. The higher annual mean desublimation than the annual mean condensation reflects the cold climate characteristics of the QTP, while the increasing trend of condensation and decreasing trend of desublimation also reflect the warming of the regional climate.

3.7. Influencing Factors of Condensation and Desublimation Variations

The occurrence of condensation and condensation is the result of a combination of meteorological factors, among which temperature and relative humidity are the most important meteorological variables affecting the occurrence of condensation and desublimation. Since the relative humidity is closely related to variations in air temperature and precipitation, the current study focuses on analyzing the variations in air temperature, precipitation, and the relationship between variations in condensation and desublimation and variations in air temperature and precipitation on the QTP.
As shown in Figure 11a,d, the annual mean temperature and annual precipitation showed an overall increasing trend, but both trends were phased, i.e., both the annual mean temperature and annual precipitation showed a decreasing trend followed by an increasing trend on the QTP from 1950 to 2020. Since the 1970s, the average annual temperature has been increasing at a rate of 0.25 °C/10a, and the annual precipitation has been increasing at a rate of 13.02 mm/10a. From 1950 to 2020, the mean annual temperature was −3.95 °C and the mean annual precipitation was 388 mm of the QTP.
From Figure 10a and Figure 11a,b, it can be seen that the variations in annual mean temperature and annual precipitation are more consistent with the variations in annual condensation. In addition, from Figure 11b,c,e,f, it can be seen that there is a positive correlation between annual mean temperature, annual precipitation, and annual condensation, and a negative correlation with annual desublimation, indicating that the increase in annual mean temperature and annual precipitation is favorable to the occurrence of condensation and unfavorable to the occurrence of desublimation on the QTP.
The above results show that the increase in annual condensation is most correlated with the increase in annual precipitation, while the decrease in desublimation is most correlated with the increase in temperature, and the increase in precipitation is the dominant meteorological variable in the increasing trend of annual condensation, while the increase in temperature is the dominant meteorological variable in the decreasing trend of annual desublimation.

4. Discussion

4.1. Uncertainty in the Evaluation of Condensation and Desublimation

In the present study, nine meteorological variables from the ERA5-Land and ERA5 reanalysis datasets were used as inputs to generalize the occurrence of condensation and desublimation based on the Penman model, which inevitably resulted in systematic errors in the evaluation of condensation and desublimation. Therefore, the main uncertainties in this study arise from the two following aspects: the applicability of ERA5-Land and ERA5 reanalysis datasets for land surface process studies on the one hand, and the applicability of the Penman model in evaluating condensation and desublimation occurrence studies on the other hand.
ERA5-Land and ERA5 are currently more recognized reanalysis datasets with high spatial and temporal resolution, and they have been widely used in studies of land surface processes including land–atmosphere interactions, meteorology, and hydrology [28]. The applicability evaluation of ERA5-Land on the northeastern QTP shows that the correlation between the assimilated temperature in ERA5-Land and the observed temperature at meteorological stations was very high, and ERA5-Land reproduced the spatial distribution of temperature more accurately; however, ERA5-Land underestimated the temperature of different degrees, and this phenomenon was also found in the applicability evaluation of ERA5-Land on a national scale [28,62]. In addition, the evaluation of different variables in ERA5-Land in different regions also shows that ERA5-Land has better performance in reproducing corresponding meteorological elements [63,64,65]. Compared to ERA5-Land, ERA5 is more widely applicable due to its earlier development. Most studies based on ERA5 reanalysis datasets have shown that ERA5 variables have good spatial and temporal consistency with the observed meteorological elements, despite under- and over-estimation of some meteorological variables [66]. Compared with other types of reanalysis data, ERA5-Land and ERA5 have higher spatial and temporal resolution, making them the most widely used reanalysis datasets at present. In general, the ERA5-Land and ERA5 reanalysis datasets have good applicability in land surface process studies, especially for large scale land–atmosphere interactions, and meteorological and hydrological process studies.
The widely accepted method for estimating the latent heat flux is the Eddy Covariance method [67], but the Eddy Covariance equipment is expensive and only applicable to in situ observations, which cannot be used for large scale and regional latent heat flux estimation. Compared with the Eddy Covariance method, the Penman model also has a better physical basis and can be used for large scale and regional latent heat flux estimation [68]. The estimation of condensation (dew) and desublimation (hoarfrost) based on the Penman model shows very good agreement between the total amount of dew and hoarfrost estimated by the Penman model and the total amount of dew and hoarfrost measured by microlysimeters; and the Penman model slightly underestimates the total amount of dew and hoarfrost [4,24].
From Figure 3, Figure 4 and Figure 5, the average R2 between the estimated and measured monthly condensation and monthly desublimation are 0.82 and 0.59, respectively, and the average R2 between the estimated and measured annual condensation and annual desublimation are 0.56 and 0.91, respectively, for the nine flux stations on the QTP, indicating that the accuracy of the monthly and annual condensation and desublimation, estimated by the Penman model with nine meteorological variables from ERA5-Land and ERA5 as inputs, is adequate for the present study. Overall, although there are uncertainties in evaluating condensation and desublimation based on the Penman model using the ERA5-Land and ERA5 reanalysis datasets, the method can effectively reproduce the spatial and temporal variations of condensation and desublimation, which is useful for improving the understanding of condensation and desublimation over the QTP.

4.2. Impact of Condensation and Desublimation on Alpine Ecosystem

Previous studies of condensation and desublimation mainly focused on arid and semi-arid regions [8,18,69,70,71], and there are less studies of condensation and desublimation in alpine regions [4,12]. However, the magnitude of condensation and desublimation in alpine regions is much larger than that in arid and semi-arid regions [72,73], and the ecological and hydrological roles of condensation and desublimation in alpine regions and arid and semi-arid regions is obviously different [25]. The alpine regions are the generally referred to areas with high altitude, low temperature, and large diurnal temperature differences, as well as areas with short growing periods and low effective accumulation temperatures due to the high altitude [74]. The near-surface atmospheric hydrothermal conditions in alpine regions are highly variable, with frequent evaporation, sublimation, condensation, and desublimation interaction processes, which play an important role in the ecological and water vapor internal circulation processes in the region [75,76,77].
Observation experiments on condensation and desublimation carried out in recent years in alpine regions have shown that condensation and desublimation have unique ecological and hydrological roles in alpine regions, and that condensation and desublimation are one of the water sources in alpine regions that are no less important than in arid and semi-arid regions [11,78,79]. Observations in the coarse gravel accumulation area of Siberian slopes show that condensation recharge of water vapor exists in the pore space of mountain gravel and gravel layers, the amount of condensation can reach 80 mm in summer [80], and condensation recharge accounts for 15−20% of the total recharge. Kuhle found in the alpine mountains of the northern slopes of the Himalayas that condensation causes alpine rocky slopes to be completely covered by alpine meadows [81]; and in the alpine belt, where 80% of the soil is coarse-boned, the potential soil moisture can last only 13 days under continuous sunny weather but 22 days with surface condensation occurring [82]. The present study shows that the annual mean total condensation and desublimation is 19.89 mm, the annual mean precipitation is 388 mm, and the ratio of total annual condensation and condensation to annual precipitation is 5.13% on the QTP. In fact, the direct contribution of condensation and desublimation to surface water input in alpine regions is low, and condensation and desublimation mainly moderates the periodic physiological water deficit of vegetation caused by low temperatures [25]. In alpine regions with greater diurnal temperature differences and strong radiative cooling at night, the greater the land–atmosphere temperature difference, the higher the risk of frost damage to vegetation; the formation process of condensation and desublimation releases part of the latent heat, which replenishes the energy deficit at the surface, alleviates the low temperature stress on vegetation, and reduces the risk of frost damage to vegetation [12].
In summary, the ecological and hydrological roles of condensation and condensation in alpine regions like the QTP are reflected in the two following aspects: on the one hand, condensation and desublimation are part of surface water input, which alleviate the physiological water deficit of surface plants, animals, and microorganisms due to low temperatures; on the other hand, the occurrence of condensation and desublimation releases latent heat, which replenishes the energy deficit near the surface, alleviates the difference in ground temperature, and serves to reduce the risk of frost damage to surface plants and animals and microorganisms. Therefore, it can be considered that condensation and desublimation play an important role in maintaining the development of alpine ecosystems, with areas of increased condensation and desublimation indicating a trend towards better ecosystem conditions, while areas of decreased condensation and desublimation imply a trend towards worse ecosystem conditions.

5. Conclusions

The present study focuses on evaluating the spatial and temporal variations of condensation and desublimation on the QTP from 1950 to 2020 based on the Penman model using meteorological variables from ERA5-Land and ERA5 reanalysis datasets. Condensation and desublimation were often neglected, but condensation and desublimation were major processes of land–atmosphere interactions, energy transfer, and water cycle at night and have important ecological and hydrological roles in alpine regions to alleviate the physiological water deficit of surface plants, animals, and microorganisms due to low temperature and reduce the risk of frost damage to surface plants, animals, and microorganisms. Therefore, evaluating the spatial and temporal variations of condensation and desublimation not only improves the understanding of land–atmosphere interactions, energy transfer, and water cycles, but also contributes to the understanding of the operational mechanisms of alpine ecosystems on the QTP.
The results showed that there were large regional differences in condensation and desublimation on the QTP, with annual mean condensation ranging from 0 mm to 72.8 mm, annual mean desublimation ranging from 0 mm to 23.6 mm, and annual mean total condensation and desublimation ranging from 0 mm to 76.8 mm. Condensation showed a significant increasing trend in the central and northwestern parts of the QTP, desublimation showed a significant decreasing trend in most parts of the QTP, and the decreasing trend of desublimation was more significant than the increasing trend of condensation.
Both condensation and desublimation have significant seasonal characteristics, with condensation being most abundant in the summer, and desublimation in the spring and autumn. The maximum monthly condensation was 2.37 mm, the monthly mean condensation was 0.70 mm, the maximum monthly desublimation was 1.45 mm, the monthly mean condensation was 0.95 mm, and the total monthly mean condensation and desublimation was 1.66 mm. The annual mean condensation was 8.45 mm, the annual mean desublimation was 11.45 mm, and the total condensation and desublimation was 19.89 mm. The annual condensation hadan increasing trend of 0.24 mm/10a, the annual desublimation had a decreasing trend of −0.26 mm/10a, and the total annual mean condensation and desublimation had a weak decreasing trend. The increase in condensation is most associated with the increase in precipitation, while the decrease in desublimation is most associated with the increase in air temperature on the QTP.
The ratio of total annual condensation and desublimation to precipitation is 5.13%. Although the annual mean desublimation was higher than the annual mean condensation, the increase in condensation will exceed the decrease in desublimation in the future. As condensation exceeds desublimation, the total amount of condensation and desublimation tends to increase, indicating that the ecosystem shows a trend toward improvement on the QTP.

Author Contributions

Conceptualization, H.L. and C.H.; methodology, H.L. and Y.Y.; software, H.L.; investigation, H.L. and C.H.; data curation, C.H. and R.C.; writing—original draft preparation, H.L.; writing—review and editing, C.H., Y.Y. and R.C.; funding acquisition, R.C., C.H. and Y.Y. All authors have read and agreed to the published version of the manuscript.

Funding

This Research was funded by the Joint Research Project of Three-River Headwaters National Park, Chinese Academy of Sciences and the People’s Government of Qinghai Province (LHZX-2020-11), the National Natural Sciences Foundation of China (41971041), the Sciences and Technology Plan Project of Gansu Province (21JR7RA056), and the Open Research Fund of the National Cryosphere Desert Data Center (2021kf09).

Data Availability Statement

The ERA5-Land reanalysis dataset from the ECMWF used in this study can be accessed online (https://cds.climate.copernicus.eu/cdsapp#!/dataset/reanalysis-era5-land?tab=overview/ (accessed on 1 March 2022)). The ERA5 reanalysis dataset from the ECMWF used in this study can be accessed online (https://cds.climate.copernicus.eu/cdsapp#!/dataset/reanalysis-era5-single-levels?tab=overview/ (accessed on 1 March 2022)). The observed meteorological variables from the National Tibetan Plateau Data Center used in this study can be accessed online (https://data.tpdc.ac.cn/en/data/b9ab35b2-81fb-4330-925f-4d9860ac47c3/ (accessed on 1 March 2022); https://data.tpdc.ac.cn/en/special/b2f26432-5d99-4126-ab94-883613cba133/?introduce=true/ (accessed on 1 March 2022)).

Acknowledgments

The authors would like to thank European Centre for Medium-range Weather Forecasts (ECMWF) (https://cds.climate.copernicus.eu/, (accessed on 1 March 2022)) for providing the ERA5-Land and ERA5 reanalysis datasets and National Tibetan Plateau Data Center (https://data.tpdc.ac.cn/en/, (accessed on 1 March 2022)) for providing the observed meteorological variables, and the authors also would like to thank all team members in Qilian Alpine Ecology and Hydrology Research Station, Northwest Institute of Eco-Environment and Resources, Chinese Academy of Sciences.

Conflicts of Interest

The authors declare no conflict of interest.

References

  1. Agam, N.; Berliner, P. Dew formation and water vapor adsorption in semi-arid environments—A review. J. Arid. Environ. 2006, 65, 572–590. [Google Scholar] [CrossRef]
  2. Beysens, D. The formation of dew. Atmos. Res. 1995, 39, 215–237. [Google Scholar] [CrossRef]
  3. Lee, J.; Lee, K.S. The behavior of frost layer growth under conditions favorable for desublimation. Int. J. Heat Mass Transf. 2018, 120, 259–266. [Google Scholar] [CrossRef]
  4. Li, H.; Han, C.; Yang, Y.; Chen, R. Formation and variations of dew and hoarfrost in the Hulu Catchment on Northeast Qinghai-Tibet Plateau, China. J. Hydrol. Reg. Stud. 2022, 42, 101179. [Google Scholar] [CrossRef]
  5. Guo, S.; Chen, R.; Li, H. Surface Sublimation/Evaporation and Condensation/Deposition and Their Links to Westerlies During 2020 on the August-One Glacier, the Semi-Arid Qilian Mountains of Northeast Tibetan Plateau. J. Geophys. Res. Atmos. 2022, 127, e2022JD036494. [Google Scholar] [CrossRef]
  6. De Jong, C. The contribution of condensation to the water cycle under high-mountain conditions. Hydrol. Process. 2005, 19, 2419–2435. [Google Scholar] [CrossRef]
  7. Malek, E.; McCurdy, G.; Giles, B. Dew contribution to the annual water balances in semi-arid desert valleys. J. Arid. Environ. 1999, 42, 71–80. [Google Scholar] [CrossRef]
  8. Gao, Z.; Shi, W.; Wang, X.; Wang, Y. Non-rainfall water contributions to dryland jujube plantation evapotranspiration in the Hilly Loess Region of China. J. Hydrol. 2020, 583, 124604. [Google Scholar] [CrossRef]
  9. Evans, S.; Todd-Brown, K.E.O.; Jacobson, K.; Jacobson, P. Non-rainfall Moisture: A Key Driver of Microbial Respiration from Standing Litter in Arid, Semiarid, and Mesic Grasslands. Ecosystems 2019, 23, 1154–1169. [Google Scholar] [CrossRef] [Green Version]
  10. Zheng, J.; Peng, C.; Li, H.; Li, S.; Huang, S.; Hu, Y.; Zhang, J.; Li, D. The role of non-rainfall water on physiological activation in desert biological soil crusts. J. Hydrol. 2018, 556, 790–799. [Google Scholar] [CrossRef]
  11. Wang, L.; Kaseke, K.F.; Seely, M.K. Effects of non-rainfall water inputs on ecosystem functions. Wiley Interdiscip. Rev. Water 2017, 4, e1179. [Google Scholar] [CrossRef]
  12. Groh, J.; Slawitsch, V.; Herndl, M.; Graf, A.; Vereecken, H.; Pütz, T. Determining dew and hoar frost formation for a low mountain range and alpine grassland site by weighable lysimeter. J. Hydrol. 2018, 563, 372–381. [Google Scholar] [CrossRef]
  13. Florentin, A.; Agam, N. Estimating non-rainfall-water-inputs-derived latent heat flux with turbulence-based methods. Agric. For. Meteorol. 2017, 247, 533–540. [Google Scholar] [CrossRef]
  14. Ninari, N.; Berliner, P.R. The role of dew in the water and heat balance of bare loess soil in the Negev Desert: Quantifying the actual dew deposition on the soil surface. Atmos. Res. 2002, 64, 323–334. [Google Scholar] [CrossRef]
  15. Kidron, G.J.; Kronenfeld, R. Microlysimeters overestimate the amount of non-rainfall water—An experimental approach. Catena 2020, 194, 104691. [Google Scholar] [CrossRef]
  16. Zhang, Q.; Wang, S.; Yue, P.; Wang, R. A measurement, quantitative identification and estimation method(QINRW) of non-rainfall water component by lysimeter. MethodsX 2019, 6, 2873–2881. [Google Scholar] [CrossRef]
  17. Hanisch, S.; Lohrey, C.; Buerkert, A. Dewfall and its ecological significance in semi-arid coastal south-western Madagascar. J. Arid. Environ. 2015, 121, 24–31. [Google Scholar] [CrossRef]
  18. Zhuang, Y.; Zhao, W. Dew formation and its variation in Haloxylon ammodendron plantations at the edge of a desert oasis, northwestern China. Agric. For. Meteorol. 2017, 247, 541–550. [Google Scholar] [CrossRef]
  19. Madeira, A.C.; Kim, K.S.; Taylor, S.; Gleason, M. A simple cloud-based energy balance model to estimate dew. Agric. For. Meteorol. 2002, 111, 55–63. [Google Scholar] [CrossRef]
  20. Wang, Z.; Zhang, Z.; Su, Y. A new water balance equation introducing dew amount in arid area. J. Hydraul. Eng. 2019, 50, 710–720. [Google Scholar]
  21. Hao, X.; Li, C.; Guo, B.; Ma, J.; Ayup, M.; Chen, Z. Dew formation and its long-term trend in a desert riparian forest ecosystem on the eastern edge of the Taklimakan Desert in China. J. Hydrol. 2012, 472, 90–98. [Google Scholar] [CrossRef]
  22. Jacobs, A.F.G.; Heusinkveld, B.G.; Berkowicz, S.M. Passive dew collection in a grassland area, The Netherlands. Atmos. Res. 2008, 87, 377–385. [Google Scholar] [CrossRef]
  23. Uclés, O.; Villagarcía, L.; Moro, M.J.; Canton, Y.; Domingo, F. Role of dewfall in the water balance of a semiarid coastal steppe ecosystem. Hydrol. Processes 2014, 28, 2271–2280. [Google Scholar] [CrossRef]
  24. Jacobs, A.F.G.; Heusinkveld, B.G.; Wichink Kruit, R.J.; Berkowicz, S.M. Contribution of dew to the water budget of a grassland area in the Netherlands. Water Resour. Res. 2006, 42, W03415. [Google Scholar] [CrossRef]
  25. Chuntan, H.; Hongyuan, L.; Rensheng, C.; Zhangwen, L.; Junfeng, L.; Yong, Y.; Xiqiang, W. Advances in the study on NRWIs in Alpine Mountains. Plateau Meteorol. 2022; in press. [Google Scholar]
  26. Zhang, X. Dynamics Changes of Typical Inland Lakes on Tibetan Plateau Using Multi-Sensor Remote Sensing Data. Ph.D. Thesis, Northwest A&F University, Xi’an, China, 2015. [Google Scholar]
  27. Zou, H.; Zhu, J. Applicability of reanalysis data in the study of surface temperature in Qinghai-Tibet Plateau. In Proceedings of the 28th Annual Meeting of China Meteorological Society, Xiamen, China, 3–4 November 2011. [Google Scholar]
  28. Li, H.; Liu, G.; Han, C.; Yang, Y.; Chen, R. Quantifying the Trends and Variations in the Frost-Free Period and the Number of Frost Days across China under Climate Change Using ERA5-Land Reanalysis Dataset. Remote Sens. 2022, 14, 2400. [Google Scholar] [CrossRef]
  29. Yang, J.; Huang, M.; Zhai, P. Performance of the CRA-40/Land, CMFD, and ERA-Interim Datasets in Reflecting Changes in Surface Air Temperature over the Tibetan Plateau. J. Meteorol. Res. 2021, 35, 663–672. [Google Scholar] [CrossRef]
  30. Ullah, I.; Ma, X.; Ren, G.; Yin, J.; Iyakaremye, V.; Syed, S.; Lu, K.; Xing, Y.; Singh, V.P. Recent Changes in Drought Events over South Asia and Their Possible Linkages with Climatic and Dynamic Factors. Remote Sens. 2022, 14, 3219. [Google Scholar] [CrossRef]
  31. Ullah, I.; Ma, X.; Asfaw, T.G.; Yin, J.; Iyakaremye, V.; Saleem, F.; Xing, Y.; Azam, K.; Syed, S. Projected Changes in Increased Drought Risks Over South Asia Under a Warmer Climate. Earth’s Future 2022, 10, e2022EF002830. [Google Scholar] [CrossRef]
  32. Ullah, I.; Saleem, F.; Iyakaremye, V.; Yin, J.; Ma, X.; Syed, S.; Hina, S.; Asfaw, T.G.; Omer, A. Projected Changes in Socioeconomic Exposure to Heatwaves in South Asia Under Changing Climate. Earth’s Future 2022, 10, e2021EF002240. [Google Scholar] [CrossRef]
  33. Yao, T.; Bolch, T.; Chen, D.; Gao, J.; Immerzeel, W.W.; Piao, S.; Su, F.; Thompson, L.; Wada, Y.; Wang, L.; et al. The imbalance of the Asian water tower. Nat. Rev. Earth Environ. 2022, 3, 618–632. [Google Scholar] [CrossRef]
  34. Xianru, L. Characteristics of Temperature and Precipitation Change on the Tibet Plateau under the Background of Global Warming. Adv. Geosci. 2019, 9, 1042–1049. [Google Scholar]
  35. Ga, Z.; Sirong, C.; Bing, Z. Spatio-temporal variation of vegetation coverage over the Tibetan Plateau and its responses to climatic factors. Acta Ecol. Sin. 2018, 38, 3208–3218. [Google Scholar]
  36. Hersbach, H.; Bell, B.; Berrisford, P.; Biavati, G.; Horányi, A.; Muñoz Sabater, J.; Nicolas, J.; Peubey, C.; Radu, R.; Rozum, I.; et al. ERA5 Hourly Data on Single Levels from 1959 to Present—Copernicus Climate Change Service (C3S) Climate Data Store (CDS). 2018. Available online: https://cds.climate.copernicus.eu/cdsapp#!/dataset/reanalysis-era5-single-levels-monthly-means?tab=overview (accessed on 10 March 2022).
  37. Bell, B.; Hersbach, H.; Berrisford, P.; Dahlgren, P.; Horányi, A.; Muñoz Sabater, J.; Nicolas, J.; Radu, R.; Schepers, D.; Simmons, A.; et al. ERA5 Hourly Data on Single Levels from 1950 to 1978 (Preliminary Version)—Copernicus Climate Change Service (C3S) Climate Data Store (CDS). 2020. Available online: https://cds.climate.copernicus.eu/cdsapp#!/dataset/reanalysis-era5-pressure-levels-preliminary-back-extension?tab=overview (accessed on 10 March 2022).
  38. Muñoz-Sabater, J. ERA5-Land Hourly Data from 1950 to 1980—Copernicus Climate Change Service (C3S) Climate Data Store (CDS). 2021. Available online: https://cds.climate.copernicus.eu/cdsapp#!/dataset/reanalysis-era5-land?tab=overview/ (accessed on 10 March 2022).
  39. Muñoz-Sabater, J. ERA5-Land Hourly Data from 1981 to Present—Copernicus Climate Change Service (C3S) Climate Data Store (CDS). 2019. Available online: https://cds.climate.copernicus.eu/cdsapp#!/dataset/reanalysis-era5-land?tab=overview/ (accessed on 10 March 2022).
  40. Muñoz-Sabater, J.; Dutra, E.; Agustí-Panareda, A.; Albergel, C.; Arduini, G.; Balsamo, G.; Boussetta, S.; Choulga, M.; Harrigan, S.; Hersbach, H.; et al. ERA5-Land: A state-of-the-art global reanalysis dataset for land applications. Earth Syst. Sci. Data 2021, 13, 4349–4383. [Google Scholar] [CrossRef]
  41. Ma, Y.; Hu, Z.; Xie, Z.; Ma, W.; Wang, B.; Chen, X.; Li, J.; Zhong, L.; Sun, F.; Gu, L.; et al. A long-term (2005–2016) dataset of hourly integrated land-atmosphere interaction observations on the Tibetan Plateau. Earth Syst. Sci. Data 2020, 12, 2937–2957. [Google Scholar] [CrossRef]
  42. Ma, Y. Long-Term Dataset of Integrated Land-Atmosphere Interaction Observations on the Tibetan Plateau (2005–2016)—National Tibetan Plateau Data Center. 2020. Available online: https://doi.org/10.11888/Meteoro.tpdc.270910 (accessed on 1 March 2022).
  43. Liu, S.; Xu, Z.; Che, T.; Xiao, Q.; Ma, M.; Liu, Q.; Jin, R.; Guo, J.; Wang, L.; Wang, W.; et al. The Heihe Integrated Observatory Network: A Basin-Scale Land Surface Processes Observatory in China. Vadose Zone J. 2018, 17, 180072. [Google Scholar] [CrossRef]
  44. Liu, S.; Xu, Z.; Wang, W.; Jia, Z.; Zhu, M.; Bai, J.; Wang, J. A comparison of eddy-covariance and large aperture scintillometer measurements with respect to the energy balance problem. Hydrol. Earth Syst. Sci. 2011, 15, 1291–1306. [Google Scholar] [CrossRef] [Green Version]
  45. Liu, S.; Che, T.; Xu, Z.; Ren, Z.; Tan, J.; Zhang, Y. Qilian Mountains Integrated Observatory Network: Dataset of Heihe Integrated Observatory Network—National Tibetan Plateau Data Center. 2021. Available online: https://doi.org/10.11888/Geogra.tpdc.271440 (accessed on 1 March 2022).
  46. Shuhai, G. Observation and Simulation of Sublimation/Evaporation at the Top of Midlatitude August-One Glacier, Qilian Mountains. Ph.D. Thesis, University of Chinese Academy of Sciences, Beijing, China, 2019. [Google Scholar]
  47. Allen, R.G.; Pereira, L.S.; Raes, D.; Smith, M. Crop Evapotranspiration-Guidelines for Computing Crop Water Requirements; FAO: Rome, Italy, 1998. [Google Scholar]
  48. Huang, H. Principle and Simulation of Soil-Vegetation-Atmosphere Interaction; China Meteorological Press: Beijing, China, 1997; pp. 66–72.
  49. Penman, H.L. Natural Evaporation from Open Water, Bare Soil and Grass. Proc. R. Soc. Lond. Ser. A Math. Phys. 1948, 193, 120–145. [Google Scholar]
  50. Murray, F.W. On the Computation of Saturation Vapor Pressure. J. Appl. Meteorol. Climatol. 1967, 6, 203–204. [Google Scholar] [CrossRef]
  51. Allen, R. Penman-Monteith equation. In Encyclopedia of Soils in the Environment; Elsevier: Oxford, UK, 2005; pp. 180–188. [Google Scholar]
  52. Brunt, D. Physical and Dynamical Meteorology, 2nd ed; Cambridge University Press: Cambridge, UK, 1952; 428p. [Google Scholar]
  53. Xiaoqing, L. Design and improvement of the experiment for determining air density. Exp. Teach. Appar. 2021, 38, 25–26. [Google Scholar]
  54. Jiumin, Y.; Lili, W.; Haibin, K.; Yuhua, Z.; Jinzhong, L.; Lili, Z. Improvement of air density and gas universal constant measurement experiment. Phys. Exp. 2011, 31, 24–26. [Google Scholar]
  55. Tetens, O. Uber einige meteorologische Begriffe. Z. Geophys. 1930, 6, 297–309. [Google Scholar]
  56. Brown, K.W.; Rosenberg, N.J. A Resistance Model to Predict Evapotranspiration and Its Application to a Sugar Beet Field. Agron. J. 1973, 65, 341–347. [Google Scholar] [CrossRef]
  57. Mann, H. Non-Parametric Test Against Trend. Econometrica 1945, 13, 245–259. [Google Scholar] [CrossRef]
  58. Kendall, M.G. Rank Correlation Methods, 4th ed.; Charles Griffin: London, UK, 1975. [Google Scholar]
  59. Agarwal, S.; Suchithra, A.S.; Singh, S.P. Analysis and Interpretation of Rainfall Trend using Mann- Kendall’s and Sen’s Slope Method. Indian J. Ecol. 2021, 48, 453–457. [Google Scholar]
  60. Jagadeesh, P.; Agrawal, S. Investigation of trends and its magnitude by non-parameteric Mann-Kendall and Sen’s slope methods. Int. J. Hydrol. Sci. Technol. 2015, 5, 83–94. [Google Scholar] [CrossRef]
  61. Sen, P.K. Estimates of the Regression Coefficient Based on Kendall’s Tau. J. Am. Stat. Assoc. 1968, 63, 1379–1389. [Google Scholar] [CrossRef]
  62. Li, Y.; Qin, X.; Liu, Y.; Zizhen, J.; Liu, J.; Wang, L.; Jizu, C. Evaluation of Long-Term and High-Resolution Gridded Precipitation and Temperature Products in the Qilian Mountains, Qinghai–Tibet Plateau. Front. Environ. Sci. 2022, 10, 906821. [Google Scholar] [CrossRef]
  63. Bonshoms, M.; Ubeda, J.; Liguori, G.; Krner, P.; Navarro, L.; Cruz, R. Validation of ERA5-Land temperature and relative humidity on four Peruvian glaciers using on-glacier observations. J. Mt. Sci. 2022, 19, 1849–1873. [Google Scholar] [CrossRef]
  64. Khadka, A.; Wagnon, P.; Brun, F.; Shrestha, D.; Lejeune, Y.; Arnaud, Y. Evaluation of ERA5-Land and HARv2 reanalysis data at high elevation in the upper Dudh Koshi basin (Everest region, Nepal). J. Appl. Meteorol. Climatol. 2022, 61, 931–954. [Google Scholar] [CrossRef]
  65. Shuping, Y.; Yechao, Y.; Shuwen, Z.; Jiuchun, Y.; Wenjuan, W. Spatiotemporal variations of soil freeze-thaw state in Northeast China based on the ERA5-LAND dataset. Acta Geogr. Sin. 2021, 76, 2765–2779. [Google Scholar]
  66. Qing, S.; Sun, X.; Li, Y. Evaluation of ERA5 reanalysis soil moisture over inner mongolia. Sci. Technol. Eng. 2020, 20, 2161–2168. [Google Scholar]
  67. Kai, Z.; Qiong, G.; Zhicai, Z.; Chan, Z. A Calibration problem in applying the Eddy Covariance technique to measure Bowen ratio. J. Beijing Norm. Univ. (Nat. Sci.) 2008, 44, 207–211. [Google Scholar]
  68. Yang, Y.; Chen, R.; Song, Y.; Han, C.; Liu, J.; Liu, Z. Sensitivity of potential evapotranspiration to meteorological factors and their elevational gradients in the Qilian Mountains, northwestern China. J. Hydrol. 2019, 568, 147–159. [Google Scholar] [CrossRef]
  69. Zhuang, Y.; Zhao, W.; Luo, L.; Wang, L. Dew formation characteristics in the gravel desert ecosystem and its ecological roles on Reaumuria soongorica. J. Hydrol. 2021, 603, 126932. [Google Scholar] [CrossRef]
  70. Zhang, Q.; Wang, S.; Yue, P.; Wang, S. Variation characteristics of non-rainfall water and its contribution to crop water requirements in China’s summer monsoon transition zone. J. Hydrol. 2019, 578, 124039. [Google Scholar] [CrossRef]
  71. Uclés, O.; Villagarcía, L.; Cantón, Y.; Lázaro, R.; Domingo, F. Non-rainfall water inputs are controlled by aspect in a semiarid ecosystem. J. Arid. Environ. 2015, 113, 43–50. [Google Scholar] [CrossRef]
  72. Genxu, W.; Guangsheng, L.; Chunjie, L. Effects of changes in alpine grassland vegetation cover on hillslope hydrological processes in a permafrost watershed. J. Hydrol. 2012, 444, 22–33. [Google Scholar] [CrossRef]
  73. Genxu, W.; Shengnan, L.; Hongchang, H.; Yuanshou, L. Water regime shifts in the active soil layer of the Qinghai–Tibet Plateau permafrost region, under different levels of vegetation. Geoderma 2009, 149, 280–289. [Google Scholar] [CrossRef]
  74. Dawen, Y.; Yuanrun, Z.; Bing, G.; Hongyi, L.; Pengtao, Y. Ecohydrological Process and Coupling Simulation in Alpine Mountains; Science Press: Beijing, China, 2020; pp. 1–10. [Google Scholar]
  75. Yongjian, D.; Shiqiang, Z. Study on water internal recycle process and mechanism in typical mountain areas of inland basins, northwest China: Progress and challenge. Adv. Earth Sci. 2018, 33, 719–727. [Google Scholar]
  76. Mcguire, A.D. Environmental Variation, Vegetation Distribution, and Carbon Dynamics in High Latitudes. AGU Fall Meet. Abstr. 2001, 2001, B12F-01. [Google Scholar]
  77. Jorgenson, M.T.; Racine, C.; Walters, J.; Osterkamp, T. Permafrost Degradation and Ecological Changes Associated with a Warming Climate in Central Alaska. Clim. Chang. 2001, 48, 551–579. [Google Scholar] [CrossRef]
  78. Wehren, B.; Weingartner, R.; Schädler, B.; Viviroli, D. General Characteristics of Alpine Waters; Springer: Berlin/Heidelberg, Germany, 2010; pp. 17–58. [Google Scholar]
  79. Uclés, O.; Villagarcía, L.; Cantón, Y.; Domingo, F. Microlysimeter station for long term non-rainfall water input and evaporation studies. Agric. For. Meteorol. 2013, 182, 13–20. [Google Scholar] [CrossRef]
  80. Dongxin, G.; Tieliang, L.; Weixin, Z. General Geocryology; Science Press: Beijing, China, 1988; pp. 60–68. [Google Scholar]
  81. Kuhle, M. The cold deserts of high Asia (Tibet and contiguous mountains). GeoJournal 1990, 20, 319–323. [Google Scholar] [CrossRef]
  82. Körner, C. Alpine Plant Life: Functional Plant Ecology of High Mountain Ecosystems; Springer: Berlin/Heidelberg, Germany, 2003; pp. 103–125. [Google Scholar]
Figure 1. Overview of the Qinghai–Tibet Plateau and the location of nine flux stations.
Remotesensing 14 05815 g001
Figure 2. Flow chart of this study.
Remotesensing 14 05815 g002
Figure 3. Comparison of estimated and measured monthly condensation at the nine flux stations on the QTP.
Remotesensing 14 05815 g003
Figure 4. Comparison of estimated and measured monthly desublimation at the nine flux stations on the QTP.
Remotesensing 14 05815 g004
Figure 5. Comparison of estimated and measured annual condensation, annual desublimation at all flux stations on the QTP.
Remotesensing 14 05815 g005
Figure 6. Spatial distribution characteristics of annual mean condensation, annual mean desublimation and annual total mean condensation and desublimation from 1950 to 2020 and their standard deviations. (a) Annual mean condensation; (b) Annual mean desublimation; (c) Annual mean total condensation (Con) and desublimation (Des); (d) the Standard divisions of annual condensation; (e) the Standard divisions of annual desublimation; (f) the Standard divisions of annual total condensation and desublimation.
Remotesensing 14 05815 g006
Figure 7. Significance and magnitude of the trend of annual condensation, annual desublimation, and annual total condensation and desublimation from 1950 to 2020 based on MK trend test (95% confidence level) and Sen’s slope analysis. (a) Trend test of condensation; (b) Trend test of desublimation; (c) Trend test of total condensation (Con) and desublimation (Des); (d) Sen’s slope of condensation; (e) Sen’s slope of desublimation; (f) Sen’s slope of total condensation and desublimation.
Remotesensing 14 05815 g007
Figure 8. Proportional variations in annual condensation, annual desublimation and annual total condensation and desublimation on the QTP in the last two decades compared to the first two decades, from 1950 to 2020.
Remotesensing 14 05815 g008
Figure 9. Variations of monthly condensation, monthly desublimation, and monthly total condensation and desublimation. (a) Monthly condensation; (b) Monthly desublimation; (c) Monthly total.
Remotesensing 14 05815 g009
Figure 10. Variations of annual condensation, annual desublimation, and annual total condensation and desublimation. (a) Annual variations of condensation and desublimation; (b) Annual variations of the total condensation and desublimation. kC represents the rate of variation in annual condensation, kD represents the rate of variation in annual condensation, and kT represents the rate of variation in annual total condensation and condensation.
Remotesensing 14 05815 g010
Figure 11. Variations in annual mean temperature and annual precipitation, and the correlation between annual condensation, annual desublimation, and annual mean temperature, annual precipitation on the QTP from 1950 to 2020. (a) Annual mean temperature; (b) The correlation between annual condensation and annual mean temperature; (c) The correlation between annual desublimation and annual mean temperature; (d) Annual precipitation; (e) The correlation between annual condensation and annual precipitation; (f) The correlation between annual desublimation and annual precipitation.
Remotesensing 14 05815 g011
Table 1. Meteorological variables required from ERA5-Land and ERA5 reanalysis datasets.
Meteorological VariablesSymbolsUnitsSpatial ResolutionTemporal ResolutionDatasets
2 m temperatureTaK0.1° × 0.1°HourlyERA5-Land
2 m dewpoint temperatureTdK0.1° × 0.1°HourlyERA5-Land
10 m u-component of windum s−10.1° × 0.1°HourlyERA5-Land
10 m v-component of windvm s−10.1° × 0.1°HourlyERA5-Land
Surface pressurePaPa0.1° × 0.1°HourlyERA5-Land
Surface net solar radiationRsJ m−20.1° × 0.1°HourlyERA5-Land
Surface net thermal radiationRtJ m−20.1° × 0.1°HourlyERA5-Land
Skin temperatureTsK0.1° × 0.1°HourlyERA5-Land
Friction velocityu*m s−10.25° × 0.25°HourlyERA5
Total precipitationprem0.1° × 0.1°HourlyERA5-Land
Table 2. Information of the nine flux stations and the required meteorological variables on the QTP.
Station NameLongitudeLatitudeElevationMeteorological
Variables
Temporal ResolutionPeriod
°°m°C, %, W m−2
Nagqu91.9031.374509Ta, RH, λEHourly2005~2016
Qomolangma86.9528.364298Ta, RH, λEHourly2005~2016
Southeast QTP94.7429.773327Ta, RH, λEHourly2005~2016
Ngari79.7033.394270Ta, RH, λEHourly2005~2016
Muztagh75.0338.423668Ta, RH, λEHourly2005~2016
Namtso90.9630.774730Ta, RH, λEHourly2005~2016
Xiyinghe101.8637.563616Ta, RH, λEHalf-hour2016~2020
Jingyangling101.1237.843750Ta, RH, λEHalf-hour2016~2020
Dashalong98.9438.843739Ta, RH, λEHalf-hour2016~2020
Table 3. Parameters for the Penman model and their calculation method.
Model ParametersSymbolsUnitsCalculation MethodsReferences
Slope of saturation vapor pressure curveΔkPa °C−1 Δ = 4098 e s ( 237.3 + T a ) 2 [50,51]
Net radiationRnW m−2 R n = R s + R t [47,52]
Surface soil heat fluxG0W m−2 G 0 = 0.5 R n   ( R n 0 ) [47,52]
Air densityρakg m−3 ρ a = 1.293 P a P a t m 273.15 273.15 + T a [53,54]
Specific heat of air at constant pressurecpJ kg−1 °C−11013 [47]
Saturated vapor pressureeskPa e s = 0.6108 exp ( 17.27 T a 237.3 + T a ) [50,55]
Actual vapor pressureeakPa e a = 0.6108 exp ( 17.27 T d 237.3 + T d ) [50,55]
Aerodynamic resistance of vapor transportram s−1 r a = u 2 + v 2 u * 2 ( 4.87 ln ( 67.8 z 5.42 ) )   ( R n 0 ) [47,52,56]
Height of wind componentzm10[38,39,40]
Psychrometric constantγkPa °C−1 γ = { 0.665 × 10 3 P a   T d > 0 0.588 × 10 3 P a   T d 0 [47,52]
Latent Heat of Vaporization/SublimationλMJ kg−1 λ = { 2.501 ( 2.361 × 10 3 ) T a   T d > 0 2.835 ( 2.361 × 10 3 ) T a   T d 0 [47,52]
Time interval As3600Constant
Water densityρkg m−31000Constant
Publisher’s Note: MDPI stays neutral with regard to jurisdictional claims in published maps and institutional affiliations.

