
Responses of Soil Freeze–Thaw Processes to Climate on the Tibetan Plateau from 1980 to 2016
by
Chunwei Fu
1,2,3, 
Zeyong Hu
1,3,*,
Yaoxian Yang
1,3,
Mingshan Deng
1,
Haipeng Yu
1,3,
Shan Lu
4,
Di Wu
1,2,3 and
Weiwei Fan
1,2,3 1
Key Laboratory of Land Surface Process and Climate Change in Cold and Arid Regions, Northwest Institute of Eco-Environment and Resources, Chinese Academy of Sciences, Lanzhou 730000, China
2
University of Chinese Academy of Sciences, Beijing 100049, China
3
Nagqu Station of Plateau Climate and Environment, Northwest Institute of Eco-Environment and Resources, Chinese Academy of Sciences, Nagqu 852000, China
4
Shaanxi Meteorological Service Center, Xi’an 710014, China
*
Author to whom correspondence should be addressed.
Remote Sens. 2022, 14(23), 5907; https://doi.org/10.3390/rs14235907
Submission received: 31 August 2022
/
Revised: 9 November 2022
/
Accepted: 16 November 2022
/
Published: 22 November 2022
(This article belongs to the Special Issue Land-Atmosphere Interactions and Effects on the Climate of the Tibetan Plateau and Surrounding Regions II)
Abstract
:Soil freeze–thaw processes are remarkable features of the land surface across the Tibetan Plateau (TP). Soil moisture and temperature fluctuate during the freeze–thaw cycle, affecting the soil water and energy exchange between the land and atmosphere. This study investigates variations in the soil temperature, humidity, and freeze–thaw state and their responses to air temperature and precipitation on the TP from 1981 to 2016. Regional simulations of the TP using Community Land Model version 4.5 demonstrate that the climate of the TP has become warmer and wetter over the past 37 years, with increases in both regional average temperature and precipitation. Using empirical orthogonal function analysis and the Mann–Kendall trend test of air temperature, we show that 1980–1998 was relatively cold, and 1999–2016 was relatively warm. Soil temperature and moisture in most areas of the TP were affected by air temperature and precipitation, and both showed an upward trend during the past 37 years. Overall, from 1981 to 2016, the freezing date of the TP has become delayed, the thawing date has been hastened, and the duration of the freeze–thaw state has shortened. The surface soil freezes and thaws first, and these processes pervade deeper soil with the passage of time; freeze–thaw processes have an obvious hysteresis. Precipitation and air temperature had marked effects on the freeze–thaw processes. Higher air temperatures delay the freezing date, hasten the thawing date, and shorten the freeze–thaw period. Areas with the highest precipitation saw late soil freeze, early thaw, and the shortest freeze–thaw duration. Areas with less vegetation froze earlier and thawed later. The freeze–thaw duration increased in the northwest of the plateau and decreased on the rest of the plateau. This article informs research on frozen soil change in the context of global warming.
1. Introduction
With an average elevation of more than 4000 m, the Tibetan Plateau (TP), also known as the “Roof of the World”, lies adjacent to the subtropical zone in the south and approaches mid-latitudes in the north [1,2]. It is the highest plateau on Earth and has the most complicated topology. Owing to its unique geographical position and altitude and the complex underlying surface, the TP creates a unique regional atmospheric circulation; this has a considerable influence on the weather and climate of China, the atmospheric circulation in East Asia, and even the global climate [3,4,5]. Land surface processes are closely related to atmospheric movement and constitute momentum, energy, and water exchange activities between the land and atmosphere. Land surface processes and climate change have a reciprocal relationship. While simultaneously being affected by climate change, the land surface also further influences atmospheric turbulence and ocean movement by participating in land–atmosphere and land–ocean energy and water interactions; these, in turn, have a notable impact on climate change, providing further feedback to influence the land surface [6,7,8,9]. The realistic simulation of land surface processes, particularly the process of hydrothermal transport, is critical for climate change research.
Frozen soil is a major forcing factor on land surface processes and is a highly sensitive indicator of climate change [10]. The substantial warming of the climate over the past few decades has caused a significant increase in surface temperature and a sharp degradation of frozen soil [11,12,13]. Moreover, the accelerated climate change has driven a widespread area expansion of lakes across the Changtang Plateau (CP) and desertification in the northern TP [14,15]. Frozen soil is widely distributed across the planet. According to the duration of freezing, frozen soil can be divided into two types: permafrost and seasonally frozen soil. Currently, permafrost covers 23–25% of the Earth’s land surface, and a further 25% is covered by seasonally frozen soil. The TP contains approximately 2.7 × 10⁶ km2 of frozen soil, with permafrost and seasonally frozen soil covering 1.5 × 10⁶ and 1.2 × 10⁶ km2, respectively [16,17]. Frozen soil has unique hydrothermal characteristics, which play an essential role in land surface processes. The presence of ice in frozen soil renders the process of soil water and heat transfer more complicated; it also affects the infiltration of precipitation, ice melt, and snow melt, which can regulate energy and water circulation between the land and atmosphere. The processes of soil freezing and thawing not only play an important role in the transition between dry and wet seasons on the TP but also greatly affect the exchange of water and energy between the land and atmosphere. Features of the spatiotemporal distribution of temperature and moisture, as well as continual changes in the processes of soil moisture and heat transport, are critical to the alteration of the plateau ecosystem [18,19,20,21]. Furthermore, there is a good correlation between summer precipitation in China and atmospheric circulation on the TP and East Asia [22,23,24].
Soil moisture and temperature are the two core elements of land surface processes. Soil moisture controls the energy–water balance between the land surface and atmosphere; it can affect the surface albedo and heat capacity, with the former regulating the local net radiation flux and the latter affecting heat exchange between the land and atmosphere. Soil moisture also affects surface evaporation and vegetation transpiration, which together determine water vapor and latent heat transport to the atmosphere. Soil temperature directly controls sensible heat transport from the land to the atmosphere and the presence and phase of water in the soil; this, in turn, affects soil moisture and the series of physical and biochemical processes that it controls. Soil moisture and temperature are also the most direct reflections of the freeze–thaw processes on the plateau. Studies have shown that freeze–thaw processes can directly change the hydrothermal properties of the soil, thereby affecting the surface energy budget and hydrological cycle and, further, affecting the exchange of energy and water between the land and atmosphere.
Soil moisture plays an important role in the climate system, second only to sea surface temperature (SST), and its role even exceeds that of SST on land [25]. Evaporation from the land surface accounts for 65% of precipitation on land [26], and soil moisture is one of the key elements that influences evaporation. Changes in surface albedo, heat capacity, and sensible and latent heat delivered to the atmosphere all influence climate change [26,27]. The freeze–thaw processes of soil and the spatiotemporal distribution of soil temperature are notably affected by changes in the soil moisture on the TP [28]. Frozen soil contains nearly twice as much organic carbon as the atmosphere [29]; organic carbon initially trapped in frozen soil will be released into the atmosphere as a result of climate change, enhancing the greenhouse effect. Therefore, the study of the soil freeze–thaw state is of great significance for global climate change.
2. Study Area and Data
2.1. Study Area
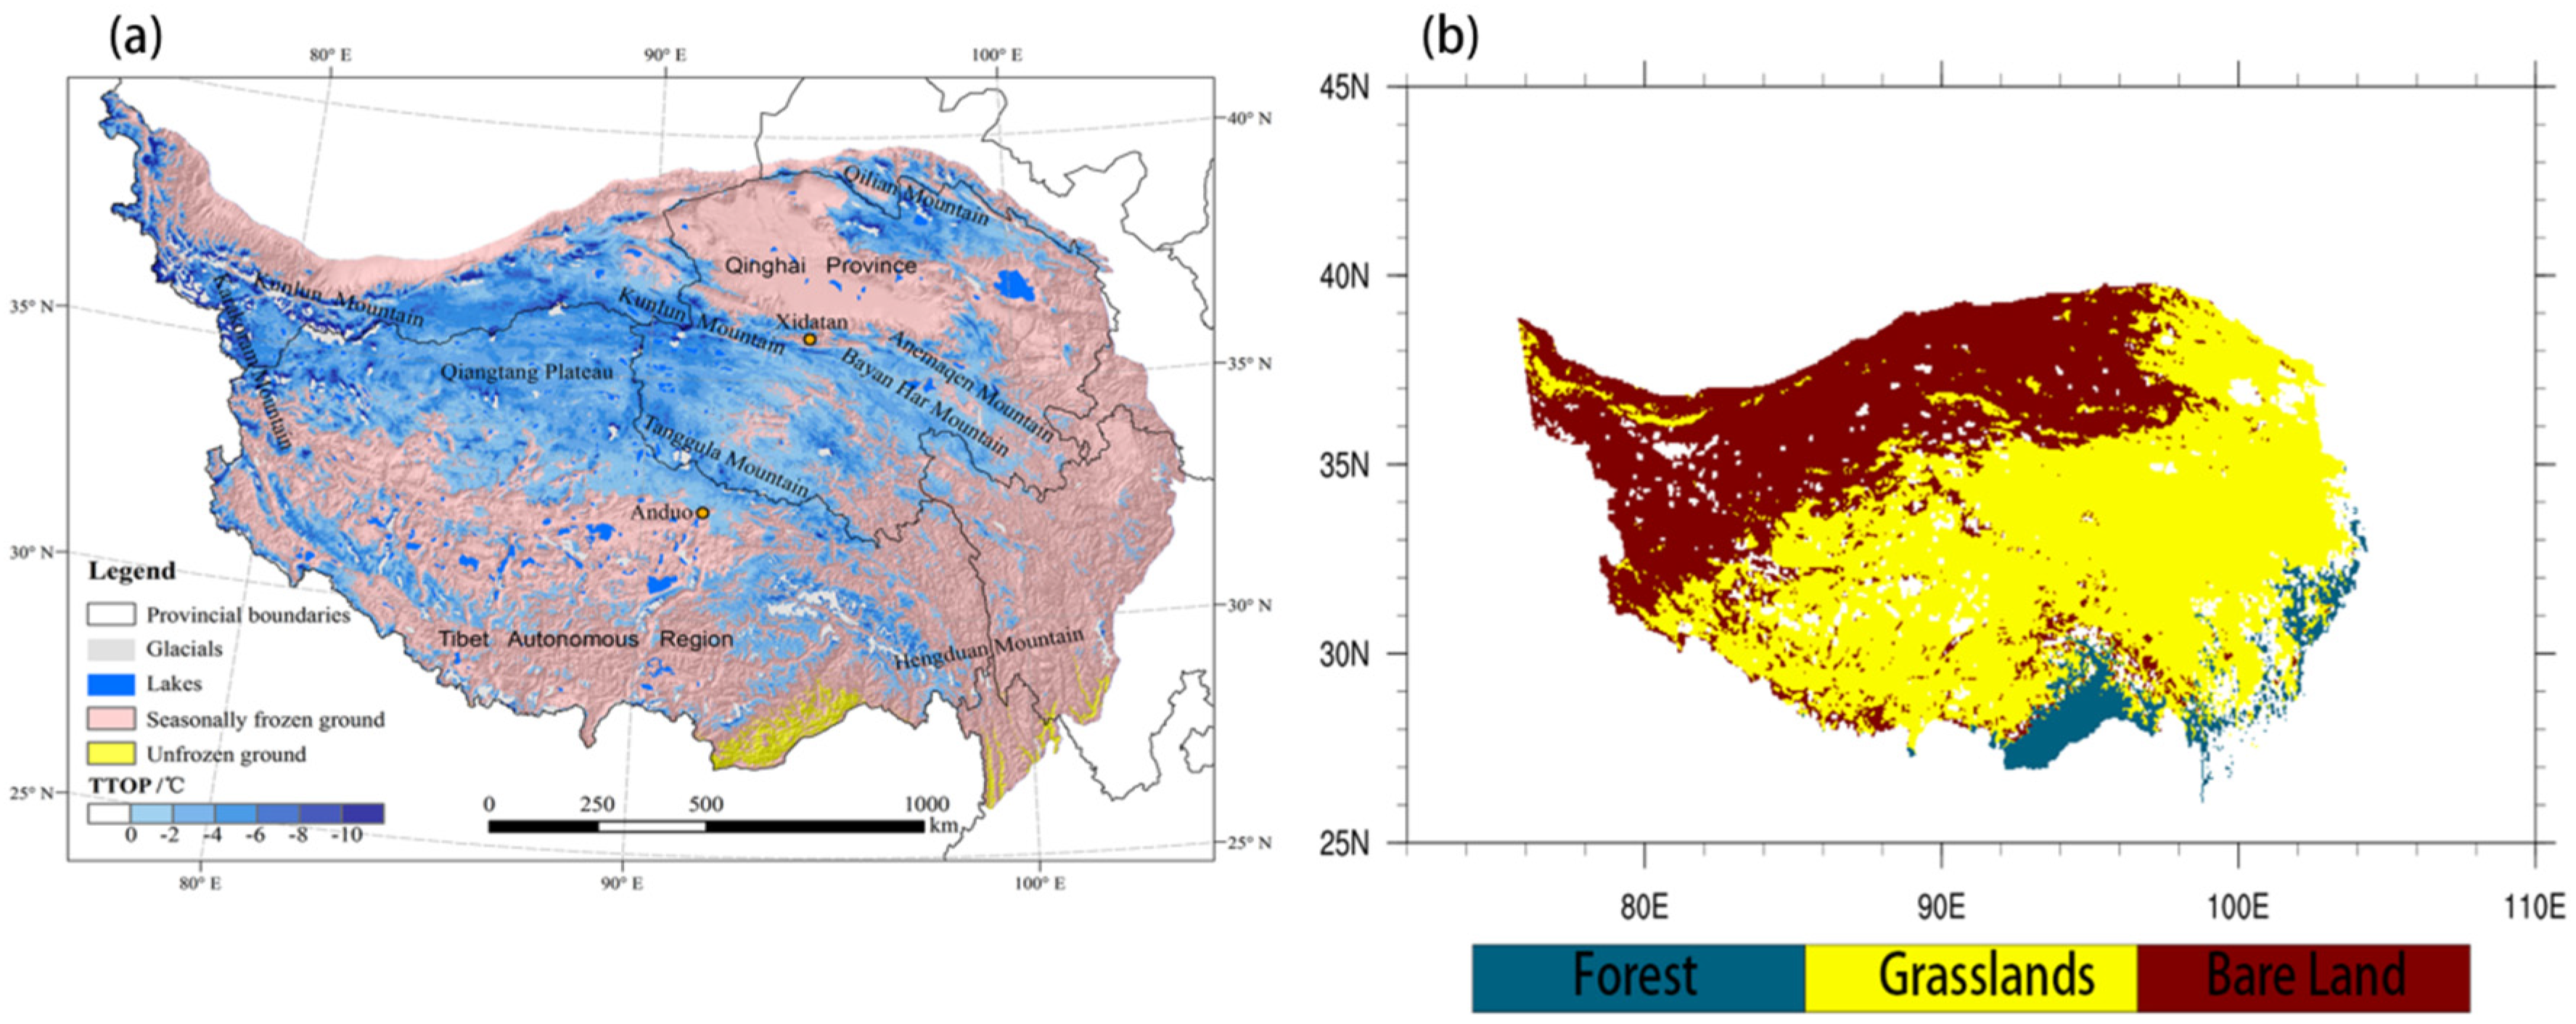
The study area of this paper is the Tibetan Plateau (25°N~40°N, 74°E~104°E). This part of China starts from the Pamir Plateau in the west and the Hengduan Mountains in the east. It spans 31 degrees of longitude and is about 2945 km long from east to west. The width is about 1532 km. The average altitude of the TP is about 4000 m. China is the third-largest country with frozen soil in the world, and its frozen soil is mainly distributed on the TP, which is known as the “third pole in the world”; the spatial distribution of the TP’s permafrost is shown in Figure 1a [30]. In addition, the map of vegetation types is given in Figure 1b.
2.2. Data
Land–cover data. A collection of the 5.1 MODIS land-cover product (MCD12C1) was used in this study for statistical analysis. There were five land–cover classification schemes in this dataset, and the International Geosphere and Biosphere Programme (IGBP), at a spatial resolution of 0.05° from 2001–2008, was developed. This dataset consists of 17 general land–cover types, which include 11 natural vegetation classes, three developed and mosaicked land classes, and three non-vegetated land classes [31,32]. We selected three vegetation types: forest, grassland, and bare land.
Atmospheric forcing data for our study, comprising shortwave radiation, precipitation, pressure, specific humidity, surface air temperature, and wind, were obtained from the China Meteorological Forcing Dataset (CMFD), which was created by the Chinese Academy of Sciences’ Institute of TP Research. This dataset, which was produced by merging a variety of data sources (i.e., remote sensing data, reanalysis data, station data), spans the years 1979–2012 and has a 0.1° spatial resolution and a 3 h temporal resolution. The CMFD has been utilized in many previous studies [33], and its precision has been confirmed to be sufficient for modeling. The data sources used to produce the forcing data include:
- Wind, relative humidity, sunshine duration, air temperature, precipitation, and surface pressure observations from China Meteorological Administration (CMA) weather stations for the years 1980 to 2016; true values of the meteorological parameters calculated using the observed data and radiation data estimated from the observed sunshine duration.
- Tropical Rainfall Measuring Mission (TRMM) satellite precipitation analysis data (3B42) for the years 1998 to 2016 and Global Land Data Assimilation System (GLDAS) precipitation for the years 1980 to 2016.
- GLDAS downward shortwave radiation data for the years January 1980–June 1983 and January 2008–December 2016 and Global Energy and Water Exchanges-Surface Radiation Budget (GEWEX-SRB) downward shortwave radiation data for the years July 1983–December 2007.
- The modern era-retrospective analysis for research and applications (MERRA) surface pressure for the years 1979 to 2015. GLDAS surface pressure data after 2015.
- GLDAS air temperature, wind, and relative humidity data for the years 1979 to 2018.
To investigate the responses of soil freeze–thaw processes to climate change on the entire TP, the atmospheric forcing data from the CMFD on the TP (25°–40°N, 75°–105°E) was used to drive the regional simulation of CLM4.5. We ran CLM4.5 for 37 years from 1980 to 2016, and the spatial resolution of CLM4.5 is 10 km × 10 km.
The observed data. The relevant research is based on field weather station data from the BJ site, Amdo site, and NewD66 site of the Nagqu Plateau Climate and Environment (NPCE) station on the TP. The location of the BJ site is 31.37°N, 91.90°E, the Amdo site is 32.24°N, 91.62°E, and the NewD66 site is 35.43°N, 93.59°E.
3. Methods
3.1. Model Description
The land surface process model utilized in this study was the Community Land Model (CLM) version 4.5 [34], which is the land surface module of the Community Earth System Model (CESM) developed by the National Center for Atmospheric Research (NCAR). The CLM is currently one of the most widely used land surface process models; it includes biogeophysical processes, hydrological cycle processes, surface heterogeneity, dynamic processes of the biological system, and biochemical processes, among others. Compared with the previous version, CLM4.5 has expanded the performance of the model, updated the atmospheric and surface forcing datasets, added the concept of surface water storage, replaced the original wetland unit of the model, adjusted the photosynthetic parameters, and improved some parameterization schemes. Improvements to the frozen soil water conduction parameterization scheme [35,36,37], as well as changes to the plant canopy radiation scheme, mean that CLM4.5 can better simulate water and heat transfer processes within the soil.
The simulation of soil temperature is related to the surface energy balance equation; the equation describing the surface energy balance in CLM4.5 is:
where is the heat flux entering the soil (W/m2); is the solar short-wave radiation absorbed by the surface (W/m2); is the long-wave radiation absorbed by the surface (W/m2, defined with upwards being the positive direction); is the surface sensible heat flux (W/m2); and is the surface latent heat flux. The heat that enters the soil from the atmosphere is determined by the net surface radiation and surface sensible and latent heat; in turn, the surface sensible and latent heat are determined by the difference in temperature and humidity between the land and atmosphere. Precipitation affects changes in surface temperature. The simulation of soil temperature is, thus, related to both air temperature and precipitation.
In CLM4.5, the change in soil moisture with time is calculated by the surface water balance equation:
where is soil moisture (mm); t is time (s); is precipitation rate (mm/s); is evapotranspiration (mm/s); and is surface runoff (mm/s). The strength of evaporation depends on the temperature. Runoff is affected by precipitation and the water-holding capacity of the soil. Hence, changes in soil moisture are also related to temperature and precipitation [38,39].
To better analyze the characteristics of freeze–thaw processes based on soil temperature, the soil temperature simulated by the CLM4.5 was validated by the observation data of three field sites. The correlation between the simulated soil temperature values and the observed values can reach more than 90% (Figure 2); in other words, the reliability of the results by CLM4.5 simulation was validated, so the CLM4.5 model simulation results was used to analyze freeze–thaw processes in this paper.
3.2. Empirical Orthogonal Function (EOF) Analysis
Empirical orthogonal function analysis is a common method in meteorology, which has fast convergence and a good reflection of the basic structural characteristics of meteorological elements. In this paper, the EOF analysis method was used to study the spatiotemporal distribution characteristics of temperature on the TP. The original meteorological data were projected on an orthogonal basis in the EOF analysis. In addition, the orthogonal basis was calculated using the eigenvector of the spatially weighted anomaly covariance matrix, with the associated eigenvalues reflecting the percentage variance explained by each pattern. As a result, the EOFs of spatiotemporal physical processes can reflect mutually orthogonal spatial patterns in the data change set, with the first pattern accounting for the majority of the variance, the second pattern accounting for the majority of the residual variance, and so on. We selected the matching principal component (PC) of the dominant mode as the reference time series for air temperature, because the PC of an EOF mode illustrates how the spatial pattern of this mode oscillates over time.
In this paper, the CMFD data was used to force CLM4.5 to simulate soil temperature and moisture on the Tibetan Plateau from 1980 to 2016, empirical orthogonal function analysis and the Mann–Kendall trend test of air temperature were used to divide the 37 years of TP into different climate situations, and the characteristics of freeze–thaw processes based on soil temperature were analyzed.
4. Results
4.1. Regional Climate Change on the TP
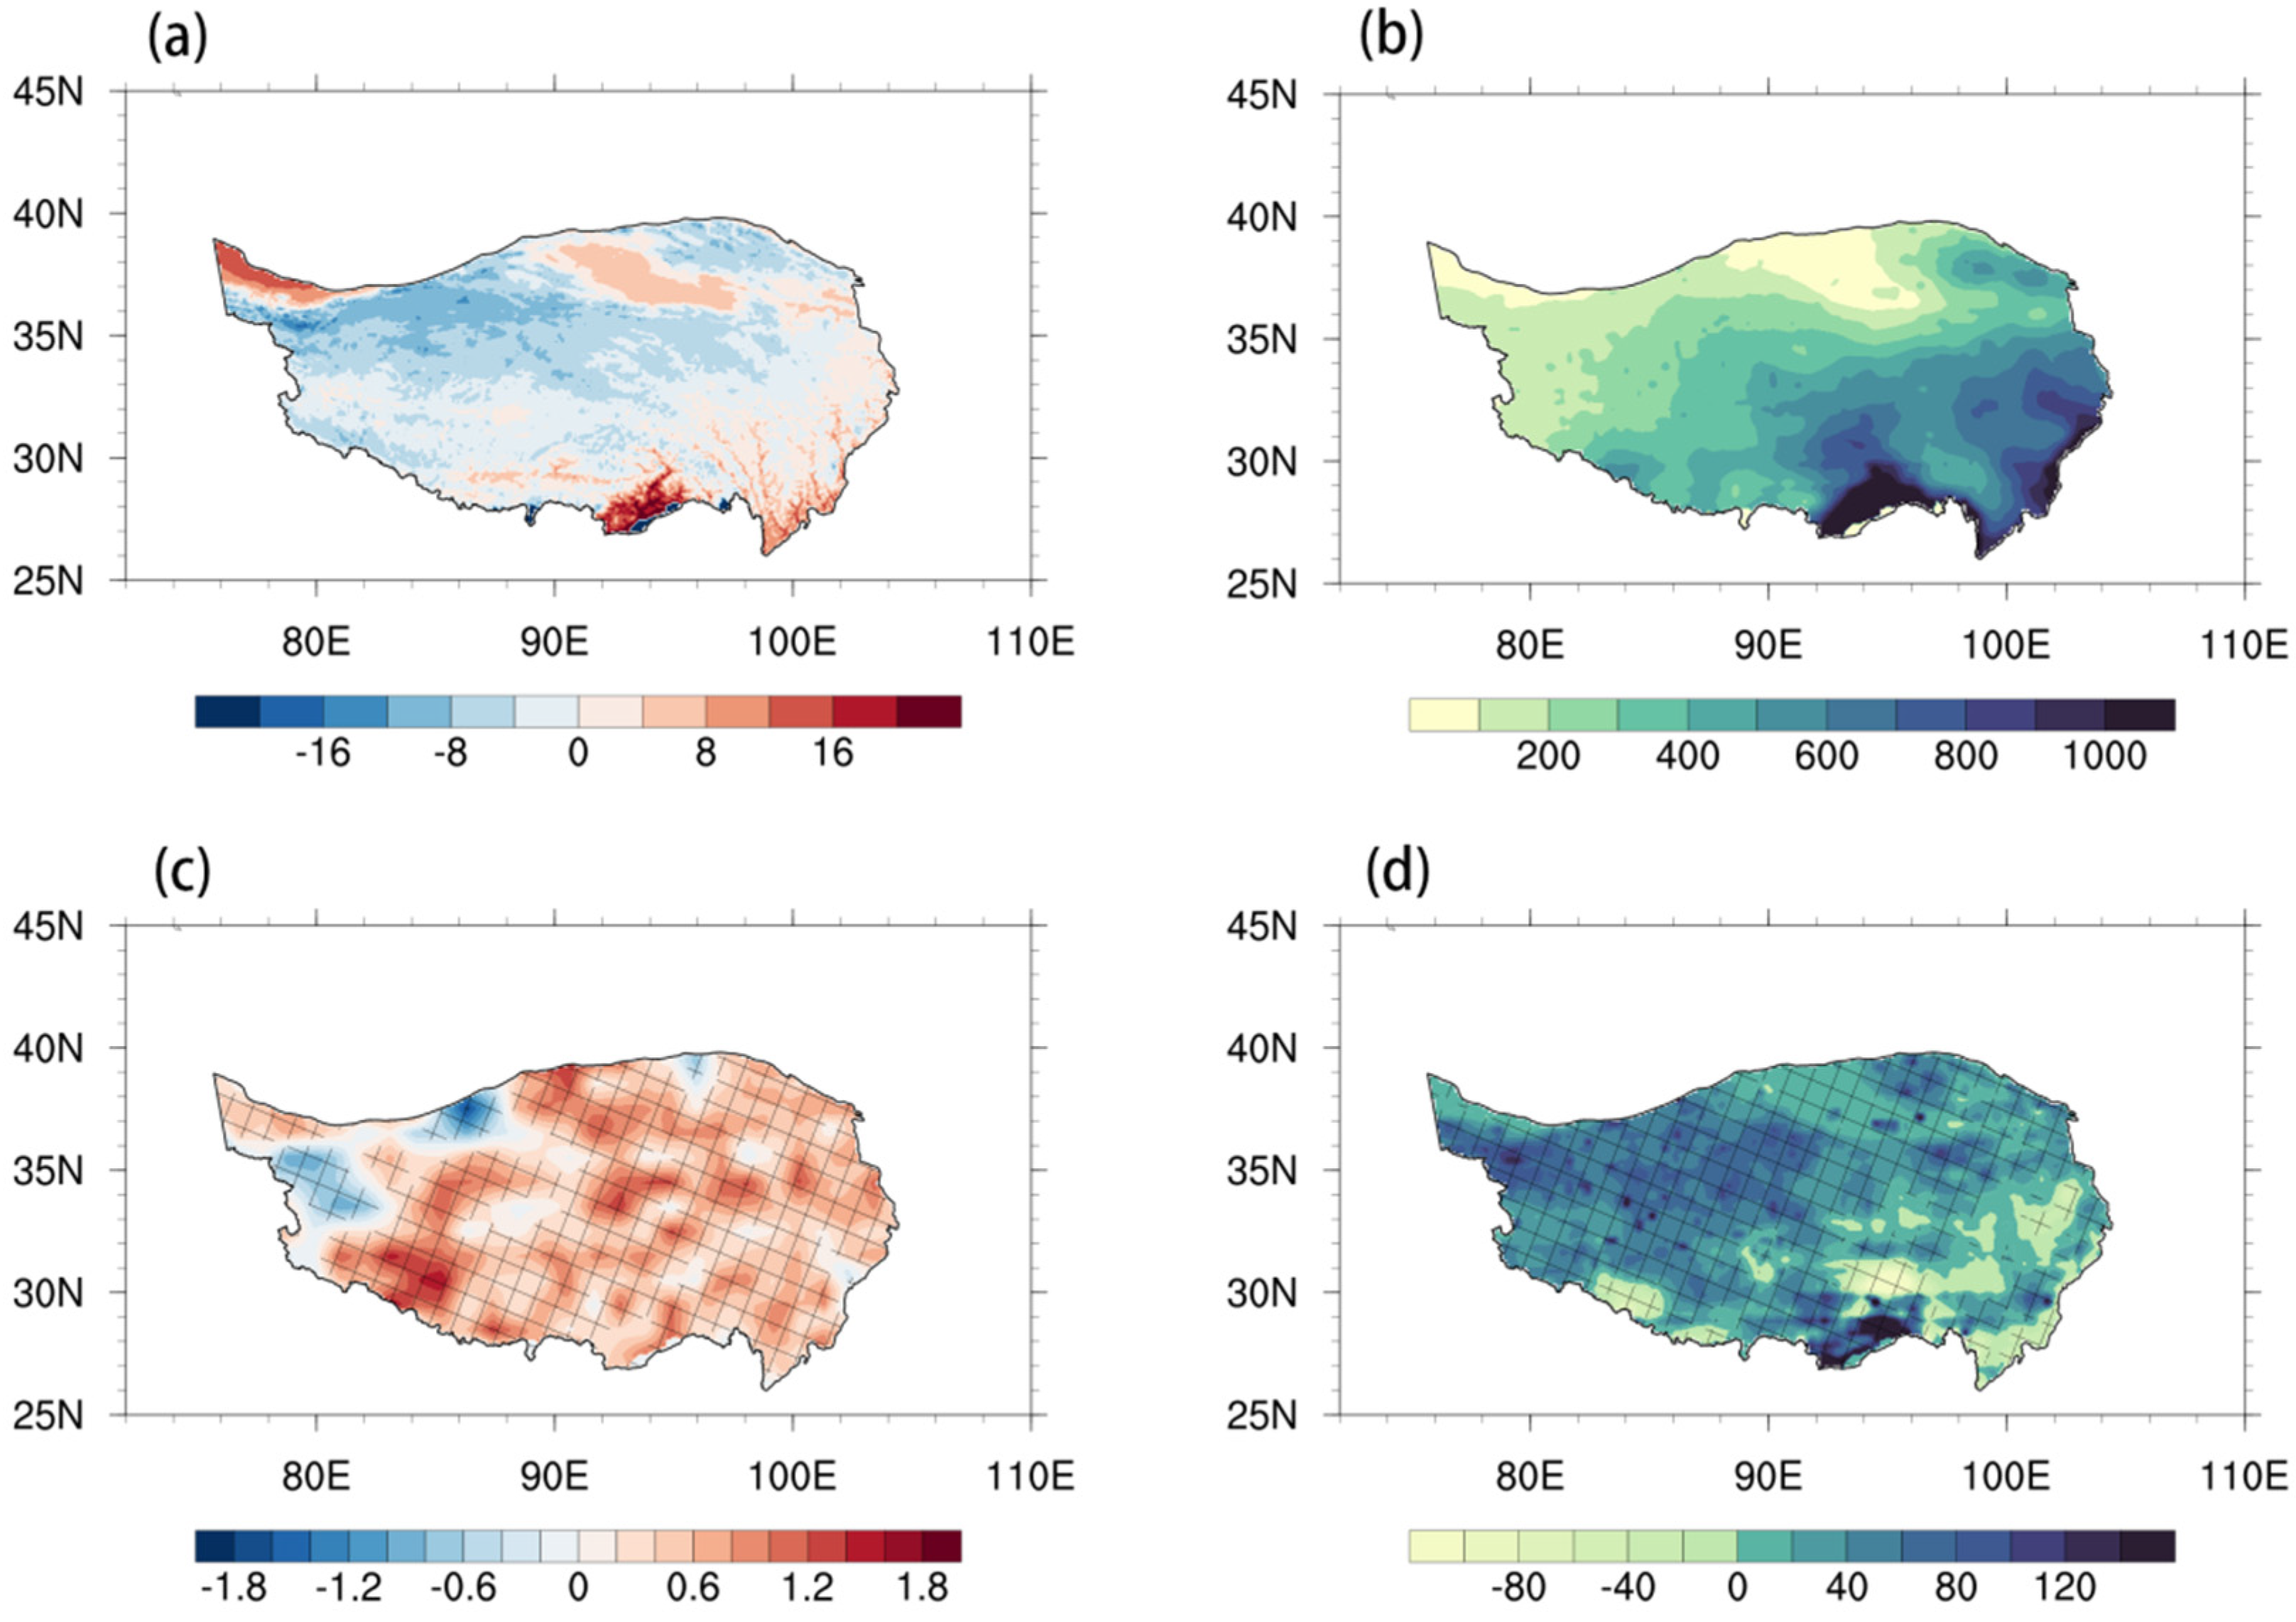
The CMFD provided temperature and precipitation data from 1980 to 2016, which were used to calculate the climatology and the trends of temperature and precipitation (Figure 3). The climatology of regional average temperature and precipitation is −0.15 °C and 465.14 mm, respectively, and their regional average trend is 0.41 °C/decade and 6.44 mm/decade, respectively. The regional distributions of precipitation and temperature are similar, as the monsoon advances, with values roughly increasing gradually from the northwest to the southeast of the TP. The southeast region of the TP has the highest annual average temperature and the most annual average precipitation; moreover, high temperature and low precipitation occur in the Qaidam Basin. The trends of temperature and precipitation show that the temperature and precipitation in most parts of TP have increased significantly in the past 37 years as a result of global warming, though the temperature in the Karakoram area has a decreased trend, and, at the same time, precipitation has increased in this area. The Karakoram Mountains have always been the focus of scientists due to their unusually stable glaciers. According to a study published in Nature Geoscience, the glaciers in the Karakoram Mountains have risen rather than reduced during the last 10 years, which contradicts the global trend of glacial melting [40]; the combination of temperature and precipitation trends may be the cause of this phenomenon.
To identify the change characteristics of the annual average temperature, EOF analysis was performed using the air temperature data and was carried out on the covariance matrix. The spatial pattern of the first dominant mode (EOF1) is depicted in Figure 4a, which was created using the air temperature data. The spatial distribution of EOF1 is marked by consistent variations in temperature in the entire TP, with an explained variance of 50.7%. The corresponding normalized PC1 shows that the temperature has changed with time, with a significant increase since 1980. The Mann–Kendall trend test was conducted on the average temperature of the TP from 1980 to 2016 and showed that the obvious warming of the TP after the 1990s was an abrupt phenomenon, and the average temperature mutational change occurred in 1998 (Figure 4c). Therefore, according to the time when this mutational change occurred (1998), the average temperature of the TP was divided into two sections for discussion; the years from 1980 to 1998 were relatively cold (hereafter RC), and the years from 1999 to 2016 were relatively warm (hereafter RW).
4.2. Responses of Soil Temperature and Moisture
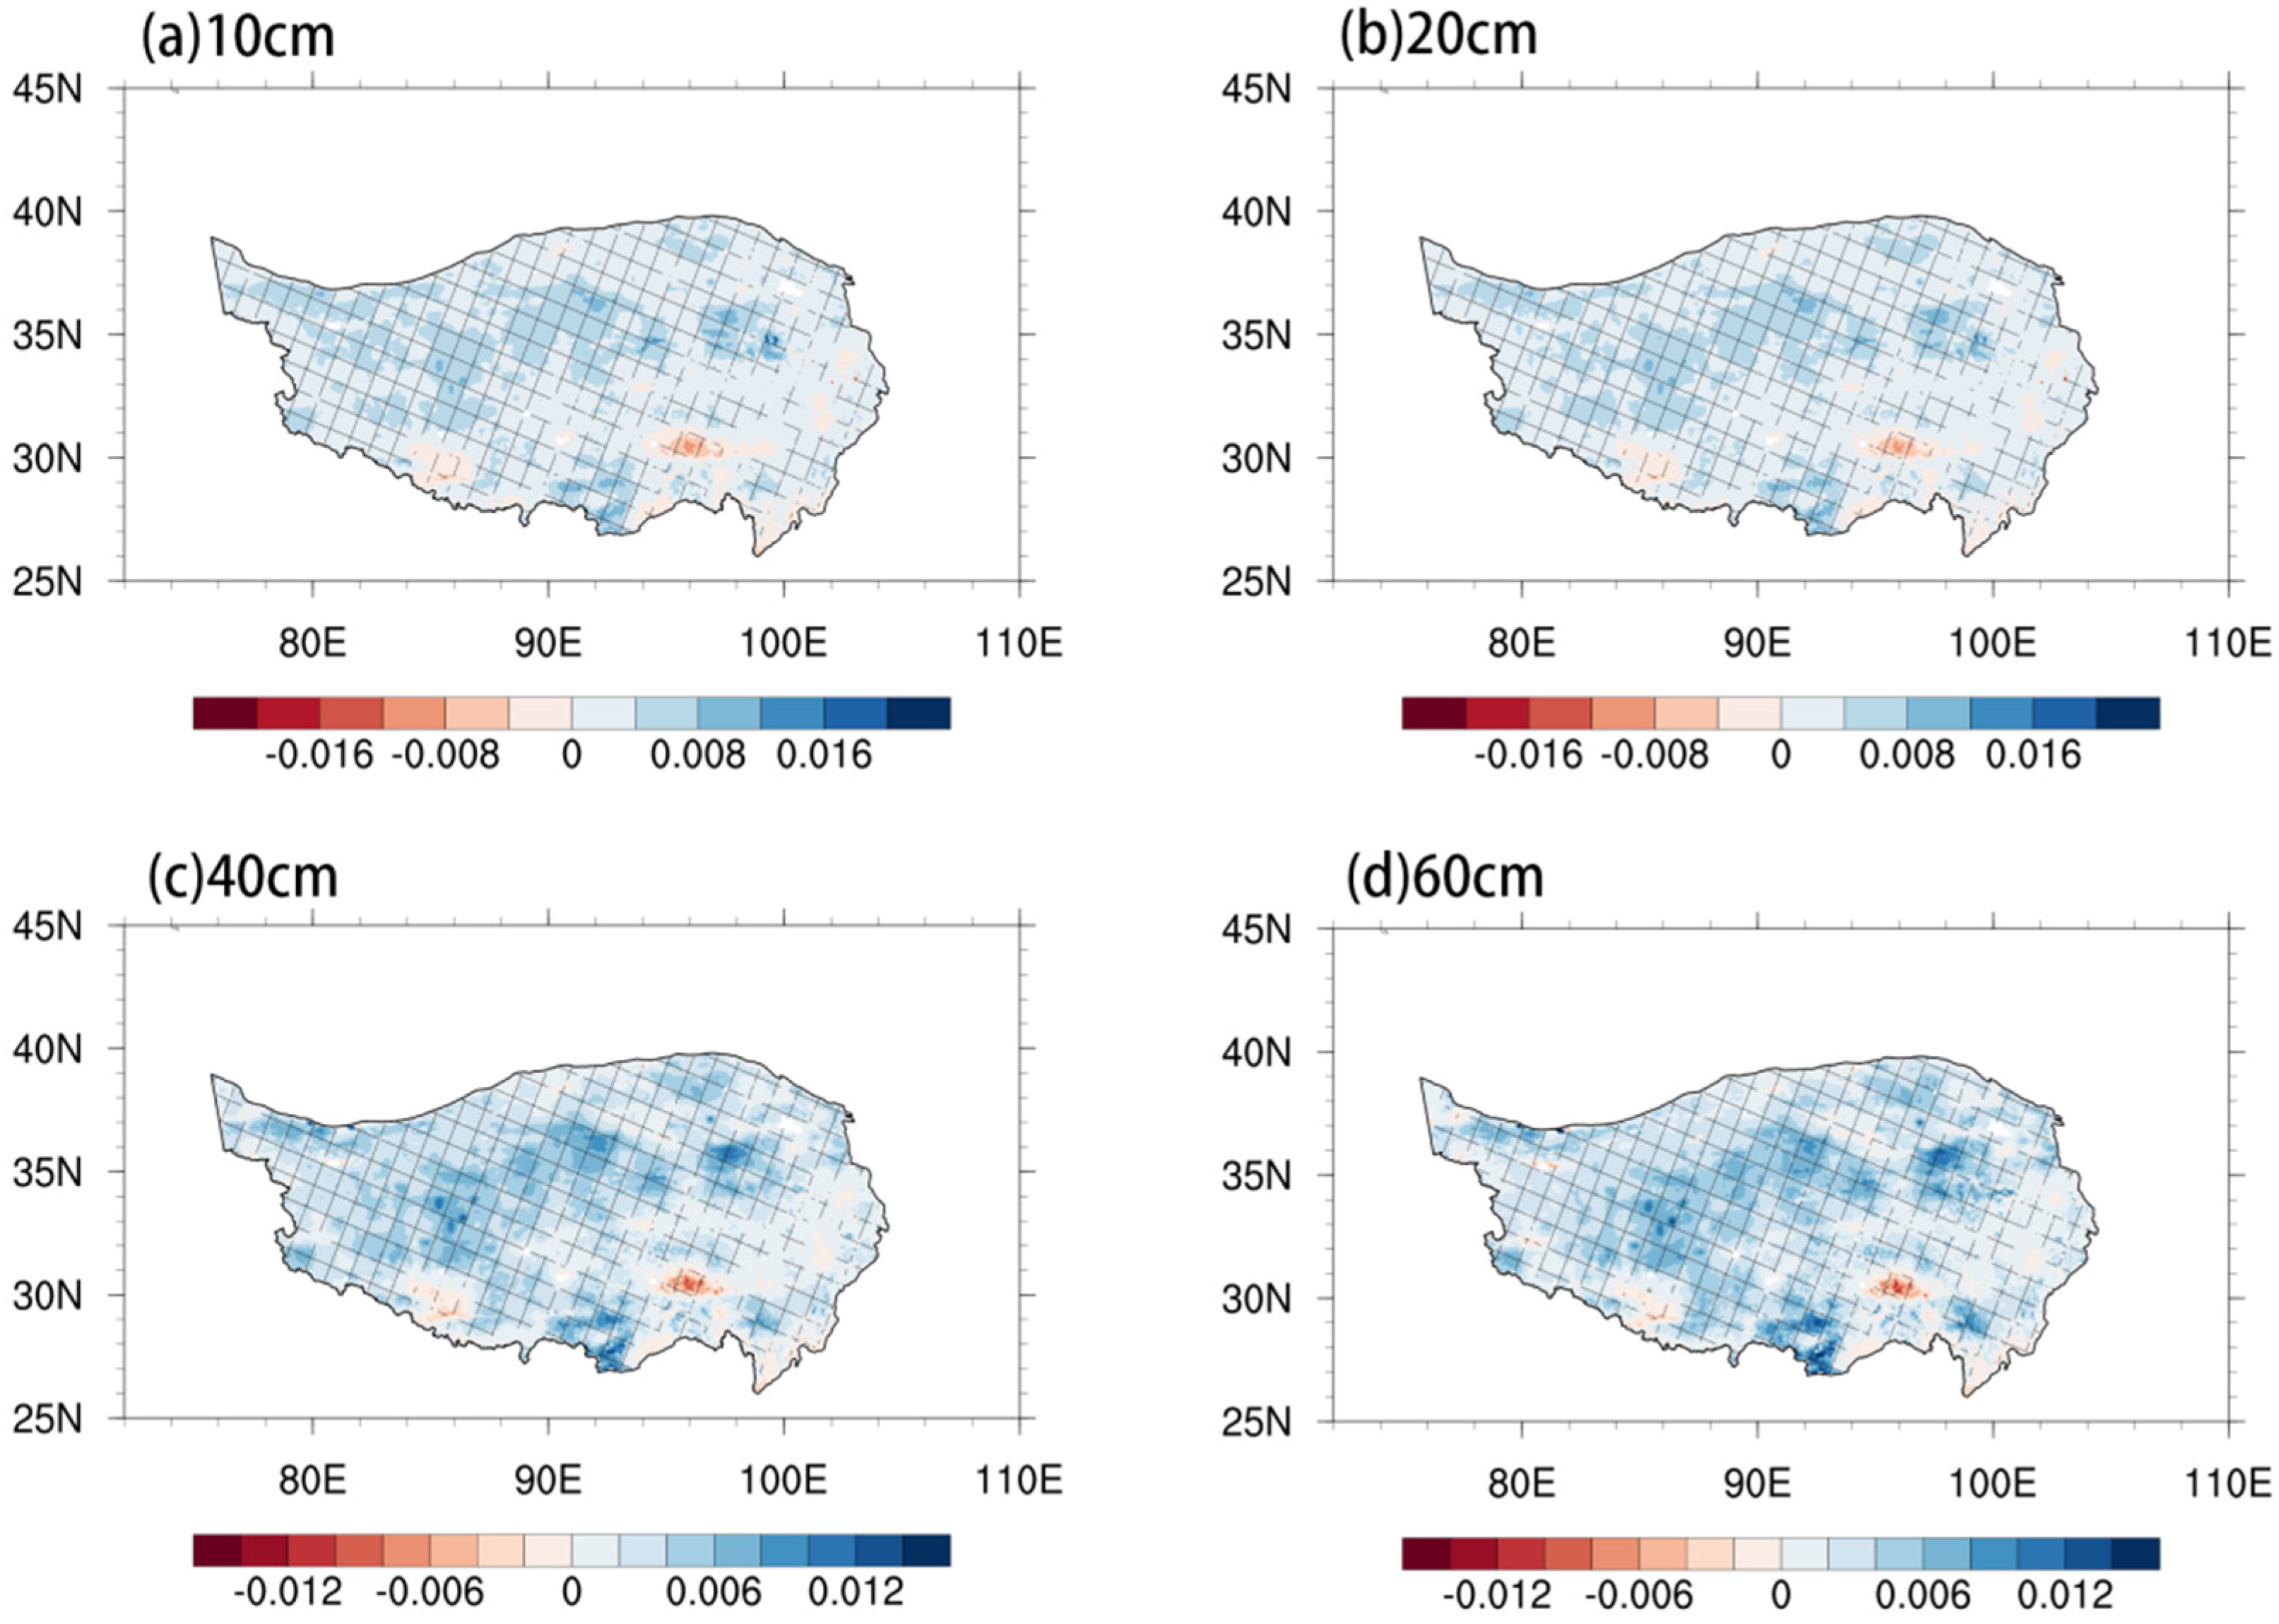
As shown in Figure 5 and Figure 6, on average, both the soil temperature and soil moisture across most parts of the TP have increased between 1980 and 2016. The trend in soil temperature is closely related to that in air temperature. The trends in soil temperature and moisture at different soil depths across the TP are essentially the same. In areas where the air temperature has risen, the soil temperature has also risen, indicating that soil temperature is directly affected by the air temperature. The average soil temperature trends at soil depths of 10, 20, 40, and 60 cm were 0.294, 0.291, 0.287, and 0.282 °C/decade, respectively. The average soil moisture trends at soil depths of 10, 20, 40, and 60 cm were 0.00241, 0.00242, 0.00250, and 0.00265 m3·m−3/decade, respectively. With an increase in soil depth, soil temperature increased at a lower rate, while soil moisture increased at a slightly higher rate, indicating that the shallow soil temperature is more susceptible to air temperature. The trend seen in soil moisture is roughly the same as that seen in precipitation. In areas where precipitation has increased, soil moisture has also tended to increase; where precipitation has decreased, soil moisture has also decreased, indicating that changes in soil moisture are affected by precipitation. In the northern part of the TP, the soil has become noticeably wetter, while in some parts of the southern TP, soil moisture has noticeably decreased.
To better study the influence of air temperature on soil temperature, soil moisture, and freeze–thaw processes, Figure 7 shows comparisons of the annual average soil temperature between RW (from 1999 to 2016) and RC (from 1980 to 1998); the average soil temperature differences, at depths of 10, 20, 40, and 60 cm between RW and RC, were 0.568, 0.562, 0.555, and 0.546 °C, respectively. The soil temperature differences across most of the TP were positive (and above 0.5 °C) at all four depths, but the differences in the northwestern TP were negative. In addition, the maximum difference was found in the southwest, indicating that the soil temperature in this region is most sensitive to changes in air temperature. As the soil depth increased, the difference in soil temperature decreased slightly. The spatial distribution of the difference in soil temperature is consistent with the temperature trend. On the one hand, this shows that shallow soil will be affected by the air temperature, to a certain extent; on the other hand, it shows that the vertical gradient in soil temperature is not obvious, and temperature changes are not sensitive to changes in depth. Figure 8 depicts the differences in annual average soil moisture between RW and RC; at depths of 10, 20, 40, and 60 cm, these differences were 0.00586, 0.00584, 0.00591, and 0.00611 m3/m3, respectively. As the soil depth increased, the vertical change in soil moisture is not obvious, and the difference value increased slightly. In terms of the type of land cover, the soil in alpine steppe areas was considerably wetter than that in alpine meadow and alpine desert areas.
4.3. Responses of Soil Freeze–Thaw Processes to Climate
To analyze the characteristics of freeze–thaw processes, this study divided the soil state into two periods: frozen and unfrozen. To consider a complete freeze–thaw cycle, we adjusted the data to start on 1 September. The criteria for judging whether a freeze–thaw occurred were as follows: (a) if the soil temperature was below 0 °C for five consecutive days, the current time was regarded as the beginning of the freezing period; (b) if the soil temperature was above 0 °C for five consecutive days, the current time was regarded as the end of the freezing period. The freezing date means the start date of the freezing season, and the thawing date is the end date of the freezing season.
As can be seen from Figure 9 and Table 1, over the past 37 years, the multi-year means of the freezing and thawing dates at the four soil depths were delayed with increasing soil depth; the shallow soil of the TP began to freeze from early November, while the soil at a 60 cm depth was frozen, on average, for 84.16 days after 1 September. The soil at 10 cm depth started to thaw in early April, on average, while the soil at s 60 cm depth began to thaw approximately 20 days later. On the entire TP, the surface soil freezes and thaws first, and these processes pervade deeper soil layers as time goes by; these freezing and thawing processes have an obvious hysteresis. Since the average freezing and thawing times of each layer are both delayed with increasing soil depth, the average period over which the soil remains frozen is similar, ranging from 144 to 146 days. The spatial distributions of the soil freeze–thaw processes in each layer also reflect the characteristics of air temperature distribution. Where temperatures were high, each layer of the soil froze later and thawed earlier. We can see in the northeast of the TP—the Qaidam Basin, the freezing date was later than that of the surrounding area, the thawing date was earlier than that of the surrounding area, and the freeze–thaw duration was shorter than that of the surrounding area. The most likely reason for this phenomenon is mainly due to the drought and little rainfall in this area, as the soil is dominated by sandy soil, the vegetation is relatively sparse, and the coverage rate is low.
As shown in Figure 10 and Table 2, across most of the TP, all soil layers exhibited that the freezing date moved later from 1980 to 2016. On average, the decreasing trend was >2 days decade−1, and the trend was more pronounced in deeper soil layers. Meanwhile, there were also delaying trends in thawing date and freeze–thaw duration, with these change trends being less pronounced in deeper soil layers. As the global climate changed, the freeze–thaw processes also changed dramatically, especially in shallow soils. The thawing date varied more significantly than the freezing date, which also explains changes in the duration of frozen soil. In the Karakoram Mountains and parts of the Qiangtang Plateau, the freezing date has tended to advance (i.e., the soil freezes earlier in the year), while the rest of the plateau essentially shows a delayed trend; the thawing date in the two aforementioned regions has tended to be delayed, while the thawing date of the rest of the plateau has advanced. Therefore, the freeze–thaw duration of each layer of soil in the northwestern part of the TP has increased, while the permafrost in the rest of the region has declined.
Figure 11 and Table 3 illustrate the differences in annual average soil freeze–thaw processes between the RW and RC periods. Air temperature was one of the most important factors affecting the freeze–thaw processes on the TP. In recent decades, a clear signal of elevation-dependent warming (EDW) of the air temperature has been observed on the TP, based on observational and satellite data [41,42,43]. The decrease in maximum freezing depth with elevation is a reaction to the EDW of the air temperature. The freezing dates of soil at depths of 10, 20, 40, and 60 cm were 3.87, 3.70, 4.28, and 4.41 days, respectively, while their thawing dates were −5.76, −5.22, −3.76, and −3.39 days, respectively; hence, their freeze–thaw durations were −9.54, −8.92, −8.05, and −7.80 days, respectively. The effect of air temperature on freeze–thaw processes can, thus, clearly be seen. The spatial distribution of freeze–thaw processes between the RW and RC periods is similar to that shown in Figure 10; shallow soils are more susceptible to climate change, and their changes are more dramatic.
Satellite data (satellite-based 2 m air temperature (SBAT), Moderate Resolution Imaging Spectroradiometer (MODIS)-based LST, snow cover, and daytime/nighttime cloud extent) indicate that the annual mean 2 m air temperature above 4500 m on the TP rapidly declined between 2001 and 2015 [44]. As a result, long-term freeze–thaw trends are complicated, because other local parameters play important roles; in addition to changes in air temperature, precipitation is another important meteorological element. To better study the effect of precipitation on freeze–thaw processes, we divided the TP into climate zones according to average annual precipitation. Areas with annual precipitation <200 mm were classified as arid areas, those between 200 and 400 mm as semiarid, those between 400 and 800 mm as subhumid, and those >800 mm as humid. Figure 12 shows the climate zones on the TP. The average annual precipitation decreases sequentially from southeast to northwest, while its spatial distribution of values is similar to that of soil temperature and soil moisture.
As shown in Figure 13, each layer of soil has specific freeze–thaw characteristics; that is, with an increase in soil depth, there are changes in the freezing date, thawing date, and freeze–thaw duration, which can reflect the hysteresis of freeze–thaw processes. There are obvious differences between the climate zones, notably in humid areas. Areas with the least precipitation freeze first, and other areas freeze sequentially, mirroring increases in the average annual precipitation. On average, the soil at a 10 cm depth in arid areas began to freeze at the end of October, while soil at a 60 cm depth in humid areas began to freeze in mid-December; freezing started much later in humid regions than in other regions. The soil in humid areas began to thaw in mid-March, while soil at a 60 cm depth in the rest of the regions began to melt at the end of April. Humid regions also have a much shorter freeze–thaw duration than other regions, with the freeze–thaw duration of every soil layer being over 40 days less than in other areas. Hence, the effect of precipitation on freeze–thaw processes is very clear.
As shown in Figure 14, the soil freeze–thaw processes of the underlying surface of different vegetation types are very different, so we can also see the hysteresis of soil freeze–thaw processes with increasing soil depth. Compared with the underlying surface of other types of vegetation, the soil underlying the surface of the forest froze the latest, began to thaw the earliest, and had the shortest freeze–thaw duration. The freeze–thaw duration of the bare land underlying the surface of each layer of soil was more than one month longer than that of the underlying surface of the forest. Different vegetation types have a great influence on soil freeze–thaw processes. The soil freeze–thaw processes of the underlying surface of the bare land were more sensitive to climate change.
5. Discussion
Freeze–thaw processes on the TP have a considerable influence on both regional and Asia-wide climate. Therefore, it is critical to understand and forecast such freeze–thaw processes. This study first investigated the characteristics of the temperature-dominant mode using data from 1980 to 2016. According to EOF analysis, a pattern of interdecadal increase in air temperature has emerged over almost all of the TP between 1980 and 2016. According to the latest publication from the Intergovernmental Panel on Climate Change’s Sixth Assessment Report Working Group I, the global climate has warmed significantly over the last century (since 1850–1900); the average global surface temperature has risen by approximately 1 °C, and the average temperature rise over the next 20 years is expected to approach or surpass 1.5 °C [45]. Changes in the environment, such as permafrost, glacier, and ice cap melting, are expected to be exacerbated as a result of global warming, and this will have an impact on human existence. There are also substantial differences in the responses of different underlying substrates to global warming. Arctic sea ice and permafrost are particularly sensitive to a warming climate. The soil at various depths also has a clear warming tendency under a background of rising air temperature. Previous research has demonstrated that the warming trend of soil temperature in each layer was more significant in western China from 1980 to 2017 than before 1980 [46]. Changes in the features and spatial distribution of permafrost have been caused by the influence of global warming and human activities in recent years, manifesting as the elevation of permafrost’s lower limits, rising ground temperature, and thickening of the active layer. Permafrost has been diminished in certain areas, resulting in seasonally frozen soil. Nearly half of the permafrost on the TP will be reduced to seasonally frozen soil by the end of the century under the Representative Concentration Pathway 4.5 (RCP 4.5) emissions scenario [47]. The maximum freezing depth and freeze–thaw duration of seasonally frozen soil in western China have shown downward trends in recent decades as a result of climate change, whereby there have been delayed freezing start dates and early melting end dates [48]. Before soil freezes, soil moisture exists in the form of liquid water, which is conducive to water transmission, and surface soil moisture is transported upwards in the form of liquid or vapor; precipitation will directly change the value of soil moisture, causing surface sensible and latent heat by affecting surface albedo; energy and water exchange between the earth and atmosphere is relatively frequent at this time. When soil freezes, moisture in the soil freezes into ice, and the amount of liquid water in the soil reduces dramatically, making soil moisture transport difficult. As shown herein, freeze–thaw processes vary with air temperature and precipitation. Indeed, the two most important factors impacting freeze–thaw processes on the TP are air temperature and precipitation. Freeze–thaw process trends are complicated, because other local elements or parameters play important roles, in addition to changes in air temperature and precipitation. Hence, further research into how freeze–thaw processes respond to climate change is required.
Frozen soil is a kind of soil that is very sensitive to temperature and is extremely unstable [49]. As the global temperature increases, the exchange process between the surface and the atmosphere of energy, water, soil temperature, etc., rises, and the ice melts, the soil moisture increases, the freezing date is delayed, the thawing date is advanced, and the freeze–thaw duration is shortened; the freezing–thawing process significantly affects the energy balance and water cycle of the soil surface through water phase transformation [50,51]. In addition, the abnormal soil moisture caused by snowmelt and the thawing process has an impact on summer precipitation in eastern China [52]. The multi-process interaction and complex influence mechanism of hydrothermal elements and vegetation activities have formed obvious regional differentiation characteristics. Moreover, areas with lush vegetation generally have more precipitation and higher temperatures.
6. Conclusions
On the basis of the remote sensing data and CLM4.5 model simulation results, this study investigated the main modes of air temperature on the TP, as well as the spatiotemporal distribution and changing trends in air temperature and precipitation. In addition, the characteristics of freeze–thaw processes and their response to climate change were also studied. The main conclusions are as follows:
- The climate of the TP has become warmer and wetter over the past 37 years; the rates of the increase in regional average temperature and precipitation were 0.41 °C/decade and 6.44 mm/decade, respectively. As the monsoon moved forward, the regional distributions of precipitation and temperature were similar, with values steadily rising from the northwest to the southeast of the TP. We depicted the spatial pattern of the first dominant mode (EOF1), which was created using air temperature data. The spatial distribution of EOF1 was marked by consistent variations in temperature on the whole TP; the years from 1980 to 1998 were relatively cold, and the years from 1999 to 2016 were relatively warm.
- Soil temperature and moisture across most parts of the TP showed an increasing trend. Soil temperature and moisture were shown to be affected by air temperature and precipitation.
- Surface soil was first to freeze and thaw on the TP; freezing and thawing then pervaded deeper soil as time passed, with an obvious hysteresis in the freeze–thaw cycle. On average, the four analyzed layers of soil on the TP began to freeze in November and began to thaw in April. The mean freeze–thaw duration of these four layers of soil was 144–146 days. Between 1980 and 2016, the freezing date of each soil layer in most regions of the TP has moved later in the year, with an average rate of >2 days decade−1. Meanwhile, the thawing date has moved earlier in the year, and the freeze–thaw duration has declined.
- Areas with the least amount of precipitation were the first to freeze, with other areas freezing sequentially, in line with increasing average annual precipitation. Soil thawing occurred sooner in areas with more precipitation. Hence, precipitation appears to have a substantial impact on freeze–thaw processes.
- The areas under the bare land were the first to freeze, and the areas under the forest were the first to thaw. Different vegetation types had a major impact on the freeze–thaw process.
Author Contributions
Conceptualization, C.F. and Z.H.; methodology, C.F. and Y.Y.; software, C.F. and D.W.; investigation, C.F. and Z.H.; writing—original draft preparation, C.F., M.D., Y.Y. and H.Y.; writing—review and editing, C.F., Z.H., Y.Y., M.D., H.Y., S.L., D.W. and W.F. All authors have read and agreed to the published version of the manuscript.
Funding
This research was supported by the Second Tibetan Plateau Scientific Expedition and Research (STEP) program (grant no. 2019QZKK0103), the National Natural Science Foundation of China (grant no. 91837208), the Strategic Priority Research Program of the Chinese Academy of Sciences (grant no. XDA20060101), the Systematic Major Project of the China Railway (grant no. P2021G047), and the National Key Research and Development Program of China (grant no. 2018YFC1505701).
Data Availability Statement
The MODIS land-cover product (MCD12C1) is available online at: https://lpdaac.usgs.gov/resources/data-action/ (accessed on 29 June 2022); the China Meteorological Forcing Dataset (CMFD) can be obtained at: http://data.tpdc.ac.cn/en/data/8028b944-daaa-4511-8769-965612652c49/ (accessed on 7 November 2019).
Conflicts of Interest
The authors declare no conflict of interest.
References
- Zhang, Y.; Li, B.; Zheng, D. A discussion on the boundary and area of the Tibetan Plateau in China. Geogr. Res. 2002, 21, 1–8. [Google Scholar] [CrossRef]
- Ma, Y.; Yao, T.; Hu, Z.; Wang, J. The cooperative study on energy and water cycle over the Tibetan Plateau. Adv. Earth Sci. 2009, 24, 1280. [Google Scholar]
- Liu, X.; Hui, X.; Chen, B. Influence of heat source anormal of underlying surface over Tibet Plateau and western tropical Pacific on short-term climate in China. Plateau Meteorol. 1991, 10, 305–316. (In Chinese) [Google Scholar]
- Wang, L.; Zheng, Q.; Song, Q. Numerical simulation of the influence of the underlying surface of the western Qinghai-Tibet Plateau on the seasonal transition of the atmospheric circulation in East Asia. Plateau Meteorol. 2003, 22, 179–184. (In Chinese) [Google Scholar]
- Wu, G.X.; Zhu, B.Z.; Gao, D.Y. The Impact of the Tibetan Plateau on Local and Regional Climate. In Theoretical Research Progress of the Second Qinghai-Tibet Plateau Atmospheric Science Experiment (1); Meteorological Press: Beijing, China, 1999; pp. 257–273. [Google Scholar]
- Duan, A.; Liu, Y.; Wu, G. Heating status of the Tibetan Plateau from April to June and rainfall and atmospheric circulation anomaly over East Asia in midsummer. Sci. China Ser. D Earth Sci. 2005, 48, 250–257. [Google Scholar] [CrossRef]
- Duan, A.; Li, F.; Wang, M.; Wu, G. Persistent weakening trend in the spring sensible heat source over the Tibetan Plateau and its impact on the Asian summer monsoon. J. Clim. 2011, 24, 5671–5682. [Google Scholar] [CrossRef] [Green Version]
- Davidson, E.A.; Janssens, I.A. Temperature sensitivity of soil carbon decomposition and feedbacks to climate change. Nature 2006, 440, 165–173. [Google Scholar] [CrossRef] [PubMed] [Green Version]
- Hu, Q.; Feng, S. How have soil temperatures been affected by the surface temperature and precipitation in the Eurasian continent? Geophys. Res. Lett. 2005, 32, L14711. [Google Scholar] [CrossRef]
- Lawrence, D.M.; Slater, A.G.; Swenson, S.C. Simulation of present-day and future permafrost and seasonally frozen ground conditions in CCSM4. J. Clim. 2012, 25, 2207–2225. [Google Scholar] [CrossRef] [Green Version]
- Zhang, T.; Barry, R.; Gilichinsky, D.; Bykhovets, S.; Sorokovikov, V.A.; Ye, J. An amplified signal of climatic change in soil temperatures during the last century at Irkutsk, Russia. Clim. Change 2001, 49, 41–76. [Google Scholar] [CrossRef]
- Yeşilırmak, E. Soil temperature trends in Büyük Menderes Basin, Turkey. Meteorol. Appl. 2014, 21, 859–866. [Google Scholar] [CrossRef]
- Woodbury, A.D.; Bhuiyan, A.K.M.H.; Hanesiak, J.; Akinremi, O.O. Observations of northern latitude ground-surface and surface-air temperatures. Geophys. Res. Lett. 2009, 36, L07703. [Google Scholar] [CrossRef] [Green Version]
- Gao, Y.; Li, X.; Leung, L.R.; Chen, D.; Xu, J. Aridity changes in the Tibetan Plateau in a warming climate. Environ. Res. Lett. 2015, 10, 034013. [Google Scholar] [CrossRef]
- Yao, F.; Wang, J.; Yang, K.; Wang, C.; Walter, B.A.; Crétaux, J.F. Lake storage variation on the endorheic Tibetan Plateau and its attribution to climate change since the new millennium. Environ. Res. Lett. 2018, 13, 064011. [Google Scholar] [CrossRef]
- Sun, S.F. Parameterization Study of Physical and Biochemical Mechanism in Land Surface Process; Meterology Press: Beijing, China, 2005. [Google Scholar]
- Zhou, Y.; Guo, D.; Qiu, G.; Cheng, G.; Li, S. China Permafrost; Science Press: Beijing, China, 2000; pp. 145–151. [Google Scholar]
- Yang, M.X.; Yao, T.D. A review of the study on the impact of snow cover in the Tibetan Plateau on Asian monsoon. J. Glaciol. Geocryol. 1998, 20, 186–192. [Google Scholar]
- Li, S.X.; Nan, Z.T.; Zhao, L. Impact of freezing and thawing on energy exchange between the system and environment. J. Glaciol. Geocryol. 2002, 24, 109–115. [Google Scholar]
- Qingbai, W.; Yongping, S.; Bin, S. Relationship between frozen soil together with its water-heat process and ecological environment in the Tibetan Plateau. J. Glaciol. Geocryol. 2003, 25, 250–255. [Google Scholar]
- Gao, R.; Zhong, H.L.; Dong, W.J.; Wei, Z.G. Impact of snow cover and frozen soil in the Tibetan Plateau on summer precipitation in China. J. Glaciol. Geocryol. 2011, 33, 254–260. [Google Scholar]
- Chenghai, W.; Wenjie, D.; Zhigang, W. Study on relationship between the frozenthaw process in Qinghai Xizang Plat eau and circulation in East Asia. Chin. J. Geo Phys. 2003, 46, 310–312. [Google Scholar]
- Wang, C.; Shang, D. Effect of the variation of the soil temperature and moisture in the transition from dry-season to wet-season over northern Tibet Plateau. Plateau Meteorol. 2007, 26, 677–685. [Google Scholar]
- Yang, M.; Yao, T.; Gou, X.; Hirose, N.; Fujii, H.Y.; Hao, L.; Levia, D.F. Diurnal freeze/thaw cycles of the ground surface on the Tibetan Plateau. Chin. Sci. Bull. 2007, 52, 136–139. [Google Scholar] [CrossRef]
- Guo, W.D.; Ma, Z.G.; Wang, H.J. Soil Moisture—An Important Factor of Seasonal Precipitation Prediction and Its Application. Clim. Environ. Res. 2007, 12, 20–28. (In Chinese) [Google Scholar]
- Chahine, M.T. The hydrological cycle and its influence on climate. Nature 1992, 359, 373–380. [Google Scholar] [CrossRef]
- Trenberth, K.E. Atmospheric moisture recycling: Role of advection and local evaporation. J. Clim. 1999, 12, 1368–1381. [Google Scholar] [CrossRef]
- Yang, M.; Yao, T.; Gou, X.; Koike, T.; He, Y. The soil moisture distribution, thawing–freezing processes and their effects on the seasonal transition on the Qinghai–Xizang (Tibetan) plateau. J. Asian Earth Sci. 2003, 21, 457–465. [Google Scholar] [CrossRef]
- Tarnocai, C.; Canadell, J.G.; Schuur, E.A.G.; Kuhry, P.; Mazhitova, G.; Zimov, S. Soil organic carbon pools in the northern circumpolar permafrost region. Glob. Biogeochem. Cycles 2009, 23, GB2023. [Google Scholar] [CrossRef]
- Zou, D.; Zhao, L.; Sheng, Y.; Chen, J.; Hu, G.; Wu, T.; Wu, J.; Xie, C.; Wu, X.; Pang, Q.; et al. A new map of permafrost distribution on the Tibetan Plateau. Cryosphere 2017, 11, 2527–2542. [Google Scholar] [CrossRef] [Green Version]
- Friedl, M.A.; McIver, D.K.; Hodges, J.C.F.; Zhang, X.Y.; Muchoney, D.; Strahler, A.H.; Woodcock, C.E.; Gopal, S.; Schneider, A.; Cooper, A.; et al. Global land cover mapping from MODIS: Algorithms and early results. Remote Sens. Environ. 2002, 83, 287–302. [Google Scholar] [CrossRef]
- Friedl, M.A.; Sulla-Menashe, D.; Tan, B.; Schneider, A.; Ramankutty, N.; Sibley, A.; Huang, X. MODIS Collection 5 global land cover: Algorithm refinements and characterization of new datasets. Remote Sens. Environ. 2010, 114, 168–182. [Google Scholar] [CrossRef]
- Chen, Y.; Yang, K.; He, J.; Qin, J.; Shi, J.; Du, J.; He, Q. Improving land surface temperature modeling for dry land of China. J. Geophys. Res. Atmos. 2011, 116, D20104. [Google Scholar] [CrossRef]
- Oleson, K.W.; Lawrence, D.M.; Bonan, G.B.; Fisher, R.A.; Koven, C.D.; Swenson, S.C.; Collier, N.; Ghimire, B.; van Kampenhout, L.; Kennedy, D.; et al. Technical Description of Version 4.5 of the Community Land Model (CLM); (NCAR Tech. Note NCAR/TN-5031STR); National Center for Atmospheric Research: Boulder, CO, USA, 2013; 420p. [Google Scholar]
- Niu, G.Y.; Yang, Z.L. Effects of frozen soil on snowmelt runoff and soil water storage at a continental scale. J. Hydrometeorol. 2006, 7, 937–952. [Google Scholar] [CrossRef] [Green Version]
- Swenson, S.C.; Lawrence, D.M.; Lee, H. Improved simulation of the terrestrial hydrological cycle in permafrost regions by the Community Land Model. J. Adv. Model. Earth Syst. 2012, 4, M08002. [Google Scholar] [CrossRef]
- Swenson, S.C.; Lawrence, D.M. A new fractional snow-covered area parameterization for the Community Land Model and its effect on the surface energy balance. J. Geophys. Res. Atmos. 2012, 117, D21107. [Google Scholar] [CrossRef]
- Wang, C.; Yang, K. A new scheme for considering soil water-heat transport coupling based on Community Land Model: Model description and preliminary validation. J. Adv. Model. Earth Syst. 2018, 10, 927–950. [Google Scholar] [CrossRef] [Green Version]
- Li, S.; Yang, K.; Wang, C. Bias characteristics of land surface model (CLM4. 5) over the Tibetan Plateau during soil freezing-thawing period and its causes. J. Glaciol. Geocryol. 2018, 40, 322–334. [Google Scholar]
- Gardelle, J.; Berthier, E.; Arnaud, Y. Slight mass gain of Karakoram glaciers in the early twenty-first century. Nat. Geosci. 2012, 5, 322–325. [Google Scholar] [CrossRef]
- Gao, J.; Xie, Z.; Wang, A.; Liu, S.; Zeng, Y.; Liu, B.; Li, R.; Jia, B.; Qin, P.; Xie, J. A new frozen soil parameterization including frost and thaw fronts in the Community Land Model. J. Adv. Model. Earth Syst. 2019, 11, 659–679. [Google Scholar] [CrossRef] [Green Version]
- Gao, Y.; Xu, J.; Chen, D. Evaluation of WRF mesoscale climate simulations over the Tibetan Plateau during 1979–2011. J. Clim. 2015, 28, 2823–2841. [Google Scholar] [CrossRef] [Green Version]
- Liu, X.; Cheng, Z.; Yan, L.; Yin, Z.Y. Elevation dependency of recent and future minimum surface air temperature trends in the Tibetan Plateau and its surroundings. Glob. Planet. Change 2009, 68, 164. [Google Scholar] [CrossRef]
- Guo, D.; Sun, J.; Yang, K.; Pepin, N.; Xu, Y. Revisiting recent elevation-dependent warming on the Tibetan Plateau using satellite-based data sets. J. Geophys. Res. Atmos. 2019, 124, 8511–8521. [Google Scholar] [CrossRef] [Green Version]
- IPCC; Masson-Delmotte, V.; Zhai, P.; Pirani, A.; Connors, S.L.; Péan, C.; Berger, S.; Caud, N.; Chen, Y.; Goldfarb, L.; et al. Climate change 2021: The physical science basis. In Contribution of Working Group I to the Sixth Assessment Report of the Intergovernmental Panel on Climate Change; Cambridge University Press: Cambridge, UK, 2021. [Google Scholar]
- Zhou, Y.; Gao, X.; Zhang, K.; Li, Y.; Yang, L. Spatiotemporal variations in 3.2 m soil temperature in China during 1980–2017. Clim. Dyn. 2020, 54, 1233–1244. [Google Scholar] [CrossRef]
- Wang, T.; Yang, D.; Fang, B.; Yang, W.; Qin, Y.; Wang, Y. Data-driven mapping of the spatial distribution and potential changes of frozen ground over the Tibetan Plateau. Sci. Total Environ. 2019, 649, 515–525. [Google Scholar] [CrossRef] [PubMed]
- Gao, Y.; Chen, F.; Lettenmaier, D.P.; Xu, J.; Xiao, L.; Li, X. Does elevation-dependent warming hold true above 5000 m elevation? Lessons from the Tibetan Plateau. Npj Clim. Atmos. Sci. 2018, 1, 19. [Google Scholar] [CrossRef] [Green Version]
- Qiu, G.; Liu, J.; Liu, H. Geocryological glossary; Gansu Science and Technology Press China: Lanzhou, China, 1994. [Google Scholar]
- Guo, D.; Yang, M.; Wang, H. Characteristics of land surface heat and water exchange under different soil freeze/thaw conditions over the central Tibetan Plateau. Hydrol. Process. 2011, 25, 2531–2541. [Google Scholar] [CrossRef]
- Yang, K.; Wang, C. Water storage effect of soil freeze-thaw process and its impacts on soil hydro-thermal regime variations. Agric. For. Meteorol. 2019, 265, 280–294. [Google Scholar] [CrossRef]
- Wang, C.; Yang, K.; Li, Y.; Wu, D.; Bo, Y. Impacts of spatiotemporal anomalies of Tibetan Plateau snow cover on summer precipitation in eastern China. J. Clim. 2017, 30, 885–903. [Google Scholar] [CrossRef]
Figure 1.
(a) Spatial distribution of permafrost on the TP [30]. (b) Spatial patterns of different vegetation types on the TP. The vegetation type map is derived from the MODIS land–cover product.
Figure 1.
(a) Spatial distribution of permafrost on the TP [30]. (b) Spatial patterns of different vegetation types on the TP. The vegetation type map is derived from the MODIS land–cover product.

Figure 2.
Comparison of simulated and observed soil temperature in 4 soil layers at BJ site, Amdo site, and NewD66 site.
Figure 2.
Comparison of simulated and observed soil temperature in 4 soil layers at BJ site, Amdo site, and NewD66 site.

Figure 3.
Climatology and trends in temperature and precipitation on the TP from 1980 to 2016. (a) Climatology of temperature (unit: °C). (b) Climatology of precipitation (unit: mm). (c) Trend in temperature (unit: °C/decade). (d) Trend in precipitation (unit: mm/decade). Grid points with statistically significant anomalies at the 90% confidence level are denoted by an oblique line.

Figure 4.
Temperature patterns on the TP from 1980 to 2016. (a) EOF1 spatial pattern. (b) Time coefficient. (c) Mann–Kendall trend test.
Figure 4.
Temperature patterns on the TP from 1980 to 2016. (a) EOF1 spatial pattern. (b) Time coefficient. (c) Mann–Kendall trend test.

Figure 5.
Trends in soil temperature at four different soil depths across the TP from 1980 to 2016 (unit: °C/decade). (a) 10 cm; (b) 20 cm; (c) 40 cm; (d) 60 cm.
Figure 5.
Trends in soil temperature at four different soil depths across the TP from 1980 to 2016 (unit: °C/decade). (a) 10 cm; (b) 20 cm; (c) 40 cm; (d) 60 cm.

Figure 6.
Same as Figure 5, but for soil moisture (unit: m3·m−3/decade).
Figure 6.
Same as Figure 5, but for soil moisture (unit: m3·m−3/decade).

Figure 7.
Same as Figure 5, but for differences in average soil temperature between RW and RC.
Figure 7.
Same as Figure 5, but for differences in average soil temperature between RW and RC.

Figure 8.
Same as Figure 7, but for soil moisture (unit: m3/m3).
Figure 8.
Same as Figure 7, but for soil moisture (unit: m3/m3).

Figure 9.
Spatial distributions of multi-year means of the freezing date, thawing date, and freeze–thaw duration for two soil depths from 1980 to 2016 (units: days after 1 September (a,b,d,e); days (c,f)). (a) Freezing date of soil at 10 cm depth. (b) Thawing date of soil at 10 cm depth. (c) Freeze–thaw duration of soil at 10 cm depth. (d) Freezing date of soil at 60 cm depth. (e) Thawing date of soil at 60 cm depth. (f) Freeze–thaw duration of soil at 60 cm depth.

Figure 10.
Trends in freezing date, thawing date, and freeze–thaw duration at two soil depths from 1980 to 2016 (unit: day/decade). Grid points with statistically significant anomalies at the 90% confidence level are denoted by an oblique line.
Figure 10.
Trends in freezing date, thawing date, and freeze–thaw duration at two soil depths from 1980 to 2016 (unit: day/decade). Grid points with statistically significant anomalies at the 90% confidence level are denoted by an oblique line.

Figure 11.
Differences in freezing date, thawing date, and freeze–thaw duration at two soil depths between the RW and RC periods (unit: day).
Figure 11.
Differences in freezing date, thawing date, and freeze–thaw duration at two soil depths between the RW and RC periods (unit: day).

Figure 12.
Climate zones on the Tibetan Plateau.

Figure 13.
Multi-year means of the (a) freezing date, (b) thawing date, and (c) freeze–thaw duration at four different soil depths from 1980 to 2016, plotted with respect to climate zone (unit: day).
Figure 13.
Multi-year means of the (a) freezing date, (b) thawing date, and (c) freeze–thaw duration at four different soil depths from 1980 to 2016, plotted with respect to climate zone (unit: day).

Figure 14.
Same as Figure 13, but plotted with respect to vegetation types (unit: day).
Figure 14.
Same as Figure 13, but plotted with respect to vegetation types (unit: day).


Table 1.
Multi-year means of soil freeze–thaw processes at different soil depths.
| Soil Depth | Freezing Date (Days after 1 September) | Thawing Date (Days after 1 September) | Freeze–Thaw Duration (Days) |
|---|---|---|---|
| 10 cm | 67.42 | 212.12 | 144.70 |
| 20 cm | 70.62 | 215.42 | 144.78 |
| 40 cm | 76.12 | 220.70 | 144.59 |
| 60 cm | 84.16 | 230.45 | 146.59 |
Table 2.
Trends in soil freeze–thaw processes at different soil depths (unit: day/decade).
| Soil Depth | Freezing Date | Thawing Date | Freeze–Thaw Duration |
|---|---|---|---|
| 10 cm | 2.15 | −2.17 | −4.32 |
| 20 cm | 2.15 | −2.23 | −4.38 |
| 40 cm | 2.23 | −1.62 | −3.85 |
| 60 cm | 2.30 | −1.49 | −3.79 |
Table 3.
Differences in soil freeze–thaw processes between the RW and RC periods (unit: day).
| Soil Depth | Freezing Date | Thawing Date | Freeze–Thaw Duration |
|---|---|---|---|
| 10 cm | 3.87 | −5.67 | −9.54 |
| 20 cm | 3.70 | −5.22 | −8.92 |
| 40 cm | 4.28 | −3.76 | −8.05 |
| 60 cm | 4.41 | −3.39 | −7.80 |
Publisher’s Note: MDPI stays neutral with regard to jurisdictional claims in published maps and institutional affiliations. |
© 2022 by the authors. Licensee MDPI, Basel, Switzerland. This article is an open access article distributed under the terms and conditions of the Creative Commons Attribution (CC BY) license (https://creativecommons.org/licenses/by/4.0/).
Share and Cite
MDPI and ACS Style
Fu, C.; Hu, Z.; Yang, Y.; Deng, M.; Yu, H.; Lu, S.; Wu, D.; Fan, W. Responses of Soil Freeze–Thaw Processes to Climate on the Tibetan Plateau from 1980 to 2016. Remote Sens. 2022, 14, 5907. https://doi.org/10.3390/rs14235907
AMA Style
Fu C, Hu Z, Yang Y, Deng M, Yu H, Lu S, Wu D, Fan W. Responses of Soil Freeze–Thaw Processes to Climate on the Tibetan Plateau from 1980 to 2016. Remote Sensing. 2022; 14(23):5907. https://doi.org/10.3390/rs14235907
Chicago/Turabian StyleFu, Chunwei, Zeyong Hu, Yaoxian Yang, Mingshan Deng, Haipeng Yu, Shan Lu, Di Wu, and Weiwei Fan. 2022. "Responses of Soil Freeze–Thaw Processes to Climate on the Tibetan Plateau from 1980 to 2016" Remote Sensing 14, no. 23: 5907. https://doi.org/10.3390/rs14235907
Note that from the first issue of 2016, this journal uses article numbers instead of page numbers. See further details here.