Article

Quantitatively Assessing the Impact of Driving Factors on Vegetation Cover Change in China’s 32 Major Cities

1
State Key Laboratory of Remote Sensing Science, Jointly Sponsored by Beijing Normal University and Aerospace Information Research Institute of Chinese Academy of Sciences, Faculty of Geographical Science, Beijing Normal University, Beijing 100875, China
2
Beijing Engineering Research Center for Global Land Remote Sensing Products, Institute of Remote Sensing, Science and Engineering, Faculty of Geographical Science, Beijing Normal University, Beijing 100875, China
*
Author to whom correspondence should be addressed.
Remote Sens. 2022, 14(4), 839; https://doi.org/10.3390/rs14040839
Submission received: 16 December 2021 / Revised: 6 February 2022 / Accepted: 7 February 2022 / Published: 10 February 2022

Abstract

:
After 2000, China’s vegetation underwent great changes associated with climate change and urbanization. Although many studies have been conducted to quantify the contributions of climate and human activities to vegetation, few studies have quantitatively examined the comprehensive contributions of climate, urbanization, and CO2 to vegetation in China’s 32 major cities. In this study, using Global Land Surface Satellite (GLASS) fractional vegetation cover (FVC) between 2001 and 2018, we investigated the trend of FVC in China’s 32 major cities and quantified the effects of CO2, urbanization, and climate by using generalized linear models (GLMs). We found the following: (1) From 2001 to 2018, the FVC in China generally illustrated an increasing trend, although it decreased in 23 and 21 cities in the core area and expansion area, respectively. (2) Night light data showed that the urban expansion increased to varying degrees, with an average increasing ratio of approximately 168%. The artificial surface area increased significantly, mainly from cropland, forest, grassland, and tundra. (3) Climate factors and CO2 were the major factors that affected FVC change. The average contributions of climate factors, CO2, and urbanization were 40.6%, 39.2%, and 10.6%, respectively. This study enriched the understanding of vegetation cover change and its influencing factors, helped to explain the complex biophysical mechanism between vegetation and environment, and guided sustainable urban development.

1. Introduction

Urban vegetation plays an important role in human life and environmental regulation in cities [1,2,3,4]. As an important part of the urban ecosystem, urban vegetation is the main producer of the city, participating in regulation of climate change, altering energy and matter exchange between the surface and atmosphere, and promoting complex biogeochemical cycles [5,6,7,8]. In addition, the effect of urban vegetation on the beautification and purification of the urban environment has also been concerned [9,10,11]. Therefore, studying the long-term dynamic change of urban vegetation and its driving factors can provide theoretical support for the protection of urban ecological environment.
Climate factors are the main drivers of vegetation change and thus have been a popular research topic. At present, many scholars have studied the effect of climate on vegetation and obtained some similar conclusions. Increased precipitation promotes photosynthesis and improves the absorption and transport of soil nutrients. However, excessive precipitation inhibits vegetation transpiration. Decreased precipitation indirectly affects vegetation activities by regulating hydrothermal conditions, thus leading to the weakening of photosynthesis and the reduction of organic yield [12,13,14]. Temperature change promotes photosynthesis and accelerates the release of soil nutrients in the region suppressed by temperature. At the same time, accelerated soil water loss, weakened photosynthesis, and enhanced respiration result in dry matter consumption [15,16,17]. As the energy source of vegetation photosynthesis, solar radiation is also an important factor affecting vegetation growth [18].
In addition to climate factors, the effect of CO2 on vegetation growth cannot be ignored. Plants can use CO2 to produce organic material through photosynthesis to build plant tissue [19]. Therefore, increasing CO2 concentration will affect plant growth [20]. CO2 has a different effect on vegetation outside and inside the city. Outside the city, increased CO2 concentrations affect vegetation growth by speeding up carboxylation in photosynthesis [21,22]. Inside the city, increased CO2 concentrations cause the greenhouse effect, which leads to increased temperature and accelerated soil water evaporation. Under such conditions, the growth of vegetation is mainly affected by soil water [23,24].
It was worth mentioning that urbanization has also gradually become an important factor affecting vegetation growth [25,26,27]. Urbanization is a phenomenon that involves simultaneous changes in the population, economy, and land use patterns [28], and can often be measured using land cover data [29] and nighttime light data [30]. Land cover data express urbanization by calculating the change area of impervious surface [29,31]. However, the spatial resolution of land cover products with a long time series time resolution of one year is coarse and the information expressed is limited. Nighttime light data represent urbanization by measuring the night light of cities, towns, and other continuously lit areas, and can be an explanatory indicator for estimating urbanization dynamics [32]. From 2001 to 2018, China experienced intense urban development and rapid land consumption, which put great pressure on urban ecosystem functions [33,34]. The effects of urbanization on vegetation growth are complex. Urbanization can not only directly affect vegetation growth by promoting land cover change [35], but also indirectly affect vegetation growth by increasing the impervious layer area. The principle of the latter is that increases in impervious surfaces reduce the latent heat flux and increase the sensible heat flux, thus leading to a change in temperature and evapotranspiration processes. Such changes indirectly promote or inhibit vegetation growth [36,37]. Therefore, accurate knowledge of the complex nonlinear relationship between urbanization and vegetation can help enhance the understanding of vegetation changes under urbanization and could be essential for formulating environmental protection strategies in cities.
Although many studies have focused on the response relationship between urban vegetation and the environment, the influence of the drivers of long-term vegetation change in multi-urban areas has been limited [38,39]. At present, scholars have carried out research on the change in vegetation coverage in some cities and the driving factors [38,39,40]. Nevertheless, because few cities have been investigated, such work can only reflect the vegetation driving forces of individual cities; thus, a macroscopic analysis of China as a whole has not been performed [41,42]. In addition, we also noticed that vegetation growth is comprehensively affected by climate and human factors; however, few studies have considered the comprehensive impact of climate factors, CO2, and urbanization on vegetation [43,44,45]. Equally important, coarse-resolution land cover data have difficulty expressing detailed urbanization information because the land cover type data in cities have remained unchanged for many years [36].
In this study, we analyzed the effect of climate, urbanization, and CO2 on vegetation in 32 major cities of China using Global Land Surface Satellite (GLASS) fractional vegetation cover (FVC) in conjunction with climate data from the National Tibetan Plateau Data Center, CO2 from the National Cryosphere Desert Data Center, and nighttime light (NTL) data between 2001 and 2018. Our main objectives were to investigate the following: (1) spatiotemporal variation in FVC in China’s 32 major cities from 2001 to 2018; (2) differences in FVC variations between urban core areas and urban expanded areas; and (3) relative contributions of climate-related factors, CO2, and urbanization to FVC dynamics.

2. Materials and Methods
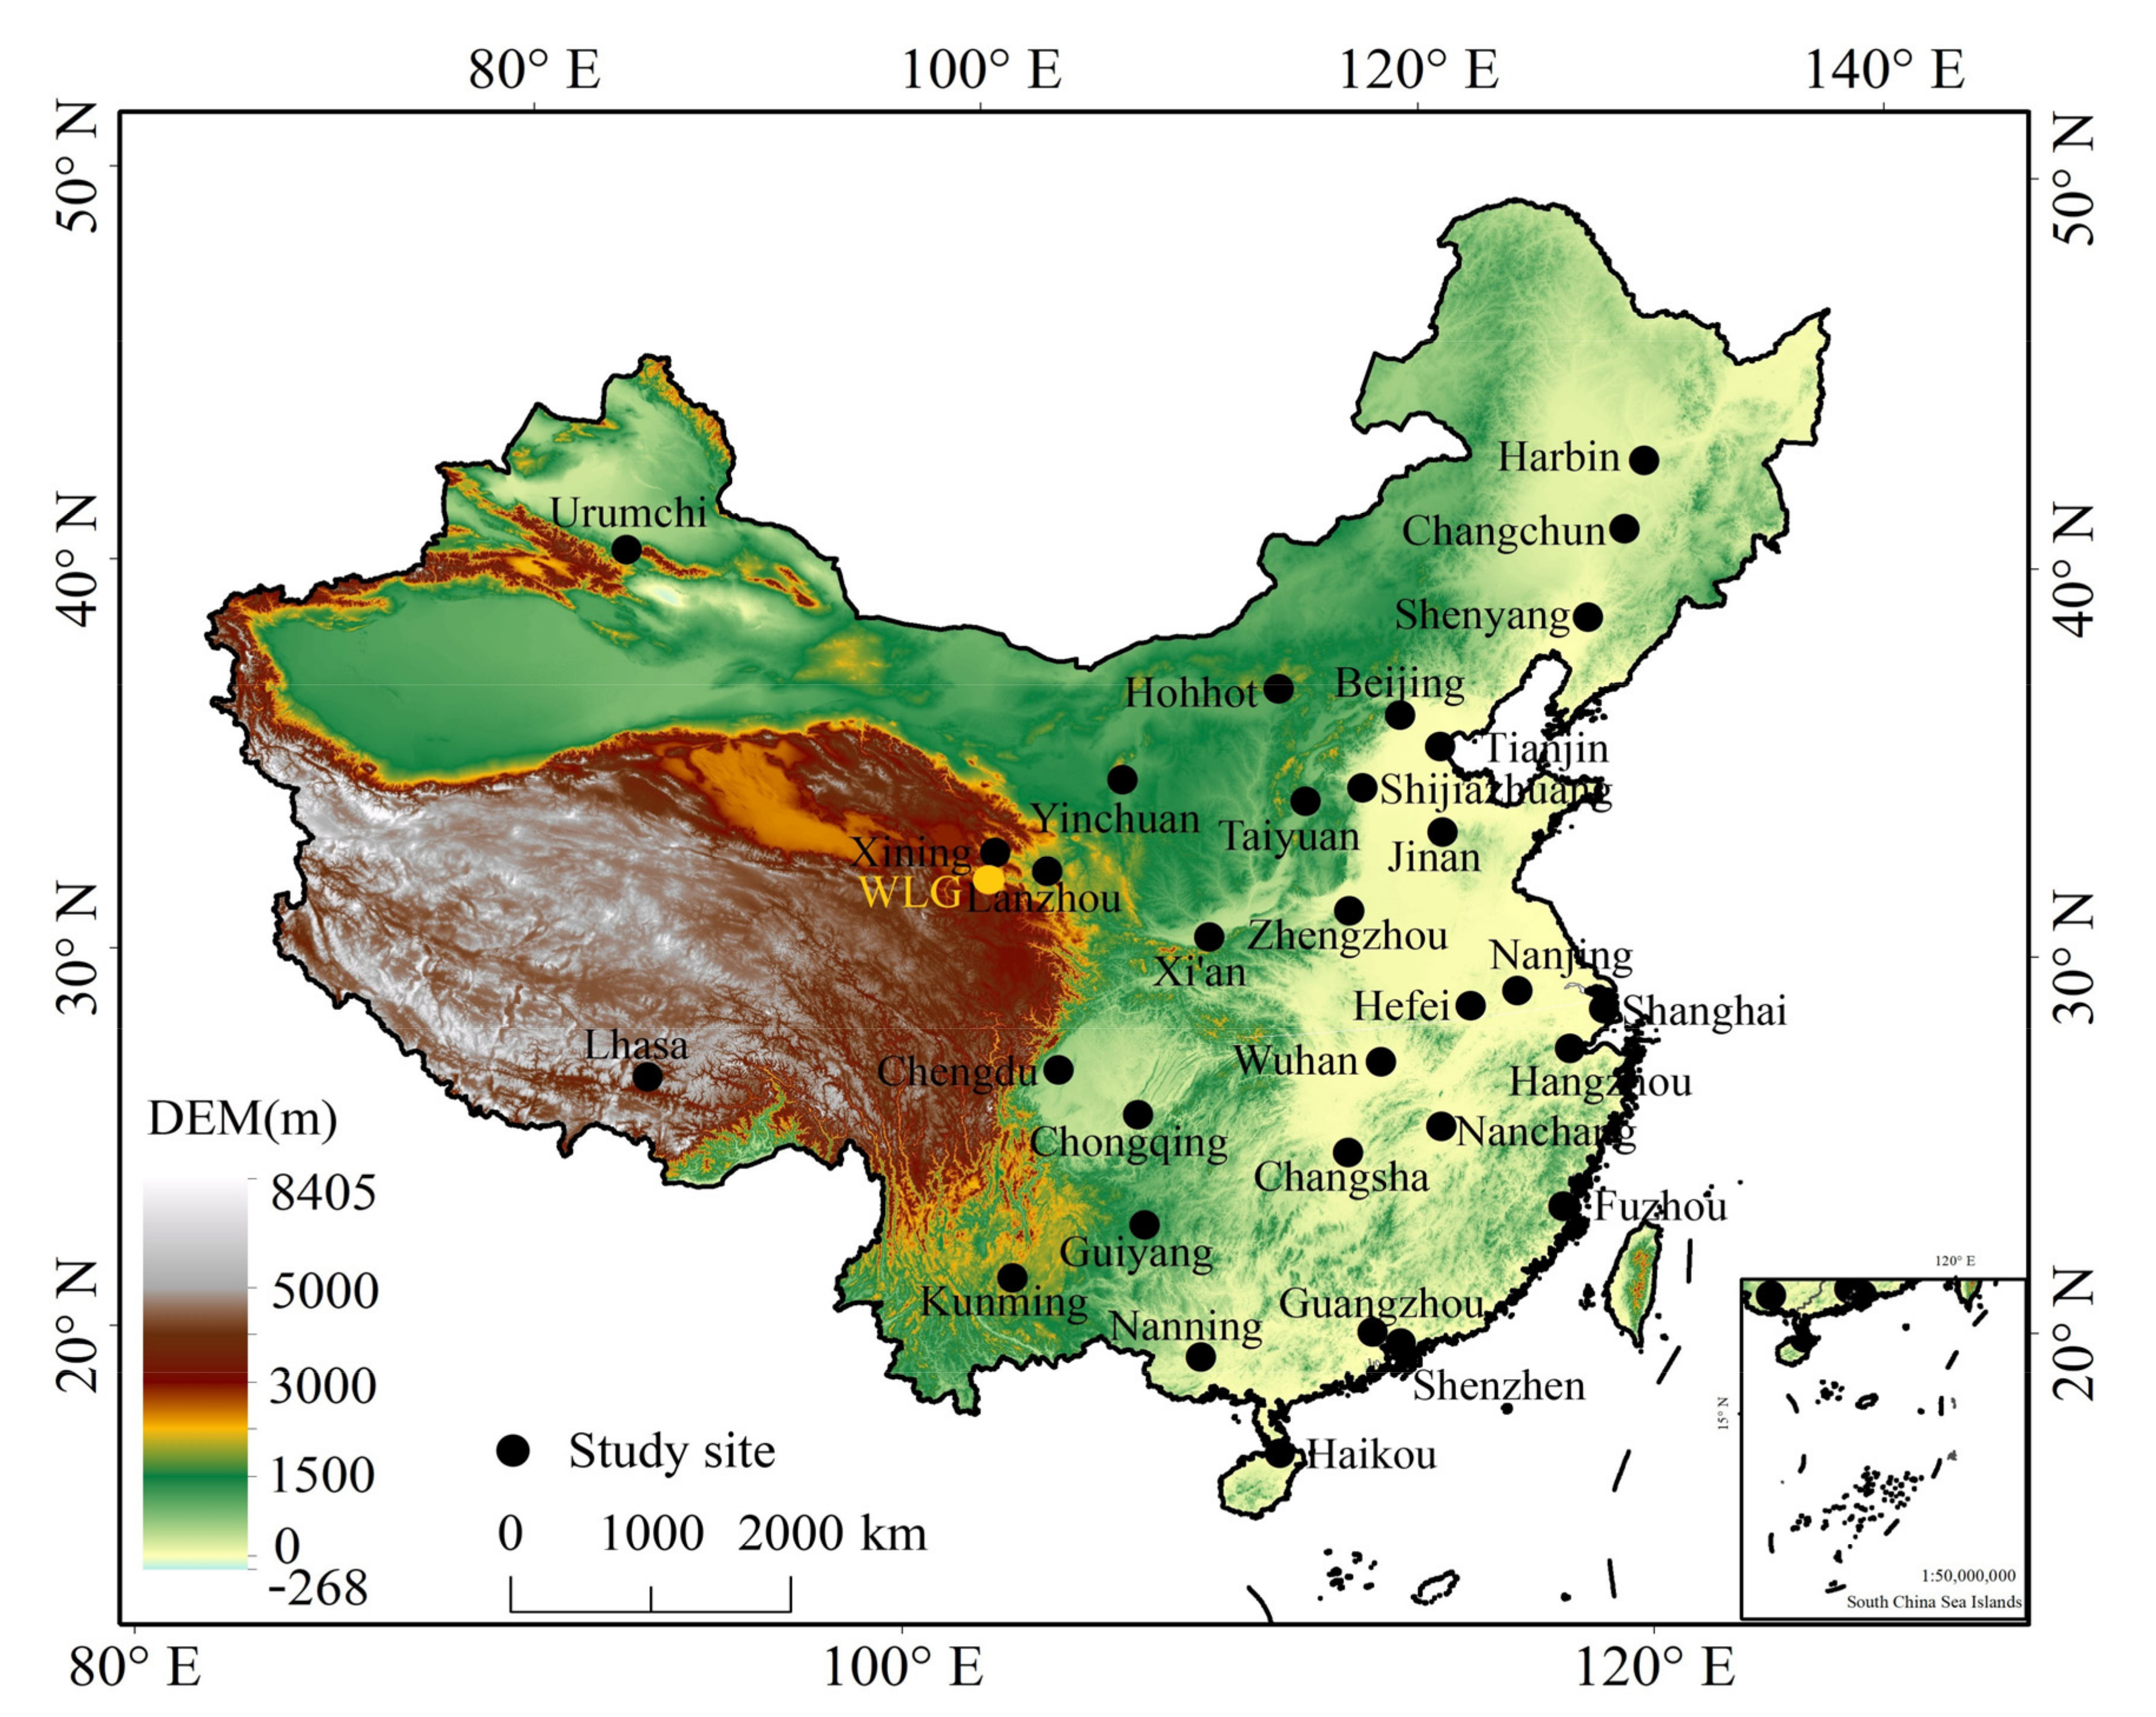
2.1. Study Area

China has a vast territory and abundant resources. The terrain is high in the East and low in the West. China is divided into three steps according to altitude (Figure 1). The first ladder is mainly distributed in the vicinity of the Qinghai-Tibet Plateau at an altitude of more than 4000 m. Under the influence of the southwest monsoon, the water content decreases sharply, and the precipitation is generally less than 150 mm, which decreases spatially from southeast to northwest. The average annual temperature is below zero. The average altitude of the second step is 1000–2000 m, and the local terrain highly fluctuates. The precipitation is mainly between 400 and 1000 mm. The cities in the region include Hohhot, Yinchuan, Xining, Lanzhou, Lhasa, Guiyang, and Kunming. The temperatures range between 4 °C and 15 °C, and the radiation ranges between 170 W·m−2 and 190 W·m−2. The third step is the lowest step at an elevation of less than 500 m, and it has annual precipitation of more than 1000 mm, although it can reach more than 6000 mm in some areas. The overall trend decreases from southeast to northwest. The cities in the region include 25 major cities, such as Beijing and Tianjin. The city with the lowest temperature and radiation is Harbin, and the city with the highest temperature is Haikou (Table 1).

2.2. Data Sources

GLASS FVC products: In this study, we used GLASS FVC from 2001 to 2018 produced by Beijing Normal University. The dataset processing combined Tang et al.’s MODIS reflectance data preprocessing method and machine learning method [46]. The dataset has a time resolution of 8 days and a spatial resolution of 500 m [47,48,49]. Due to the high stability of annual mean FVC, it is suitable for large-scale data research, and this paper synthesized the annual mean FVC using the data of 46 scenes throughout the year [20].
NTL products: In this study, we used the harmonized global NTL time series data from 2001 to 2018. The dataset includes the stepwise calibrated stable DMSP NTL observations from 2001 to 2013, and the simulated DMSP-like DNs from the VIIRS radiance data (2014–2018). The temporal resolution of the dataset was one year, and the spatial resolution was 1000 m [50]. It measures lights from cities, towns, and other continuous lighting areas at night, and can be an explanatory indicator for estimating urbanization dynamics [32].
Climate products: The first high-resolution meteorological forcing dataset for land process studies over China, which was produced by the Yangkun team from 2001 to 2018, was used in our research. The data were subjected to rigorous data quality control. A meteorological dataset covering the China was constructed using station data, satellite data, and means of convergence in the analysis of the data. These data had a spatial resolution of 0.1° and a temporal resolution of 3 h. Currently, this Chinese regional high-resolution meteorologically driven dataset has been released at the National Tibetan Plateau Science Center. The data provider also freely provides synthesized annual average climate data [51,52].
CO2 products: CO2 data obtained from the National Cryosphere Desert Data Center and China Greenhouse Gas Bulletin were used in this study. The data recorded monthly averages of CO2 at the China Global Atmosphere Watch Baseline Observatory Mount Waliguan (WLG) over many years. As one of 31 ground stations around the world, the atmospheric samples collected by WLG can well represent the average atmospheric conditions in China. The data values of the WLG site are monthly mean values. In order to match the time resolution of other products, we calculated the annual mean value of CO2 by using the recorded values of 12 months each year, and then processed it into a grid dataset covering China with a time resolution of 1 year and a spatial resolution of 1 km.
Globe30 products: The 30 m land cover datasets in 2000 and 2020 that we used were from the National Geomatics Center of China. The images used for classification were 30 m multispectral images, including Landsat satellite and China Environmental Disaster Reduction Satellite multispectral images, which were generated after synthesizing a considerable amount of auxiliary data and reference materials. The data include 10 land cover types, including water, wetland, artificial, tundra, ice, grass, bareland, cropland, shrub, and forest. The overall accuracy of the third-party evaluation is 83.50% [53].

2.3. Data Preprocessing and Trend Analysis

The time resolution of FVC data was 8 days. In this study, the annual average FVC data were synthesized by calculating the average of 46 scenes of FVC data every year. To match the spatial resolution of nighttime light data, the nearest neighbor sampling method was used to resample vegetation coverage data, climate data, and CO2 data. After the above processing, all data had the same time resolution (1 year) and spatial resolution (1 km).
To explore the vegetation and NTL data changes, the trends of vegetation and NTL were calculated using the linear regression method. The following formula expresses the relationship between them:
Y = k × Year + b
where k is the trend and b is the intercept term. A positive k value represents an increasing Y trend, while a negative k value represents a decreasing Y trend [54].

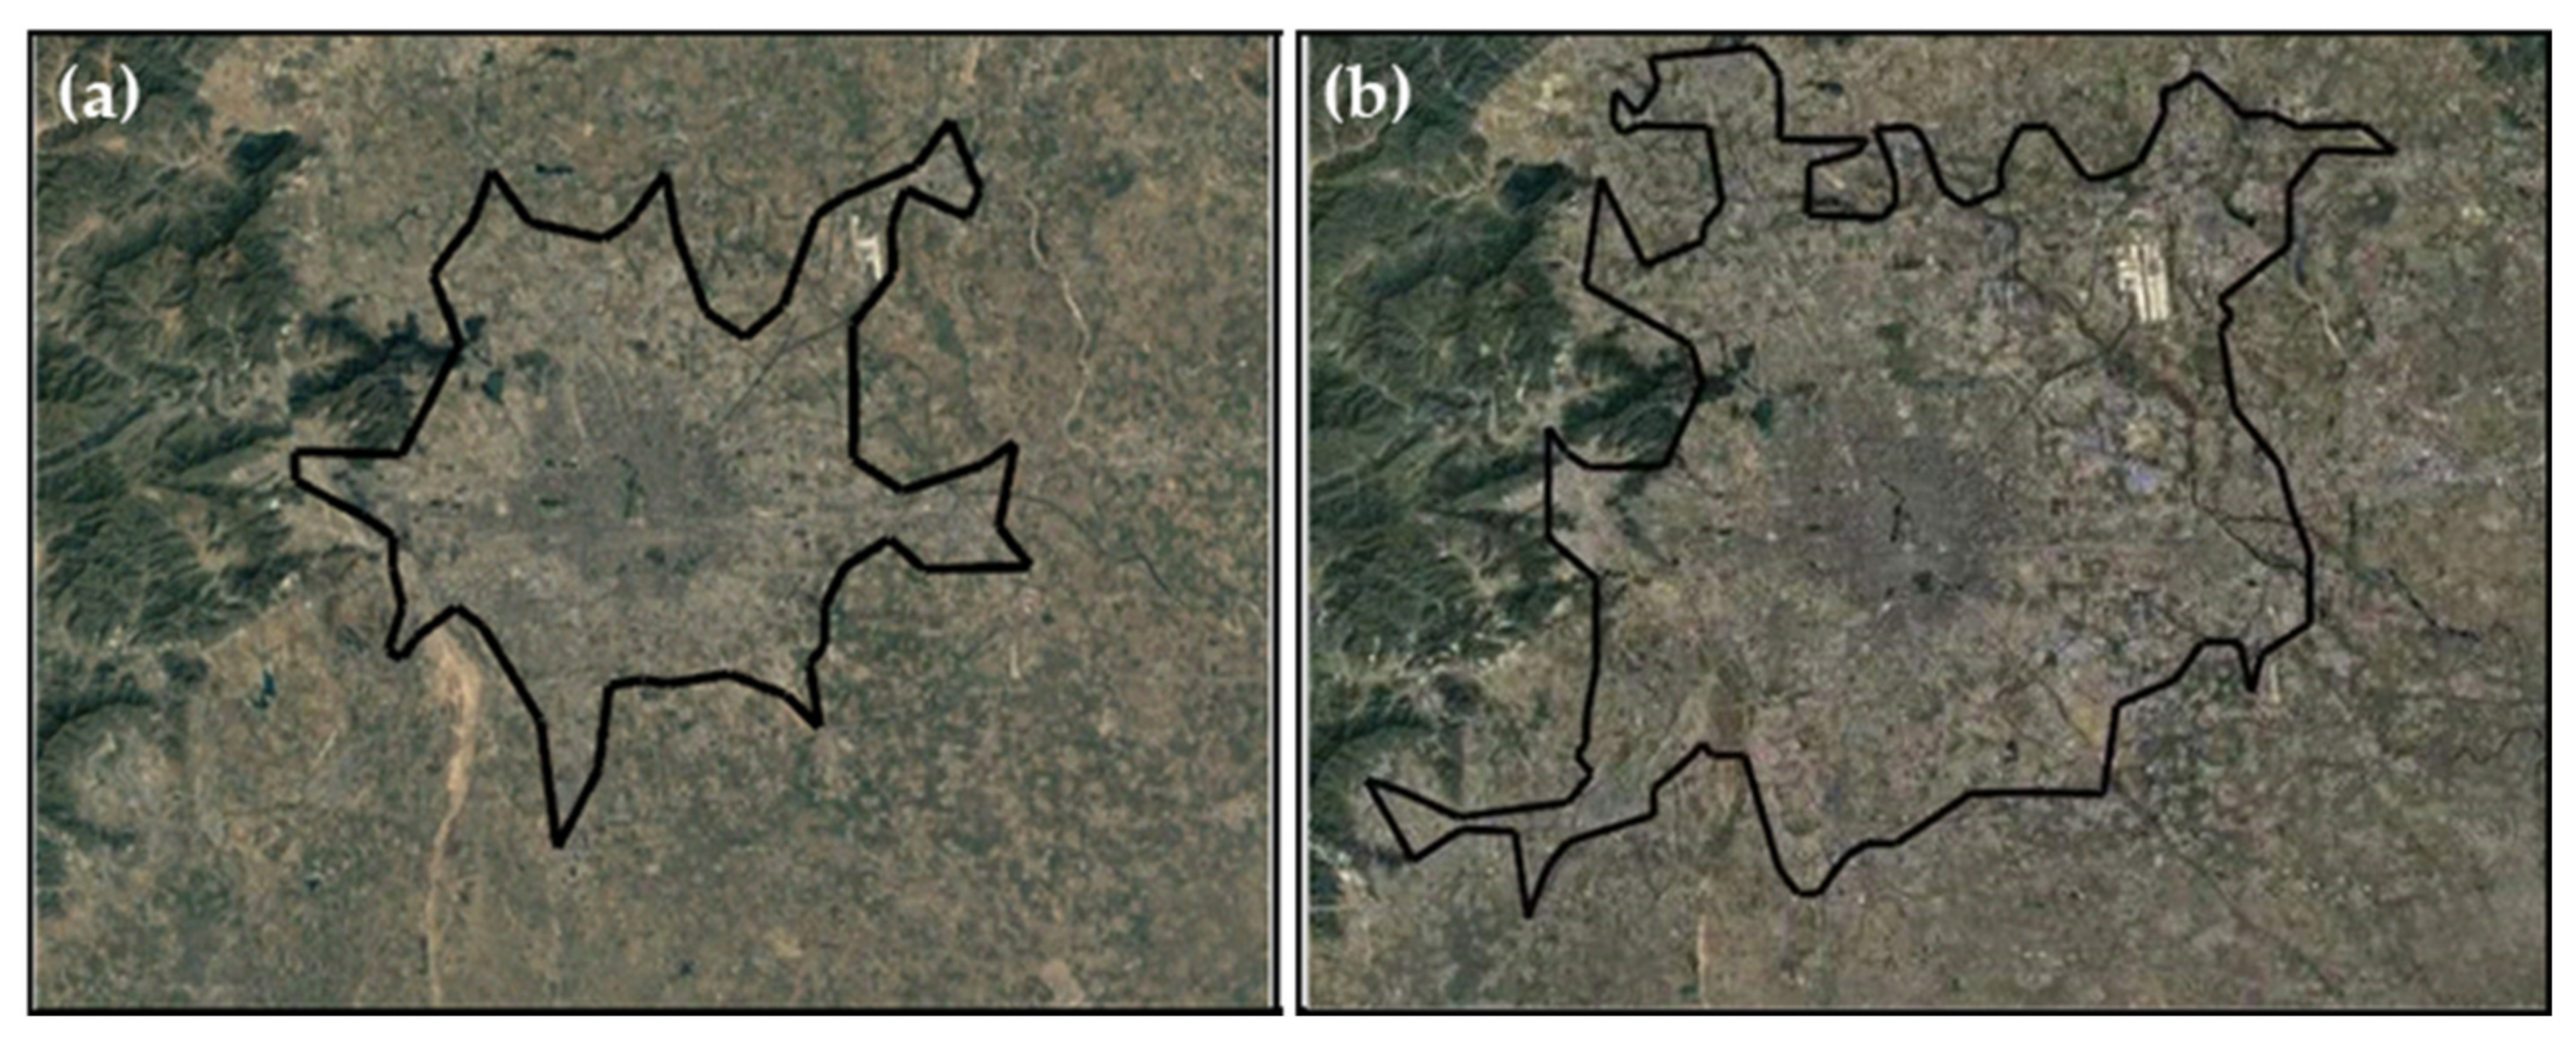
2.4. Urban Boundary Extraction

Urban boundary extraction was carried out using automated and manual interventions. The automatic extraction of the urban boundary was divided into three steps. Step 1: calculate the histogram of the NTL, calculate the position of the point with the most drastic change in the histogram, and then calculate the NTL value of the corresponding position as the first threshold for edge extraction. Step two: calculate the gradient of the NTL, repeat the operation of step one for the gradient data, and calculate the second threshold of edge extraction. Step 3: Using the thresholds extracted by the first two cloths, take the NTL between the first and second thresholds as the city extraction result. Finally, the extraction results were compared with the land cover data and adjusted manually. The city boundaries extracted from the NTL in 2001 were used as the core area boundaries. The urban boundaries extracted from the NTL in 2010 were used as the extension area boundaries. Beijing is taken as an example (Figure 2), with the Figure 2a showing the boundary of the Beijing core area and Figure 2b showing the boundary of the Beijing expanded area.

2.5. Attribution Analysis

This study used the GLM as the method of attribution analysis. FVC was used as the dependent variable, and CO2, climate factors, and NTL were independent variables. The GLM provided a flexible framework that described the relationship between response variables and explanatory variables well. In addition, the model was not only suitable for describing linear relationships, but also had a strong ability to describe nonlinear relationships. The link function can be applied to data with normal, Poisson, gamma, binomial, and other distributions [55,56,57,58,59]. The response variable in the study is FVC, which generally follows a normal distribution, so the family set in the model is Gaussian model, and the link is identity. The corresponding mathematical expression of GLM is as follows:
Y = g b 0 + b 1 × x 1 + b m × x m
where Y is the response variable, x is the explanatory variable, b is the regression coefficient, and g (.) is a link function. The corresponding expression in R language is as follows:
glm FVC   ~   C + U + P + T + R ,   family   =   gaussian link =   identity
where C, U, P, T, and R represent CO2, urbanization, precipitation, temperature, and radiation, respectively.
The calculation method of specific contribution is mainly divided into three steps:
Step 1: The mean square (MS) of each explanatory variable were obtained using GLM. The MS calculation formula is as follows:
MS = SS Df
where Df is the degree of freedom, SS is the sum of squares, and its value is equal to the explained sum of squares (ESS) increased by addition of an independent variable to the model. The mathematical expression for the sum of squares is as follows:
ESS = ( y ^ y ¯ ) 2
SS = ESS model 2   ESS model 1
According to the order in which independent variables enter the model, the MS expressions of each independent variable are as follows, taking CO2 and urbanization as examples:
SS C = ESS ( glm FVC ~ C
SS U = ESS glm FVC ~ C + U   ESS glm FVC ~ C
The SS of other independent variables was also calculated according to the above method. Finally, MS corresponding to all independent variables was calculated according to Formula (3).
Step 2: The regression coefficients of each explanatory variable were obtained using GLM. Firstly, the annual mean values of FVC, CO2, urbanization, precipitation, temperature, and radiation of 32 cities were calculated and then input into the model. The regression coefficients of explanatory variables in the corresponding models of different cities were obtained. The positive and negative effects of explanatory variables were judged by the positive and negative values of the regression coefficient. When the regression coefficient is greater than 0, it indicates that there is a positive effect between the variable and the response variable; when the regression coefficient is less than 0, it indicates that there is a negative influence between the explanatory variable and the response variable.
Step 3: Use MS to calculate the contribution, the method refers to Tao’s [55], taking CO2 for example:
Contribution C = MS C MS C + MS U + MS P + MS T + MS R + MS other
All analyses were carried out in R Version 3.6.1.

3. Results

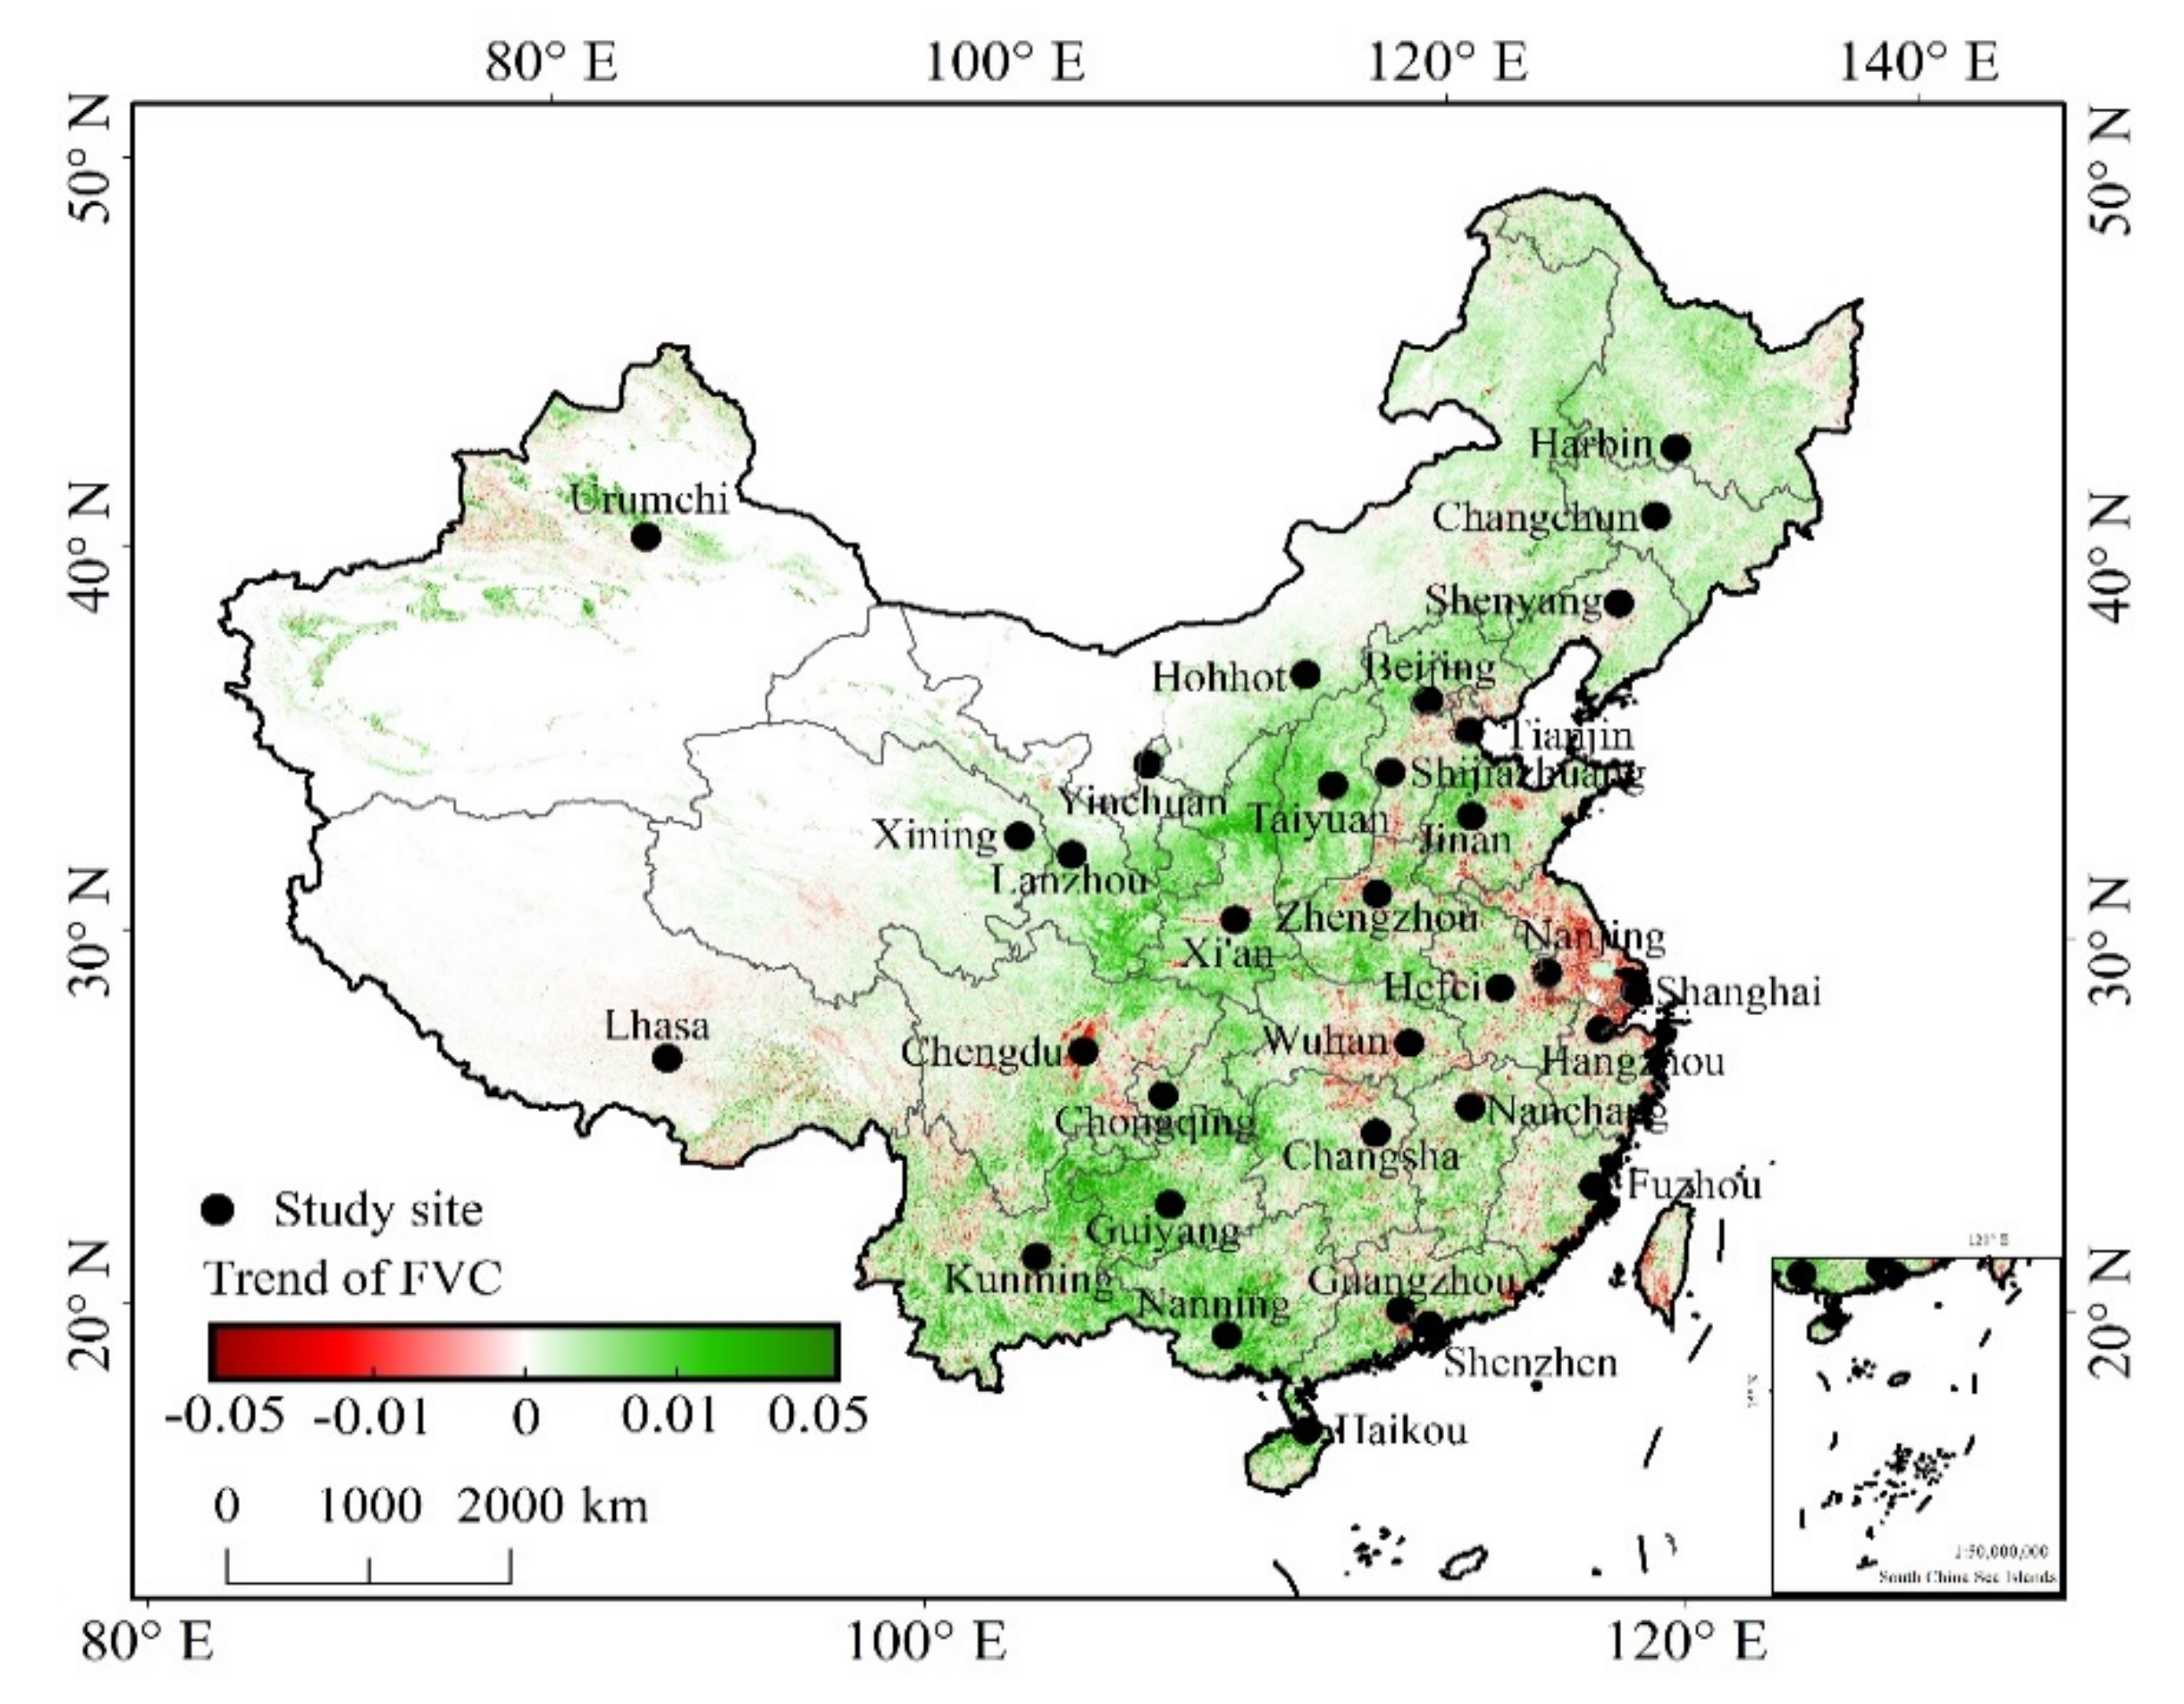
3.1. Vegetation Cover Change in China’s 32 Major Cities

From 2001 to 2018, China’s vegetation coverage showed a trend of large-scale growth overall, although some areas showed a decreasing trend. The areas showing increases were mainly concentrated in central China, such as Shaanxi Province, Shanxi Province, Guizhou Province, and Guangxi Province. The areas showing a decreasing trend included the Yangtze River Delta. The fastest growth rate of vegetation coverage was 0.05/year, which showed that the greening trend in China was very fast (Figure 3).
For different cities, the FVC changes can be divided into two categories: FVC changes that differed greatly between the core area and the expansion area, and FVC changes that showed limited differences between the core area and the expansion area. Among the 32 cities studied, similar FVC changes between the core area and expansion area were observed in Urumqi, Beijing, Lanzhou in Northern China, Shenzhen in Southern China, and other cities, and they were mainly manifested by a similar slope of FVC change in spatial distribution; whereas great differences in FVC changes between the core area and expansion area were observed in Southern China, Shanghai, Hangzhou, Chengdu, Fuzhou, Changsha, Chongqing, Nanning, Haikou, and other cities, and they manifested as unchanged growth, an increasing trend in the core area vegetation or a decreasing trend in the expansion area vegetation coverage (Figure 4).
In order to further explore the long-term trends of FVC change in 32 major cities in China, this study quantitatively analyzed the FVC changes in these urban cores and expansions. FVC changes come in four different ways. The first was the form in which FVC of both core and expansion areas decreased, which includes 16 cities, namely Harbin, Tianjin, Shijiazhuang, Zhengzhou, Xi’an, Nanjing, Hefei, Shanghai, Chengdu, Wuhan, Hangzhou, Lhasa, Chongqing, Nanchang, Fuzhou, and Guizhou. The second was a form in which both the core area and the expansion FVC increased, and this form includes five cities, namely Changchun, Urumchi, Beijing, Yinchuan, and Shenzhen. The third was the form of FVC increased in the core area and decreased in the expansion area, which includes four cities, namely Shenyang, Xining, Changsha, and Guiyang. The fourth was the form of FVC decreased in the core area and increased in the expansion area, which includes six cities, namely Hohhot, Taiyuan, Jinan, Nanning, Haikou, and Kunming (Figure 5).

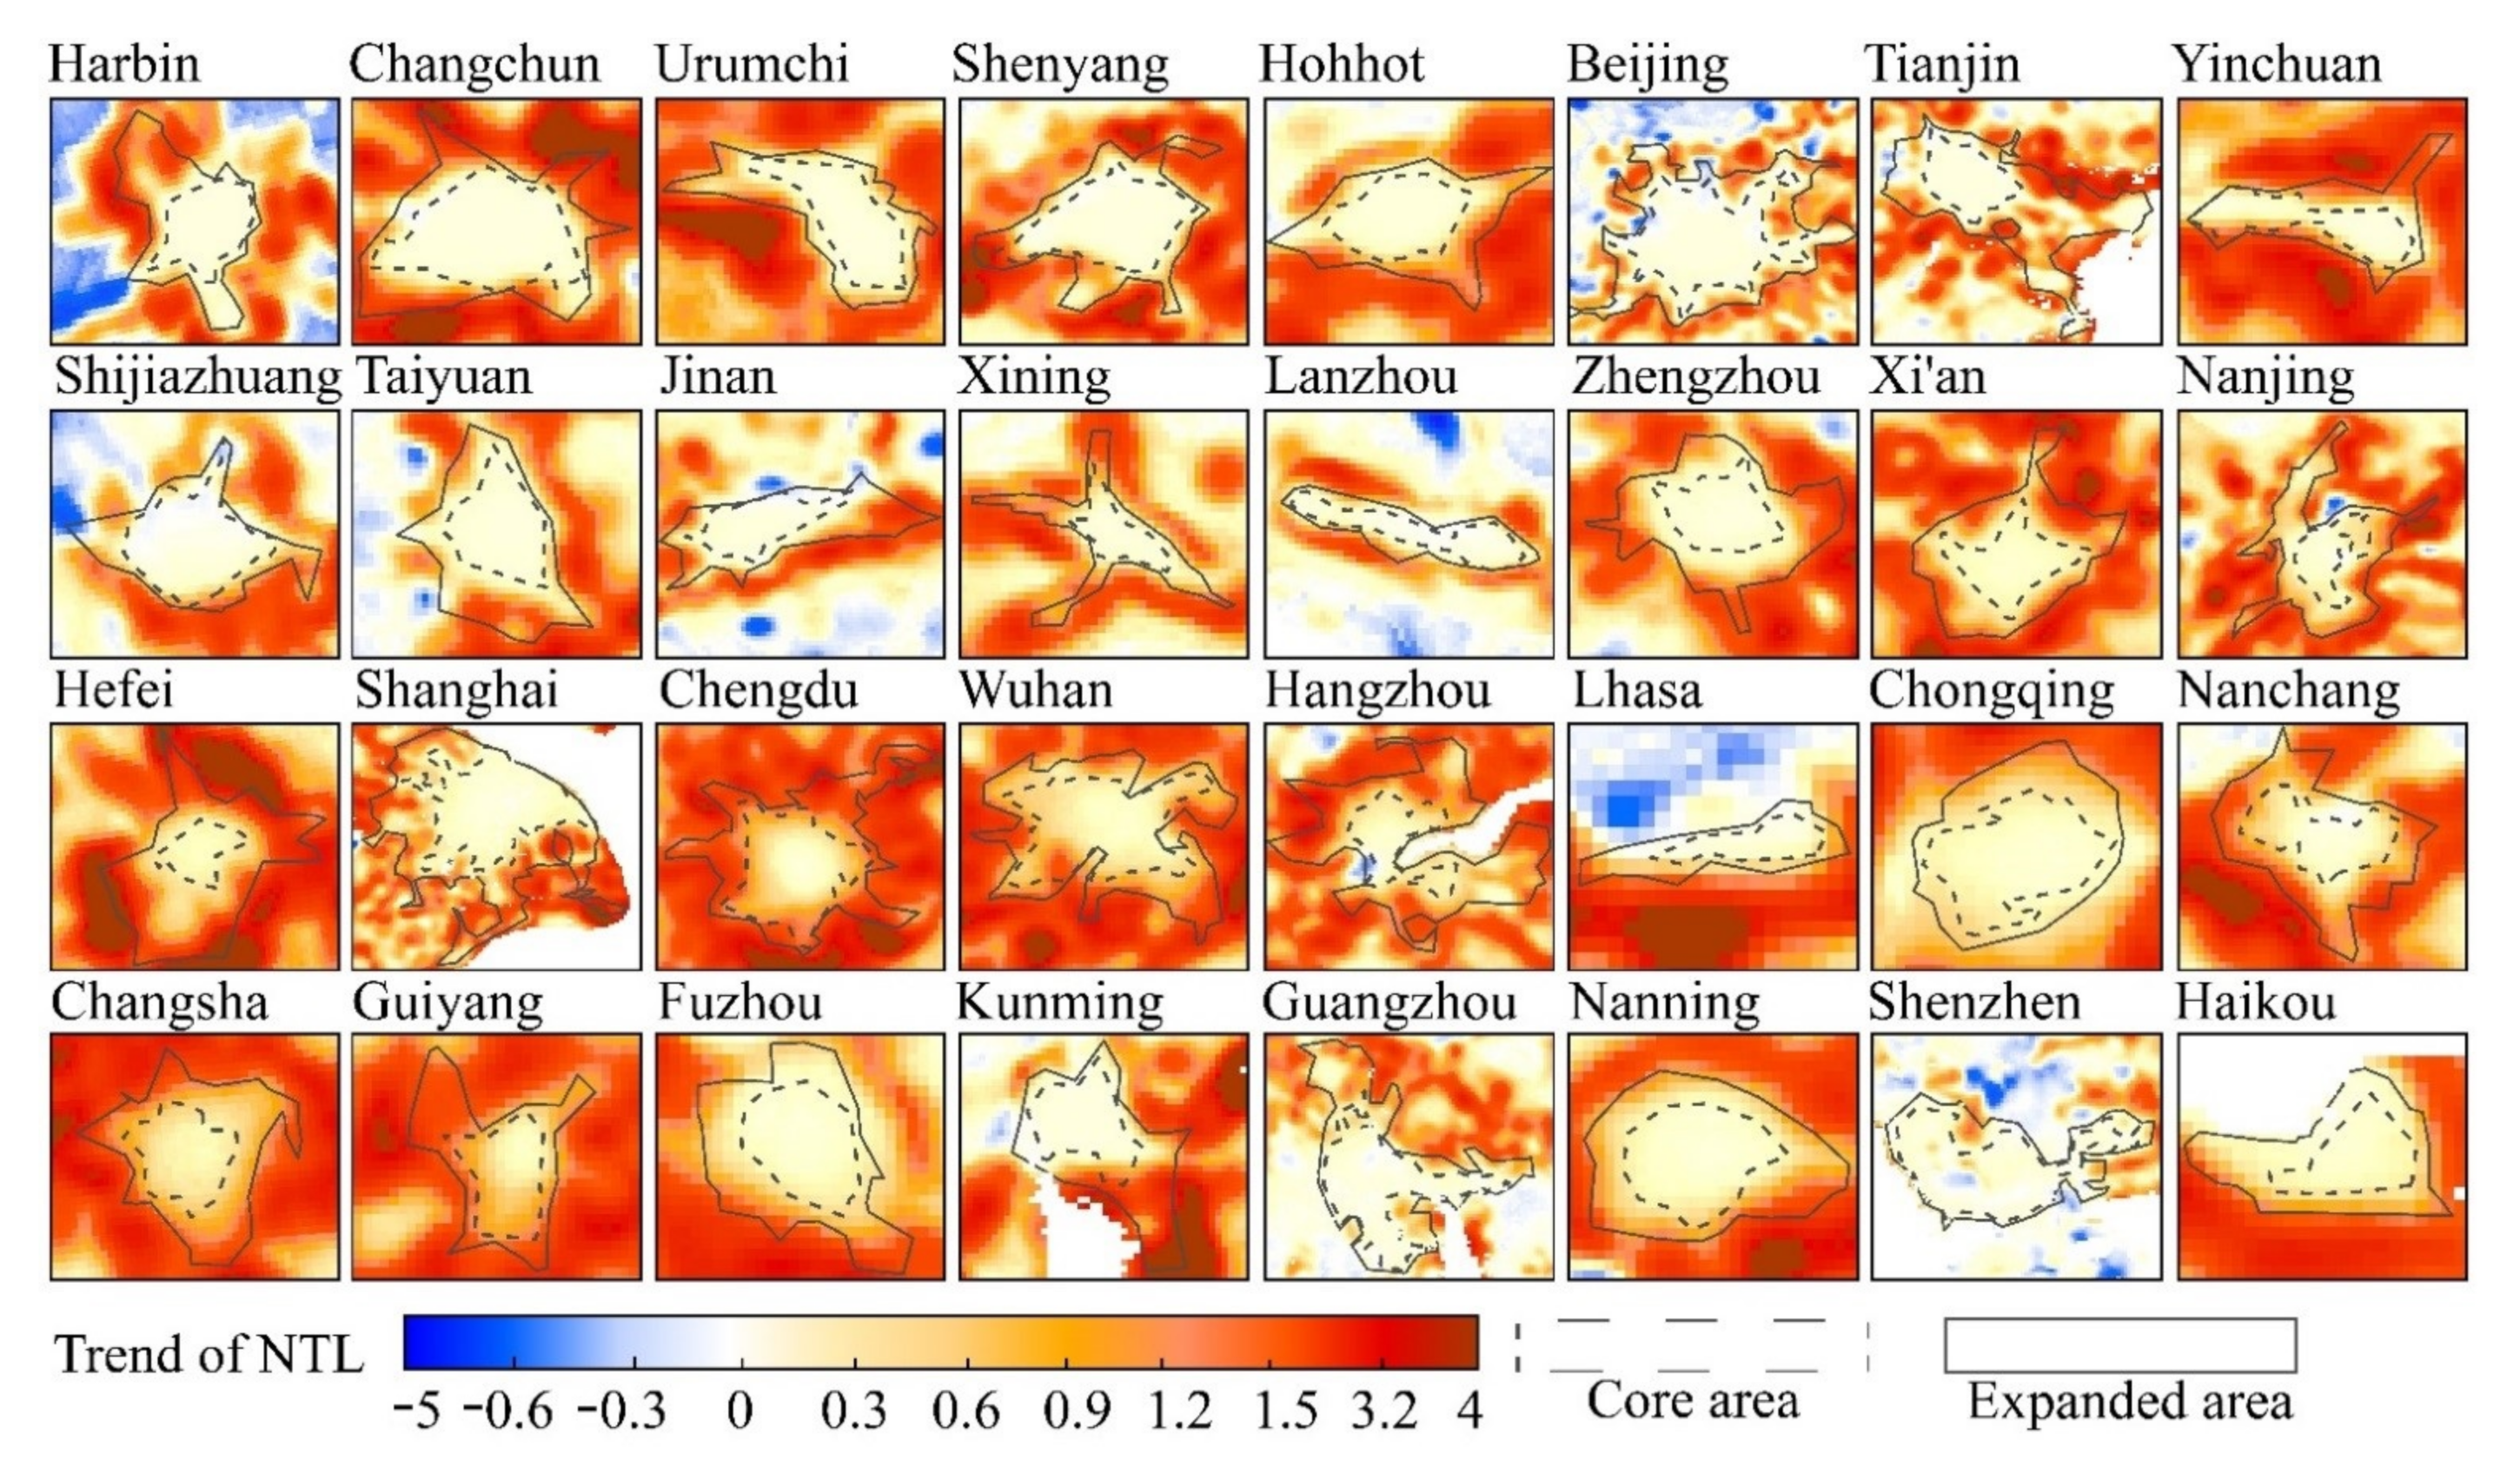
3.2. Urban Expansion Model

Figure 6 shows the changing trend of NTL in China from 2001 to 2018, and it reflects the drastic urban expansion process in China from 2001 to 2018. Figure 7 shows the spatial distribution of NTL trends in 32 major cities in China from 2001 to 2018, and it reflects the urban expansion patterns of different cities and the differences in urban development between core and expansion areas. Cities with drastic urban development in China are mainly concentrated in Eastern China, among which Shanghai, Nanjing, Yinchuan, Guangzhou, Shenzhen, and other regions had the most drastic urban expansion. In addition, we can also see that China’s urbanization process was generally fast and widely distributed in Eastern China. Major urban agglomerations gradually formed in China, such as the Yangtze River Delta urban agglomerations, Pearl River Delta urban agglomerations, and the Beijing–Tianjin–Hebei region.
Urban core areas and expansion areas had great differences in the urbanization process. The study found that the NTL of 32 major urban core areas in China remained unchanged, thus reflecting urban core area stability. Some cities’ urban expansion was rapid, such as Urumqi, Changchun, Yinchuan, Hefei, Chengdu, Wuhan, Nanchang, Changsha, Guiyang, and others. There was a significant trend of increasing NTL in the expansion area, thus reflecting the rapid urban expansion pattern of these cities. At the same time, there were some cities with small differences between the core areas and expansion areas, such as Beijing, Taiyuan, Lanzhou, Chongqing, Shenzhen, etc. Since urbanization, the area of each city has changed greatly. The expanded area of Shenzhen increased by 50.7%, and that of the Hefei expanded area increased by 614.2% (Figure 7).
To further explore the relative process of urbanization in 32 cities in China, this paper used the land cover data in 2000 and 2020 to explore urban changes from the perspective of land cover transfer in terms of the method and extent. Then, we calculated table statistics on the area and proportion of the land cover types converted to artificial surfaces in 32 major cities in China between 2000 and 2020. The results on the area and proportion of land cover types transferred from artificial surfaces showed that all 32 cities had different degrees of expansion, and the area of artificial surface gain was much higher than that of artificial surface loss. Among them, Shanghai had the largest area converted to artificial surface, followed by Beijing, and the results showed that the scope of urbanization of Shanghai was enormous between 2000 and 2020. Harbin had the largest proportion of the area converted to artificial surface, followed by Zhengzhou, which reflected that the degree of urbanization was intense. The area converted from artificial land to other land cover types was far less than that from artificial land, and the smallest area was observed in Lhasa. The results showed that the area converted from artificial land was only 0.6 km2, which accounted for approximately 1.8% of the Lhasa study area. Kunming had the smallest proportion of artificially transferred area at approximately 0.1% (Table 2).

3.3. Contribution Analysis of FVC Changes

3.3.1. Spatial Distribution of the Main Driving Factors

Two different methods of statistical analysis were applied to determine the contribution of drivers to vegetation in China’s 32 major cities. The methods of analysis used in Figure 8a,b were different from those in Figure 8c,d. The main difference was that Figure 8c,d combined the contributions of precipitation, temperature, and radiation, which were named climate and represented by the green color in the pie chart. Two different methods were used to show the contributions of different factors to the change in FVC.
Certain regular trends were observed among the dominant factors of vegetation in space. The contribution of CO2 increased slightly from north to south at close altitudes and exceeded 50% in Haikou and Shenzhen. Precipitation dominated vegetation growth in urban areas in Northern China, such as Inner Mongolia and Yinchuan in arid and semiarid regions. The contribution of temperature decreased gradually with increasing dimensionality and steadily increased with increasing shoreline distance. The contribution of radiation generally increased with decreasing dimensions and increasing coastline distance. The difference in urbanization contribution among the 32 cities was not obvious, and the contribution of coastal cities was slightly higher than that of inland cities. Nevertheless, the overall contribution was similar, which also reflected the good situation of synchronous development.
The sum of precipitation, temperature, and radiation contributions was greater than that of CO2, which became the main driving factor of urban vegetation. We found that the contribution of climate factors to vegetation growth was nearly 50%, which applied to the core and expansion areas of 32 cities simultaneously. The combination of climate factors and CO2 explained more than 70% of vegetation growth, indicating that the contribution of climate factors and carbon dioxide cannot be ignored in the process of vegetation growth. In comparison, the contribution of urbanization was relatively small and inly explained approximately 10% of vegetation growth overall.
The contributions of driving factors had similar regular trends but also exhibited differences. The main factors affecting vegetation growth in the 32 major Chinese cities were revealed using spatial distribution maps. Figure 9 shows that the FVC in 32 cities in China was still mainly affected by CO2 and climate factors. According to the leading factors in the core area, 32 cities were divided into three categories: cities with climate as the dominant factor, cities with CO2 as the dominant factor, and cities with multiple factors acting together. The cities with climate as the main factor included Hohhot, Beijing, Zhengzhou, Shanghai, Lhasa, and Fuzhou; the cities under significant CO2 control included Shijiazhuang, Xining, Changsha, Chengdu, Guiyang, Kunming, and Shenzhen; the cities influenced by multiple driving factors included Urumqi, Harbin, Tianjin, and Taiyuan.
In addition, the study also found that there were differences in the dominant factors underlying FVC change between the urban core area and the urban expansion area. For example, the core area of Xi’an was dominated by climate factors while the expansion area was dominated by CO2. The core area of Nanjing was affected by many factors, while the extended area was dominated by CO2. The core area of Nanchang was dominated by temperature, while the expansion area was dominated by urbanization. In some cities, the driving factors of FVC change in core and extended areas were consistent. For example, the change in FVC in the Changchun core area and the extended area was mainly affected by CO2. The dominant factor of FVC change in the core and extended areas of Lhasa was climate.

3.3.2. Contributions of Major Drivers

Table 3 showed the importance of driving factors to FVC changes in 32 cities. The driving factors had different effects on the FVC in different urban core areas. In Xining, Chengdu, Haikou, Shijiazhuang, and Kunming, CO2 contributed greatly and explained 66.3%, 55.2%, 53.8%, 51.6%, and 49.6% of FVC changes, respectively. Cities such as Hefei, Tianjin, Taiyuan, Nanning, and Xi’an were mainly impacted by urbanization, with a minimum value of 13.2% and a maximum value of 16.5%. The top five cities affected by precipitation were Yinchuan, Hohhot, Beijing, Lanzhou, and Guiyang, with contributions ranging from 21.2% to 37.6%. Temperature had the greatest impact on vegetation in Lhasa, Zhengzhou, Xi’an, Hangzhou, Fuzhou, and Kunming and explained approximately 21.8–32.7% of the vegetation coverage growth. Radiation played an important role in Tianjin, Shanghai, Urumqi, Harbin, Taiyuan, and other cities, with a maximum contribution of 22.4% and minimum contribution of 18.7%.
The relative contribution of driving factors to FVC change in the extended areas differed from that in the core areas. CO2 contributed the most in Shijiazhuang, Nanning, Chengdu, Xining, and Kunming and accounted for 52.3–67.2% of vegetation growth. Urbanization contributed the most in Nanchang, Tianjin, Yinchuan, Nanjing, and Shenyang and accounted for 14.5–19.3% of the FVC changes. Precipitation contributed the most in Lanzhou, Yinchuan, Hohhot, Beijing, and Kunming and accounted for 17.7–32.6% of the FVC changes. Temperature had the greatest impact on vegetation in Zhengzhou, Lhasa, Hohhot, Guizhou, and Hangzhou and explained 18.3–42.3% of the vegetation coverage variation. Radiation played an important role in Tianjin, Urumqi, Harbin, Taiyuan, Shenyang, and other areas and accounted for 15.9–26.4%.
The impacts of the same driving factors on vegetation in the same urban core area and expansion area were different. Among them, the difference in CO2 in Nanning, Fuzhou, Hefei, Xi’an, and Shijiazhuang was the largest. Among the top five cities, the largest difference was in Nanning, where it accounted for 33.3%, and the smallest difference was in Shijiazhuang, where it accounted for 15.6%. The contribution of urbanization in Nanchang, Nanning, Yinchuan, Hefei, Xining, and other cities varied greatly and ranged from 6.1% to 9.6%. The precipitation gaps in Lanzhou, Urumqi, Changsha, Yinchuan, Xining, and other cities were relatively large, with the maximum difference reaching 9.4% and the minimum difference reaching 7.9%. In Fuzhou, Zhengzhou, Xi’an, Nanning, Hangzhou, and other cities, there was a large difference in the contribution of temperature, with a difference between 6.2% and 14.7%. Radiation differed in Shanghai, Hangzhou, Hefei, Shenzhen, and other cities, and the difference in contribution was 4.2–9.5%.
In the core area, the dominant factor of FVC in 28 cities was CO2, among which the decrease of FVC in 20 cities was inhibited by CO2, the increase of FVC in 6 cities was promoted by CO2, and the growth trend of FVC in 2 cities was opposite to the effect of CO2, namely Nanchang and Fuzhou. The FVC in Nanchang showed a downward trend, while CO2 as the leading factor played a role in promoting it. In this case, it was considered to be caused by the inhibition of other factors except CO2. The FVC of Fuzhou core area showed a decreasing trend, while CO2 as the leading factor played a promoting role. In this case, it was considered to be caused by the inhibition of other factors except CO2. The rest of the four cities’ leading factor was not CO2, including the Hohhot, Beijing, Zhengzhou, and Lhasa. Among them, the FVC of Hohhot showed a trend of decline, and it mainly promoted by precipitation. The FVC of Beijing showed an increasing trend, and precipitation as the leading factor played a promoting role. The FVC of Zhengzhou showed a decreasing trend, and temperature, as the dominant factor, played an inhibiting role. The FVC in Lhasa core area showed a decreasing trend, and temperature was the dominant factor, which restricted the vegetation growth.
In the expansion area, the dominant factor of FVC in 29 cities was CO2, among which the decrease of FVC in 12 cities was inhibited by CO2, the increase of FVC in 10 cities was promoted by CO2, and the growth trend of FVC in 7 cities was contrary to the effect of CO2, including Shenyang, Taiyuan, Xining, Xi’an, Chengdu, and Chongqing. Among them, the FVC of Shenyang showed a decreasing trend, while CO2 played a promoting role as the leading factor. In this case, it was considered to be caused by the inhibition of urbanization, radiation, and other factors. The FVC of Xi’an showed a decreasing trend, while CO2 played a promoting role as the leading factor. In this case, urbanization, temperature, radiation, and other factors were considered to cause the inhibition. The rest of the three cities’ leading factor was not CO2, including Hohhot, Beijing, and Zhengzhou. Among them, the FVC of Hohhot showed an increasing trend, although CO2 was still an inhibition, with precipitation as the dominant factor, which played an important role in promoting the FVC. The FVC of Beijing showed an increasing trend, and precipitation as the leading factor played a promoting role. The FVC of Zhengzhou showed a decreasing trend, and the temperature as the dominant factor played a restraining role.

4. Discussion

From 2001 to 2018, we found that the vegetation in China generally showed an increasing trend from 2001 to 2018, although the vegetation in cities prevalently decreased. Eastern China showed increases in FVC and decreases in city clusters, especially in the Yangtze River Delta urban agglomeration [60]. This finding was in accordance with previous research results [18,20,61]. In addition, we found that the vegetation coverage in 21 of 32 cities showed a decreasing trend based on an analysis of changes in the FVC in China’s major cities. This result is also reflected in relevant studies [35]. The FVC of 32 urban expansion areas was higher than that of core areas. It is worth noting that due to the management of urban green space in recent years, the vegetation in the core areas and expansion areas of some cities recovered in the later stage of development.
Urbanization explained 10.6% of the variation in vegetation dynamics, which indicated that the indirect effects generated by urban expansion should not be ignored. We further confirmed that urbanization could exert both positive and negative impacts on vegetation. We found that the vegetation coverage in 21 of 32 cities showed a decreasing trend by analyzing the changes in FVC in China’s major cities. This result is also reflected in relevant studies [35]. However, an increasing trend in vegetation was detected in recent years in several cities. The difference might be explained by the changes during the urban development period [62]. Cities in the early stage of development might increase impervious surfaces to support city development at the cost of reducing vegetation coverage [60]. With the increased demands for better living conditions, more developed cities might increase urban vegetation [63].
Our results suggested that climate was the main driving factor of vegetation growth and explained 40.6% of the vegetation variation. Precipitation, temperature, and radiation explained 13.2%, 15.7%, and 11.7% of vegetation growth, respectively. Although the impacts of precipitation, temperature, and radiation on vegetation were similar, the responses of vegetation to precipitation, temperature, and radiation exhibited strong spatial heterogeneity. We found that the contribution of precipitation increased from wetter regions to drier regions (from 9.2–10.4%% in Haikou to 28.7–30.3% in Hohhot) (Table 3). Our results were similar to those of previous studies in that vegetation in arid and semiarid regions was dominated by precipitation [64]. However, the impact of vegetation was not significantly different between the core areas and expanded areas. Possible explanations included urban green space management, strengthened irrigation, and other measures, which decreased the differences in precipitation between the core area and the expansion area. We also found that the contribution degree generally showed an increasing trend with increasing latitude and coastline distance [12]. However, a significant difference was not found between the core area and the expanded area. A possible reason was that large impervious surfaces in the urban core and expansion areas increased albedo and temperature; therefore, temperature was no longer the limiting factor [36]. In our research, radiation mainly affected the vegetation in coastal areas and high altitude areas, which may be because radiation was stronger at high altitudes. The intensity of radiation was also strengthened due to the influence of reflectivity in coastal areas.
In addition, the contribution of CO2 to vegetation variation cannot be ignored. CO2 was the dominant factor affecting urban vegetation, and the average driving contribution of CO2 to urban vegetation was 39.2%. This result was also reported in previous studies [22,65]. By observing the contribution of urban driving factors, we found that CO2 dominated vegetation growth in 29 cities. The other three cities, namely Hohhot, Zhengzhou, and Lhasa, were dominated by precipitation, temperature, and radiation. The reason may be that under favorable hydrothermal conditions, CO2 became the main growth factor of vegetation by affecting the carboxylation reaction of vegetation. However, Hohhot is located in arid and semiarid areas, and the influence of precipitation was more important. The temperature in Lhasa was low, which was the main factor limiting vegetation growth. In Zhengzhou, temperature was the dominant factor, followed by CO2, which may be related to increases in temperature under increased albedo. We also found that in the core area, the dominant factor of FVC in 28 cities was CO2, among which the decrease of FVC in 20 cities was inhibited by CO2, the increase of FVC in 6 cities was promoted by CO2, and the growth trend of FVC in 2 cities was opposite to the effect of CO2. In the expansion area, the dominant factor of FVC in 29 cities was CO2, among which the decrease of FVC in 12 cities was inhibited by CO2, the increase of FVC in 10 cities was promoted by CO2, and the growth trend of FVC in 7 cities was contrary to the effect of CO2. These findings indicated that CO2 was essential for the growth of vegetation, and its role varies from city to city.
We focused on China’s 32 major cities and quantified the relative contributions of climate, urbanization, and CO2 to FVC change. However, some uncertainties remained in this study. First, the interaction between human activities and climate may not have been fully considered in our research. For example, human activities have changed the types of underlying surfaces in cities, thereby increasing reflectivity and temperature and causing changes in vegetation growth. To date, the complex interaction mechanism between human activities and climate change still needs further discussion [47,66]. Second, although the effects of climate, CO2, and urbanization on vegetation growth were considered, some factors, such as nitrogen deposition, topography, tree age, and other driving factors, were not considered but also affect vegetation growth [21,22,67,68]. Third, it is very complex to extract urban boundaries from lighting data, as can be seen from the review of urban mapping technology system based on NTL data in Zhou et al. ‘s research [69]. At present, a number of scholars have developed a variety of urban extent mapping methods, including the cluster-based method [70], method based on the NTL gradient [71], automatic delineation framework and morphology combined method [72], random forest classifier method [31], and stepwise-partitioning framework method [73], which have improved the deficiency of using a single threshold in the past [74,75,76] and helped to carry out research on a global scale. In our study, we learned the related ideas of multi threshold extraction, and extracted the boundaries of 32 cities in China by using the characteristics of data gradient and divergence. However, this result may be affected by the resolution of the NTL data [69]. Thus, in the future, finer lighting data can be used to achieve more accurate urban boundary extraction. Finally, due to the lack of CO2 data covering China in a long time series, this study only used the data of the WLG site as the data of China for calculation. Figure 10 showed the status of CO2 observations at the WLG site from 2001 to 2018. The data at the WLG site shows a continuous increase of 2.2 ppm per year. CO2 has spatio-temporal differences among cities, and the difference in concentrations between Eastern and Western China ranges from 2 to 4 ppm, meaning the difference is less than 1% [77,78]. It should be pointed out that the impact of CO2 on vegetation growth obtained in this study is only a preliminary impact result based on the statistical level of GLM regression equation. In fact, the specific positive promotion or negative inhibition effects should be further considered and evaluated by introducing the actual vegetation dynamic growth process model.

5. Conclusions

This study quantified the relative importance of precipitation, temperature, radiation, urbanization, and CO2 on vegetation dynamics over China’s 32 major cities from 2001 to 2018. First, we found that the vegetation in China generally showed an increasing trend from 2001 to 2018. Nevertheless, the vegetation prevalence in cities decreased, with the vegetation coverage in 21 of the 32 cities showing a decreasing trend, among which the FVC in the core area decreased in 23 cities. The FVC in the expansion area decreased in 21 cities. Second, the changes in NTL data and land cover data indicated that urban areas continued to expand from 2001 to 2018. Night light data showed that the expansion areas of 32 cities have increased to varying degrees. A comparison of the area statistics of expansion and core areas showed that the area increased by more than six times, with an average increase of approximately 168%. Land cover data showed that various land cover types changed to artificial surface types over 18 years, thereby increasing the area of urban impervious surfaces. Third, China has experienced rapid urbanization; however, the vegetation in China’s 32 major cities was still mainly dominated by climate factors and CO2 rather than urbanization. The relative contributions of climate, CO2, and urbanization to FVC variations in China’s 32 major cities were 40.6%, 39.2%, and 10.6%, respectively.
This study evaluated the vegetation change trend and then quantified the contributions of driving factors (such as precipitation, temperature, radiation, CO2, and urbanization) to vegetation growth. Further research should consider the contribution of additional influencing factors on vegetation growth, such as topography. This study performed a change and attribution analysis of vegetation coverage in China over a long time series, and it enriches the research on vegetation and driving factors and has reference value for explaining the complex biophysical mechanism between vegetation and the environment. Moreover, it represents crucial theoretical research and provides important scientific information for environmental protection.

Author Contributions

Conceptualization, B.M. and X.Z.; Formal analysis, B.M., X.Z. and L.S.; Funding acquisition, X.Z.; Methodology, X.Z.; Writing—original draft, B.M.; Writing—review and editing, B.M., X.Z., J.Z., N.L., L.S., Q.W., N.S., M.S., Y.G. and S.Z. All authors have read and agreed to the published version of the manuscript.

Funding

This study was funded by the National Natural Science Foundation of China (42090012): the National Key Research and Development Program of China (No. 2016YFB0501404 and No. 2016YFA0600103), and the Natural Science Foundation of Anhui province of China (2008085QD167).

Institutional Review Board Statement

Not applicable.

Informed Consent Statement

Not applicable.

Data Availability Statement

Fractional vegetation cover dataset is available at http://www.geodata.cn/, accessed on 10 December 2021. Nighttime light dataset is available at https://figshare.com/articles/dataset/, accessed on 10 December 2021. Climate-related dataset is available at http://data.tpdc.ac.cn/, accessed on 10 December 2021. Globe30 dataset is available at http://www.globallandcover.com/, accessed on 10 December 2021. CO2 dataset is available at http://www.ncdc.ac.cn/ and https://www.esrl.noaa.gov/, accessed on 10 December 2021.

Acknowledgments

We appreciate the “National Earth System Science Data Center, National Science& Technology Infrastructure of China” for providing fractional vegetation cover data. We appreciate the “National Tibetan Plateau Data Center” for providing the climate-related data. We also appreciate the “National Cryosphere Desert Data Center” and “NOAA Earth System Research Laboratories (ESRL) “for providing the CO2 data. We thank the anonymous reviewers and editor for their valuable comments on the manuscript.

Conflicts of Interest

The authors declare no conflict of interest.

References

  1. Duncan, J.; Boruff, B.; Saunders, A.; Sun, Q.; Hurley, J.; Amati, M. Turning down the heat: An enhanced understanding of the relationship between urban vegetation and surface temperature at the city scale. Sci. Total Environ. 2019, 656, 118–128. [Google Scholar] [CrossRef]
  2. Rumora, L.; Majić, I.; Miler, M.; Medak, D. Spatial video remote sensing for urban vegetation mapping using vegetation indices. Urban Ecosyst. 2021, 24, 21–33. [Google Scholar] [CrossRef]
  3. Hashim, H.; Abd Latif, Z.; Adnan, N.A.; Hashim, I.C.; Zahari, N.F. Vegetation extraction with pixel based classification approach in urban park area. Plan. Malays. 2021, 19, 1. [Google Scholar] [CrossRef]
  4. Zhang, Y.; Shao, Z. Assessing of urban vegetation biomass in combination with LiDAR and high-resolution remote sensing images. Int. J. Remote Sens. 2021, 42, 964–985. [Google Scholar] [CrossRef]
  5. Paschalis, A.; Chakraborty, T.; Fatichi, S.; Meili, N.; Manoli, G. Urban forests as main regulator of the evaporative cooling effect in cities. AGU Adv. 2021, 2, e2020AV000303. [Google Scholar] [CrossRef]
  6. Ayub, M.A.; Farooqi, Z.U.R.; Umar, W.; Nadeem, M.; Ahmad, Z.; Fatima, H.; Iftikhar, I.; Anjum, M.Z. Role of urban vegetation: Urban forestry in micro-climate pollution management. In Examining International Land Use Policies, Changes, and Conflicts; IGI Global: Hershey, PA, USA, 2021; pp. 231–251. [Google Scholar]
  7. Perini, K.; Pérez, G. Ventilative cooling and urban vegetation. In Innovations in Ventilative Cooling; Springer: Berlin/Heidelberg, Germany, 2021; pp. 213–234. [Google Scholar]
  8. Liao, J.; Tan, X.; Li, J. Evaluating the vertical cooling performances of urban vegetation scenarios in a residential environment. J. Build. Eng. 2021, 39, 102313. [Google Scholar] [CrossRef]
  9. Patel, S. The potential for urban vegetation to mitigate ambient air pollution threats to public health. Topophilia 2020, 53–62. [Google Scholar] [CrossRef]
  10. Meili, N.; Acero, J.A.; Peleg, N.; Manoli, G.; Burlando, P.; Fatichi, S. Vegetation cover and plant-trait effects on outdoor thermal comfort in a tropical city. Build. Environ. 2021, 195, 107733. [Google Scholar] [CrossRef]
  11. Dissanayaka, C.; Weerasinghe, U.; Wijesundara, K. Urban vegetation and morphology parameters affecting microclimate and outdoor thermal comfort in warm humid cities—A review of research in the past decade. In Proceedings of the International Conference on Climate Change, Colombo, Sri Lanka, 18–19 February 2021; pp. 1–17. [Google Scholar]
  12. Nemani, R.R.; Keeling, C.D.; Hashimoto, H.; Jolly, W.M.; Piper, S.C.; Tucker, C.J.; Myneni, R.B.; Running, S.W. Climate-driven increases in global terrestrial net primary production from 1982 to 1999. Science 2003, 300, 1560–1563. [Google Scholar] [CrossRef] [Green Version]
  13. Guo, B.; Zhang, J.; Meng, X.; Xu, T.; Song, Y. Long-term spatio-temporal precipitation variations in China with precipitation surface interpolated by ANUSPLIN. Sci. Rep. 2020, 10, 1–17. [Google Scholar] [CrossRef]
  14. Fensholt, R.; Langanke, T.; Rasmussen, K.; Reenberg, A.; Prince, S.D.; Tucker, C.; Scholes, R.J.; Le, Q.B.; Bondeau, A.; Eastman, R. Greenness in semi-arid areas across the globe 1981–2007—an Earth Observing Satellite based analysis of trends and drivers. Remote Sens. Environ. 2012, 121, 144–158. [Google Scholar] [CrossRef]
  15. Jeong, S.; Ho, C.; Kim, K.; Jeong, J. Reduction of spring warming over East Asia associated with vegetation feedback. Geophys. Res. Lett. 2009, 36, 1–5. [Google Scholar] [CrossRef]
  16. Lucht, W.; Prentice, I.C.; Myneni, R.B.; Sitch, S. Climatic control of the high-latitude vegetation greening trend and pinatubo effect. Science 2002, 296, 1687–1689. [Google Scholar] [CrossRef] [PubMed] [Green Version]
  17. Ho, C.H.; Lee, E.J.; Lee, I.; Jeong, S.J. Earlier spring in Seoul, Korea. Int. J. Climatol. A J. R. Meteorol. Soc. 2010, 26, 2117–2127. [Google Scholar] [CrossRef]
  18. Hua, W.; Chen, H.; Zhou, L.; Xie, Z.; Qin, M.; Li, X.; Ma, H.; Huang, Q.; Sun, S. Observational quantification of climatic and human influences on vegetation greening in China. Remote Sens. 2017, 9, 425. [Google Scholar] [CrossRef] [Green Version]
  19. Trumbore, S. Carbon respired by terrestrial ecosystems–recent progress and challenges. Glob. Chang. Biol. 2006, 12, 141–153. [Google Scholar] [CrossRef] [Green Version]
  20. Chi, C.; Park, T.; Wang, X.; Piao, S.; Xu, B.; Chaturvedi, R.K.; Fuchs, R.; Brovkin, V.; Ciais, P.; Fensholt, R. China and India lead in greening of the world through land-use management. Nat. Sustain. 2019, 2, 122–129. [Google Scholar]
  21. Zhu, Z.; Piao, S.; Myneni, R.B.; Huang, M.; Zeng, Z.; Canadell, J.G.; Ciais, P.; Sitch, S.; Friedlingstein, P.; Arneth, A. Greening of the Earth and its drivers. Nat. Clim. Chang. 2016, 6, 791–795. [Google Scholar] [CrossRef]
  22. Piao, S.; Yin, G.; Tan, J.; Cheng, L.; Huang, M.; Li, Y.; Liu, R.; Mao, J.; Myneni, R.B.; Peng, S. Detection and attribution of vegetation greening trend in China over the last 30 years. Glob. Chang. Biol. 2015, 21, 1601–1609. [Google Scholar] [CrossRef]
  23. Wang, S.; Zhang, Y.; Ju, W.; Chen, J.M.; Ciais, P.; Cescatti, A.; Sardans, J.; Janssens, I.A.; Wu, M. Recent global decline of CO2 fertilization effects on vegetation photosynthesis. Science 2020, 370, 1295–1300. [Google Scholar] [CrossRef]
  24. Singh, C.M.; Singh, P.; Tiwari, C.; Purwar, S.; Kumar, M.; Pratap, A.; Singh, S.; Chugh, V.; Mishra, A.K. Improving Drought Tolerance in Mungbean (Vigna radiata L. Wilczek): Morpho-Physiological, Biochemical and Molecular Perspectives. Agronomy 2021, 11, 1534. [Google Scholar] [CrossRef]
  25. Flach, M.; Brenning, A.; Gans, F.; Reichstein, M.; Sippel, S.; Mahecha, M.D. Vegetation modulates the impact of climate extremes on gross primary production. Biogeosci. Discuss. 2020, 18, 39–53. [Google Scholar] [CrossRef]
  26. Yuan, M.; Wang, L.; Lin, A.; Liu, Z.; Li, Q.; Qu, S. Vegetation green up under the influence of daily minimum temperature and urbanization in the Yellow River Basin, China. Ecol. Indic. 2020, 108, 105760. [Google Scholar] [CrossRef]
  27. Liang, Z.; Wang, Y.; Sun, F.; Jiang, H.; Huang, J.; Shen, J.; Wei, F.; Li, S. Exploring the combined effect of urbanization and climate variability on urban vegetation: A multi-perspective study based on more than 3000 cities in China. Remote Sens. 2020, 12, 1328. [Google Scholar] [CrossRef] [Green Version]
  28. Zhang, Q.; Seto, K.C. Mapping urbanization dynamics at regional and global scales using multi-temporal DMSP/OLS nighttime light data. Remote Sens. Environ. 2011, 115, 2320–2329. [Google Scholar] [CrossRef]
  29. Fu, P.; Weng, Q. A time series analysis of urbanization induced land use and land cover change and its impact on land surface temperature with Landsat imagery. Remote Sens. Environ. 2016, 175, 205–214. [Google Scholar] [CrossRef]
  30. Xu, D.; Yang, F.; Yu, L.; Zhou, Y.; Li, H.; Ma, J.; Huang, J.; Wei, J.; Xu, Y.; Zhang, C. Quantization of the coupling mechanism between eco-environmental quality and urbanization from multisource remote sensing data. J. Clean. Prod. 2021, 321, 128948. [Google Scholar] [CrossRef]
  31. Cao, W.; Zhou, Y.; Li, R.; Li, X.; Zhang, H. Monitoring long-term annual urban expansion (1986–2017) in the largest archipelago of China. Sci. Total Environ. 2021, 776, 146015. [Google Scholar] [CrossRef]
  32. Ma, T.; Zhou, C.; Pei, T.; Haynie, S.; Fan, J. Quantitative estimation of urbanization dynamics using time series of DMSP/OLS nighttime light data: A comparative case study from China’s cities. Remote Sens. Environ. 2012, 124, 99–107. [Google Scholar] [CrossRef]
  33. United Nations, United Nations Department of Economic and Social Affairs, Popululation Division. World Urbanization Prospects: The 2014 Revision; United Nations: New York, NY, USA, 2015; pp. 1–18.
  34. Wu, Y.; Tang, G.; Gu, H.; Liu, Y.; Yang, M.; Sun, L. The variation of vegetation greenness and underlying mechanisms in Guangdong province of China during 2001–2013 based on MODIS data. Sci. Total Environ. 2018, 653, 536–546. [Google Scholar] [CrossRef]
  35. Zhou, D.; Zhao, S.; Liu, S.; Zhang, L. Spatiotemporal trends of terrestrial vegetation activity along the urban development intensity gradient in China’s 32 major cities. Sci. Total Environ. 2014, 488, 136–145. [Google Scholar] [CrossRef] [PubMed]
  36. Mishra, N.B.; Mainali, K.P. Greening and browning of the Himalaya: Spatial patterns and the role of climatic change and human drivers. Sci. Total Environ. 2017, 587, 326–339. [Google Scholar] [CrossRef] [PubMed]
  37. Arnfield, A.J. Two decades of urban climate research: A review of turbulence, exchanges of energy and water, and the urban heat island. Int. J. Climatol. A J. R. Meteorol. Soc. 2003, 23, 1–26. [Google Scholar] [CrossRef]
  38. Li, D.; Wu, S.; Liang, Z.; Li, S. The impacts of urbanization and climate change on urban vegetation dynamics in China. Urban For. Urban Green. 2020, 54, 126764. [Google Scholar] [CrossRef]
  39. Jin, K.; Wang, F.; Li, P. Responses of vegetation cover to environmental change in large cities of China. Sustainability 2018, 10, 270. [Google Scholar] [CrossRef] [Green Version]
  40. Huang, B.; Li, Z.; Dong, C.; Zhu, Z.; Zeng, H. Effects of urbanization on vegetation conditions in coastal zone of China. Prog. Phys. Geogr. Earth Environ. 2020, 45, 564–579. [Google Scholar] [CrossRef]
  41. Wang, J.; Wang, K.; Zhang, M.; Zhang, C. Impacts of climate change and human activities on vegetation cover in hilly southern China. Ecol. Eng. J. Ecotechnol. 2015, 81, 451–461. [Google Scholar] [CrossRef]
  42. Zhou, Q.; Zhao, X.; Wu, D.; Tang, R.; Peng, Y. Impact of Urbanization and Climate on Vegetation Coverage in the Beijing–Tianjin–Hebei Region of China. Remote Sens. 2019, 11, 2452. [Google Scholar] [CrossRef] [Green Version]
  43. Gottfried, M.; Pauli, H.; Futschik, A.; Akhalkatsi, M.; Barancok, P.; Alonso, J.B.; Coldea, G.; Dick, J.; Erschbamer, B.; Calzado, M.F. Continent-wide response of mountain vegetation to climate change. Nat. Clim. Chang. 2012, 2, 111–115. [Google Scholar] [CrossRef]
  44. Pearson, R.G.; Phillips, S.J.; Loranty, M.M.; Beck, P.; Damoulas, T.; Knight, S.J.; Goetz, S.J. Shifts in Arctic vegetation and associated feedbacks under climate change. Nat. Clim. Chang. 2013, 3, 673–677. [Google Scholar] [CrossRef]
  45. Peng, S.; Piao, S.; Ciais, P.; Myneni, R.B.; Chen, A.; Chevallier, F.D.R.; Dolman, A.J.; IJanssens, V.A.; Peñuela, J.; Zhang, G. Asymmetric effects of daytime and night-time warming on Northern Hemisphere vegetation. Nature 2013, 501, 88. [Google Scholar] [CrossRef] [PubMed]
  46. Tang, H.; Yu, K.; Hagolle, O.; Jiang, K.; Geng, X.; Zhao, Y. A cloud detection method based on a time series of MODIS surface reflectance images. Int. J. Digit. Earth 2013, 6, 157–171. [Google Scholar] [CrossRef]
  47. Jia, K.; Liang, S.; Liu, S.; Li, Y.; Xiao, Z.; Yao, Y.; Jiang, B.; Zhao, X.; Wang, X.; Xu, S. Global land surface fractional vegetation cover estimation using general regression neural networks from MODIS surface reflectance. IEEE Trans. Geosci. Remote Sens. 2015, 53, 4787–4796. [Google Scholar] [CrossRef]
  48. Yang, L.; Jia, K.; Liang, S.; Liu, J.; Wang, X. Comparison of four machine learning methods for generating the GLASS fractional vegetation cover product from MODIS data. Remote Sens. 2016, 8, 682. [Google Scholar] [CrossRef] [Green Version]
  49. Jia, K.; Liang, S.; Wei, X.; Yao, Y.; Yang, L.; Zhang, X.; Liu, D. Validation of Global LAnd Surface Satellite (GLASS) fractional vegetation cover product from MODIS data in an agricultural region. Remote Sens. Lett. 2018, 9, 847–856. [Google Scholar] [CrossRef]
  50. Li, X.; Zhou, Y.; Zhao, M.; Zhao, X. A harmonized global nighttime light dataset 1992–2018. Sci. Data 2020, 7, 1–9. [Google Scholar] [CrossRef]
  51. Yang, K.; He, J.; Tang, W.; Qin, J.; Cheng, C.C. On downward shortwave and longwave radiations over high altitude regions: Observation and modeling in the Tibetan Plateau. Agric. For. Meteorol. 2010, 150, 38–46. [Google Scholar] [CrossRef]
  52. He, J.; Yang, K.; Tang, W.; Lu, H.; Qin, J.; Chen, Y.; Li, X. The first high-resolution meteorological forcing dataset for land process studies over China. Sci. Data 2020, 7, 1–11. [Google Scholar] [CrossRef] [Green Version]
  53. Jun, C.; Ban, Y.; Li, S. Open access to Earth land-cover map. Nature 2014, 514, 434. [Google Scholar] [CrossRef] [Green Version]
  54. Du, X.; Zhao, X.; Zhou, T.; Jiang, B.; Xu, P.; Wu, D.; Tang, B. Effects of climate factors and human activities on the ecosystem water use efficiency throughout Northern China. Remote Sens. 2019, 11, 2766. [Google Scholar] [CrossRef] [Green Version]
  55. Tao, S.; Fang, J.; Zhao, X.; Zhao, S.; Shen, H.; Hu, H.; Tang, Z.; Wang, Z.; Guo, Q. Rapid loss of lakes on the Mongolian Plateau. Proc. Natl. Acad. Sci. USA 2015, 112, 2281–2286. [Google Scholar] [CrossRef] [PubMed] [Green Version]
  56. Calcagno, V.; De Mazancourt, C. glmulti: An R package for easy automated model selection with (generalized) linear models. J. Stat. Softw. 2010, 34, 1–29. [Google Scholar] [CrossRef] [Green Version]
  57. Lopatin, J.; Dolos, K.; Hernández, H.; Galleguillos, M.; Fassnacht, F. Comparing generalized linear models and random forest to model vascular plant species richness using LiDAR data in a natural forest in central Chile. Remote Sens. Environ. 2016, 173, 200–210. [Google Scholar] [CrossRef]
  58. Ravindra, K.; Rattan, P.; Mor, S.; Aggarwal, A.N. Generalized additive models: Building evidence of air pollution, climate change and human health. Environ. Int. 2019, 132, 104987. [Google Scholar] [CrossRef] [PubMed]
  59. Virtanen, R.; Luoto, M.; Rämä, T.; Mikkola, K.; Hjort, J.; Grytnes, J.-A.; Birks, H.J.B. Recent vegetation changes at the high-latitude tree line ecotone are controlled by geomorphological disturbance, productivity and diversity. Glob. Ecol. Biogeogr. 2010, 19, 810–821. [Google Scholar] [CrossRef]
  60. Yuan, J.; Xu, Y.; Xiang, J.; Wu, L.; Wang, D. Spatiotemporal variation of vegetation coverage and its associated influence factor analysis in the Yangtze River Delta, eastern China. Environ. Sci. Pollut. Res. 2019, 26, 32866–32879. [Google Scholar] [CrossRef]
  61. Piao, S.; Wang, X.; Park, T.; Chen, C.; Myneni, R.B. Characteristics, drivers and feedbacks of global greening. Nat. Rev. Earth Environ. 2019, 1, 1–14. [Google Scholar] [CrossRef]
  62. Fu, W.; Lü, Y.; Harris, P.; Comber, A.; Wu, L. Peri-urbanization may vary with vegetation restoration: A large scale regional analysis. Urban For. Urban Green. 2018, 29, 77–87. [Google Scholar] [CrossRef] [Green Version]
  63. Liu, Q.; Yang, Y.; Tian, H.; Zhang, B.; Lei, G.U. Assessment of human impacts on vegetation in built-up areas in China based on AVHRR, MODIS and DMSP_OLS nighttime light data, 1992–2010. Chin. Geogr. Sci. 2014, 24, 231–244. [Google Scholar] [CrossRef]
  64. Zhao, X.; Tan, K.; Zhao, S.; Fang, J. Changing climate affects vegetation growth in the arid region of the northwestern China. J. Arid Environ. 2011, 75, 946–952. [Google Scholar] [CrossRef]
  65. Norby, R.J.; Delucia, E.H.; Gielen, B.; Alfapietra, C.C.; Giardina, C.P.; King, J.S.; Ledford, J.; Mccarthy, H.R.; Moore, D.J.; Ceulemans, R. Forest response to elevated CO2 is conserved across a broad range of productivity. Proc. Natl. Acad. Sci. USA 2005, 102, 18052–18056. [Google Scholar] [CrossRef] [PubMed] [Green Version]
  66. Pourghasemi, H.R.; Rossi, M. Landslide susceptibility modeling in a landslide prone area in Mazandarn Province, north of Iran: A comparison between GLM, GAM, MARS, and M-AHP methods. Theor. Appl. Climatol. 2017, 130, 1–25. [Google Scholar] [CrossRef]
  67. Mao, J.; Ribes, A.; Yan, B.; Shi, X.; Thornton, P.E.; Séférian, R.; Ciais, P.; Myneni, R.B.; Douville, H.; Piao, S. Human-induced greening of the northern extratropical land surface. Nat. Clim. Chang. 2016, 6, 959–963. [Google Scholar] [CrossRef]
  68. Johnson, S.E.; Abrams, M.D. Age class, longevity and growth rate relationships: Protracted growth increases in old trees in the eastern United States. Tree Physiol. 2009, 29, 1317–1328. [Google Scholar] [CrossRef] [Green Version]
  69. Li, X.; Zhou, Y. Urban mapping using DMSP/OLS stable night-time light: A review. Int. J. Remote Sens. 2016, 38, 6030–6046. [Google Scholar] [CrossRef]
  70. Zhou, Y.; Smith, S.J.; Elvidge, C.D.; Zhao, K.; Thomson, A.; Imhoff, M. A cluster-based method to map urban area from DMSP/OLS nightlights. Remote Sens. Environ. 2014, 147, 173–185. [Google Scholar] [CrossRef]
  71. Zhao, M.; Zhou, Y.; Li, X.; Cheng, W.; Zhou, C.; Ma, T.; Li, M.; Huang, K. Mapping urban dynamics (1992–2018) in Southeast Asia using consistent nighttime light data from DMSP and VIIRS. Remote Sens. Environ. 2020, 248, 111980. [Google Scholar] [CrossRef]
  72. Li, X.; Gong, P.; Zhou, Y.; Wang, J.; Bai, Y.; Chen, B.; Hu, T.; Xiao, Y. Mapping global urban boundaries from the global artificial impervious area (GAIA) data. Environ. Res. Lett. 2020, 15, 094044. [Google Scholar] [CrossRef]
  73. Zhao, M.; Cheng, C.; Zhou, Y.; Li, X.; Shen, S.; Song, C. A global dataset of annual urban extents (1992–2020) from harmonized nighttime lights. Earth Syst. Sci. Data Discuss. 2021, 7, 1–25. [Google Scholar] [CrossRef]
  74. Cao, X.; Chen, J.; Imure, H.; Higashi, O. A SVM-based method to extract urban areas from DMSP-OLS and SPOT VGT data. Remote Sens. Environ. 2009, 113, 2205–2209. [Google Scholar] [CrossRef]
  75. Frolking, S.; Milliman, T.; Seto, K.C.; Friedl, M.A. A globa lfingerprint of macro-scale changes in urban structure from 1999 to 2009. Environ. Res. Lett. 2013, 8, 024004. [Google Scholar] [CrossRef]
  76. Liu, Z.; He, C.; Zhang, Q.; Huang, Q.; Yang, Y. Extracting the dynamics of urban expansion in China using DMSP-OLS nighttime light data from 1992 to 2008. Landsc. Urban Plan. 2012, 106, 62–72. [Google Scholar] [CrossRef]
  77. Liu, F.; Tang, L.; Liao, K.; Ruan, L.; Liu, P. Spatial distribution and regional difference of carbon emissions efficiency of industrial energy in China. Sci. Rep. 2021, 11, 1–14. [Google Scholar] [CrossRef] [PubMed]
  78. Wang, S.; Fang, C.; Wang, Y.; Huang, Y.; Ma, H. Quantifying the relationship between urban development intensity and carbon dioxide emissions using a panel data analysis. Ecol. Indic. 2015, 49, 121–131. [Google Scholar] [CrossRef]
Figure 1. Positions of the 32 major cities in China, with black dots representing the locations of cities and yellow dot representing the locations of Waliguan (WLG) stations.
Remotesensing 14 00839 g001
Figure 2. True color Landsat image of Beijing. (a,b) are images taken from Google Earth in 2001 and 2010, respectively. The polygons on the (a,b) are the core and extension regions, respectively.
Remotesensing 14 00839 g002
Figure 3. Spatial distribution of vegetation coverage trends from 2001 to 2018.
Remotesensing 14 00839 g003
Figure 4. Spatial distribution of FVC trends in 32 major cities in China from 2001 to 2018, with dotted lines representing the boundaries of core areas and solid lines representing the boundaries of extended areas.
Remotesensing 14 00839 g004
Figure 5. Temporal series changes in vegetation coverage in 32 Chinese cities from 2001 to 2018.
Remotesensing 14 00839 g005
Figure 6. Spatial distribution map of the NTL change trend from 2001 to 2018.
Remotesensing 14 00839 g006
Figure 7. Spatial distribution of NTL trends in 32 major cities in China from 2001 to 2018, with dotted lines representing the boundaries of core areas and solid lines representing the boundaries of extended areas.
Remotesensing 14 00839 g007
Figure 8. Driving factor contributions in 32 major cities in China: (a) pie chart of five driving factor contributions in the core region, (b) pie chart of five driving factor contributions in the expansion region, (c) pie chart of three major driving factor contributions in the core region, and (d) pie chart of three major driving factor contributions in the expansion region.
Remotesensing 14 00839 g008
Figure 9. Spatial distribution of driving factor contributions in 32 major urban cities in China.
Remotesensing 14 00839 g009
Figure 10. Curve of CO2 observation value at Waliguan station from 2001 to 2018. The gray curve represents the monthly mean value of CO2, the red dot represents the annual mean value of CO2, and the black line represents the change trend of annual mean CO2.
Remotesensing 14 00839 g010
Table 1. Average temperature, altitude, precipitation, and radiation of 32 major cities in China.
TypesDEM (m)Precipitation (mm)Temperature (°C)Radiation (W·m−2)
CitiesCECECECE
Harbin143.2132.6563.3551.64.24.7139.7140.1
Changchun214.3211.8668.9656.65.5.9149.5149.5
Urumchi823.7800.3236.9239.66.26.5177.6177.4
Shenyang45.647.4425.9431.87.97.9156.8157.2
Hohhot1053.81057.3591.3591.26.96.9169.3169.6
Beijing46.646.1504.2514.112.612.2161.0160.9
Tianjin5.53.5562.7580.612.912.9162.0163.9
Yinchuan1113.51110.3270.2274.09.99.9186.1185.1
Shijiazhuang76.580.7431.6439.313.913.7152.2152.5
Taiyuan799.3802.3363.3358.510.310.1170.1169.4
Jinan46.277.8767.9800.914.914.7166.9166.3
Xining2261.02297.5485.8484.94.24.4185.0185.5
Lanzhou1541.91569.8632.1640.57.56.7181.2180.8
Zhengzhou104.2108.1598.8593.415.515.5156.4156.3
Xi’an411.8404.6474.9473.414.914.8159.7159.7
Nanjing23.018.31281.91292.115.915.9160.1159.3
Hefei26.027.41366.21384.615.915.9150.1150.2
Shanghai5.64.61214.51347.315.617.5154.4155.0
Chengdu498.8505.71117.21136.715.915.9134.9134.2
Wuhan27.627.81029.91055.317.617.4148.8148.5
Hangzhou15.014.91735.11732.217.817.4154.2154.1
Lhasa3655.53653.2569.4566.88.68.5227.0226.9
Chongqing265.7275.81069.21068.618.418.5129.9129.9
Nanchang23.926.91564.71566.618.618.5155.7155.4
Changsha53.255.51275.21275.117.017.1148.6148.9
Guiyang1111.21196.41180.11173.414.814.4129.4129.7
Fuzhou14.224.61334.31325.920.920.3153.3153.5
Kunming1897.81916.61169.81246.514.914.8188.6187.1
Guizhou14.113.91764.51783.421.921.8154.8153.8
Nanning83.697.91244.91245.120.920.9160.0159.8
Shenzhen57.068.81929.31869.522.422.0170.8169.5
Haikou16.517.92166.72036.323.923.9184.7182.1
Table 2. Statistical table of artificial surface gains and losses in China’s 32 major cities from 2000 to 2020 (Unit: km2).
Type GainLossTypeGainLoss
CitiesAreaRatioAreaRatioCitiesAreaRatioAreaRatio
Harbin354.574.98.81.9Hefei281.745.514.22.3
Changchun136.626.65.41.0Shanghai1211.430.6114.42.9
Urumchi34.714.84.82.0Chengdu438.245.310.31.1
Shenyang86.512.710.41.5Wuhan280.333.27.40.9
Hohhot49.923.15.82.7Hangzhou400.029.923.81.8
Beijing1022.837.039.01.4Lhasa0.61.80.10.4
Tianjin547.932.637.42.2Chongqing82.133.73.21.3
Yinchuan59.636.54.32.6Nanchang87.822.13.30.8
Shijiazhuang80.721.74.61.2Changsha140.938.36.01.6
Taiyuan110.233.42.70.8Guiyang36.418.64.52.3
Jinan157.032.77.51.6Fuzhou53.422.62.51.1
Xining25.622.52.42.1Kunming180.545.70.60.1
Lanzhou39.721.00.90.5Guizhou508.228.623.81.3
Zhengzhou272.350.75.81.1Nanning75.329.23.51.4
Xi’an232.933.79.11.3Shenzhen316.421.728.82.0
Nanjing357.136.910.71.1Haikou9.110.10.20.2
Table 3. Importance of driving factors to FVC changes in 32 cities. Red shading denotes greater importance, and blue shading represents lower importance (Unit: %). An asterisk indicates that the GLM regression coefficient is greater than zero.
DriversCO2UrbanizationPrecipitationTemperatureRadiationOther
CitiesCECECECECECE
Harbin32.535.210.4 *13.8 *10.37.8 *16.2 *14.0 *20.120.510.48.7
Changchun38.2 *49.1 *8.4 *8.915.8 *12.0 *14.9 *12.4 *12.210.010.67.7
Urumchi37.9 *35.0 *11.75.97.1 *16.0 *16.0 *16.6 *20.620.86.75.6
Shenyang41.9 *29.6 *10.0 *14.59.6 *14.9 *13.5 *16.7 *14.815.910.28.5
Hohhot22.228.18.7 *7.5 *30.3 *28.7 *19.3 *23.49.3 *7.5 *10.14.7
Beijing26.4 *29.6 *9.414.227.5 *23.9 *15.513.6 *12.010.39.18.5
Tianjin28.228.515.9 *15.2 *6.1 *10.3 *16.3 *10.5 *22.426.411.08.9
Yinchuan36.4 *35.6 *8.515.137.6 *29.7 *9.4 *10.94.25.4 *3.93.2
  Shijiazhuang  51.667.27.7 *9.66.6 *4.6 *10.3 *6.7 *11.16.512.75.4
Taiyuan21.032.914.7 *12.0 *9.16.7 *19.016.418.720.317.511.7
Jinan33.841.8 *10.913.9 *12.110.2 *18.817.7 *9.16.715.39.7
Xining66.3 *53.8 *8.4 *14.4 *7.4 *15.3 *8.5 *6.94.44.5 *5.05.1
Lanzhou28.931.2 *12.1 *10.4 *23.2 *32.6 *13.69.5 *11.5 *7.510.78.7
Zhengzhou25.033.1 *9.4 *7.812.6 *5.1 *28.042.310.6 *8.2 *14.33.5
Xi’an30.051.1 *13.2 *8.27.3 *7.0 *26.714.1 *13.814.1 *9.05.6
Nanjing31.242.611.4 *14.8 *13.2 *10.910.0 *9.6 *12.6 *11.021.611.2
Hefei27.549.216.5 *10.411.210.311.5 *13.7 *14.99.618.36.8
Shanghai32.544.011.6 *8.9 *12.6 *10. 5 *12.0 *17.121.311.810.07.8
Chengdu55.255.9 *8.3 *6.57.5 *11.3 *11.917.0 *6.73.410.35.9
Wuhan40.740.39.1 *12.18.2 *8.515.9 *17.3 *12.8 *11.8 *13.39.9
Hangzhou28.942.89.0 *6.4 *12.516.3 *24.518.316.89.48.36.8
Lhasa27.927.411.8 *8.1 *8.0 *10.6 *32.735.6 *7.7 *8.311.910.0
Chongqing38.845.9 *11.210.612. 3 *8.8 *18.0 *16.49.09.3 *10.79.0
Nanchang33.7 *36.29.719.3 *14.310.415.511.215.015.411.77.5
Changsha39.350.77.6 *9.2 *17.2 *8.4 *14.817.1 *6.4 *5.814.78.7
Guiyang43.745.6 *8.3 *11.421.2 *14.5 *11.010.0 *4.3 *8.3 *11.410.2
Fuzhou24.0 *48.111.46.613.916.023.38.614.213.413.27.3
Kunming49.652.3 *8.8 *7.415.4 *17.7 *8.17.59.4 *10.28.65.0
Guizhou31.934.310.811.611.811.021.819.39.3 *11.9 *14.511.9
Nanning30.163.3 *14.1 *5.211.210.0 *17.57.311.17.2 *16.07.0
Shenzhen50.1 *39.4 *11.0 *10.8 *6.9 *8.8 *14.9 *17.0 *7.611.89.512.1
Haikou53.851.4 *4.7 *9.7 *9.2 *10.4 *11.57.7 *15.014.45.86.4
Publisher’s Note: MDPI stays neutral with regard to jurisdictional claims in published maps and institutional affiliations.

