
Spatiotemporal Patterns of Cultivated Land Quality Integrated with Multi-Source Remote Sensing: A Case Study of Guangzhou, China

 ,
,
Abstract
: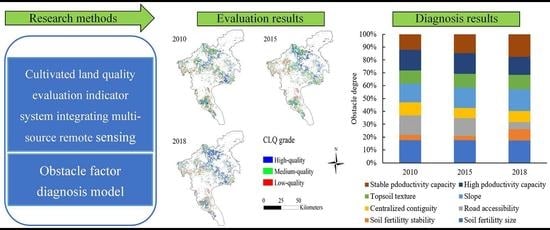
1. Introduction
2. Materials and Methods
2.1. Study Area
2.2. CLQ Evaluation Method
2.2.1. The Definition of CLQ
2.2.2. Indicator Selection
2.2.3. Calculation of the CLQ index
2.2.4. Grading the CLQ index
2.3. Data Sources and Preprocessing
2.3.1. Multi-Source Data
2.3.2. Validation Dataset
2.4. Obstacle Factor Diagnosis Model
3. Results
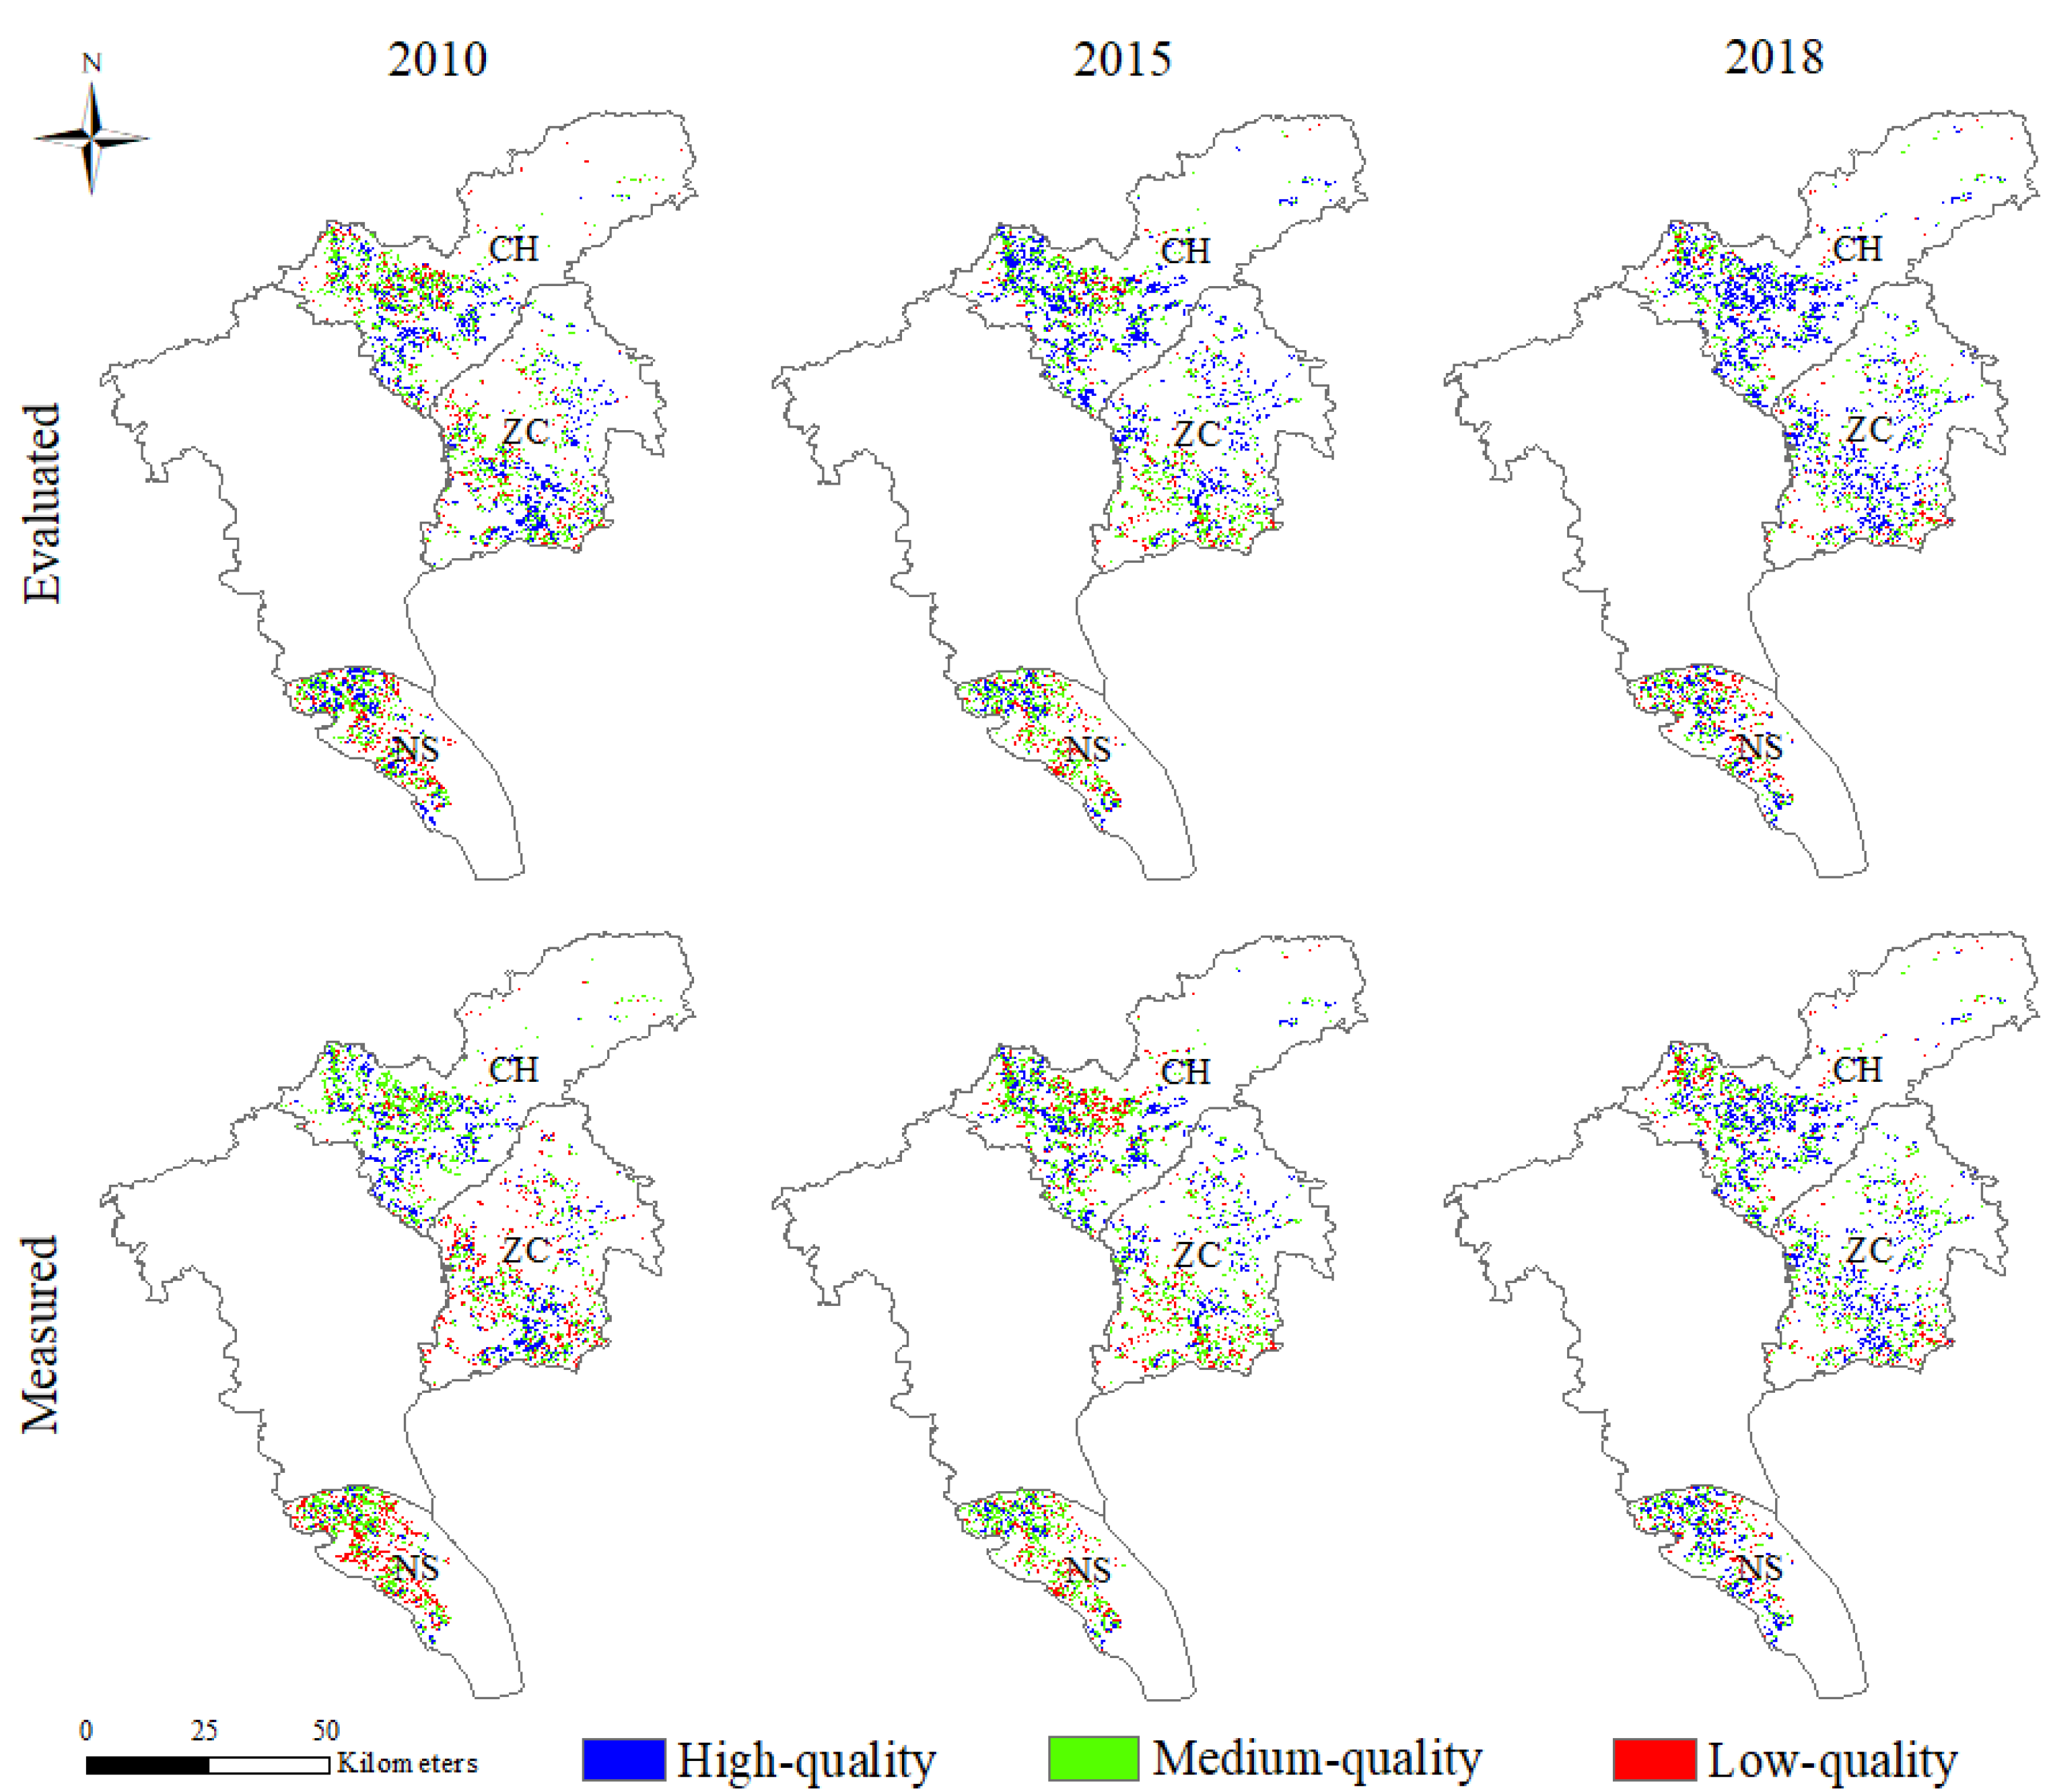
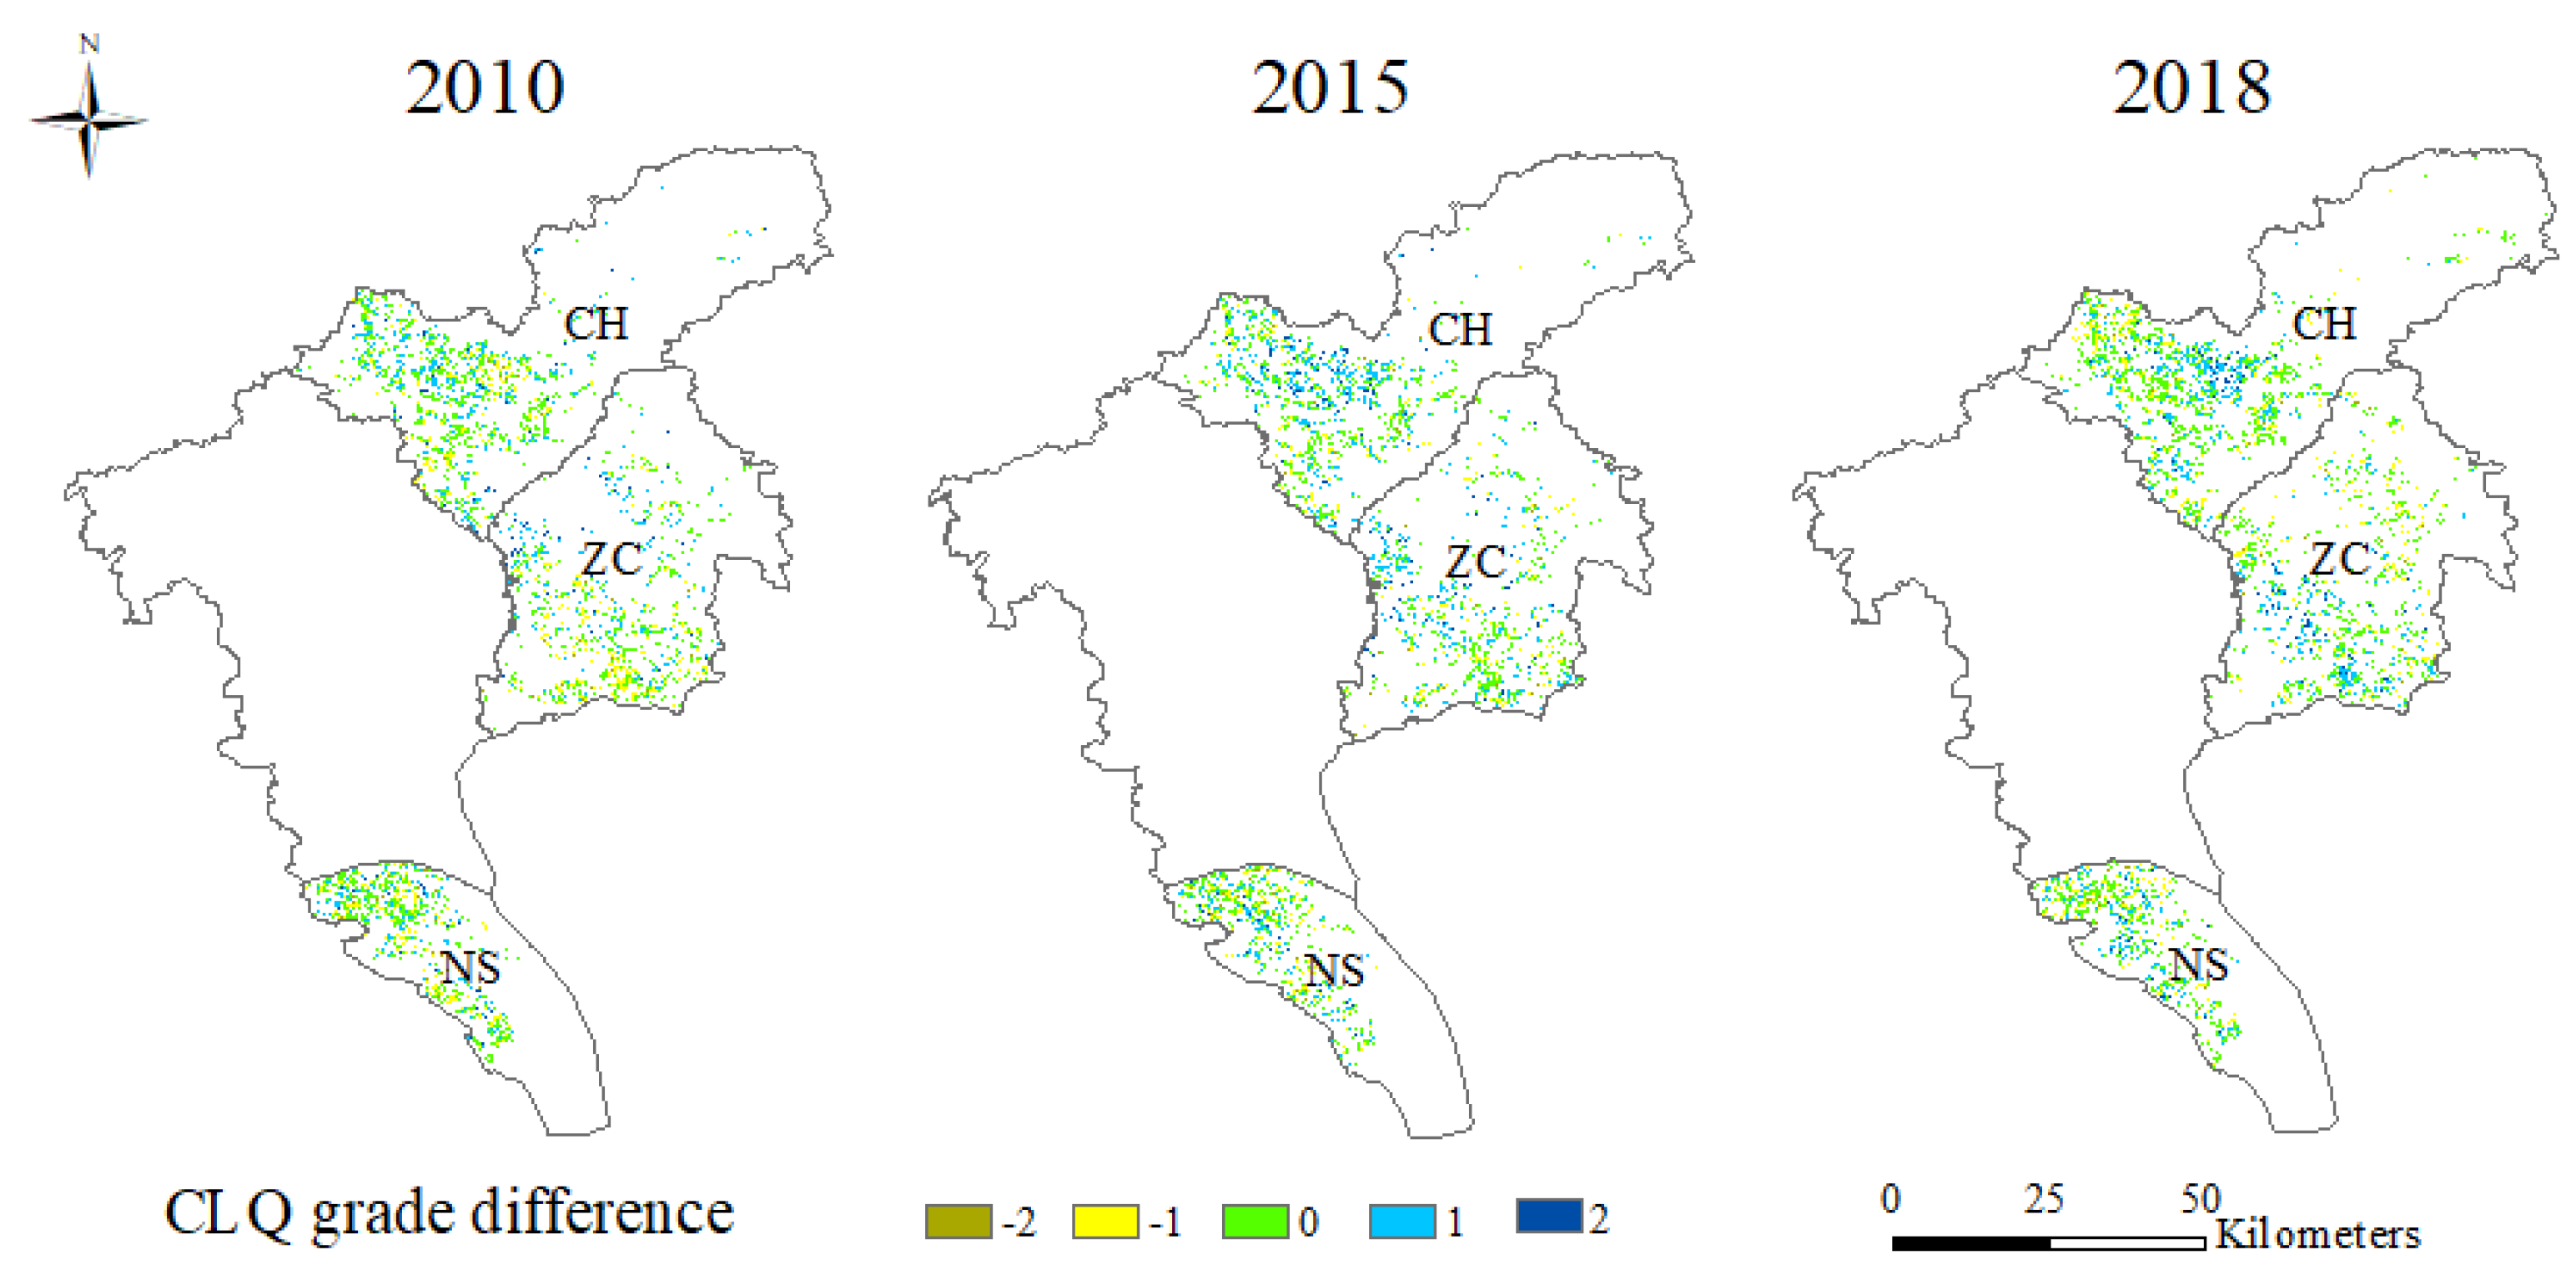
3.1. Accuracy Verification of the CLQ
3.2. Spatiotemporal Changes of the CLQ
3.2.1. Spatiotemporal Changes of CLQ in Guangzhou
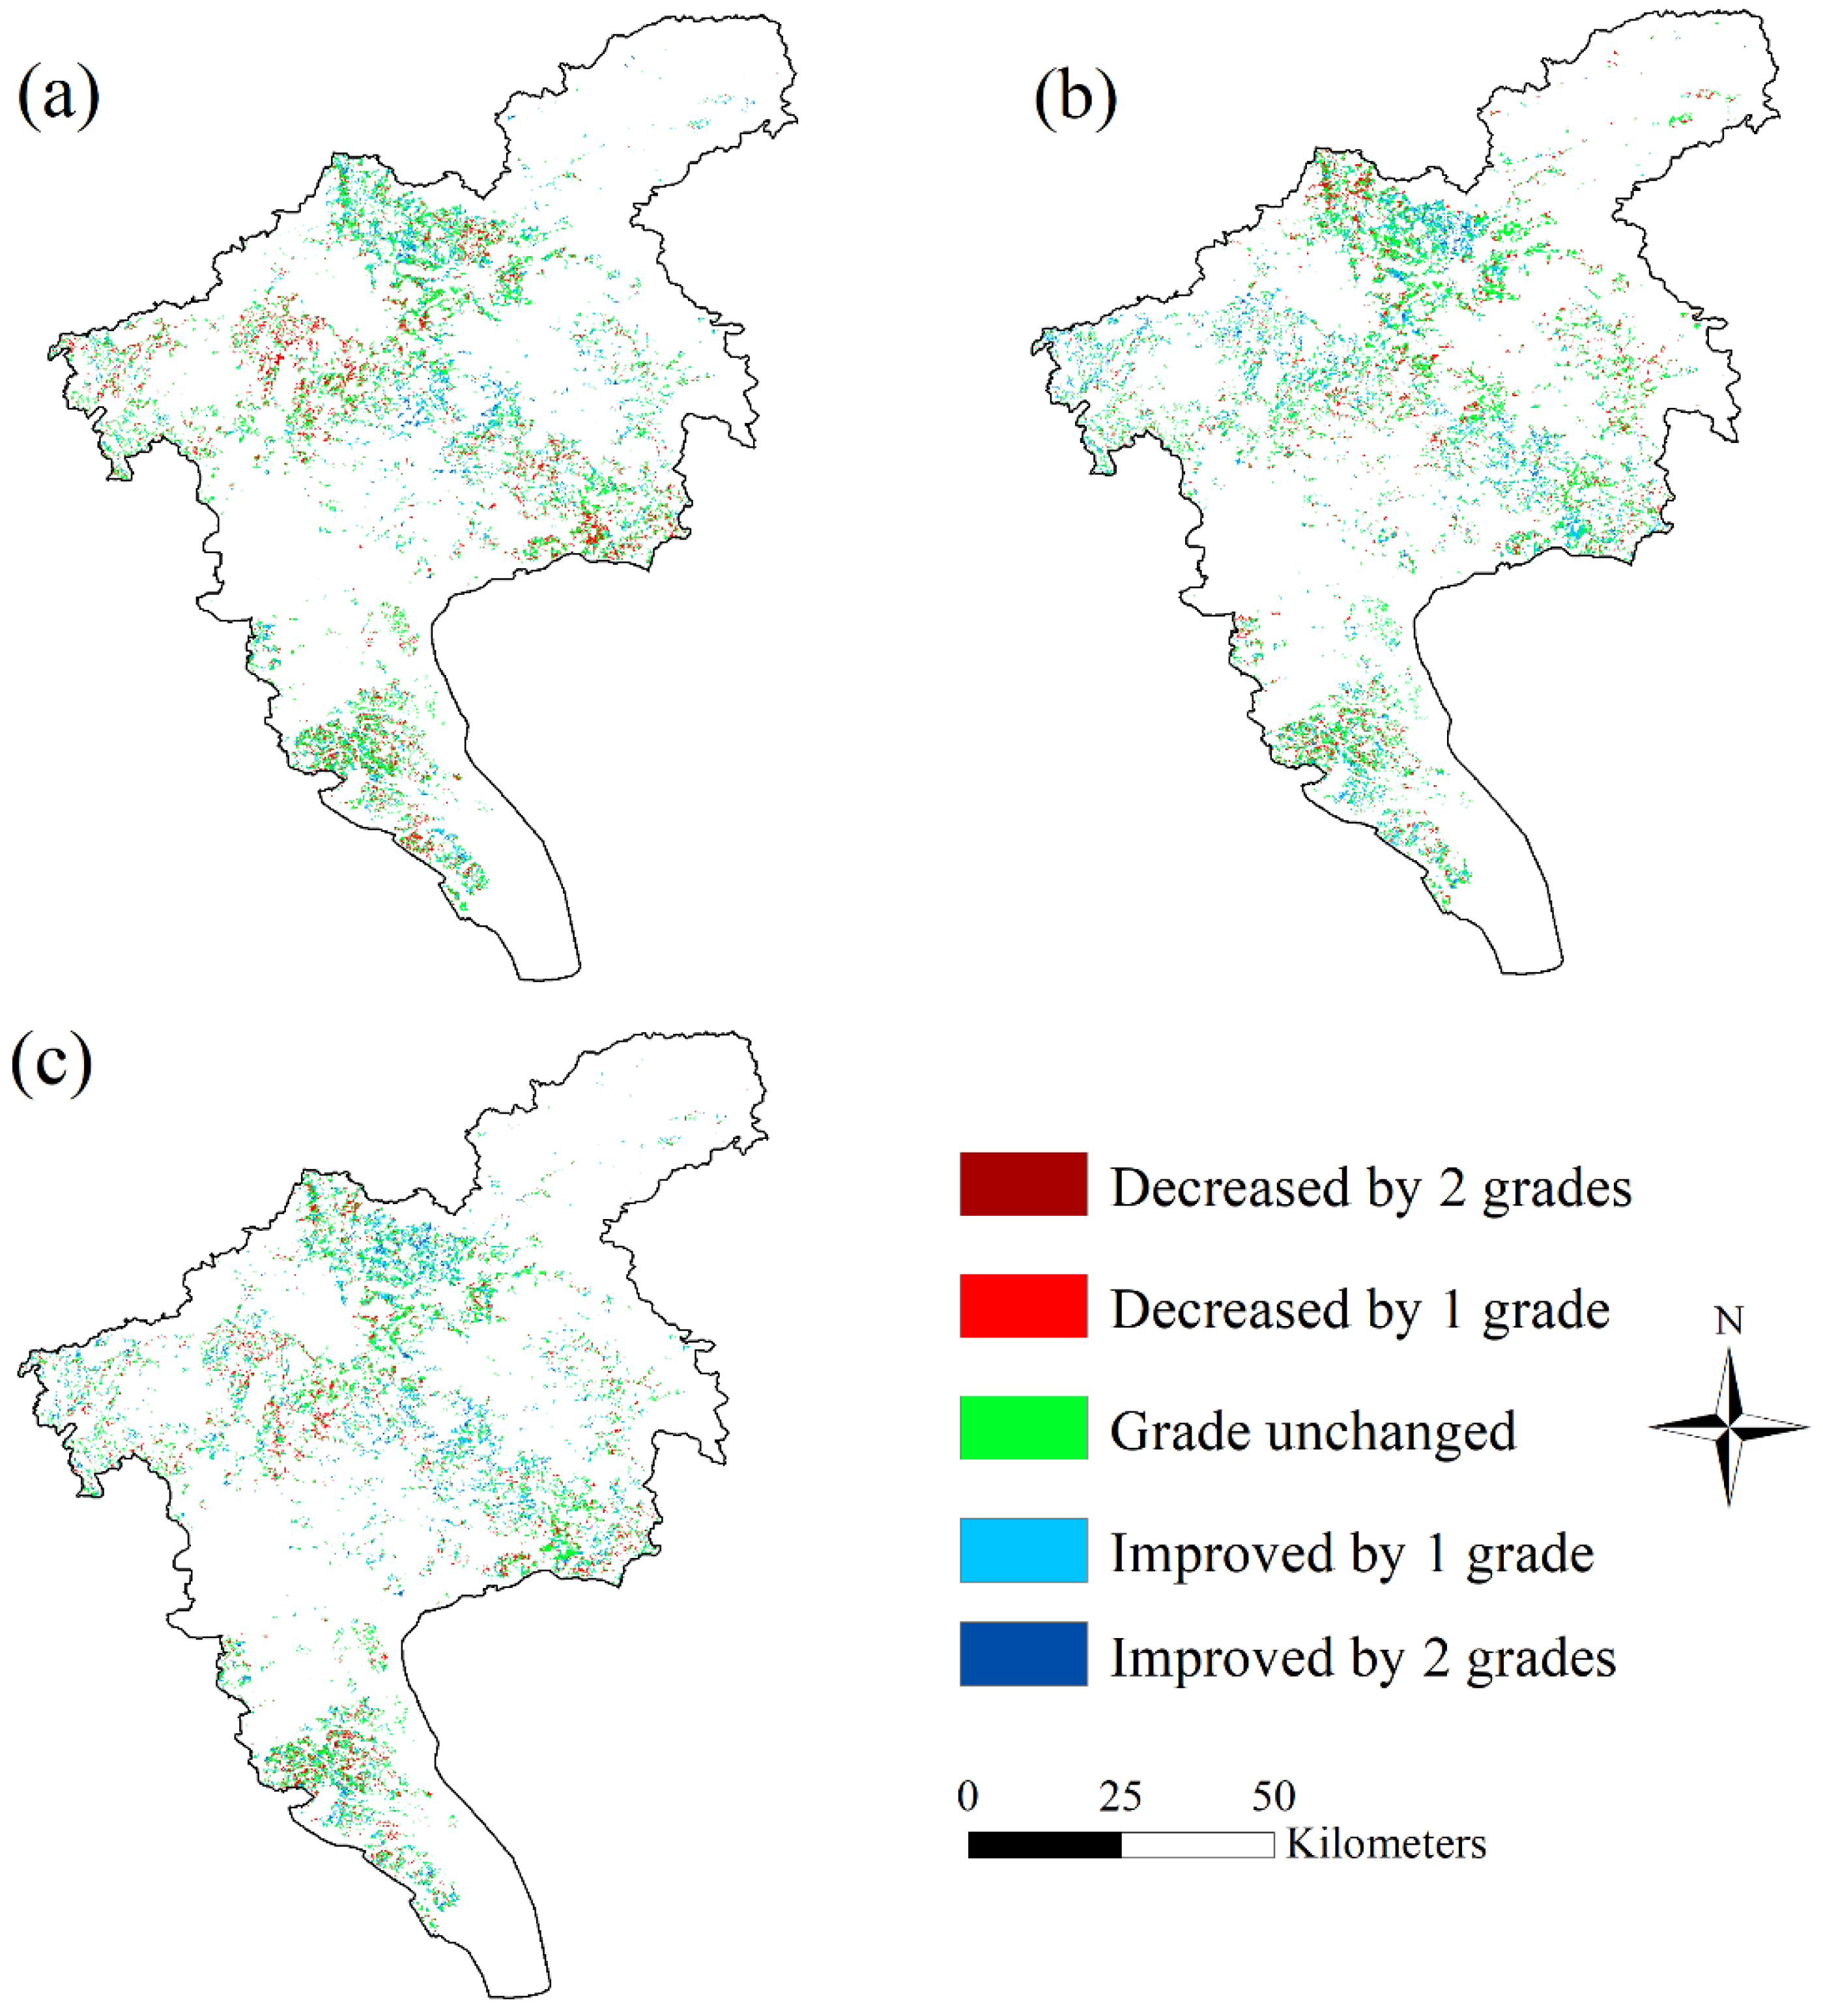
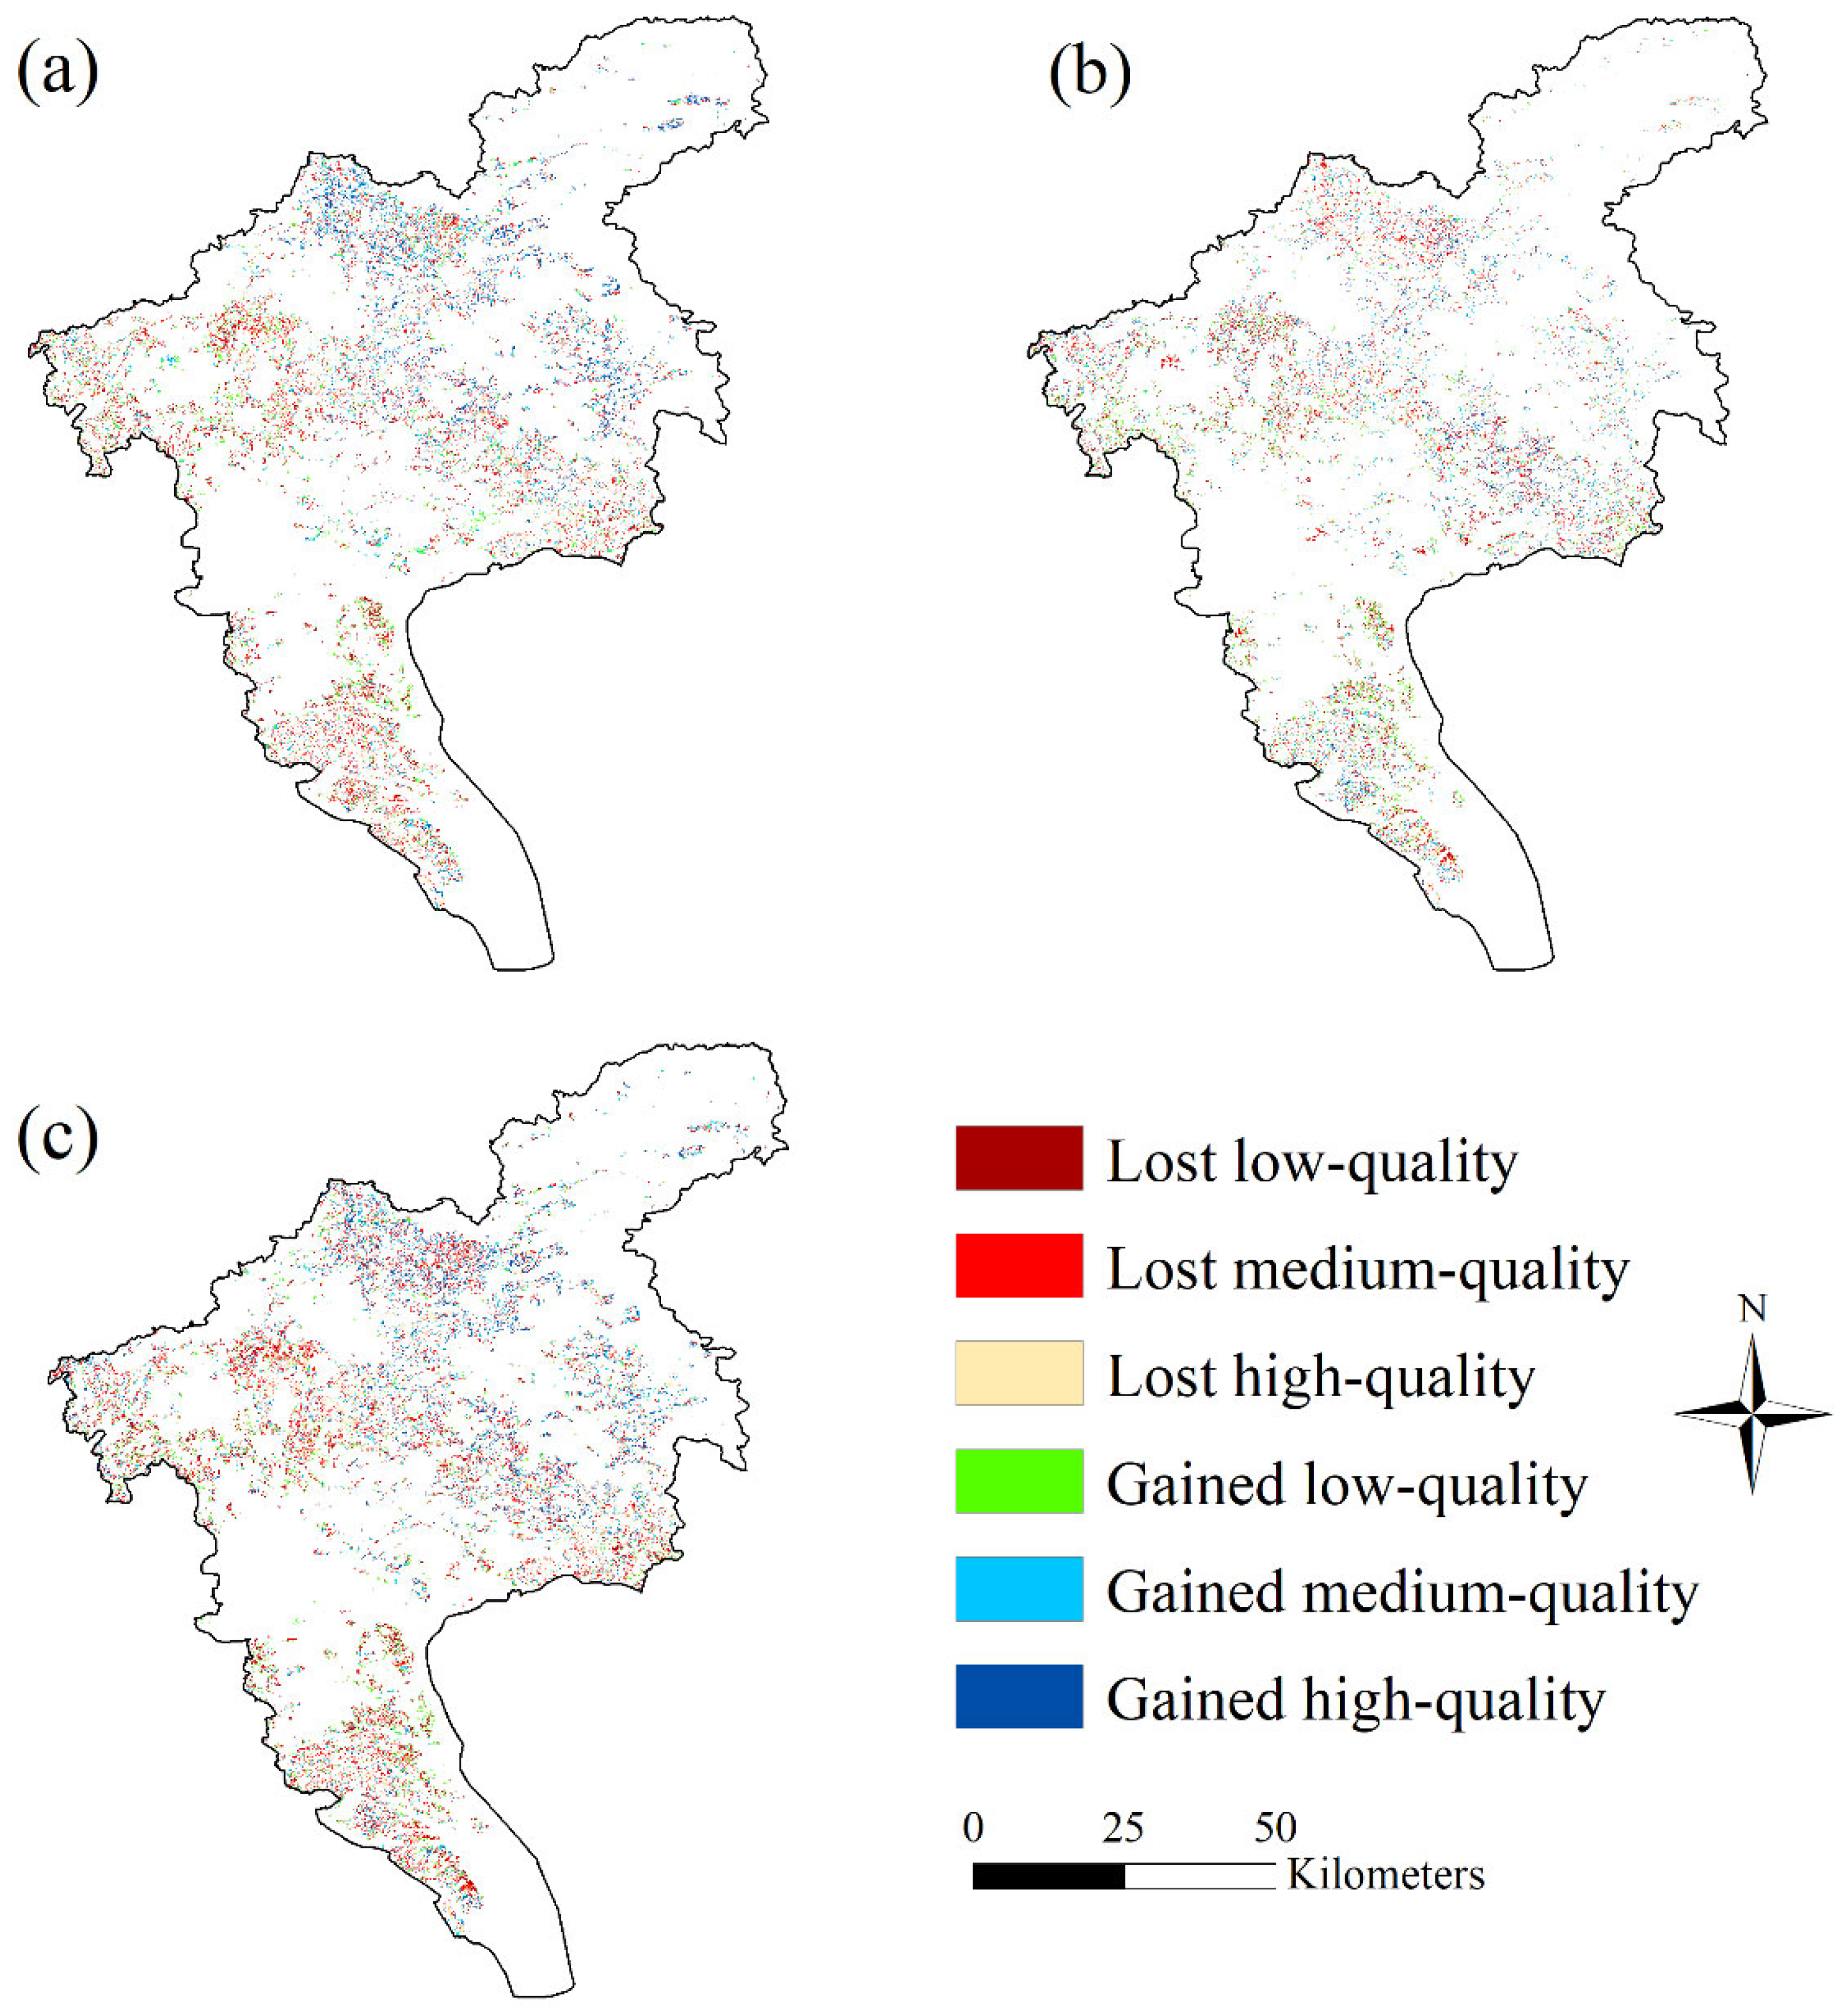
3.2.2. Spatiotemporal Changes of CLQ in Unchanged/Lost/Gained Area
3.3. Obstacle Factors Affecting the Improvement of CLQ
4. Discussion
4.1. CLQ Evaluation Method Integrating Multi-Source Remote Sensing
4.2. The Mechanism behind the Spatiotemporal Changes of CLQ in Guangzhou
4.3. Corresponding Measures to Improve the CLQ in Guangzhou
4.4. Limitations and Future Work
5. Conclusions
Author Contributions
Funding
Institutional Review Board Statement
Informed Consent Statement
Data Availability Statement
Acknowledgments
Conflicts of Interest
References
- Li, Y.; Chang, C.; Wang, Z.; Qi, G.; Dong, C.; Zhao, G. Upscaling remote sensing inversion model of wheat field cultivated land quality in the Huang-Huai-Hai agricultural region, China. Remote Sens. 2021, 13, 5095. [Google Scholar] [CrossRef]
- Antón, J.; Cattaneo, A.; Kimura, S.; Lankoski, J. Agricultural risk management policies under climate uncertainty. Global Environ. Chang. 2010, 23, 1726–1736. [Google Scholar] [CrossRef]
- Li, J.L.; Wu, W.J.; Ye, X.X.; Jiang, H.; Gan, R.J.; Wu, H.L.; He, J.L.; Jiang, Y.L. Innovative trend analysis of main agriculture natural hazards in China during 1989–2014. Nat. Hazards. 2019, 95, 677–720. [Google Scholar] [CrossRef]
- Martínez-Mena, M.; Carrillo-López, E.; Boix-Fayos, C. Long-term effectiveness of sustainable land management practices to control runoff, soil erosion, and nutrient loss and the role of rainfall intensity in Mediterranean rainfed agroecosystems. Catena 2020, 187, 104352. [Google Scholar] [CrossRef]
- Wolka, K.; Birhanu, B.; Vegard, M.; Jan, M. Soil and water conservation management on hill slopes in Southwest Ethiopia. I. Effects of soil bunds on surface runoff, erosion and loss of nutrients. Sci. Total Environ. 2021, 757, 142877. [Google Scholar] [CrossRef]
- Raut, N.; Dörsch, P.; Sitaula, B.K.; Bakken, L.R. Soil acidification by intensified crop production in South Asia results in higher N2O/(N2 + N2O) product ratios of denitrification. Soil Biol. Biochem. 2012, 55, 104–112. [Google Scholar] [CrossRef]
- Zhu, Q.C.; Liu, X.J.; Hao, T.X.; Zeng, M.F.; Shen, J.B.; Zhang, F.S.; De Vreies, W. Modeling soil acidification in typical Chinese cropping systems. Sci. Total Environ. 2018, 613–614, 1339–1348. [Google Scholar] [CrossRef] [Green Version]
- Liu, S.J.; Wang, X.D.; Guo, G.L.; Yan, Z.G. Status and environmental management of soil mercury pollution in China: A review. J. Environ. Manag. 2021, 27, 111442. [Google Scholar] [CrossRef]
- Prăvălie, R.; Patriche, C.; Borrelli, P. Arable lands under the pressure of multiple land degradation processes. A global perspective. Environ. Res. 2021, 194, 110697. [Google Scholar] [CrossRef]
- Zhao, C.; Zhou, Y.; Jiang, J.H.; Xiao, P.N.; Wu, H. Spatial characteristics of cultivated land quality accounting for ecological environmental condition: A case study in hilly area of northern Hubei province, China. Sci. Total Environ. 2021, 774, 145765. [Google Scholar] [CrossRef]
- Chen, Z.F.; Shi, D.M. Spatial structure characteristics of slope farmland quality in Plateau mountain area: A case study of Yunnan Province, China. Sustainability 2020, 12, 7230. [Google Scholar] [CrossRef]
- Wang, L.; Zhou, Y.; Li, Q.; Xu, T.; Wu, Z.X.; Liu, J.Y. Application of three deep machine-learning algorithms in a construction assessment model of farmland quality at the county scale: Case study of Xiangzhou, Hubei Province, China. Agriculture 2021, 11, 72. [Google Scholar] [CrossRef]
- Teng, Y.G.; Wu, J.; Lu, S.J.; Wang, Y.Y.; Jiao, X.D.; Song, L.T. Soil and soil environmental quality monitoring in China: A review. Environ. Int. 2014, 69, 177–199. [Google Scholar] [CrossRef] [PubMed]
- Askari, M.S.; O’Rourke, S.M.; Holden, N.M. Evaluation of soil quality for agricultural production using visible-near-infrared spectroscopy. Geoderma 2015, 243–244, 80–91. [Google Scholar] [CrossRef]
- Obade, V.P. Integrating management information with soil quality dynamics to monitor agricultural productivity. Sci. Total Environ. 2019, 651, 2036–2043. [Google Scholar] [CrossRef]
- Dumanski, J.; Pieri, C. Land quality indicators: Research plan. Agric. Ecosyst. Environ. 2000, 81, 93–102. [Google Scholar] [CrossRef]
- Danso, I.; Webber, H.; Bourgault, M. Crop management adaptations to improve and stabilize crop yields under low-yielding conditions in the Sudan Savanna of West Africa. Eur. J. Agron. 2018, 101, 1–9. [Google Scholar] [CrossRef]
- Murray, F.; Germán, B.; Bernard, T.; Vigllzzo, E.F.; Jobbagy, E.G. Productive performance of alternative land covers along aridity gradients: Ecological, agronomic and economic perspectives. Agric. Syst. 2016, 149, 20–29. [Google Scholar] [CrossRef] [Green Version]
- Song, W.; Wu, K.N.; Zhao, H.F.; Zhao, R.; Li, T. Arrangement of high-standard basic farmland construction based on village-region cultivated land quality uniformity. Chin. Geogr. Sci. 2019, 29, 325–340. [Google Scholar] [CrossRef] [Green Version]
- Smith, A.; Snapp, S.; Dimes, J.; Gwenambira, C.; Chikowo, R. Doubled-up legume rotations improve soil fertility and maintain productivity under variable conditions in maize-based cropping systems in Malawi. Agric. Syst. 2016, 145, 139–149. [Google Scholar] [CrossRef]
- Xu, W.Y.; Jin, J.X.; Jin, X.B.; Xiao, Y.Y.; Ren, J.; Liu, J.; Sun, R.; Zhou, Y.K. Analysis of changes and potential characteristics of cultivated land productivity based on MODIS EVI: A case study of Jiangsu Province, China. Remote Sens. 2019, 11, 2041. [Google Scholar] [CrossRef] [Green Version]
- Zornoza, R.; Acosta, J.A.; Bastida, E.; Domínguez, S.G.; Toledo, D.M.; Faz, A. Identification of sensitive indicators to assess the interrelationship between soil quality, management practices and human health. Soils 2015, 1, 173–185. [Google Scholar] [CrossRef] [Green Version]
- Zhou, Y.; Li, X.H.; Liu, Y.S. Cultivated land protection and rational use in China. Land Use Policy 2021, 106, 105454. [Google Scholar] [CrossRef]
- Ministry of Agriculture and Rural Areas of People’s Republic of China. NY/T1634-2008: Technical Regulations for Investigation and Quality Evaluation of Cultivated Land. 2008. Available online: https://www.antpedia.com/standard/5691996.html (accessed on 5 January 2021).
- Ministry of Land and Resources of People’s Republic of China. GB/T28407-2012: Rules for Quality Grading of Agricultural Land. 2012. Available online: https://max.book118.com/html/2017/0703/119921593.shtm (accessed on 5 January 2021).
- Ministry of Land and Resources of People’s Republic of China. GB/T33469-2016: Cultivated Land Quality Grade. 2016. Available online: http://nynct.jiangsu.gov.cn/art/2020/5/22/art_13477_9155231.html (accessed on 5 January 2021).
- Lin, L.; Ye, Z.R.; Gan, M.Y. Quality perspective on the dynamic balance of cultivated land in Wenzhou, China. Sustainability 2017, 9, 95. [Google Scholar] [CrossRef] [Green Version]
- Chen, Y.; Zhu, M.K.; Lu, J.L.; Zhou, Q.; Ma, W.B. Evaluation of ecological city and analysis of obstacle factors under the background of high-quality development: Taking cities in the Yellow River Basin as examples. Ecol. Indic. 2020, 118, 106771. [Google Scholar] [CrossRef]
- Mamehpour, N.; Rezapour, S.; Ghaemian, N. Quantitative assessment of soil quality indices for urban croplands in a calcareous semi-arid ecosystem. Geoderma 2021, 382, 114781. [Google Scholar] [CrossRef]
- Peng, L.N.; Hu, Y.; Li, J.Y.; Du, Q.Y. An improved evaluation scheme for performing quality assessments of unconsolidated cultivated land. Sustainability 2017, 9, 1312. [Google Scholar] [CrossRef] [Green Version]
- Shi, Y.Y.; Duan, W.K.; Fleskens, L.; Li, M.; Hao, J.M. Study on evaluation of regional cultivated land quality based on resource-asset-capital attributes and its spatial mechanism. Appl. Geogr. 2020, 125, 102284. [Google Scholar] [CrossRef]
- Choudhury, B.U.; Mandal, S. Indexing soil properties through constructing minimum datasets for soil quality assessment of surface and profile soils of intermontane valley (Barak, North East India). Ecol. Indic. 2021, 123, 107369. [Google Scholar] [CrossRef]
- Tan, Y.Z.; Chen, H.; Lian, K.; Yu, Z.N. Comprehensive evaluation of cultivated land quality at county scale: A case study of Shengzhou, Zhejiang Province, China. Int. J. Environ. Res. Public Health 2020, 17, 1169. [Google Scholar] [CrossRef] [Green Version]
- Ma, J.N.; Zhang, C.; Yun, W.J.; Lv, Y.H.; Chen, W.L.; Zhu, D.H. The temporal analysis of regional cultivated land productivity with GPP based on 2000-2018 MODIS data. Sustainability 2020, 12, 411. [Google Scholar] [CrossRef] [Green Version]
- Liu, Y.S.; Peng, Y.P.; Xia, Z.Q. Towards realistic assessment of cultivated land quality in an ecologically fragile environment: A satellite imagery-based approach. Appl. Geogr. 2010, 30, 271–281. [Google Scholar] [CrossRef]
- Li, Z.; Lun, F.; Liu, M.; Xiao, X.; Wang, C.Y.; Xu, Y.Q.; Qi, W.; Sun, D.F. Rapid diagnosis of agricultural soil health: A novel soil health index based on natural soil productivity and human management. J. Environ. Manag. 2021, 277, 111402. [Google Scholar] [CrossRef] [PubMed]
- Wang, Z.; Wang, L.M.; Xu, R.N.; Huang, H.T.; Wu, F. GIS and RS based assessment of cultivated land quality of Shandong Province. Procedia Environ. Sci. 2012, 12, 823–830. [Google Scholar] [CrossRef] [Green Version]
- Omer, M.; Idowu, O.J.; Brungard, C.W.; Ulery, A.L.; Adedokun, B.; McMillan, N. Visible near-infrared reflectance and laser-induced breakdown spectroscopy for estimating soil quality in arid and semiarid agroecosystems. Soil Syst. 2020, 4, 42. [Google Scholar] [CrossRef]
- Malerba, D. Poverty-energy-emissions pathways: Recent trends and future sustainable development goals. Energy Sustain. Dev. 2019, 49, 109–124. [Google Scholar] [CrossRef]
- Qian, F.K.; Chi, Y.R.; Lal, R. Spatiotemporal characteristics analysis of multifunctional cultivated land: A case-study in Shenyang, Northeast China. Land Degrad Dev. 2020, 31, 1812–1822. [Google Scholar] [CrossRef]
- National Bureau of Statistics of China. Available online: http://www.stats.gov.cn/ (accessed on 12 November 2020).
- Chong, Z.H.; Pan, S. Understanding the structure and determinants of city network through intrafirm service relationships: The case of Guangdong-Hong Kong-Macao Greater Bay Area. Cities 2020, 103, 102738. [Google Scholar] [CrossRef]
- Gong, J.Z.; Jiang, C.; Chen, W.L.; Chen, X.Y.; Liu, Y.S. Spatiotemporal dynamics in the cultivated and built-up land of Guangzhou: Insights from zoning. Habitat. Intern. 2018, 82, 104–112. [Google Scholar] [CrossRef]
- Arshad, M.A.; Martin, S. Identifying critical limits for soil quality indexes in agroecosystems. Agric. Ecosyst. Environ. 2002, 88, 153–160. [Google Scholar] [CrossRef]
- Drobnik, T.; Greiner, L.; Keller, A.; Grêt-Regamey, A. Soil quality indexes-from soil functions to ecosystem services. Ecol. Indic. 2018, 94, 151–169. [Google Scholar] [CrossRef]
- Asante, B.O.; Omphile, T.; Kwabena, N.A.; VillanO, R.A. Evaluating productivity gaps in maize production across different agroecological zones in Ghana. Agric. Syst. 2019, 176, 102650. [Google Scholar] [CrossRef]
- Turner, B.L.; Meyer, W.B. Land use and land cover in global environmental change: Considerations for study. Int. Soi. Sci. J. 1991, 130, 669–680. [Google Scholar] [CrossRef]
- Wang, J.H.; Tao, P.F.; Yuan, Y.; Li, Z.Z.; Yang, J.J. PSR-based evaluation of the cultivated land quality in HaiLun city of Heilongjiang Province. Geology. Res. 2020, 29, 525–532. [Google Scholar] [CrossRef]
- Zhu, M.B.; Liu, S.S.; Xia, Z.Q.; Wang, G.X.; Hu, Y.M.; Liu, Z.H. Crop growth stage GPP-driven spectral model for evaluation of cultivated land quality using GA-BPNN. Agriculture 2020, 10, 318. [Google Scholar] [CrossRef]
- Scholten, T.; Goebes, P.; Kuhn, P. On the combined effect of soil fertility and topography on tree growth in subtropical forest ecosystems-a study from SE China. J. Plant Ecol. 2017, 10, 111–127. [Google Scholar] [CrossRef]
- Yao, M.L.; Shao, D.G.; Lv, C.H.; An, R.H.; Gu, W.Q.; Zhou, C. Evaluation of arable land suitability based on the suitability function–A case study of the Qinghai-Tibet Plateau. Sci. Total Environ. 2021, 787, 147414. [Google Scholar] [CrossRef]
- Fathizad, H.; Ardakania, M.A.H.; Heung, B.; Sodaiezadeh, H.; Rahmani, A.; Fathabadi, A.; Scholten, T.; Taghizadeh-Mehrjardi, R. Spatio-temporal dynamic of soil quality in the central Iranian desert modeled with machine learning and digital soil assessment techniques. Ecol. Indic. 2020, 118, 106736. [Google Scholar] [CrossRef]
- Lai, Z.Q.; Chang, D.; Li, S.; Li, D. Optimizing land use systems of an agricultural watershed in China to meet ecological and economic requirements for future sustainability. Glob Ecol. Conserv. 2022, 33, e01975. [Google Scholar] [CrossRef]
- He, C.Y.; Liu, Z.F.; Xu, M.; Ma, Q.; Dou, Y.Y. Urban expansion brought stress to food security in China: Evidence from decreased cropland net primary productivity. Sci. Total Environ. 2017, 576, 660–670. [Google Scholar] [CrossRef]
- Imhoff, M.L.; Bounoua, L.; DeFries Ruth Lawrence, W.T.; Stutzer, D.; Tucker, C.J.; Ricketts, T. The consequences of urban land transformation on net primary productivity in the United States. Remote Sens Environ. 2004, 89, 434–443. [Google Scholar] [CrossRef]
- Kim, M.; Jang, Y.C.; Lee, S. Application of Delphi-AHP methods to select the priorities of WEEE for recycling in a waste management decision-making tool. J. Environ. Manag. 2013, 128, 941–948. [Google Scholar] [CrossRef] [PubMed]
- Wang, X.Q.; Shi, W.J.; Sun, X.F.; Wang, M. Comprehensive benefits evaluation and its spatial simulation for well-facilitated farmland projects in the Huang-Huai-Hai Region of China. Land Degrad Dev. 2020, 31, 1837–1850. [Google Scholar] [CrossRef]
- Jenks, G.F. The data model concept in statistical mapping. Int. Yearb. Cartogr. 1967, 7, 186–190. [Google Scholar]
- Liu, J.Y.; Liu, M.L.; Tian, H.Q.; Zhuang, D.F.; Zhang, Z.X.; Zhang, W.; Tang, X.M.; Deng, X.Z. Spatial and temporal patterns of China’s cropland during 1990-2000: An analysis based on Landsat TM data. Remote Sens Environ. 2005, 98, 442–456. [Google Scholar] [CrossRef]
- Song, W.; Liu, M. Farmland conversion decreases regional and national land quality in China. Land Degrad Dev. 2017, 28, 459–471. [Google Scholar] [CrossRef]
- Jiang, G.H.; Zhang, R.; Ma, W.; Zhou, D.Y.; Wang, X.P.; He, X. Cultivated land productivity potential improvement in land consolidation schemes in Shenyang, China: Assessment and policy implications. Land Use Policy 2017, 68, 80–88. [Google Scholar] [CrossRef]
- Su, Y.; Qian, K.; Lin, L.; Wang, K.; Guan, T.; Gan, M.Y. Identifying the driving forces of non-grain production expansion in rural China and its implications for policies on cultivated land protection. Land Use Policy 2020, 92, 104435. [Google Scholar] [CrossRef]
- Bucała-Hrabia, A. Long-term impact of socio-economic changes on agricultural land use in the Polish Carpathians. Land Use Policy. 2017, 64, 391–404. [Google Scholar] [CrossRef]
- Mitter, H.; Techen, A.; Sinabell, F. Shared Socio-economic Pathways for European agriculture and food systems: The Eur-Agri-SSPs. Global Environ. Chang. 2020, 65, 102159. [Google Scholar] [CrossRef]
- Zhang, R.R.; Ma, W.M.; Liu, J.J. Impact of government subsidy on agricultural production and pollution: A game-theoretic approach. J. Clean Prod. 2021, 285, 124806. [Google Scholar] [CrossRef]
- Ma, D.K.; Yin, L.N.; Ju, W.L.; Li, X.K.; Liu, X.X.; Deng, X.P.; Wang, S.W. Meta-analysis of green manure effects on soil properties and crop yield in northern China. Field Crop Res. 2021, 266, 108146. [Google Scholar] [CrossRef]
- Hosseinzadeh, M.H.; Ghalavand, A.; Boojar, M.M.A.; Modarres-Sanavy, S.A.M.; Mokhtassi-Bidgoli, A. Application of manure and biofertilizer to improve soil properties and increase grain yield, essential oil and ω3 of purslane (Portulaca oleracea L.) under drought stress. Soil Till. Res. 2021, 205, 104633. [Google Scholar] [CrossRef]
- Shen, D.D.; Li, G. Empirical research on the relation between agricultural technology progress and China’s grain production-An analysis based on 31 provincial panel data from 2009 to 2015. J. Henan Univ. Eng. 2019, 34, 19–23. [Google Scholar] [CrossRef]
- Liao, Q.; Hu, Y.M.; Hu, X.F.; Zhao, J.Y.; Wang, L. Spatial variability of topsoil nutrients in typical lateritic red soil areas of Guangdong province. Bull Soil. Water. Conserv. 2015, 35, 322–328. (In Chinese) [Google Scholar]
- Kavitha, B.; Reddy, P.V.L.; Kim, B.; Lee, S.S.; Pandey, S.K.; Kim, K.H. Benefits and limitations of biochar amendment in agricultural soils: A review. J. Environ. Manag. 2018, 227, 146–154. [Google Scholar] [CrossRef]
- Wang, H.D.; Wu, L.F.; Cheng, M.H.; Zhang, F.C.; Zou, Y.F.; Chau, H.W.; Gao, Z.J.; Wang, X.K. Coupling effects of water and fertilizer on yield, water and fertilizer use efficiency of drip-fertigated cotton in northern Xinjiang, China. Field Crop Res. 2018, 219, 169–179. [Google Scholar] [CrossRef]
- Femeena, P.V.; Sudheer, K.P.; Cibin, R.; Chaubey, I. Spatial optimization of cropping pattern for sustainable food and biofuel production with minimal downstream pollution. J. Environ. Manag. 2018, 212, 198–209. [Google Scholar] [CrossRef]
- Paudel, G.P.; Kc, D.B.; Rahut, D.B.; Justice, S.E.; McDonald, A.J. Scale-appropriate mechanization impacts on productivity among smallholders: Evidence from rice systems in the mid-hills of Nepal. Land Use Policy 2019, 85, 104–113. [Google Scholar] [CrossRef]
- Fan, J.Q.; Wang, L.; Qin, J.X.; Zhang, F.R.; Xu, Y. Evaluating cultivated land stability during the growing season based on precipitation in the Horqin Sandy Land, China. J. Environ. Manag. 2020, 276, 111269. [Google Scholar] [CrossRef]
- Liu, S.L.; Dong, Y.H.; Li, D.; Liu, Q.; Wang, J.; Zhang, X.L. Effects of different terrace protection measures in a sloping land consolidation project targeting soil erosion at the slope scale. Ecol. Eng. 2013, 53, 46–53. [Google Scholar] [CrossRef]
- Guo, B.B.; Fan, Y.L.; Jin, X.B.; Zhou, Y.K. Monitoring the effects of land consolidation on the ecological environmental quality based on remote sensing: A case study of Chaohu Lake Basin, China. Land Use Policy 2020, 95, 104569. [Google Scholar] [CrossRef]
- Rusinamhodzi, L.; Corbeels, M.; van Wijk, M.T.; Rufino, M.C.; Nyamangara, J.; Giller, K.E. A meta-analysis of long-term effects of conservation agriculture on maize grain yield under rain-fed conditions. Agron. Sustain. Dev. 2011, 31, 657–673. [Google Scholar] [CrossRef] [Green Version]


| Target | Definition | Indicator | Calculation Method | Grade | Weight |
|---|---|---|---|---|---|
| Cultivated land quality | Soil fertility | Soil fertility size | Mean of NDVI for three consecutive years | High: >0.7; Medium: 0.5–0.7; Low: <0.5. | 0.1403 |
| Soil fertility stability | CV of NDVI for three consecutive years | High: <5%; Medium: 5–10%; Low: >10%. | 0.0954 | ||
| Natural conditions | Slope | Steepness of the cultivated land | High: <2°; Medium: 2–5°; Low: >5°. | 0.1094 | |
| Topsoil texture | Ratio of sand, clay, and loam | High: Fine; Medium: Medium; Low: Coarse. | 0.0805 | ||
| Construction level | Road accessibility | The distance from the cultivated land to the nearest road | High: <0.5 km; Medium: 0.5–1.5 km; Low: >1.5 km. | 0.1234 | |
| Centralized contiguity | Contig landscape index | High: >0.85; Medium: 0.75–0.85; Low: <0.75. | 0.1008 | ||
| Cultivated land productivity | High productivity capacity | Mean of the NPP for three consecutive years | High: >600; Medium: 450–600; Low: <450. | 0.1882 | |
| Stable productivity capacity | CV of NPP for three consecutive years | High: <5%; Medium: 5–10%; Low: >10%. | 0.1620 |
| Data | Indicator | Source | Year | Attribute | Resolution |
|---|---|---|---|---|---|
| Landsat/Sentinel-2 images | Soil fertility | USGS Earth Resources Observation and Science Center (http://earthexplorer.usgs.gov/, accessed on 11 August 2020) | 2009–2011; 2014–2019. | Raster | 30 × 30 m |
| Raster | 10 × 10 m | ||||
| DEM | Slope | Geospatial Data Cloud (http://www.gscloud.cn/, accessed on 12 October 2020) | 2011 | Raster | 30 × 30 m |
| Harmonized World Soil Database | Topsoil texture | FAO Soils portal (http://www.fao.org/soils-portal, accessed on 10 October 2020) | 2009 | Raster | 1 × 1 km |
| Road vector data | Road accessibility | OpenStreetMap (https://www.openstreetmap.org, accessed on 18 October 2020) | 2010/2015/2018 | Vector | - |
| China’s National Land Use and Cover Change | Centralized contiguity | Resource and Environment Data Cloud Platform (http://www.resdc.cn, accessed on 27 June 2020) | 2010/2015/2018 | Raster | 30 × 30 m |
| MODIS 17A3 NPP | Cultivated land productivity | NASA LAADS DAAC (http://e4ftl01.cr.usgs.gov/MOLT, accessed on 25 May 2021) | 2009–2011; 2014–2019. | Raster | 500 × 500 m |
| Year | Results | Well-Facilitated Farmland | Non-Well-Facilitated Farmland |
|---|---|---|---|
| 2015 | CLQ index | 2.30 | 1.90 |
| High quality | 45.77% | 25.69% | |
| Medium quality | 40.18% | 41.73% | |
| Low quality | 14.05% | 32.58% | |
| 2018 | CLQ index | 2.33 | 2.01 |
| High quality | 52.09% | 28.38% | |
| Medium quality | 28.51% | 44.09% | |
| Low quality | 19.40% | 27.53% |
| Year | High Quality | Medium Quality | Low Quality | |||
|---|---|---|---|---|---|---|
| Area (ha) | Percent | Area (ha) | Percent | Area (ha) | Percent | |
| 2010 | 29,796 | 28.26% | 45,662 | 43.30% | 29,996 | 28.44% |
| 2015 | 34,782 | 35.14% | 39,786 | 40.20% | 24,408 | 24.66% |
| 2018 | 40,045 | 41.91% | 33,642 | 35.20% | 21,871 | 22.89% |
| Year | Statistical Measure | Improved by 2 Grades | Improved by 1 Grade | Grade Unchanged | Decreased by 1 Grade | Decreased by 2 Grades |
|---|---|---|---|---|---|---|
| 2010–2015 | Area (ha) | 2438 | 15,772 | 35,051 | 15,683 | 1873 |
| Percent (%) | 3.44 | 22.27 | 49.49 | 22.15 | 2.65 | |
| 2015–2018 | Area (ha) | 3265 | 19,131 | 37,156 | 13,069 | 1143 |
| Percent (%) | 4.43 | 25.93 | 50.37 | 17.72 | 1.55 | |
| 2010–2018 | Area (ha) | 3949 | 17,685 | 29,998 | 11,192 | 1531 |
| Percent (%) | 6.14 | 27.48 | 46.61 | 17.39 | 2.38 |
| Year | Lost/Gained area | High Quality | Medium Quality | Low Quality |
|---|---|---|---|---|
| 2010–2015 | Lost cultivated land (ha) | 7836 | 14,835 | 11,965 |
| Percent (%) | 22.63 | 42.83 | 34.54 | |
| Gained cultivated land (ha) | 9160 | 11,067 | 7883 | |
| Percent (%) | 32.59 | 39.37 | 28.04 | |
| 2015–2018 | Lost cultivated land (ha) | 5691 | 10,570 | 8932 |
| Percent (%) | 22.59 | 41.96 | 35.45 | |
| Gained cultivated land (ha) | 7845 | 7882 | 6068 | |
| Percent (%) | 35.99 | 36.16 | 27.85 | |
| 2010–2018 | Lost cultivated land (ha) | 9508 | 17,747 | 13,822 |
| Percent (%) | 23.15 | 43.20 | 33.65 | |
| Gained cultivated land (ha) | 11,450 | 10,990 | 8706 | |
| Percent (%) | 36.76 | 35.29 | 27.95 |
Publisher’s Note: MDPI stays neutral with regard to jurisdictional claims in published maps and institutional affiliations. |
© 2022 by the authors. Licensee MDPI, Basel, Switzerland. This article is an open access article distributed under the terms and conditions of the Creative Commons Attribution (CC BY) license (https://creativecommons.org/licenses/by/4.0/).
Share and Cite
Duan, D.; Sun, X.; Liang, S.; Sun, J.; Fan, L.; Chen, H.; Xia, L.; Zhao, F.; Yang, W.; Yang, P. Spatiotemporal Patterns of Cultivated Land Quality Integrated with Multi-Source Remote Sensing: A Case Study of Guangzhou, China. Remote Sens. 2022, 14, 1250. https://doi.org/10.3390/rs14051250
Duan D, Sun X, Liang S, Sun J, Fan L, Chen H, Xia L, Zhao F, Yang W, Yang P. Spatiotemporal Patterns of Cultivated Land Quality Integrated with Multi-Source Remote Sensing: A Case Study of Guangzhou, China. Remote Sensing. 2022; 14(5):1250. https://doi.org/10.3390/rs14051250
Chicago/Turabian StyleDuan, Dingding, Xiao Sun, Shefang Liang, Jing Sun, Lingling Fan, Hao Chen, Lang Xia, Fen Zhao, Wanqing Yang, and Peng Yang. 2022. "Spatiotemporal Patterns of Cultivated Land Quality Integrated with Multi-Source Remote Sensing: A Case Study of Guangzhou, China" Remote Sensing 14, no. 5: 1250. https://doi.org/10.3390/rs14051250