Article

Estimating Soil Organic Matter (SOM) Using Proximal Remote Sensing: Performance Evaluation of Prediction Models Adjusted at Local Scale in the Brazilian Cerrado

by
Everson Cezar
1,
Tatiane Amancio Alberton
2,
Evandro Freire Lemos
1,
Karym Mayara de Oliveira
2,
Liang Sun
3,*,
Luís Guilherme Teixeira Crusiol
4,
Marlon Rodrigues
5,
Amanda Silveira Reis
2 and
Marcos Rafael Nanni
2
1
Department of Agricultural and Earth Sciences, University of Minas Gerais State, Passos 37902-108, MG, Brazil
2
Remote Sensing and Geoprocessing Laboratory, Agronomy Department, State University of Maringá, Maringá 87020-900, PR, Brazil
3
State Key Laboratory of Efficient Utilization of Arid and Semi-Arid Arable Land in Northern China, Institute of Agricultural Resources and Regional Planning, Chinese Academy of Agricultural Sciences, Beijing 100081, China
4
Embrapa Soja (National Soybean Research Centre–Brazilian Agricultural Research Corporation), Londrina 86001-970, PR, Brazil
5
Federal Institute of Parana, União da Vitória 84600-275, PR, Brazil
*
Author to whom correspondence should be addressed.
Remote Sens. 2023, 15(18), 4397; https://doi.org/10.3390/rs15184397
Submission received: 15 July 2023 / Revised: 5 September 2023 / Accepted: 5 September 2023 / Published: 7 September 2023
(This article belongs to the Special Issue Near Real-Time (NRT) Agriculture Monitoring)

Abstract

:
The quantification of soil organic matter (SOM) has increased over the years, especially in the Brazilian Cerrado region, one of the most important areas for grain production in the country. In this area, SOM content tends to be low, which directly impacts the physical, chemical and biological quality of soils. Thus, the use of spectroradiometry has been widely evaluated to investigate whether it can be used as a faster, more reliable and cheaper solution to meet the SOM estimation. In this context, the objective of the present paper was to evaluate the performance of a local spectral model for SOM prediction generated through the spiking strategy. The research was developed in the municipality of Passos, Minas Gerais State, located in the Brazilian Cerrado. Soil samples (0–0.2 m and 0.2–0.4 m depths) were collected in a zigzag pattern and split in calibration of the local models from a test area (90 soil samples) and recalibration and validation from a target area (46 soil samples). After this stage, the SOM contents were determined in a laboratory, and the spectral responses (350–2500 nm) of each soil sample were collected. From the target area, 10, 25 and 50% of soil spectra were selected for recalibration of the local models generated for the test area. Although median results were observed in the post-recalibration, due to the type of sample selected and the relative similarity among the spectral curves of both areas, improvement was observed for all statistical indices, especially when using 50% (23) of samples for recalibration of the local models, reaching r2 = 0.43, RMSEP = 2.34 gdm−3 and RPIQ = 4.58. These results are important for the SOM estimation in the Brazilian Cerrado considering its importance to the food security and socioeconomic activities. However, considering the lack of similar research in the study area, it is necessary to further investigate the development of spectral models on a local scale and their contribution to improve the identification of SOM spatial variability.

1. Introduction

The measurement of soil organic matter (SOM) content by spectroradiometry has been widely tested due to its relation to the physical, chemical and biological properties of soil [1,2,3]. For years, researchers have studied the relationship between the content of organic matter present in the soil and its spectral response and have concluded that this is one of the attributes that has the greatest influence on soil reflectance [4,5,6].
Soil organic matter is a primary constituent of soil color, showing a close relationship with its reflected energy, influencing the shape and albedo of the spectral curve throughout the entire optical spectrum. In the literature, different spectral intervals are used in algorithms to predict its content in the soil [7]. Analyzes employing the near-infrared region (NIR) are successful for estimating soil organic carbon due to its sensitivity to functional groups C-H, O-H and N-H [8] that dominate organic matter. Although SOM is more frequently estimated by the visible region (Vis) and NIR, the shortwave infrared region (SWIR) has shown satisfactory results.
SOM content and composition are factors that influence soil spectral reflectance, having the ability to mask the absorption features of other constituents, as demonstrated by Heil and Schmidhalter [9]. Evaluating highly weathered soils, Madeira Neto [10] found alterations in the spectral curves after the removal of SOM. Demattê et al. [11] observed an increase in reflectance in the spectral range from 350 to 2500 nm (Vis-NIR-SWIR) after the removal of organic matter from soil samples collected in a Brazilian tropical environment.
The concentration of organic matter is inversely proportional to its spectral response [12,13]. Baumgardner et al. [14] reported that this property influences the spectral response of the soil when its content is above 2% (20 g kg−1). According to Viscarra Rossel et al. [7], high levels of organic matter cause an intense decline in reflectance across the spectrum, masking other soil attributes. On the other hand, when the content is below 20 g kg−1, other soil constituents, such as 1:1 and 2:1 clay minerals and Fe and Al oxides, become more influential in the spectral behavior than organic matter.
Mathews et al. [15] observed that there was a significant decrease in reflectance in the region from 500 to 1150 nm in soil samples with high SOM content (128 g kg−1), but this behavior was not observed with samples containing``` between 20 and 30 g kg−1 of organic matter. When evaluating the best wavelengths to predict MOS content, Krishnan et al. [16] concluded that the visible region provided the best correlations, with maximum correlation coefficients of 0.98 for the 564 and 623 nm bands.
In a more recent study, Chicati et al. [17], using an imaging sensor (600–1100 nm), found a correlation coefficient of 0.65 for the prediction of SOM. On the other hand, Nanni et al. [18] obtained greater responses for the wavelengths of 580, 1401, 1900, 1940, 2180 and 2200 nm, reaching a determination coefficient equal to 0.90 when using a hyperspectral imaging sensor to estimate organic matter.
Reis et al. [19], using a hyperspectral imaging sensor, obtained a SOM determination coefficient equal to 0.75, with greater responses at wavelengths close to 600 and 900 nm. In contrast, Cezar et al. [20], using a non-imaging sensor associated with chemometrics, did not obtain satisfactory results for the prediction of organic matter. It should be noted that these researchers worked with a spectral model that is considered large, but the spatial variability of the samples was very high, which was not captured by the calibrated model.
In turn, Lazaar et al. [6], using a non-imaging sensor to estimate soil organic matter from two spectral reading protocols, obtained an average determination coefficient above 0.85. Such researchers found in the study that the wavelengths that most contributed to the prediction were those present in the near infrared region. The authors concluded that the use of Vis/NIR/SWIR spectroscopy associated with partial least-squares regression (PLSR) is a useful tool to analyze and predict soil organic matter.
Guerrero et al. [21], after employing several model calibration strategies, using the spiking technique, observed a notable improvement in the accuracy of soil organic carbon prediction, using the SWIR region.
Qiao et al. [22], studying the estimation of soil organic matter using a multispectral sensor associated with several spectral data pre-processing techniques, concluded that the applied techniques can significantly improve the quality of prediction models. In this study, an r2 value equal to 0.98 and a high correlation between organic matter content and wavelengths located at 417, 1853, 1000 and 2412 nm were observed.
However, as already highlighted by Liu et al. [8], although there are different results as well as different algorithms used to estimate soil organic matter from spectroscopy, a key issue to be evaluated concerns the efficiency in producing global, state (large) and local (small) models for prediction of this and other chemical and physical attributes of the soil.
Currently, the use of spectral libraries has gained strength in Europe [23], Australia [24] and Brazil [25,26]. However, its use does not guarantee satisfactory prediction, since calibrated models using spectral data may not be robust enough to estimate soil attributes in new areas with samples external to the spectral library—a common condition that may generate inaccurate or biased results [27].
Adding to this, such libraries are created using thousands of soil samples, which might be expansive since, in addition to obtaining the spectral curves, laboratory analytical results (wet chemistry) are necessary for calibrating the models for the spectral prediction of soil attributes.
In this context of uncertainties, the need to find more economical and operationally alternatives has become necessary. Developing prediction models on a local and regional scale seems to be a plausible alternative. However, reducing the number of samples used in the calibration of prediction models requires attention, as it can lead to a reduction in accuracy. According to Shi et al. [28], to adequately describe the spatial variability of soil properties, a sufficient number of samples must be collected for spectroscopic modeling.
Considering that the ideal number of samples is unknown, as it can vary from region to region due to soil characteristics, use, geology, terrain geomorphology and SOM content, among others, a way to overcome this limitation would be through the selection and introduction of some spectral samples obtained from new areas, within local, regional or global models (Spiking). According to Wetterlind et al. [29] and Guerrero et al. [30], this process tends to improve the prediction of soil attributes.
In the light of the current limitations, the objective of this research was to evaluate the performance of a local model for predicting organic matter, recalibrated with soil samples selected from a target area located in the Brazilian Cerrado. It is expected that the use of the spiking technique could help expand the prediction potential of the recalibrated local models, thus allowing the use of smaller models, which would lead to cost reduction and faster determination of the SOM.

2. Materials and Methods
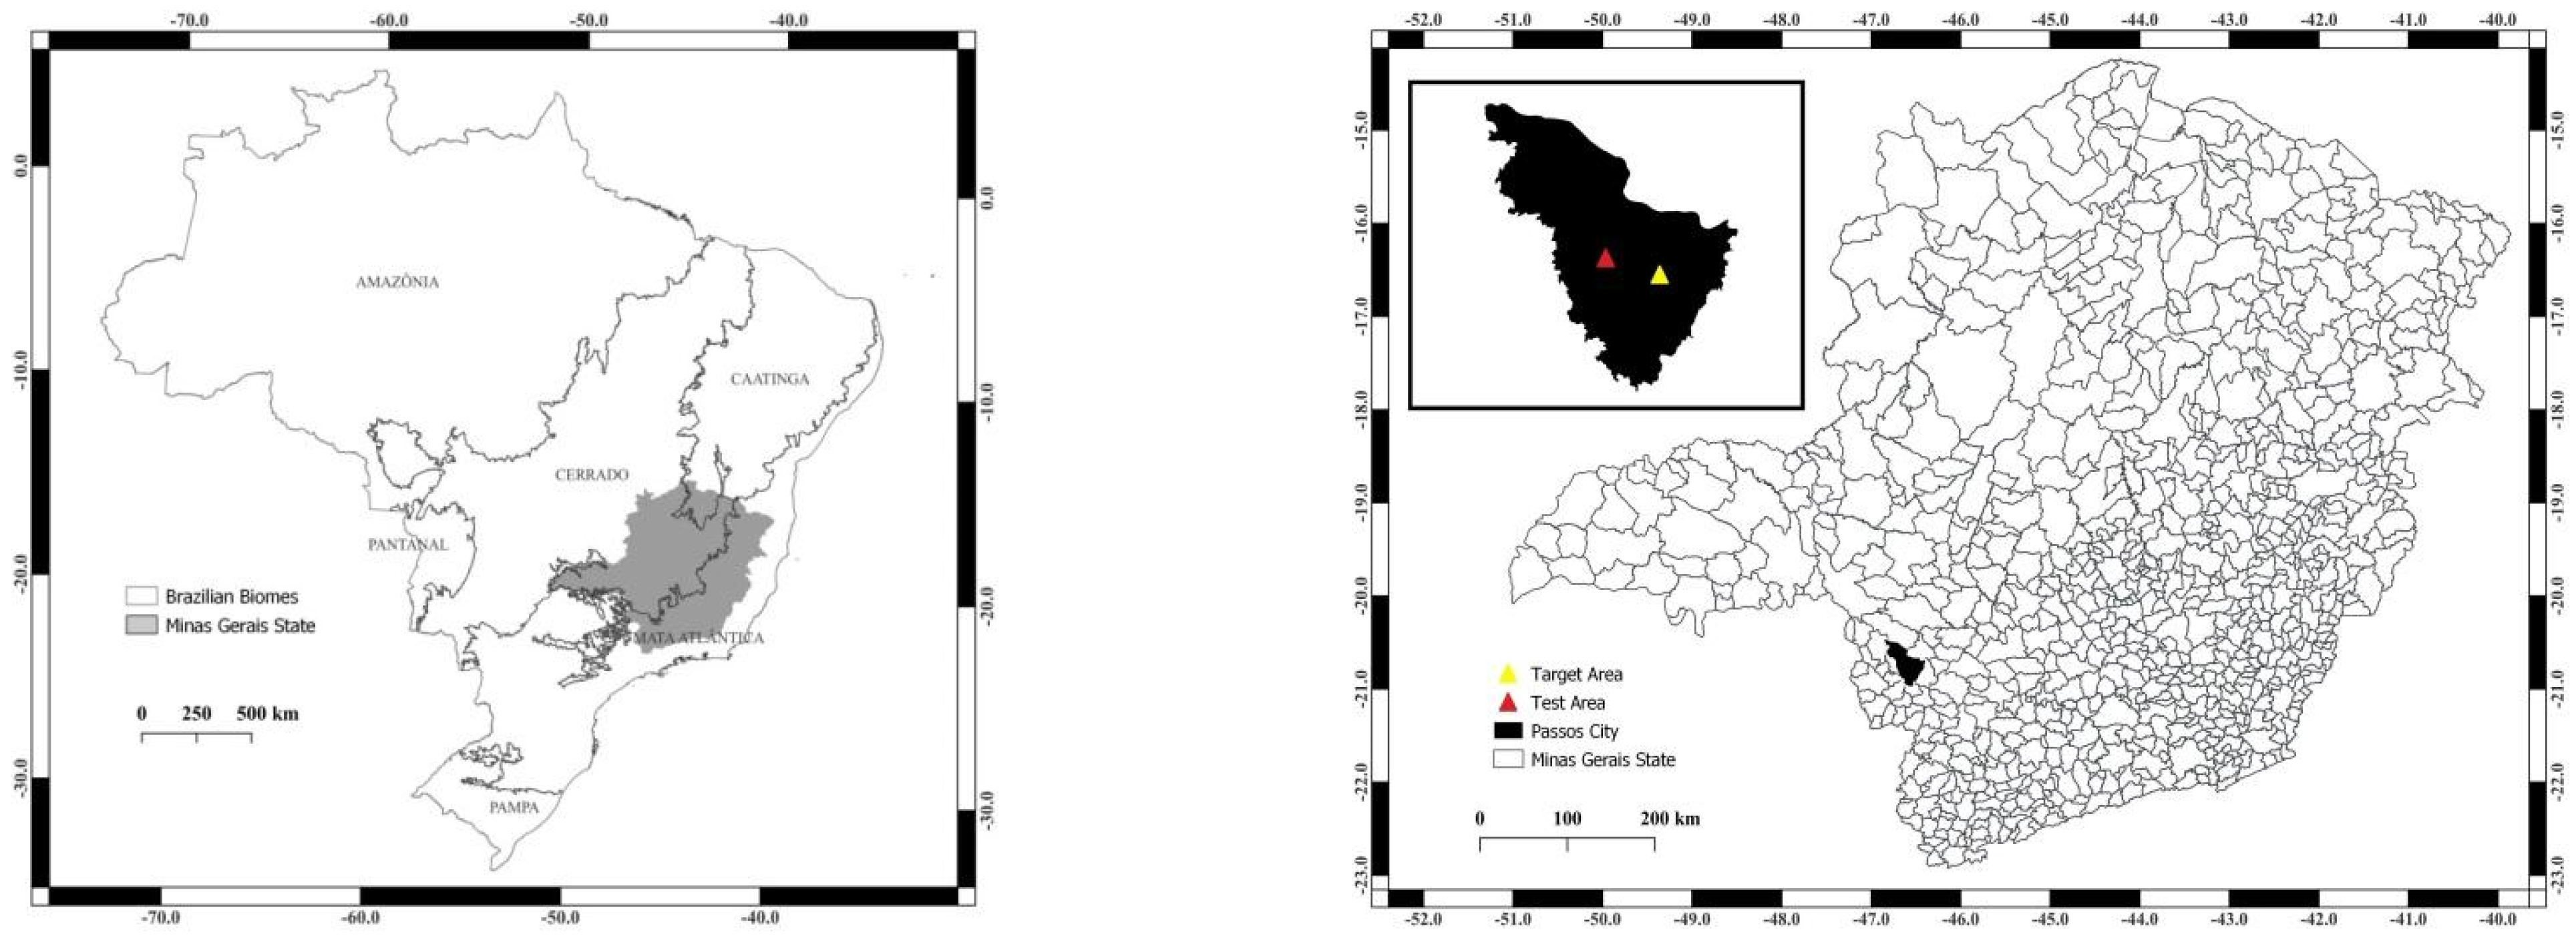
2.1. Study Area

The two study areas (Figure 1) are located in the municipality of Passos, state of Minas Gerais, Brazil, and are currently used for agriculture, pasture and forest. The test area has 32 ha and is located at coordinates 20°46′34.10″S latitude and 46°31′46.79″W longitude, while the target area has 23 ha and is located at coordinates 20°46′29.41″S latitude and 46°31′50.82″W longitude, both belonging to datum WGS 84. The climate of the both areas is classified as Cwa (humid temperate climate with dry winter and hot summer) according to the Koppen climate classification [31]. The average annual temperature is 21.5 °C, and the rainfall is 1288 mm [32].
Regarding current use, the test area has been sporadically used for agriculture and pasture, spending most of the year fallow; on the other hand, the target area has been used for agriculture. The relief of both properties presents a slope that varies from 0 to 8%. The geology is formed by a predominance of silt-clay metasediments, represented by shales [33]. The soil of both areas is classified as Ferralsol with medium texture [34]. The test area has a value of 320 g kg−1 clay, 90 g kg−1 silt and 590 g kg−1 sand at the depths of 0–0.20 m and 0.20–0.40 m. The target area has a value of 310 g kg−1 clay, 210 g kg−1 silt and 480 g kg−1 sand, for 0–0.20 m, and 350 g kg−1 clay, 200 g kg−1 silt and 450 g kg−1 sand, for 0.20–0.40 m depths.
Both areas are within the Cerrado biome, where arable fields tend to have low levels of organic matter. This region demands thousands of soil analyses annually, as it has low natural fertility, which forces farmers to invest in physical and chemical soil analyses for knowledge and maintenance of the productive potential.

2.2. Soil Samples

Soil samples were collected at 0–0.2 m and 0.2–0.4 m depths, with free walking in a zigzag pattern. A total of 90 soil samples were collected from 45 points demarcated in the test area and 46 soil samples from 23 points demarcated in the target area. After collection, the samples were sent to the foliar and soil analysis laboratory at the State University of Minas Gerais for the determination of soil organic carbon.
Initially, all samples were dried in an oven at 45 °C, crushed and subjected to a 2 mm mesh sieve (TFSA). Organic carbon was determined following the methodology recommended by the Agronomic Institute of Campinas (IAC) [35]. The organic matter was obtained by multiplying the total organic carbon by 1.724, since it has been found that in the average humus composition, carbon participates with 58% [36].

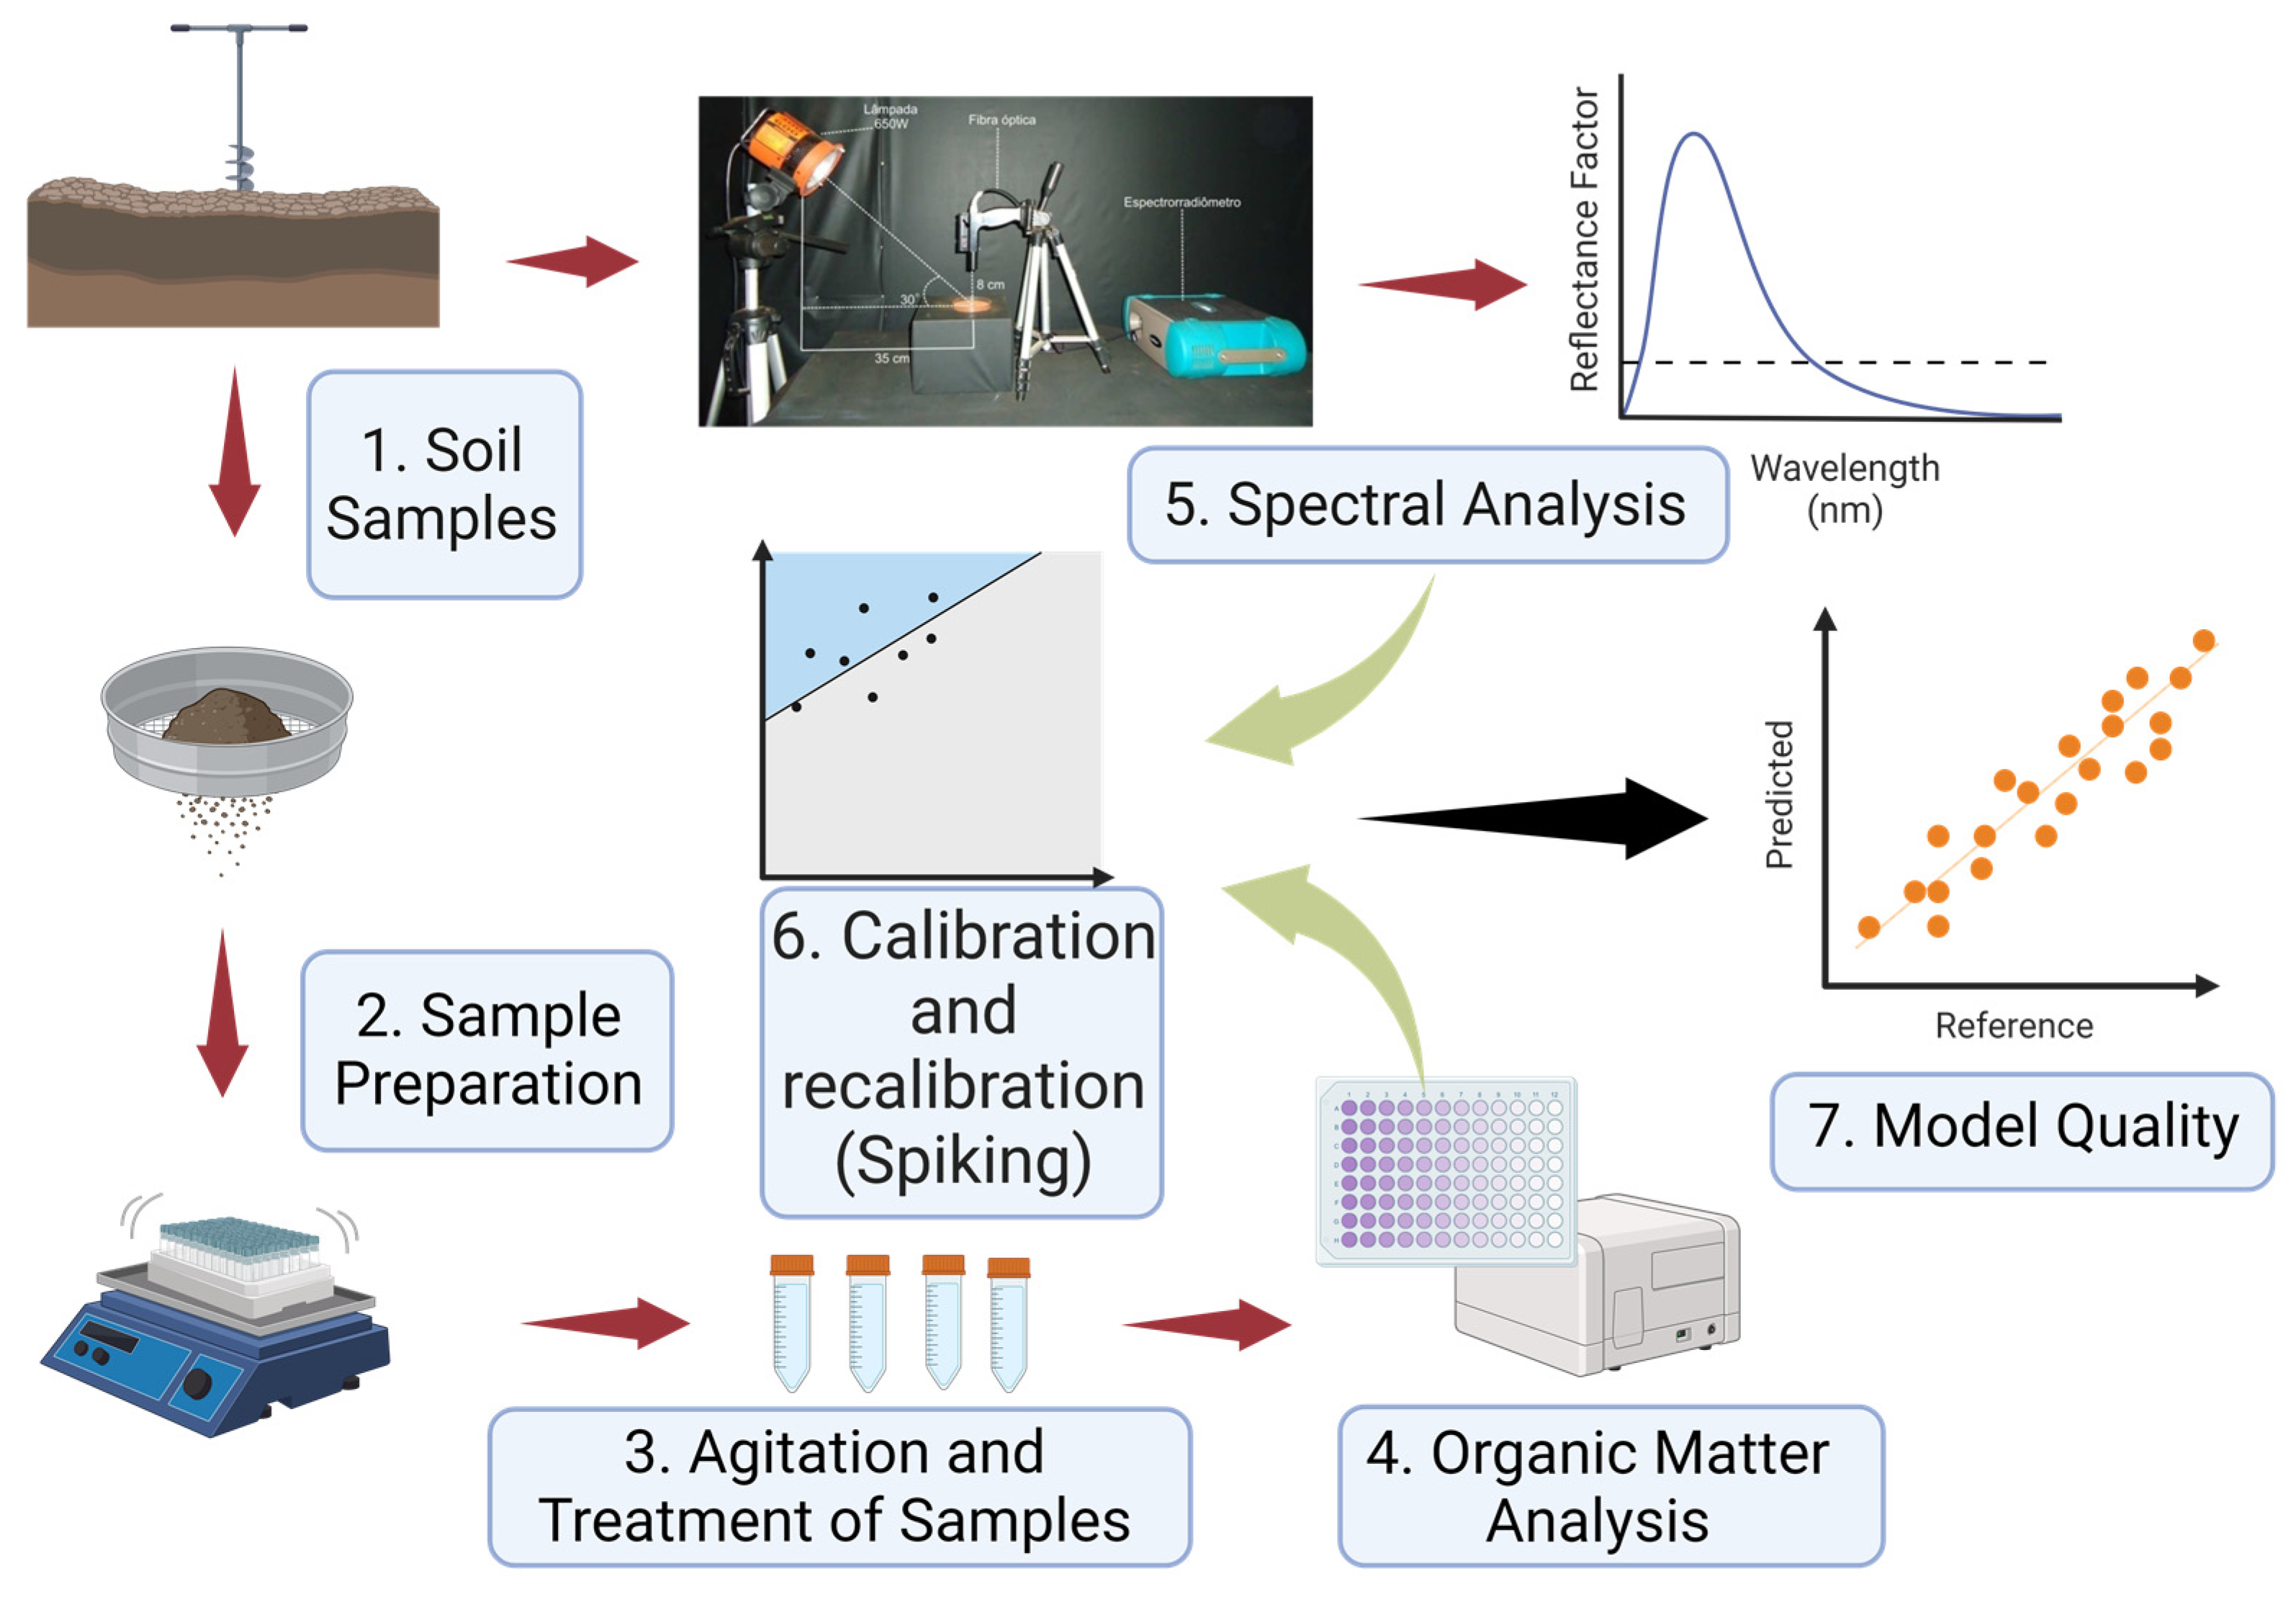
2.3. Obtaining the Spectra of Soil Samples

After separating a small amount of soil from each sample described in the previous section, these soils were placed in petri dishes measuring 9 cm in diameter by 1.5 cm in height for later reading. Spectral readings were taken in a controlled environment of humidity and light using a non-imaging spectroradiometer, ASD Fieldspec 3 JR, which covers the spectral range from 350 nm to 2500 nm and has a spectral resolution from 3 nm to 700 nm and 10 nm from 700 nm to 2500 nm. The equipment was programmed to perform 50 readings per sample, thus generating an average spectral curve. To collect radiometric data, the spectroradiometer was initially optimized to eliminate internal noise. The sensors were calibrated using a standard white Spectralon plate with 100% reflectance [37] as performed by Rodrigues et al. [38].
The optical fiber reader was placed in a vertical position 8 cm away from the support platform for samples, thus generating a reading area of approximately 2 cm2. A 650 W lamp was used as the light source, with a non-collimated beam for the target plane positioned 35 cm from the platform and at an angle of 30° in relation to the horizontal plane [39]. A summarized scheme of the analyses can be observed in the flowchart (Figure 2).

2.4. Data Processing and Statistical Analysis

Raw data were pre-processed to improve the stability of the regression models as described by Milos et al. [40]. Each spectral curve was submitted to correction by the de-trending method, which removes non-linear trends in spectroscopic data [41].
The recalibrated models were built from multivariate PLSR statistics (partial least-squares regressions) using Unscrambler version 10.3 software package (CAMO, Inc., Oslo, Norway). Their performance was evaluated following the methodology described by Bao et al. [42] (2021), using the coefficient of determination (r2), square root of the mean prediction error (RMSEP), interquartile performance rate (RPIQ) and systematic error (BIAS), which were calculated by the following equations:
r 2 = 1 i = 1 n   y i y i ^ 2 i = 1 n   y i y ¯ 2
R M S E = 1 n i = 1 n y i y i ^ 2
R P I Q = I Q R M S E
B I A S = i = 1 n y ^ r e f y r e f n
where n is the number of samples; yi is the observed organic matter value for sample I y i   ^  is the predicted organic matter for sample I; and  y ¯  is the mean organic matter for all samples [42]. The interquartile performance ratio is the difference between the third and first quartiles (IQ = Q3 − Q1). The predictive power of the models was evaluated considering strong predictive ability when r2 ≥ 0.75, acceptable ability when 0.5 ≤ r2 < 0.75 and unacceptable ability when r2 < 0.5 [43].
The quality classification of the models considering the RPIQ was adopted following the criteria defined by Veum et al. [44] and Thomas et al. [45], where RPIQ ≥ 2.70 represents models with good performance, 2.69 > RPIQ ≥ 1.89 represents models with moderate performance and RPIQ < 1.88 represents models with low performance. The BIAS was obtained by calculating the difference between the reference and predicted values through the spectral curves for the Vis/NIR/SWIR regions [46]. For the RMSE, although there are no fixed value ranges for its classification since it is a dimensionless metric, low values indicate good calibration of the predictive models [47].

2.5. Selection of Samples from the Target Area for Recalibration of the Test Area Models

A total of 10%, 25% and 50% of samples from the target area were selected for recalibration of the local organic matter prediction models obtained for the test area. The selection was performed according to Cezar et al. [46], applying the principal component analysis on the spectral curves at this stage in order to define which would be the most representative samples and capable of transferring the maximum existing variability in the target area to the main model. In this step, samples distributed in the center and edges of the spectral space were selected, considering the first two principal components (PC1 and PC2). As described in Section 2.4, the Unscrambler software was used in the selection process through the principal component analysis module.

2.6. Evaluation of Local Prediction Models Adjusted for the Test Area

Initially, a local prediction model was generated using the test area dataset (not recalibrated). This model was fitted with 89 soil samples from this area and validated with 46 soil samples from the target area. At a second stage, a second local prediction model was generated using the spiking technique, which serves to mark some spectra of samples of interest from the target area and introduce them into the original calibration matrix of the test area. This may allow the new recalibrated model to capture most of the existing variability in the target area, thus enabling better estimates of soil attributes [48,49,50].
Therefore, 94 (89 + 5), 101 (89 + 12) and 112 (89 + 23) soil samples were used for recalibration, while model validation was tested with 41, 34 and 23 samples, respectively, named independent samples (Figure 3). To assess whether sample selection and recalibration were efficient in improving the models created on a local scale, statistical parameters were compared before and after the recalibration process, as presented in Section 2.4.

3. Results

3.1. Descriptive Statistics

The statistics of soil organic matter content in both study areas point to a higher average value in the target area (Table 1).
It was found that the maximum SOM value found for the target area was close to 50 g dm−3, e.g., 5%, a content considered high for soil patterns in the Brazilian Cerrado. The histograms demonstrated that only the target area showed normal distribution (Figure 4). The Shapiro–Wilk test for the target dataset showed W = 0.97 and p = 0.24, that is, p > 0.05. On the other hand, the test area showed an asymmetrical distribution for the organic matter attribute, with W = 0.96 and p = 0.006.
When working with soil attributes, it is common to obtain a non-normal distribution due to its complexity [51], which is maximized in the study region, given the wide variation in relief and cultural management adopted by rural producers. Thus, it was decided not to transform the data, as this would change the real scale of soil organic matter values, compromising the relationship between with the spectral curves.

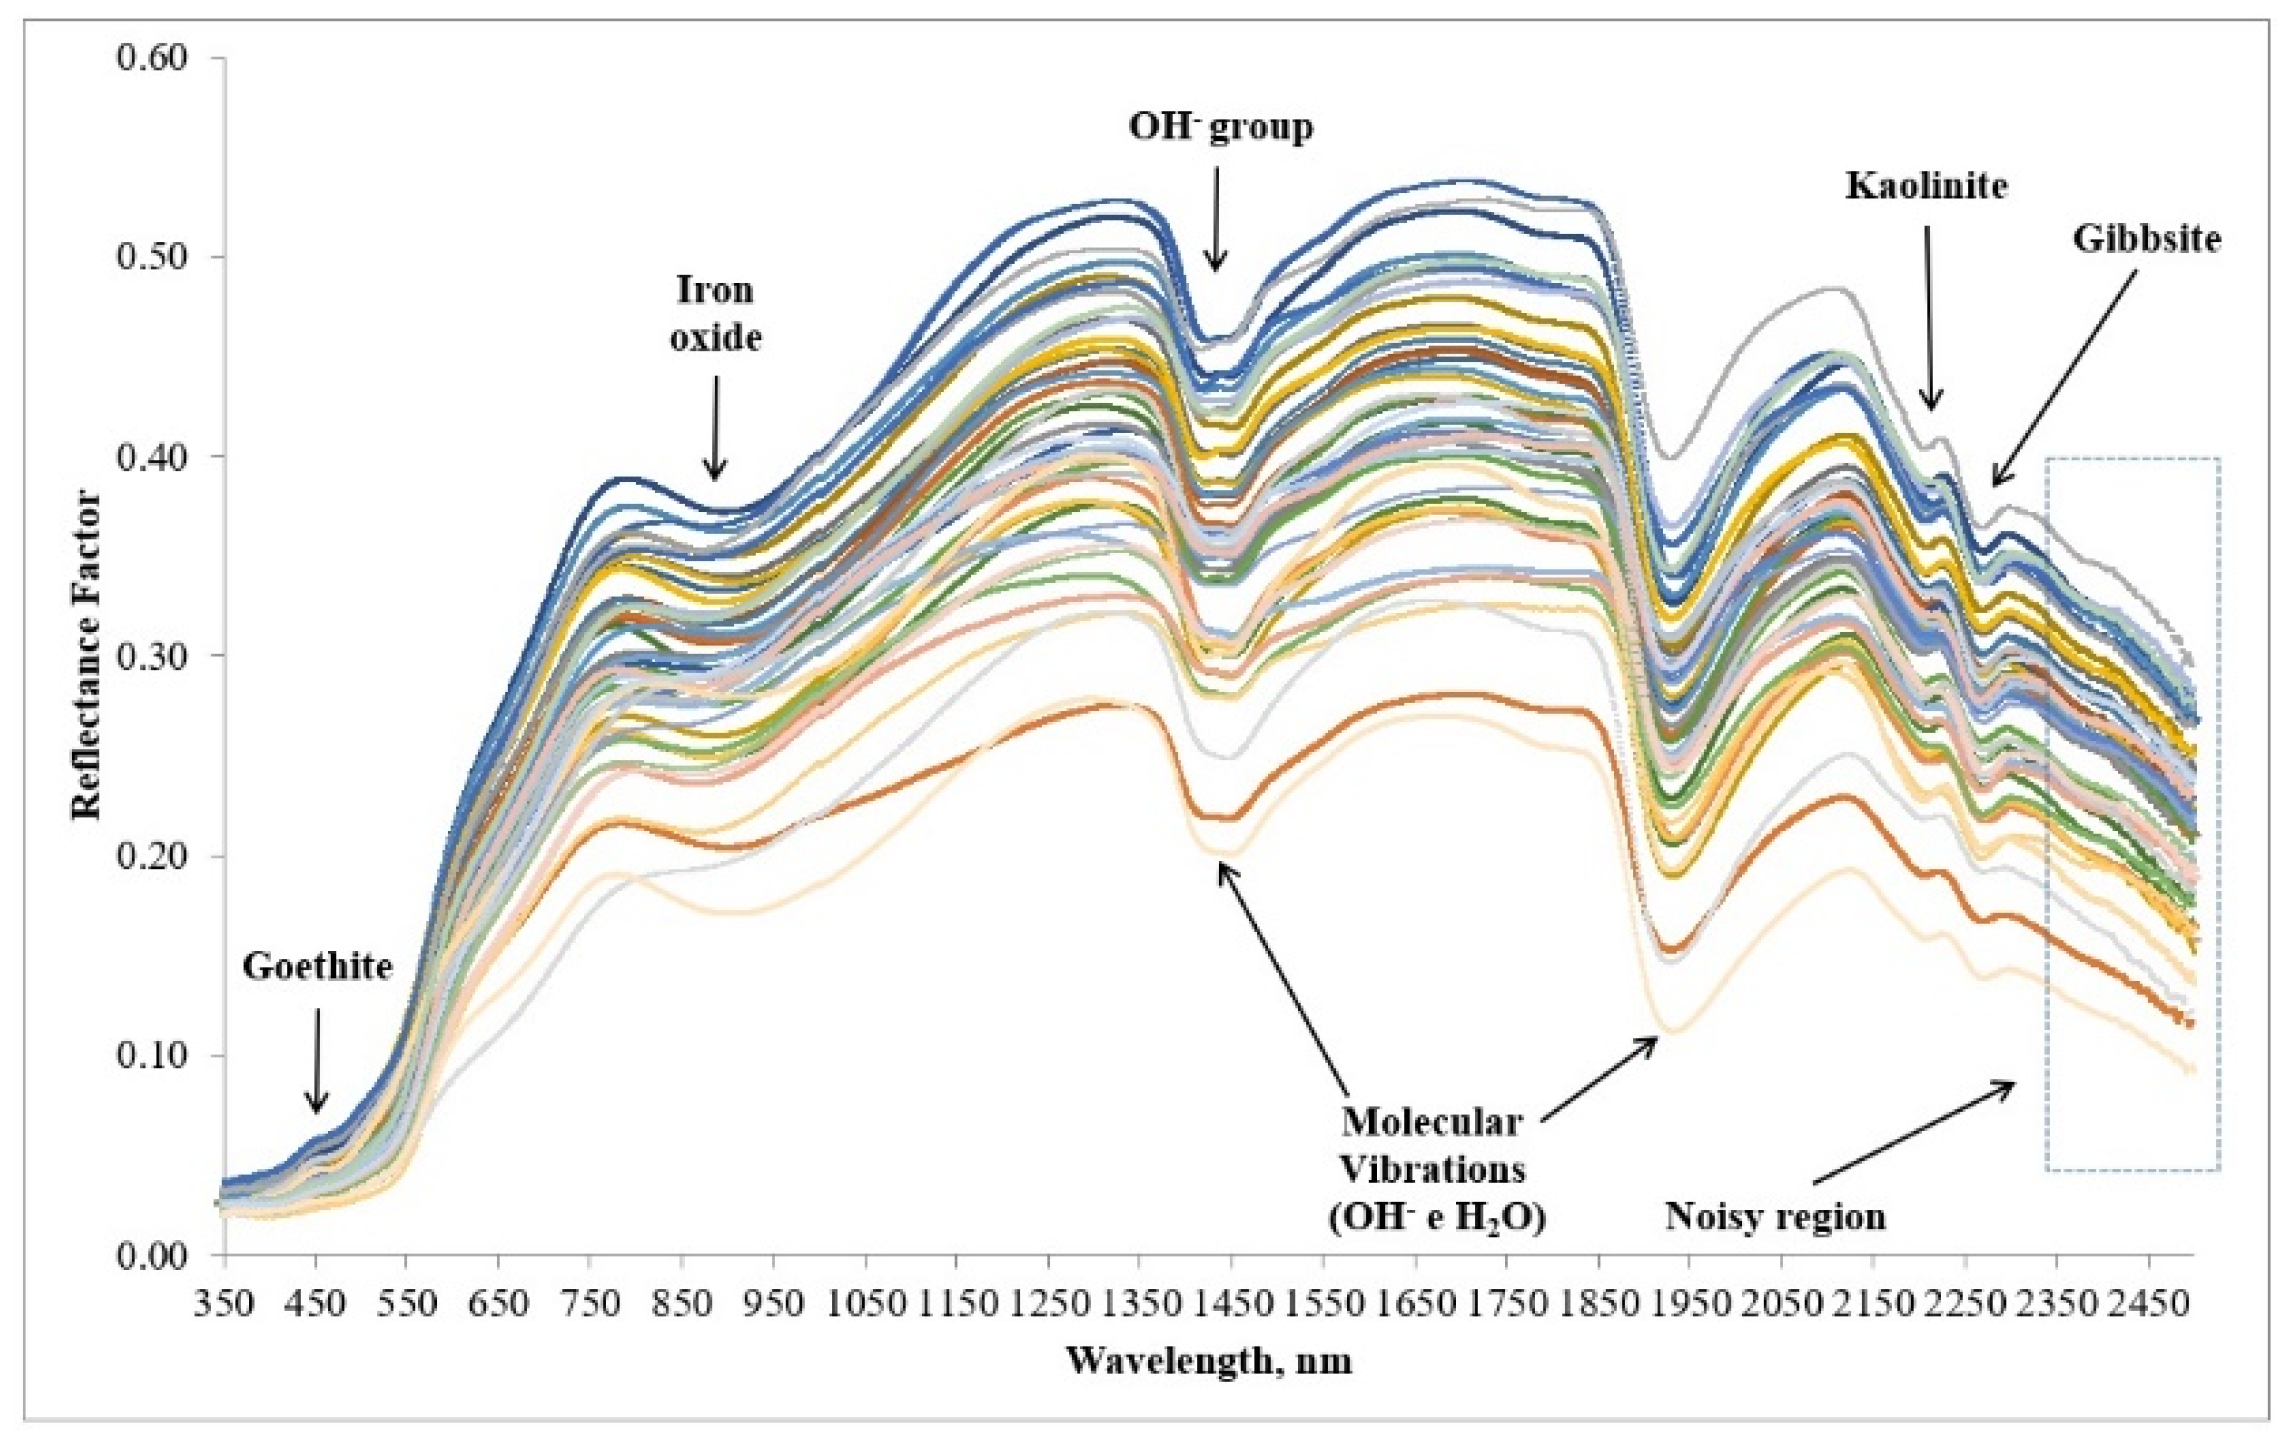
3.2. Description of Spectral Curves

The spectral curves obtained for the test area showed a relatively similar pattern in terms of absorption bands for depths from 0 to 0.20 m and from 0.20 to 0.40 m (Figure 5).
In the spectral region from 450 to 480 nm, a characteristic peak of the presence of goethite was observed. From 850 to 900 nm, absorption characteristics of the presence of hematite and goethite iron oxides were detected, while at 1400 nm and 1900 nm, the absorption occurred due to the presence of water and OH ions [52]. According to Ten Caten et al. [53], when the absorption bands occur at the same time at 1400 nm and 1900 nm as detected in this research, this characterizes the presence of water bound to the soil matrix. On the other hand, if they occur only at 1400 nm, this indicates the presence of hydroxyl present in minerals of soil.
In the regions centered at 2200 nm and 2265 nm, absorption characteristics of the presence of Kaolinite and Gibbsite, respectively, were observed, as discussed by Demattê et al. [54], Poppiel et al. [55] and Rodrigues et al. [56]. Similar results for absorption bands and points of greatest reflectance were observed for the spectral curves of the target area (Figure 6). Likewise, the reflectance factor intensities were concentrated between 0.20 and 0.50, with the higher values associated with 0.20–0.40 m depth.

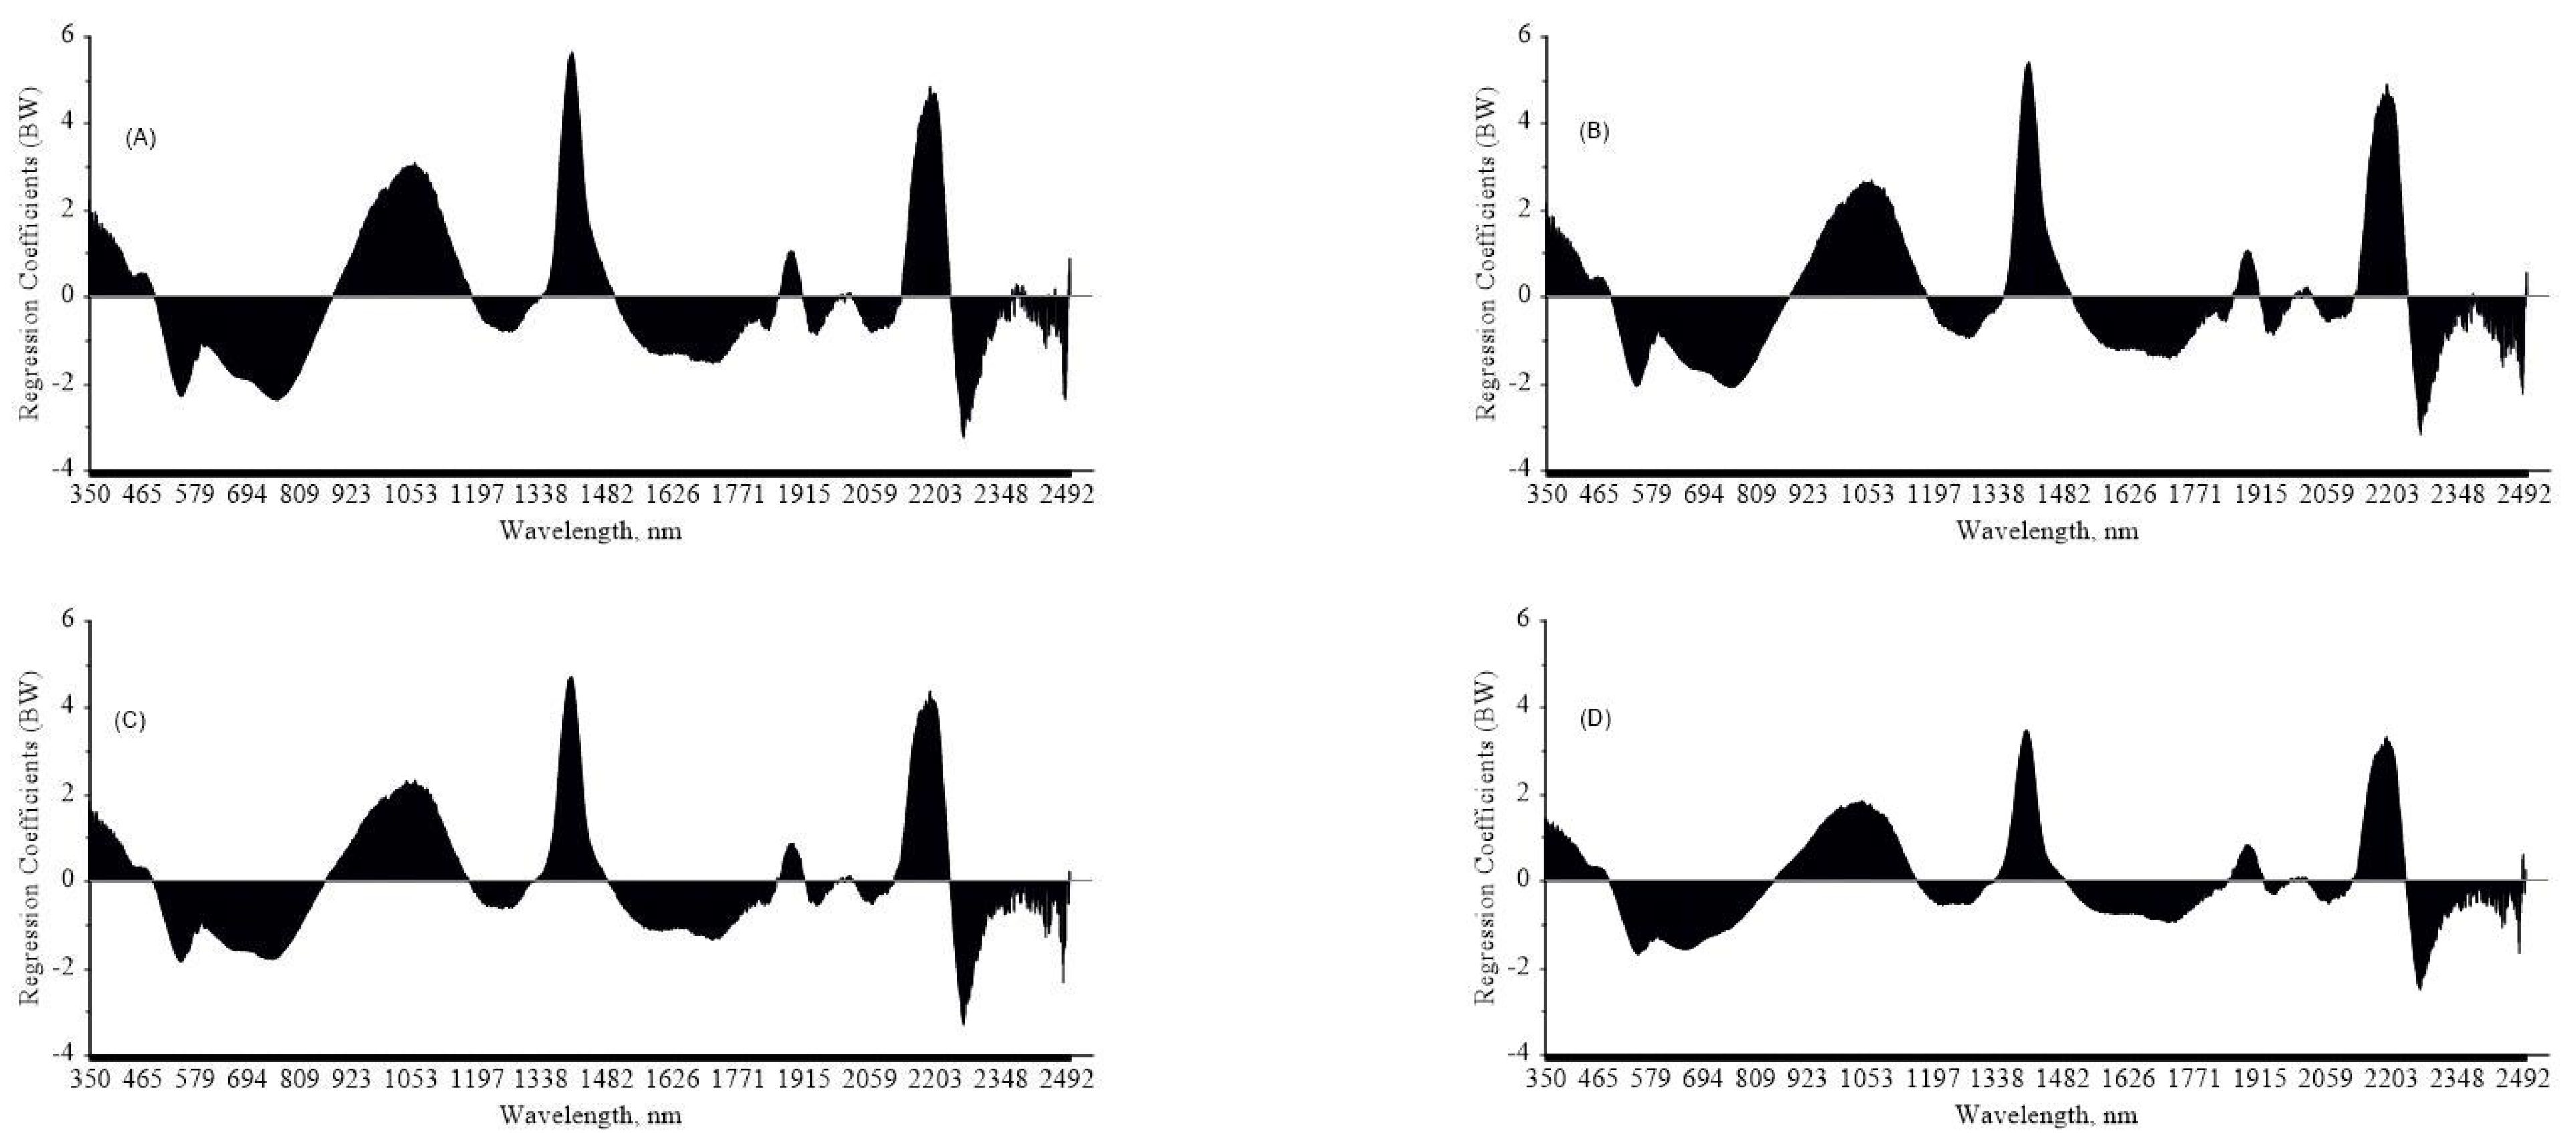
3.3. Statistical Indices of Predictive Models to Organic Matter

The results obtained during the calibration, cross-validation and prediction phase are shown below in Table 2.
The results evidenced the highest accuracies when 112 samples were used for calibration and cross-validation. In all cases, the increase in the number of samples in the recalibrated set reflected in a reduction in error (RMSEC, RMSECV, RMSEP) as well as in BIAS (Table 2) when compared to the model without recalibration (89 samples). In turn, the RPIQ values followed the opposite trend, reaching a maximum value of 4.58 for the model generated with 112 soil samples.

4. Discussion

4.1. Analysis of Spectral Curves

The relatively similar pattern in terms of absorption bands for the test areas at 0–0.20 m and 0.20–0.40 m depths (Figure 5) occurred due to the fact that the soil in the study area was formed by silt-clay metasediments which tend to present mineralogy and texture with little variation along the profile (see Section 2.1).
Regarding the reflectance intensity, it was observed that most of the time, the highest responses occurred for the spectral curves belonging to the samples collected at a 0.20–0.40 m depth. In this layer, it was found that the average contents of organic matter (16.33 g dm−3) at 0–0.20 m depth (22.56 g dm−3) were lower, promoting a greater overlap of spectral response (and higher reflectance) of the sand fraction, with a concentration of 590 g kg−1, in agreement with Demattê et al. [52], Nanni et. al. [39] and Heil and Schmidhalter [9].
The similarities observed in the intensity of certain spectral curves between different depths were associated with the soil tillage in the area, which was sporadically used to control weeds and loosen soil compaction. In this case, a change in the concentration of organic matter was detected between the superficial and subsurface layers due to remobilization.
The target area had similar spectral behavior to the test area. It was found that the average levels of soil organic matter (15.65 g dm−3) at 0.20–0.40 m depth were lower than those found at 0–0.20 m (21.06 g dm−3). The similarity between the spectral curves of both areas was associated with the source material, which was the same texture, which was variable but not much (see Section 2.1), as well as to the organic matter contents, which, despite having distant average values, presented intervals (minimum and maximum values) with about 1% difference (Table 1).

4.2. Local Soil Organic Matter Prediction Models

The recalibrated prediction models (using the spiking technique) for the test area, containing 94, 101 and 112 soil samples, showed slightly better results when compared with the non-recalibrated model from 89 samples (Table 2). The relative improvement of most statistical indices after the recalibration of the models is linked to the increase in the number of samples used in the recalibration process, as highlighted by Hong et al. [50].
However, despite this improvement, from the r2 results obtained, the recalibrated models from 10, 25 and 50% of the selected samples were classified as having low predictive capacity [43], even though the values of RPIQ demonstrate that the models fall into the good performance class [44].
It was expected that the use of 50% of samples from the selected target area for recalibration of the local model would be enough to significantly improve its accuracy, as discussed by Guerrero et al. [49], leading to higher-quality SOM prediction models; however, this did not happen since the samples selected from the target area were not able to transmit all of the existing variability in the soil to the local models, as highlighted by Guerrero et al. [21]. A similar result was obtained by Cezar et al. [46] during the evaluation of strategies for estimating organic matter using the spiking technique, a condition that leads us to believe that the type of sample selected, as well as the selection strategy, significantly influences the recalibration of the local model, agreeing with Nawar and Mouazen [57].
The aforementioned statement can be ratified through analysis of the regression coefficients (β) of the SOM prediction models (Figure 7), demonstrating the influence of each spectral band on the PLSR models [38]. Similar patterns of PLSR models can be seen for all datasets, indicating the same structure even after recalibration.
The non-recalibrated local model (89 soil samples) and the models recalibrated using the spiking methodology (94, 101 and 112 soil samples) were similar in terms of the intensity and spectral location of significant bands or intervals. The most important bands in all situations were those centered in the range of 552, 760, 1064, 1408, 1718, 2193 and 2268 nm, in agreement with Milos et al. [40]. This behavior is related to the overtones and combinations of fundamental vibrations and reflects the stretching and bending of chemical bonds, such as O–H, C–H, and N–H [8,58], present in the structures of organic matter.
Another explanation for why the post-calibration results were lower than expected is that, although the selected samples from the target area had different chemical and physical properties\from those of the test area, they did not have a marked spectral variation. Thus, both sets of data occupied the same spectral space, as observed by Nawar and Mouazen [57], which led the recalibration to lack a significant effect, agreeing with Cezar et al. [20].
The principal component analysis demonstrated large similarity between the spectral set of the target and test areas (Figure 8), except for three samples. There, three samples were held out of the ellipse, generated by the test of Hotelling’s T2 at 1% probability, which evidences the presence of outliers [59].
These results indicate that the recalibration of models on a local scale, using the spiking technique, will have a greater effect when the samples selected from the target area have a significant level of spectral difference and spatial variability in relation to the data set from the test area. Thus, the predictive capacity of the recalibrated models might be enhanced when applied to new areas since the range of soil attributes has a larger possibility to meet the ranges found for the samples used in the recalibration, as pointed out by Nawar and Mouazen [60].
Since the taxonomic classification for the soil class of both areas was similar, as well as their geology, with variances in only the granulometric aspects and soil use, low spectral variability was observed (Figure 5 and Figure 6). According to Ramirez Lopes et al. [61], spectral similarities may reflect similarity in soil composition. Therefore, it is also considered that the average SOM content was below 2% for the test area and close to 3% for the target area (Table 1), without a significant overlap of the effects of organic matter on the other soil attributes or large spectral variability [11,14].
Although the areas have been managed differently over the years, it should be noted that, as they are located in a tropical region, the accumulation and maintenance of SOM is very slow, requiring more than 10 years to achieve significant increments in its concentration [62]. Thus, large variations in terms of the concentration of this attribute are not expected for agricultural soils distributed in the Brazilian Cerrado, except for places where a mix of crop types, associated with crop rotation for long years, is adopted, which does not occur in the study area.
Despite what was observed, it should be noted that when compared to work carried out by other researchers in other countries (but mainly in Brazil), the results obtained here are encouraging for estimating organic matter in the Cerrado environment by remote sensing; however, many challenges must be overcome. Nanni et al. [39], using this technique to estimate organic matter in Paranaense soils (not Cerrado), obtained an r2 value equal to 0.31, an RMSEP equal to 6.88 g dm−3 and a Bias equal to 4.26, while our research obtained an r2 value equal to 0.43, an RMSEP equal to 2.34 g dm−3 and Bias equal to −0.27. Cezar et al. [20], when employing the use of remote sensing associated with the spiking technique to estimate soil organic matter in a subtropical environment in Brazil (not Cerrado), reached r2, RMSEP and Bias values equal to 0.41, 4.6 g dm−3 and 0.49, respectively.
On the other hand, Reis et al. [19], using an Aisafenix hyperspectral sensor (Specim, Finland) in estimating soil organic matter in a subtropical environment, obtained superior results, with r2, RMSEP and BIAS values equal to 0.75, 3.44 g dm−3 and 0.58, respectively. In this case, the positive result may be linked to the sensor, which has a higher resolution and the ability to capture small variations in soil organic matter content, allowing for more effective modeling. Using the same AisaFenix imager (Specim, Finland), Nanni et al. [18] achieved superior results when compared to our study for the prediction of organic matter, reaching an r2 value equal to 0.67, an RMSEP equal to 2.16 g dm−3 and BIAS equal to −0.22. Paz-Kagan et al. [63], also using the Aisafenix hyperspectral sensor to estimate soil attributes in Israel and Germany, achieved good results for organic matter, reaching an r2 value equal to 0.61 for the estimation in Israel and 0.95 in Germany.
In all these cases where the results were superior, the authors used a new hyperspectral sensor, which may indicate that is also necessary to change the sensor to test the possibility of having more robust data modeling in the Cerrado biome. Figure 9 presents the scatterplots between the predicted and reference values of SOM, corroborating the aforementioned statements. The correlation found between the predicted and reference values demonstrates that they are far from the regression line. However, the estimated values are within the upper and lower limits of the confidence interval set at the 95% probability level.
Finally, it should be noted that by adopting 50% of samples from the target area for recalibration of the Vis/NIR/SWIR spectral models, the results were superior in relation to the other models (Table 2), agreeing with Shi et al. [28]. This demonstrates that the selection and insertion of some samples from the target area in the spectral prediction model are important to improve the estimation, which has also been highlighted by Wetterlind et al. [29], Guerrero et al. [30] and Guy et al. [48].
These results are important for the SOM estimation in the Brazilian Cerrado since demand has grown over the years, requiring a faster and cleaner methodology for estimating these important soil attributes linked to physical, fertility and grain productivity in a region naturally formed by poor soils. However, considering the lack of similar research in the study area, it is necessary to further investigate the development of spectral models on a local scale and their contribution to improve the identification of SOM spatial variability.

5. Conclusions

The use of the spiking technique improved the predictive capacity of the recalibrated spectral models for the Cerrado by 12% compared to the non-recalibrated model. The use of local models for predicting organic matter for the Brazilian Cerrado showed potential for use when associated with the spiking technique without using spectral libraries. The development of local spectral models for estimating SOM is a potential alternative for areas in Cerrado, since the use of a model that is considered small will contribute to reduced costs in relation to models generated with large amounts of soil samples. Complementary studies should be carried out, taking into account new areas, uses and vegetation cover, as well as variations in the type and quantity of samples selected for recalibration of spectral models for estimating SOM in the Brazilian Cerrado.

Author Contributions

Conceptualization, E.C.; methodology, E.C. and M.R.N.; software, E.C.; validation, E.C.; formal analysis, E.C. and K.M.d.O.; investigation, E.C. and E.F.L.; resources, E.C.; data curation, E.C.; writing—original draft preparation, E.C.; writing—review and editing, T.A.A., L.G.T.C., M.R., A.S.R. and L.S.; visualization, L.G.T.C.; supervision, E.C.; project administration, E.C.; funding acquisition, E.C. All authors have read and agreed to the published version of the manuscript.

Funding

This research was funded by University of Minas Gerais State, with the following support: UEMG productivity researcher—PQ/UEMG (08/2021). The Fundamental Research Funds for Central Non-profit Scientific Institution, grant number 1610132023003.

Data Availability Statement

The data that support the findings of this study are available from the author E.C.

Acknowledgments

The authors acknowledge the University of the Minas Gerais State (UEMG) for granting a research productivity scholarship to the Everson Cezar (first author) and for use of the soil laboratory. The authors also acknowledge the University of Maringá State (UEM) for the spectral readings performed in the geoprocessing and remote sensing laboratory.

Conflicts of Interest

The authors declare no conflict of interest.

References

  1. Powlson, D.S.; Brookes, P.C.; Whitmore, A.P.; Goulding, K.W.T.; Hopkins, D.W. Soil organic matters. Eur. J. Soil Sci. 2011, 62, 1–4. [Google Scholar]
  2. Xing, Z.; Du, C.W.; Tian, K.; Ma, F.; Shen, Y.Z.; Zhou, J.M. Application of FTIR-PAS and Raman spectroscopies for the determination of organic matter in farmland soils. Talanta 2016, 158, 262–269. [Google Scholar]
  3. Hong, Y.; Chen, S.; Zhang, Y.; Chen, Y.; Yu, L.; Liu, Y.; Liu, Y.; Cheng, H.; Liu, Y. Rapid identification of soil organic matter level via visible and near-infrared spectroscopy: Effects of two-dimensional correlation coefficient and extreme learning machine. Sci. Total Environ. 2018, 644, 1232–1243. [Google Scholar]
  4. Gholizadeh, A.; Boruvka, L.; Saberioon, M.; Vasat, R. Visible, Near-Infrared, and Mid-Infrared Spectroscopy Applications for Soil Assessment with Emphasis on Soil Organic Matter Content and Quality: State-of-the-Art and Key Issues. Appl. Spectrosc. 2013, 67, 1349–1362. [Google Scholar]
  5. Zeng, R.; Zhao, Y.G.; Li, D.C.; Wu, D.W.; Wei, C.L.; Zhang, G.L. Selection of “local” models for prediction of soil organic matter using a regional soil Vis-NIR spectral library. Soil Sci. 2016, 181, 13–19. [Google Scholar] [CrossRef]
  6. Lazaar, A.; Mouazen, A.M.; Hammouti, K.E.; Fullen, M.; Pradhan, B.; Memon, M.S.; Andich, K.; Monir, A. The application of proximal visible and near-infrared spectroscopy to estimate soil organic matter on the Triffa Plain of Morocco. Int. Soil Water Conserv. Res. 2020, 8, 195–204. [Google Scholar]
  7. Viscarra Rossel, R.A.; Behrens, T.; Ben-Dor, E.; Brown, D.J.; Demattê, J.A.M.; Shepherd, K.D.; Shi, Z.; Stenberg, B.; Stevens, A.; Adamchuk, V.; et al. A global spectral library to characterize the world’s soil. Earth-Sci. Rev. 2016, 155, 198–230. [Google Scholar]
  8. Liu, Y.; Jiang, Q.; Fei, T.; Wang, J.; Shi, T.; Guo, K.; Li, X.; Chen, Y. Transferability of a Visible and Near-Infrared Model for Soil Organic Matter Estimation in Riparian Landscapes. Remote Sens. 2014, 6, 4305–4322. [Google Scholar]
  9. Heil, K.; Schmidhalter, U. An Evaluation of Different NIR-Spectral Pre-Treatments to Derive the Soil Parameters C and N of a Humus-Clay-Rich Soil. Sensors 2021, 21, 1423. [Google Scholar]
  10. Madeira Netto, J.S. Comportamento espectral dos solos. In Sensoriamento Remoto—Reflectância dos Alvos Naturais; Meneses, P.R., Madeira Netto, J.S., Eds.; EMBRAPA Cerrados: Brasilia, Brazil, 2001; pp. 127–147. [Google Scholar]
  11. Demattê, J.A.M.; Epiphanio, J.C.N.; Formaggio, A.R. Influência da matéria orgânica e de formas de ferro na reflectância de solos tropicais. Bragantia 2003, 62, 451–464. [Google Scholar]
  12. Dalmolin, R.S.D.; Gonçalves, C.N.; Klamt, E.; Dick, D.P. Relação entre os constituintes do solo e seu comportamento espectral. Cienc. Rural 2005, 35, 481–489. [Google Scholar] [CrossRef]
  13. Cierniewski, J.; Kusnierek, K. Influence of several soil properties on soil surface reflectance. Quaest. Geogr. 2010, 29, 13–25. [Google Scholar] [CrossRef]
  14. Baumgardner, M.F.; Kristof, S.; Johannsen, C.J.; Zachary, A. Effects of organic matter on the multispectral properties of soils. Soil Sci. 1970, 79, 413–422. [Google Scholar]
  15. Matews, H.L.; Cunninghan, R.L.; Petersen, G.W. Spectral reflectance of selected Pennsylvania soils. Soil Sci. Soc. Am. Proc. 1973, 37, 421–424. [Google Scholar] [CrossRef]
  16. Krishman, P.; Alexander, J.D.; Butler, B.J.; Hummel, J.W. Reflectance technique for predicting soil organic matter. Soil Sci. Soc. Am. J. 1980, 44, 1282–1285. [Google Scholar] [CrossRef]
  17. Chicati, M.S.; Nanni, M.R.; Chicati, M.L.; Furlanetto, R.H.; Cezar, E.; De Oliveira, R.B. Hyperspectral remote detection as an alternative to correlate data of soil constituents. Remote Sens. Appl. Soc. Environ. 2019, 16, 1–8. [Google Scholar]
  18. Nanni, M.R.; Demattê, J.A.M.; Rodrigues, M.; dos Santos, G.L.A.A.; Reis, A.S.; de Oliveira, K.M.; Cezar, E.; Furlanetto, R.H.; Crusiol, L.G.T.; Sun, L. Mapping Particle Size and Soil Organic Matter in Tropical Soil Based on Hyperspectral Imaging and Non-Imaging Sensors. Remote Sens. 2021, 13, 1782. [Google Scholar]
  19. Reis, A.S.; Rodrigues, M.; dos Santos, G.L.A.A.; de Oliveira, K.M.; Furlanetto, R.H.; Crusiol, L.G.T.; Cezar, E.; Nanni, M.R. Detection of soil organic matter using hyperspectral imaging sensor combined with multivariate regression modeling procedures. Remote Sens. Appl. Soc. Environ. 2021, 22, 100492. [Google Scholar]
  20. Cezar, E.; Nanni, M.R.; Crusiol, L.G.T.; Sun, L.; Chicati, M.S.; Furlanetto, R.H.; Rodrigues, M.; Sibaldelli, R.N.R.; Silva, G.F.C.; de Oliveira, K.M.; et al. Strategies for the Development of Spectral Models for Soil Organic Matter Estimation. Remote Sens. 2021, 13, 1376. [Google Scholar]
  21. Guerrero, C.; Stenberg, B.; Wetterlind, J.; Viscarra Rossel, R.; Maestre, F.; Mouazen, A.; Zornoza, R.; Ruiz-Sinoga, J.; Kuang, B. Assessment of soil organic carbon at local scale with spiked NIR calibrations: Effects of selection and extra-weighting on the spiking subset. Eur. J. Soil Sci. 2014, 65, 248–263. [Google Scholar]
  22. Qiao, X.X.; Wang, C.; Feng, M.C.; Yang, W.D.; Ding, G.W.; Sun, H.; Liang, Z.Y.; Shi, C.C. Hyperspectral estimation of soil organic matter based on different spectral preprocessing techniques. Spectrosc. Lett. 2017, 50, 156–163. [Google Scholar] [CrossRef]
  23. Stevens, A.; Nocita, M.; Tóth, G.; Montanarella, L.; van Wesemael, B. Prediction of Soil Organic Carbon at the European Scale by Visible and Near InfraRed Reflectance Spectroscopy. PLoS ONE 2013, 8, e66409. [Google Scholar]
  24. Viscarra Rossel, R.A.; Webster, R. Predicting soil properties from the Australian soil visible–near infrared spectroscopic database. Eur. J. Soil. Sci. 2012, 63, 848–860. [Google Scholar] [CrossRef]
  25. Araújo, S.R.; Wetterlind, J.; Demattê, J.A.M.; Stenberg, B. Improving the prediction performance of a large tropical vis-NIR spectroscopic soil library from Brazil by clustering into smaller subsets or use of data mining calibration techniques. Eur. J. Soil Sci. 2014, 65, 718–729. [Google Scholar] [CrossRef]
  26. Demattê, J.A.M.; Bellinaso, H.; Araujo, S.R.; Rizzo, R.; Souza, A.B. Spectral regionalization of tropical soils in the estimation of soil attributes. Rev. Ciênc. Agron. 2016, 47, 589–598. [Google Scholar] [CrossRef]
  27. Seidel, M.; Vohlanda, M.; Hutengs, C.; Ludwig, B.; Thiele-Bruhn, S.; Vohland, M. Strategies for the efficient estimation of soil organic carbon at the field scale with vis-NIR spectroscopy: Spectral libraries and spiking vs. local calibrations. Geoderma 2019, 354, 113856. [Google Scholar]
  28. Shi, Z.; Ji, W.; Viscarra Rossel, R.A.; Chen, S.; Zhou, Y. Prediction of soil organic matter using a spatially constrained local partial least squares regression and the Chinese vis–NIR spectral library. Eur. J. Soil Sci. 2015, 66, 679–687. [Google Scholar] [CrossRef]
  29. Wetterlind, J.; Stenberg, B.; Söderström, M. Increased sample point density in farm soil mapping by local calibration of visible and near infrared prediction models. Geoderma 2010, 156, 152–160. [Google Scholar]
  30. Guerrero, C.; Zornoza, R.; Gómez, I.; Mataix-Beneyto, J. Spiking of NIR regional models using simples from target sites: Effect of model size on prediction accuracy. Geoderma 2010, 158, 66–77. [Google Scholar] [CrossRef]
  31. Dos Santos, P.A.B.; Monti, C.A.U.; de Carvalho, L.G.; Lacerda, W.S.; Schwerz, F. Air temperature estimation techniques in Minas Gerais state, Brazil, Cwa and Cwb climate regions according to the Köppen-Geiger climate classification system. Cienc. Agrotecnol. 2021, 45, e023920. [Google Scholar]
  32. Ferreira, H.R.; Tres, A.; Tetto, A.F.; Soares, R.V.; Wendling, W.T.; Batista, A.C. Classificação climática para o estado de Minas Gerais segundo as zonas de vida de Holdridge. J. Biotechnol. Biodivers. 2019, 7, 304–314. [Google Scholar]
  33. CPRM. Mapa Geodiversidades do Brasil: Escala 1:2,500,000: Legenda Expandida; CPRM/Serviço Geológico do Brasil, SGM, MME: Brasilia, Brazil, 2006; 68p.
  34. World Reference Base for Soil Resources. International Soil Classification System for Naming Soils and Creating Legends for Soil Maps, 3rd ed.; FAO: Rome, Italy, 2014; ISBN 978-92-5-108369-7. [Google Scholar]
  35. Instituto Agronômico de Campinas IAC. Métodos de Análise Química, Mineralógica e Física de Solos do Instituto Agronômico de Campinas; Boletim 106; Instituto Agronômico de Campinas IAC: Campinas, Brazil, 2009; 77p.
  36. Empresa Brasileira de Pesquisa Agropecuária—EMBRAPA. Manual de Métodos de Análise de Solo, 3rd ed.; Revista e Ampliada; Embrapa: Rio de Janeiro, Brazil, 2017; 574p. [Google Scholar]
  37. Labsphere, Inc. Reflectance Calibration Laboratory. Handling Guidelines; Labsphere, Inc. Reflectance Calibration Laboratory: Sutton, UK, 1996. [Google Scholar]
  38. Rodrigues, M.; Cezar, E.; Argenta, J.C.; Barcelos, L.B.; Reis, A.S.; dos Santos, G.L.A.A.; de Oliveira, K.M.; de Oliveira, R.B.; Nanni, M.R. Relationship Between Vegetation Indices, Nutrients Content, and the Biomass Production of Brachiaria (Brachiaria ruziziensis). Commun. Soil Sci. Plan. 2022, 53, 2400–2419. [Google Scholar]
  39. Nanni, M.R.; Cezar, E.; Silva Junior, C.A.D.; Silva, G.F.C.; Gualberto, A.A.S. Partial least squares regression (PLSR) associated with spectral response to predict soil attributes in transitional lithologies. Arch. Agron. Soil Sci. 2017, 64, 682–695. [Google Scholar]
  40. Milos, B.; Bensa, A.; Japundzic-Palenki, B. Evaluation of Vis-NIR preprocessing combined with PLS regression for estimation soil organic carbon, cation exchange capacity and clay from eastern Croatia. Geoderma Reg. 2022, 30, e00558. [Google Scholar]
  41. Barnes, R.J.; Dhanoa, M.S.; Lister, S.J. Standard normal variate transformation and de-trending of near-infrared diffuse reflectance spectra. Appl. Spectrosc. 1989, 43, 772–777. [Google Scholar]
  42. Bao, Y.; Ustin, S.; Meng, X.; Zhang, X.; Guan, H.; Qi, B.; Liu, H. A regional-scale hyperspectral prediction model of soil organic carbon considering geomorphic features. Geoderma 2021, 403, 115263. [Google Scholar]
  43. Li, L.; Lu, J.; Wang, S.; Ma, Y.; Wei, Q.; Li, X.; Cong, R.; Ren, T. Methods for estimating leaf nitrogen concentration of winter oilseed rape (Brassica napus L.) using in situ leaf spectroscopy. Ind. Crops Prod. 2016, 91, 194–204. [Google Scholar]
  44. Veum, K.; Sudduth, K.A.; Kremer, R.J.; Kitchen, N.R. Estimating a soil quality index with VNIR reflectance spectroscopy. Soil Sci. Soc. Am. J. 2015, 2, 637–649. [Google Scholar]
  45. Thomas, F.; Petzold, R.; Landmark, S.; Mollenhauer, H.; Becker, C.; Werban, U. Estimating Forest Soil Properties for Humus Assessment—Is Vis-NIR the Way to Go? Remote Sens. 2022, 14, 1368. [Google Scholar]
  46. Cezar, E.; Luiz Cruciol, L.G.T.; Nanni, M.R.; Guerrero, C.; da Silva Junior, C.A.; Chicati, M.A.; Silva, G.F.C. Organic matter and sand estimates by spectroradiometry: Strategies for the development of models with applicability at a local scale. Geoderma 2019, 340, 224–233. [Google Scholar]
  47. Naes, T.; Isaksson, T.; Fearn, T.; Davies, T. A User-Friendly Guide to Multivariate Calibration and Classification; Nir Publication: Chichester, UK, 2004; 335p. [Google Scholar]
  48. Guy, A.L.; Siciliano, S.D.; Lamb, E.G. Spiking regional VIS-NIR calibration models with local samples to predict soil organic carbon in two High Arctic polar deserts using a Vis-NIR probe. Can. J. Soil Sci. 2015, 95, 237–249. [Google Scholar] [CrossRef]
  49. Guerrero, C.; Wetterlind, J.; Stenberg, B.; Mouazen, A.M.; Gabarrón-Galeote, M.A.; RuizSinoga, J.D.; Zornoza, R.; Viscarra Rossell, R.A. Do we really need large spectral libraries for local scale SOC assessment with NIR spectroscopy? Soil Till. Res. 2016, 155, 501–509. [Google Scholar] [CrossRef]
  50. Hong, Y.; Chen, Y.; Zhang, Y.; Liu, Y.; Liu, Y.; Yu, L.; Liu, Y.; Cheng, H. Transferability of Vis-NIR models for Soil Organic Carbon Estimation between Two Study Areas by using Spiking. Soil Sci. Soc. Am. J. 2018, 82, 1231–1242. [Google Scholar] [CrossRef]
  51. Bellom-Maurel, V.; Ahumada, E.F.; Palagos, B.; Roger, J.M.; Mcbratney, A. Critical review of chemometric indicators commonly used for assessing the quality of the prediction of soil atributes by NIR spectroscopy. TrAC Trend Anal. Chem. 2010, 29, 1073–1081. [Google Scholar] [CrossRef]
  52. Demattê, J.A.M.; Bellinaso, H.; Romero, D.J.; Fongaro, C.T. Morphological Interpretation of Reflectance Spectrum (MIRS) using libraries looking towards soil classification. Sci. Agric. 2014, 71, 509–520. [Google Scholar] [CrossRef]
  53. Ten Caten, A.; Dalmolin, R.S.D.; da Silva, E.B.; Heinen, T.Z.H.; Safanelli, J.L. Avanços na observação e no conhecimento do solo via o sensoriamento próximo. Agropecuária Catarin. 2021, 34, 72–78. [Google Scholar] [CrossRef]
  54. Demattê, J.A.M.; Araújo, S.M.; Fiorio, P.R.; Fongaro, C.T.; Nanni, M.R. VIS-NIR-SWIR na avaliação de solos ao longo de uma topossequência em Piracicaba (SP). Ver. Cienc. Agron. 2015, 46, 679–688. [Google Scholar] [CrossRef]
  55. Poppiel, R.R.; Lacerda, M.P.C.; de Oliveira Junior, M.P.; Demattê, J.A.M.; Romero, D.J.; Sato, M.V.; de Almeida Júnior, L.R.; Cassol, L.F.M. Surface Spectroscopy of Oxisols, Entisols and Inceptisol and Relationships with Selected Soil Properties. Rev. Bras. Cienc. Solo 2018, 42, 1–26. [Google Scholar] [CrossRef]
  56. Rodrigues, M.; Nanni, M.R.; Cezar, E.; dos Santos, G.L.A.A.; Reis, A.S.; de Oliveira, K.M. Evaluation of the use of spectroradiometry for the determination of soil exchangeable ions after the application of mining coproducts. Appl. Spectrosc. Rev. 2019, 55, 491–508. [Google Scholar] [CrossRef]
  57. Nawar, S.; Mouazen, A.M. Optimal sample selection for measurement of soil organic carbon using online Vis-NIR spectroscopy. Comput. Electron. Agric. 2018, 151, 469–477. [Google Scholar] [CrossRef]
  58. Viscarra Rossel, R.A.; Behrens, T. Using data mining to model and interpret soil diffuse reflectance spectra. Geoderma 2010, 158, 46–54. [Google Scholar] [CrossRef]
  59. Rosero-Vlasova, O.A.; Vlassova, L.; Pérez-Cabello, F.; Montorio, R.; Nadal-Romero, E. Soil organic matter and texture estimation from visible–near infrared–shortwave infrared spectra in areas of land cover changes using correlated component regression. Land Degrad. Dev. 2019, 30, 544–560. [Google Scholar] [CrossRef]
  60. Nawar, S.; Mouazen, A.M. Predictive performance of mobile vis-near infrared spectroscopy for key soil properties at different geographical scales by using spiking and data mining techniques. Catena 2017, 151, 118–129. [Google Scholar] [CrossRef]
  61. Ramirez-Lopez, L.; Behrens, T.; Schmidt, K.; Viscarra Rossel, R.A.; Demattê, J.A.M.; Scholten, T. Distance and similarity-search metrics for use with soil vis–NIR spectra. Geoderma 2013, 199, 43–53. [Google Scholar] [CrossRef]
  62. Sá, J.C.M.; Séguy, L.; Gozé, E.; Bouzina, S.; Bouzinac, S.; Husson, O.; Boulaki, S.; Tivet, F.; Forest, F.; dos Santos, J.B. Carbon sequestration rates in no-tillage soils under intensive cropping systems in tropical agroecozones. Edafologia 2006, 13, 139–150. [Google Scholar]
  63. Paz-Kagan, T.; Zaady, E.; Salbach, C.; Schmidt, A.; Lausch, A.; Zacharias, S.; Notesco, G.; Ben-Dor, E.; Karnieli, A. Mapping the spectral soil quality index (SSQI) using airborne imaging spectroscopy. Remote Sens. 2015, 7, 15748–15781. [Google Scholar] [CrossRef]
Figure 1. Location of the test and target areas in the municipality of Passos, State of Minas Gerais, Brazil.
Remotesensing 15 04397 g001
Figure 2. Flowchart of the methodology for assessing organic matter using Vis/NIR/SWIR hyperspectral sensors and traditional laboratory analysis.
Remotesensing 15 04397 g002
Figure 3. Scheme used to represent the experiment. (a) Initial calibration (IC) unspiked constructed only with the test area dataset; (b) Initial calibration spiked with a spiking subset (SS) selected in the target site (TS); source: Adapted of the Guerrero et al. [21].
Remotesensing 15 04397 g003
Figure 4. Representative histograms from the soil organic matter datasets for the test and target areas.
Remotesensing 15 04397 g004
Figure 5. Spectral curves of soil samples collected in the test area, at 0 to 0.20 m and from 0.20 m to 0.40 m depths.
Remotesensing 15 04397 g005
Figure 6. Spectral curves of soil samples collected in the target area, considering depths from 0 to 0.20 m and from 0.20 m to 0.40 m.
Remotesensing 15 04397 g006
Figure 7. Representative regression coefficient of the non-recalibrated local model (A) and of the recalibrated local models using the spiking technique (BD).
Remotesensing 15 04397 g007
Figure 8. Principal component (PC) similarity maps of the test and target area datasets. Red scores were obtained by the calibration model using test area spectra. Green scores were obtained by the calibration model using target area spectra. The ellipse is the limit for the Hotelling’s T2 test (p-value of 1%).
Remotesensing 15 04397 g008
Figure 9. Scatterplots obtained during the prediction phase. (A) Unspiked local model; (B) Spiked local model tested with 41 samples; (C) Spiked local model tested with 34 samples; (D) Spiked local model tested with 23 samples. Regression line (solid line); confidence interval (red line).
Remotesensing 15 04397 g009
Table 1. Descriptive statistics obtained for soil organic matter in the study areas.
AreaMeanStandard DeviationMinimumMaximumKurtosisSkewnessSwilk W Swilk Prob
g dm−3
Test19.586.201036−0.230.610.960.006
Target31.377.361947−0.580.330.970.24
n of test area: 89 soil samples (one sample was withdrawn due to a discrepant value); n of the target area: 46 soil samples; Swilk prob p-value (0.05).
Table 2. Statistical indices obtained during the generation phase of the recalibrated and non-recalibrated models.
DescriptionNr2RMSEC
(g dm−3)
RMSECV
(g dm−3)
RMSEP
(g dm−3)
BIAS *RPIQ *
Calibration890.954.56--−0.311.97
Cross-validation 890.94-4.96-−0.271.81
Prediction460.31--3.500.773.14
Recalibration940.954.45--−0.302.02
Cross-validation940.94-4.93-−0.241.82
Prediction410.31--3.310.633.32
Recalibration1010.964.05--−0.272.22
Cross-validation1010.95-4.50-−0.242.00
Prediction340.34--2.920.913.76
Recalibration1120.963.88--−0.262.31
Cross-validation1120.95-4.20-−0.222.62
Prediction230.43--2.34−0.274.58
* Dimensionless.
Disclaimer/Publisher’s Note: The statements, opinions and data contained in all publications are solely those of the individual author(s) and contributor(s) and not of MDPI and/or the editor(s). MDPI and/or the editor(s) disclaim responsibility for any injury to people or property resulting from any ideas, methods, instructions or products referred to in the content.

