Article

Hydrothermal Factors Influence on Spatial-Temporal Variation of Evapotranspiration-Precipitation Coupling over Climate Transition Zone of North China

1
Plateau Atmospheric and Environment Key Laboratory of Sichuan Province, College of Atmospheric Sciences, Chengdu University of Information Technology, Chengdu 610225, China
2
Institute of Arid Meteorology, CMA, Key Laboratory of Arid Climatic Change and Reducing Disaster of Gansu Province, Key Open Laboratory of Arid Climatic Change and Disaster Reduction of CMA, Lanzhou 730020, China
*
Author to whom correspondence should be addressed.
Remote Sens. 2022, 14(6), 1448; https://doi.org/10.3390/rs14061448
Submission received: 7 February 2022 / Revised: 10 March 2022 / Accepted: 15 March 2022 / Published: 17 March 2022

Abstract

:
As a land–atmosphere coupling “hot spot”, the northern China climate transition zone has a sharp spatial gradient of hydrothermal conditions, which plays an essential role in shaping the spatial and temporal pattern of evapotranspiration-precipitation coupling, but whose mechanisms still remain unclear. This study analyzes the spatial and temporal variation in land–atmosphere coupling strength (CS) in the climate transitional zone of northern China and its relationship with soil moisture and air temperature. Results show that CS gradually transitions from strong positive in the northwest to negative in the southeast and northeast corners. The spatial distribution of CS is closely related to climatic hydrothermal conditions, where soil moisture plays a more dominant role: CS increases first, and then decreases with increasing soil moisture, with the threshold of soil moisture at 0.2; CS gradually transitions from positive to negative at soil moisture between 0.25 and 0.35; CS shows an exponential decreasing trend with increasing temperature. In terms of temporal variation, CS is strongest in spring and weakens sequentially in summer, autumn, and winter, and has significant interdecadal fluctuations. The trend in CS shifts gradually from significantly negative in the west to a non-significant positive in the east. Soil moisture variability dominates the intra-annual variability of CS in the study regions, and determines the interannual variation of CS in arid and semi-arid areas. Moreover, the main reason for the positive and negative spatial differences in CS in the study area is the different driving regime of evapotranspiration (ET). ET is energy-limited in the southern part of the study area, leading to a positive correlation between ET and lifting condensation level (LCL), while in most of the northern part, ET is water-limited and is negatively correlated with LCL; LCL has a negative correlation with P across the study area, thus leading to a negative ET-P coupling in the south and a positive coupling in the north.

1. Introduction

Among the interactions amid various spheres of the climate system, the land–atmosphere interaction plays an important role in influencing the evolution of weather and climate [1]. The land surface is closely linked to the atmosphere through energy and water cycles, causing increases in the temperature variability [2] and the frequency of high-temperature heat waves [3], and exacerbating compound soil and atmospheric drought intensity [4]. The land–atmosphere coupling strength (CS) is a key indicator to characterize the land–atmosphere interaction. Areas with a stronger CS imply a greater influence of land surface on regional weather and climate. The global strong land–atmosphere coupling zone is mostly located in the arid-humid climate transition zone [5], including west-central North America, parts of Eurasia, Australia, Argentina, the Sahel region of North Africa, and South Africa [6,7]. Accurate acquisition of land–atmosphere forcing signals in these land–atmosphere coupling “hotspots” is important for improving the forecasting capabilities of the weather and climate [5,8,9].
Land–atmosphere coupling includes a series of complex processes: land surface state anomalies first cause changes in surface fluxes, which in turn affect precipitation through feedbacks from the land surface to the atmosphere [7,10]. Regulated by the surface energy balance, sensible heat fluxes change synergistically with evapotranspiration. Thus, evapotranspiration can regulate sensible heat fluxes via the Bowen ratio. Therefore, evapotranspiration is often considered as a key process in land–atmosphere coupling processes [11,12]. However, studies have shown that the influence of evapotranspiration on precipitation has the greatest uncertainty in land–atmosphere coupling processes [13]. Generally, evapotranspiration can affect precipitation in three ways. First, evapotranspiration directly affects atmospheric precipitation through water recycling. Evapotranspiration can return approximately 70% of precipitation to the atmosphere [14], and atmospheric precipitable water directly influences precipitation. This mechanism is more prominent in water-scarce areas [15,16]. Second, changes in evapotranspiration can also alter the regional pressure field, which can cause adjustments in atmospheric circulation and lead to large-scale precipitation changes [17]. Moreover, evapotranspiration and the sensible heat fluxes regulated by it affect the atmospheric stability state by altering the atmospheric temperature and humidity profiles, thus affecting convective precipitation [18]. The last of these pathways, evapotranspiration–precipitation local coupling, is the most important method for evapotranspiration to influence precipitation [13,19,20]. However, due to the complexity of the influence of evapotranspiration on atmospheric stability, evapotranspiration-precipitation local coupling has significant uncertainty and becomes a challenging problem in the current land–atmosphere coupling research.
Local evapotranspiration–precipitation coupling is controlled by many factors and the influence mechanism is very complex. Water and energy cycles are the key physical processes throughout the coupled land–atmosphere interaction [21]. Moisture and thermal factors directly affect the evapotranspiration process: in dry areas, evapotranspiration is controlled mainly by moisture factors, while in humid areas evapotranspiration is controlled mainly by thermal factors [22,23]. In turn, evapotranspiration affects the structural characteristics of the boundary layer through the transport of water and heat, and sufficient surface moisture can lead to lowered boundary layer height (BLH) and lifting condensation level (LCL) and increased moist static energy (MSE); in contrast, limited surface water and adequate thermal conditions raise the BLH and LCL. In general, lower BLH and LCL and larger MSE can lead to an increase in convective available potential energy (CAPE) and a higher probability of convective precipitation [20]. However, observation studies have found that arid conditions can also promote physical mechanisms that favor the generation of convective precipitation [24,25,26,27]. This is attributed to the large sensible heat flux caused by strong thermal factors in arid regions that weakens the convective inhibition energy (CIN) [28], thereby increasing the probability of convective precipitation; there is also a negative feedback of evapotranspiration on precipitation. Therefore, both positive and negative feedbacks between evapotranspiration and precipitation are closely related to moisture and thermal properties, i.e., moisture and thermal factors are the most critical forcing factors affecting the land–atmosphere coupling strength.
In the past 20 years, a large number of studies have paid attention to the spatial and temporal distribution of land–atmosphere coupling and its intrinsic mechanism. The Global Land-Atmosphere Coupling Experiment (GLACE) found that the strong land–atmosphere coupling regions are mostly located in semi-arid and semi-humid climate transition zones [5], and other diagnostic studies based on observational data have also verified this conclusion [6,7,29]. Due to the apparent spatial variability of land–atmosphere CS, some typical regions have attracted wide attention. In North America, the spatial distribution of land–atmosphere coupling was correlated with the multi-year average soil moisture, and the strong coupling area was mainly distributed in areas with soil moisture ranging from 0.4 to 0.55 [30]. Due to interannual variations in soil moisture, land–atmosphere coupling shows significant interannual fluctuations [31,32]. In southeastern South America, the spatial and temporal distribution of land–atmosphere coupling is correlated not only with soil moisture but also with wet static energy and its vertical gradient that is controlled by soil moisture [33]. Moreover, under future climate warming and humidification, the intensity of land–atmosphere coupling will be significantly weakened due to the gradual shift of evapotranspiration from moisture limitation to energy limitation [34]. In Europe, the northward expansion of the Hadley circulation has caused a northward shift of the climate transition zone, leading to a northward shift of the strong land–atmosphere coupling zone [2]. In Africa, land–atmosphere coupling was negatively correlated with the spatial and temporal distribution of soil moisture, with areas of lower soil moisture and periods of dry moisture exhibiting stronger land–atmosphere coupling. Spatial differences in the soil moisture lead to enhanced sensible heat fluxes in the dry zone and reduced sensible heat fluxes in the wet zone, which in turn trigger mesoscale circulation, and the upward branch of this circulation in the dry zone is an important factor in triggering deep convection [26]. In East Asia, land–atmosphere coupling is strong in north China, where soil moisture is low [35]; land–atmosphere coupling is strong in southwest China in spring, when soil moisture is low [36]; land–atmosphere coupling is strongly influenced by the snow cover in the dry season and by the soil moisture in the rainy season over Tibetan Plateau [37]; the land–atmosphere coupling degree is closely related to the state of surface vegetation in northwest China, and the improvement of vegetation state can improve the surface moisture condition, reduce the land surface evapotranspiration, and decrease the strength of land–atmosphere coupling [38].
The above studies mainly focused on the spatial distribution and temporal variation in the land–atmosphere CS and its relationship with soil moisture, and there is lack of research on the role of thermal factors on the land–atmosphere CS. Theoretically, the thermal properties also play a substantial role in the land–atmosphere coupling. The role of moisture and thermal factors in regulating the land–atmosphere coupling is similar to that of evapotranspiration, as it is regulated by moisture in water-scarce areas and by thermal and energy in water-sufficient areas [39].
Most of northern China makes up a dry-wet climate transitional zone, with dramatic spatial and temporal variations in water and heat characteristics. From the northwest to the southeast, moisture availability decreases, and energy availability increases, while the evapotranspiration control factor gradually changes from moisture to energy limitation [23]. This inevitably affects the spatial and temporal variation of regional land–atmosphere coupling. However, the spatial and temporal distribution of land–atmosphere coupling in north China’s climate transition zone remains unclear, and it is also unknown how hydrothermal factors affect the spatial-temporal variation in land–atmosphere coupling.
In this study, an evapotranspiration–precipitation coupling index proposed by Zeng et al. [6] was used to diagnose the land–atmosphere CS in the climate transitional zone of north China, and the main objectives were to (i) analyze the spatial distribution and temporal evolution characteristics of the land–atmosphere coupling and (ii) explain the impacts of moisture and thermal factors on the land–atmosphere CS. The results of the study are expected to enhance the understanding of land–atmosphere coupling mechanisms in the climate transitional zone of northern China.

2. Data and Methods

2.1. Study Area and Sites

The climate transitional zone of northern China (CTZNC) is selected as the study area in this work, with the spatial extent of the region between 33°N and 45°N and 100°E and 125°E. The geographical area and the climatic background are shown in the black box of Figure 1. The climate background is classified using the dryness index defined by the United Nations Environment Programme:
AI = P/PET,
where, AI is the dryness index, P is the average annual precipitation in mm, and PET is the average annual potential evapotranspiration in mm. AI < 0.05 is classified as a hyper-arid zone, 0.05 < AI < 0.2 as an arid zone, 0.2 < AI < 0.5 as semi-arid zone, 0.5 < AI < 0.65 as a sub-humid zone, and AI > 0.65 as a humid zone. As shown in Figure 1, the study region mainly includes arid, semi-arid, sub-humid, and humid climate. It is not only a climate transition region but also a typical ecological transition zone, as well as a major activity area of the northern edge of the East Asian summer monsoon.
Four sites are selected for study, the underlying surfaces of which are either grassland or cropland. The locations of the sites are shown in Figure 1, and the climate and environmental background are given in Table 1.

2.2. Data

We selected a gridded evapotranspiration dataset—Derived Optimal Linear Combination Evapotranspiration (DOLCE) [40]. DOLCE is a hybrid evapotranspiration dataset under observational constraints, which merges four available global ET datasets: ERA5-land, FLUXCOM METEO+RS, GLEAM v3.5a, and GLEAM v3.5b. The contribution of each dataset to DOLCE ET is based on its ability to match field observations as well as its dependence to the other parent datasets. The latest version of DOLCE-ET V3.0 also provides time-varying estimates of its uncertainty errors. DOLCE-ET V3.0 has a temporal resolution of months and a spatial resolution of 0.25°. It spans the years 1980–2018 and covers the global land surface.
We use the China Meteorological Forcing Dataset (CMFD) for precipitation and near-surface air temperature data [41]. CMFD uses Princeton reanalysis data, GLDAS (global land data assimilation system) data, GEWEX-SRB (the global energy and water exchanges) radiation data, and tropical rainfall measuring mission precipitation data as background fields, and merges the conventional meteorological observation data of the China Meteorological Administration to produce a regional high spatial and temporal resolution dataset. The dataset has a temporal resolution of months and a spatial resolution of 0.1°, with a spatial range of 60–140°E and 15–55°N.
For soil moisture, we selected the Climate Change Initiative (CCI) data set of the European Space Agency (ESA) [42]. The CCI SM v04.7 product consists of three sets of surface soil moisture data: active products, passive products, and combined products. The “active product” and “passive product” are generated by merging the soil moisture outputs of the scatterometer and radiometer, respectively; the “combined product” is a hybrid product based on the first two data sets, and used in this study. The dataset has a temporal resolution of a day and a spatial resolution of 0.25°, and spans the period from November 1978 to December 2019. Site observations was used to validate CCI data.
Boundary layer heights used ECMWF monthly averaged ERA5 data with a spatial resolution of 0.25°. All data were time-scaled to months and interpolated to 0.25° × 0.25° spatial resolution.

2.3. Methods

2.3.1. Evapotranspiration-Precipitation Coupling Strength

An evapotranspiration–precipitation coupling index proposed by Zeng et al. [6] was employed to diagnose the strength of land–atmosphere coupling. Considering that surface state variables always affect the atmospheric state via near-surface fluxes, evapotranspiration was selected as the surface impact factor. In the index, the covariance of evapotranspiration and precipitation reflects the synchronous change in evapotranspiration and precipitation, and the ratio of the covariance to the precipitation variance reflects the contribution of evapotranspiration changes to total precipitation changes. This method has a solid physical mechanism and is widely used in diagnostic studies of land–atmosphere CS. The equation for its calculation is as follows:
Γ = i = 1 N P i E i i N P i 2
This can also be rewritten as:
Γ = r P , E σ E σ P ,
where Γ is the land–atmosphere CS, P i and E i are anomalies of precipitation and evapotranspiration, respectively, N is total number of months or years, r P , E is correlation coefficient of precipitation and evapotranspiration, σ E and σ P are the standard deviation of evapotranspiration and precipitation, respectively. This index reflects the proportion of precipitation changes caused by evapotranspiration in total precipitation using the relative magnitude of the covariance between precipitation and evapotranspiration and the variance of precipitation. The more consistent the pace of change between the two variables, and the larger the magnitude of change, and the stronger the land–atmosphere coupling. The positive and negative values can also reflect the respective coupling between evapotranspiration and precipitation.
This method examines the ET–P relationship statistically and does not reflect the specific physical processes and influence mechanisms. To identify the significant strong CS areas, a correlation-coefficient significance test can be used to test the significance of the CS [7]. i.e., the ET–P coupling is deemed to be significant if the p value of the correlation coefficient is less than 0.05.
The evapotranspiration–precipitation CS was calculated using monthly or yearly ET and P data. The bulk CS in Figure 4 was calculated using data of all months during the study period. The seasonal CS in Figure 5 was calculated using monthly data in each of the four seasons. The decadal CS in Figure 6 was calculated by using yearly data in each decade. The yearly CS was calculated using monthly data of each year, and subsequently the yearly CS was used to calculate the linear trend of CS in Figure 7. The warm season CS was calculated using monthly data of April-September.

2.3.2. Lifting Condensation Level

The lifting Condensation Level (LCL) can be calculated by:
L C L 125 ( T 2 m D 2 m )
where T 2 m and D 2 m are 2-m air temperature and dew point temperature, respectively.

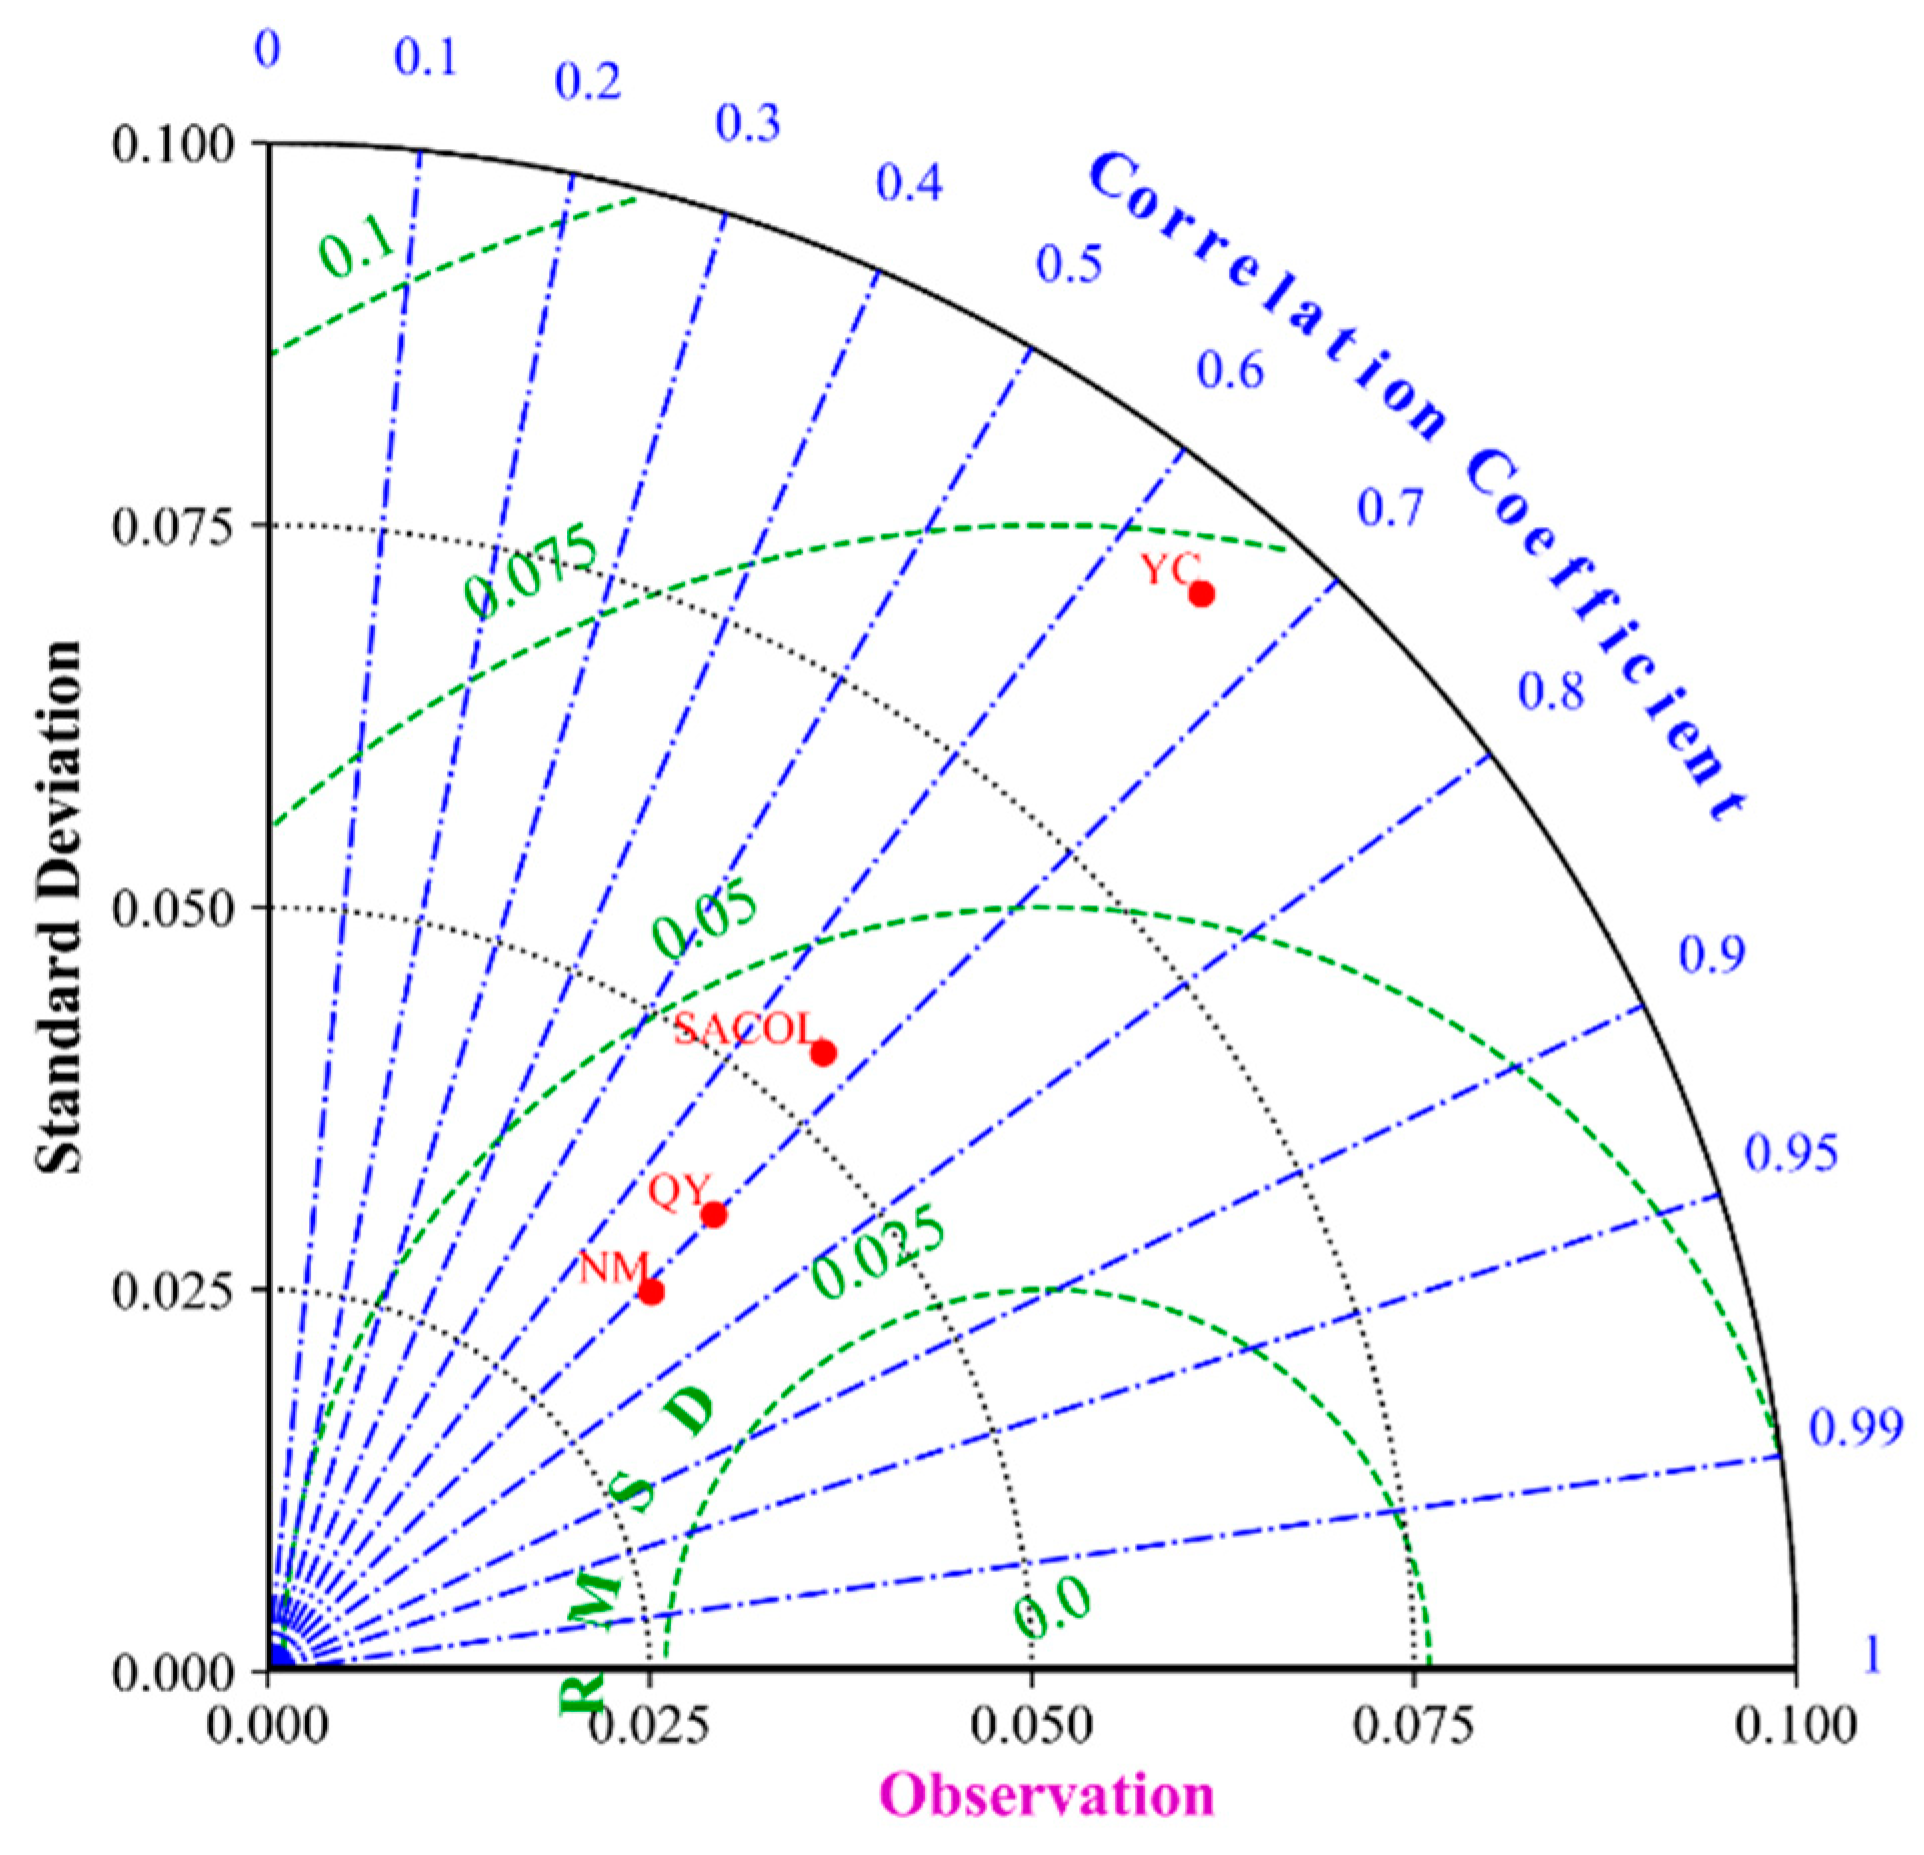
2.4. Validation of CCI Soil Moisture

ESA CCI soil moisture data were validated using observations at four sites in the study area in 2007. Figure 2 shows that the correlation coefficients between CCI and observations are 0.71, 0.69, 0.66, and 0.65 for NM, QY, SACOL, and YC, respectively. The RMSE values for the four sites are 0.033, 0.041, 0.043, and 0.072 m3/m3, respectively. YC station, in a semi-humid region with higher soil moisture, has a larger root mean squared error (RMSE) compared to other sites. This is consistent with the results of other studies [43,44], and CCI has a relatively high accuracy in the climate transitional zone of northern China with a correlation coefficient of about 0.7. Therefore, CCI soil moisture is applicable in the climate transitional zone of northern China.

3. Results

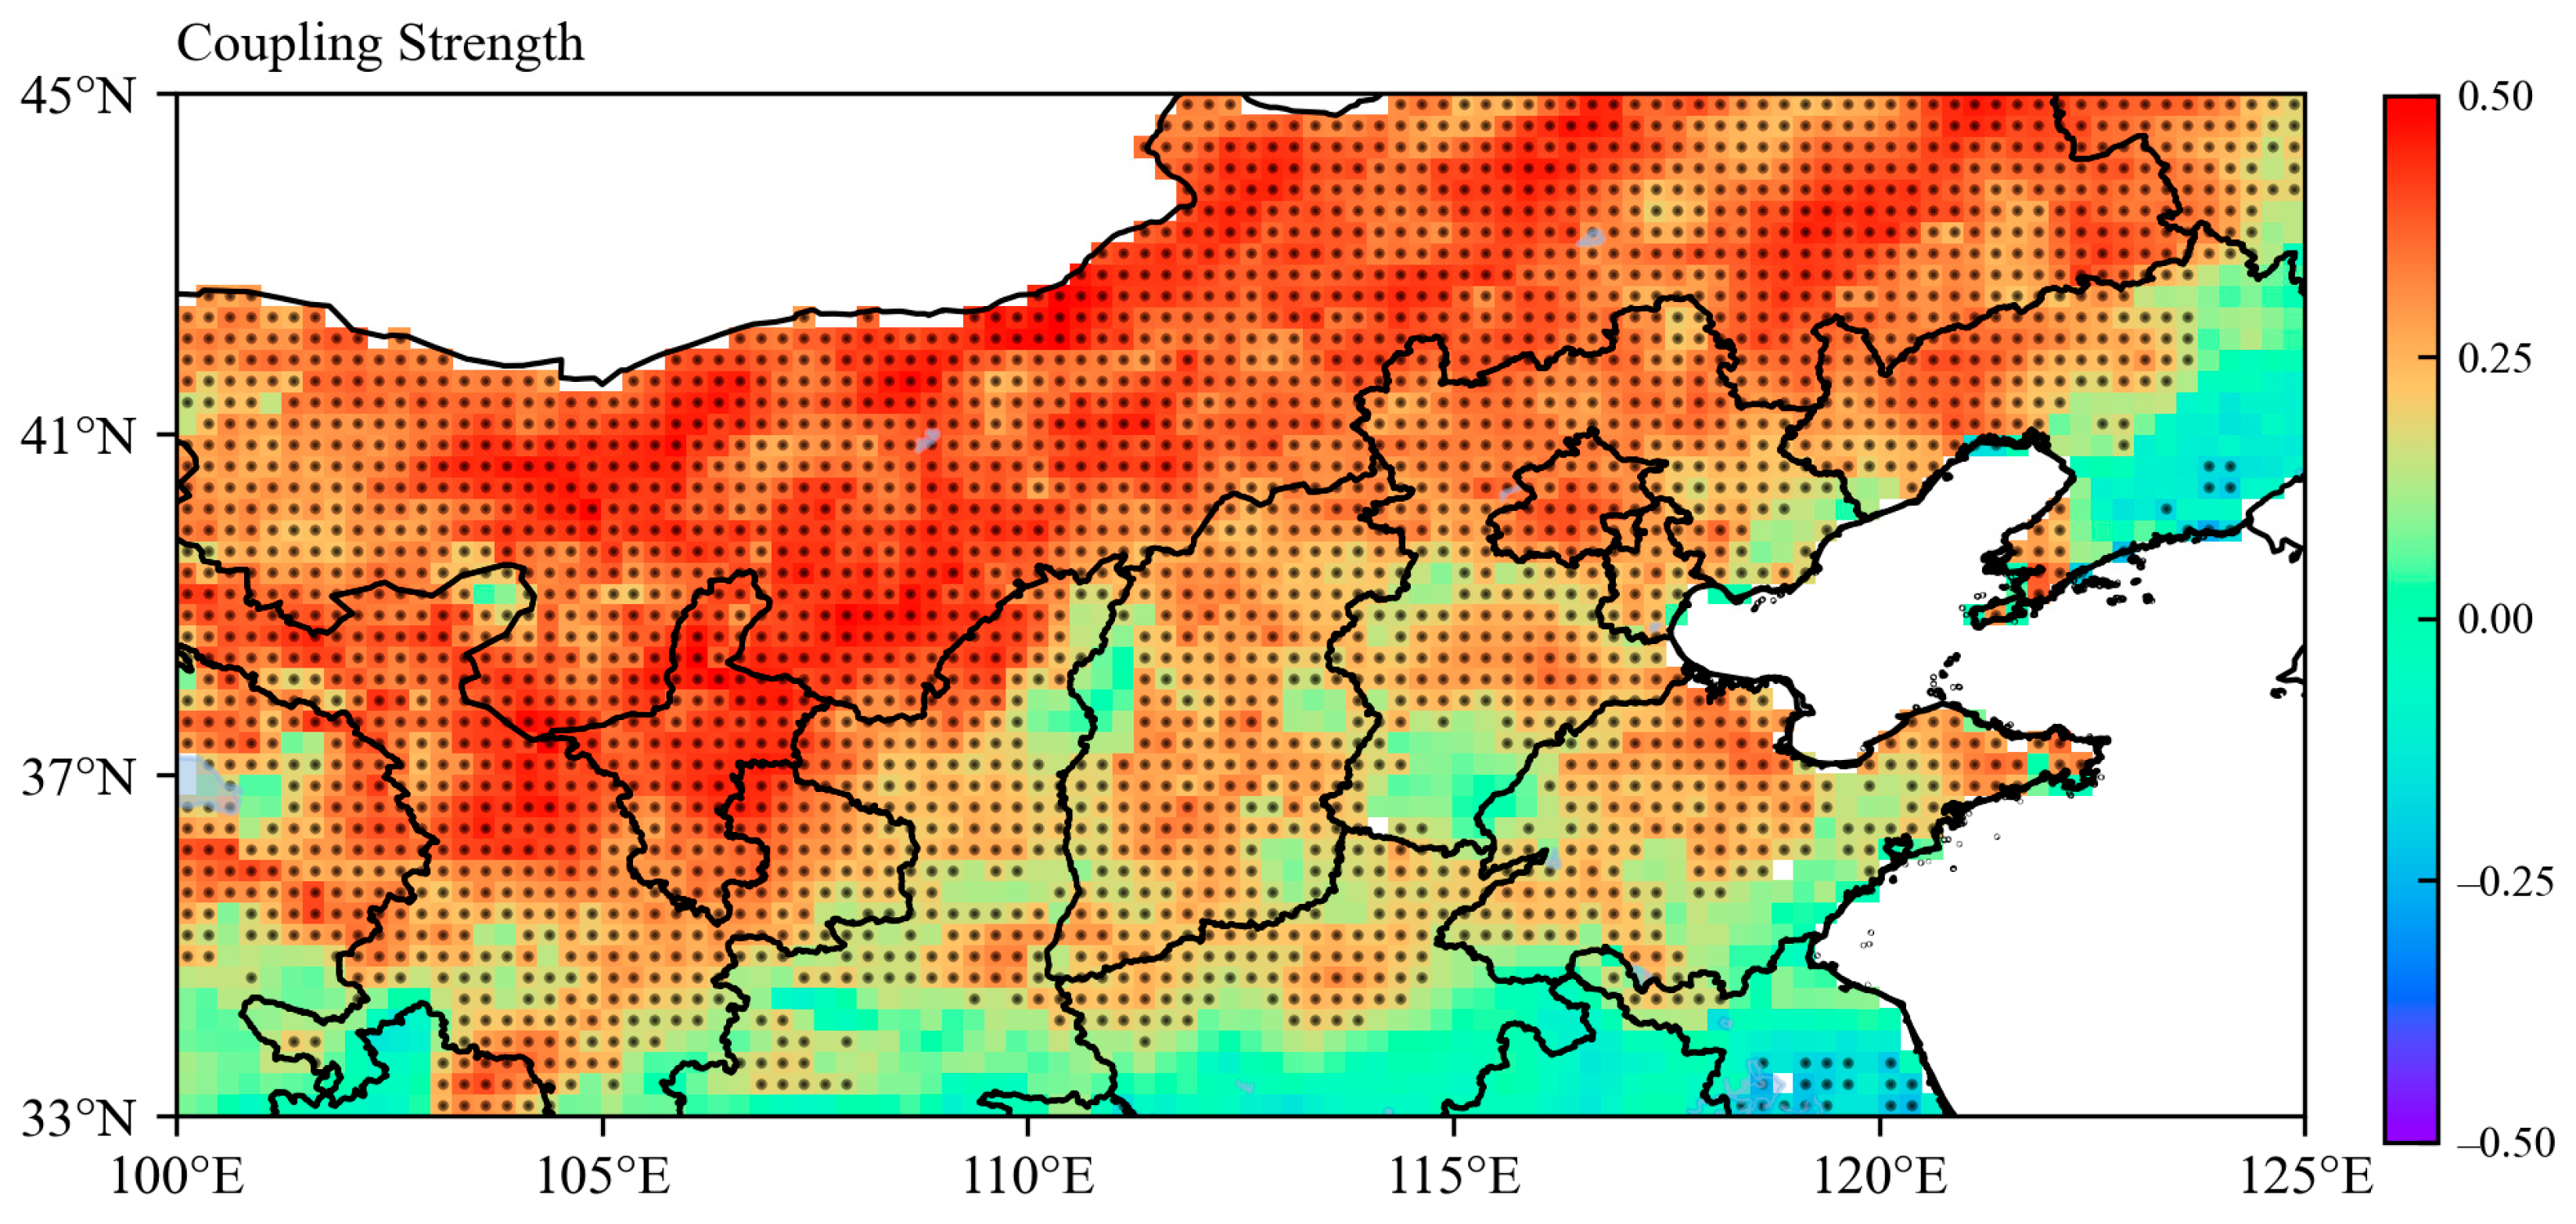
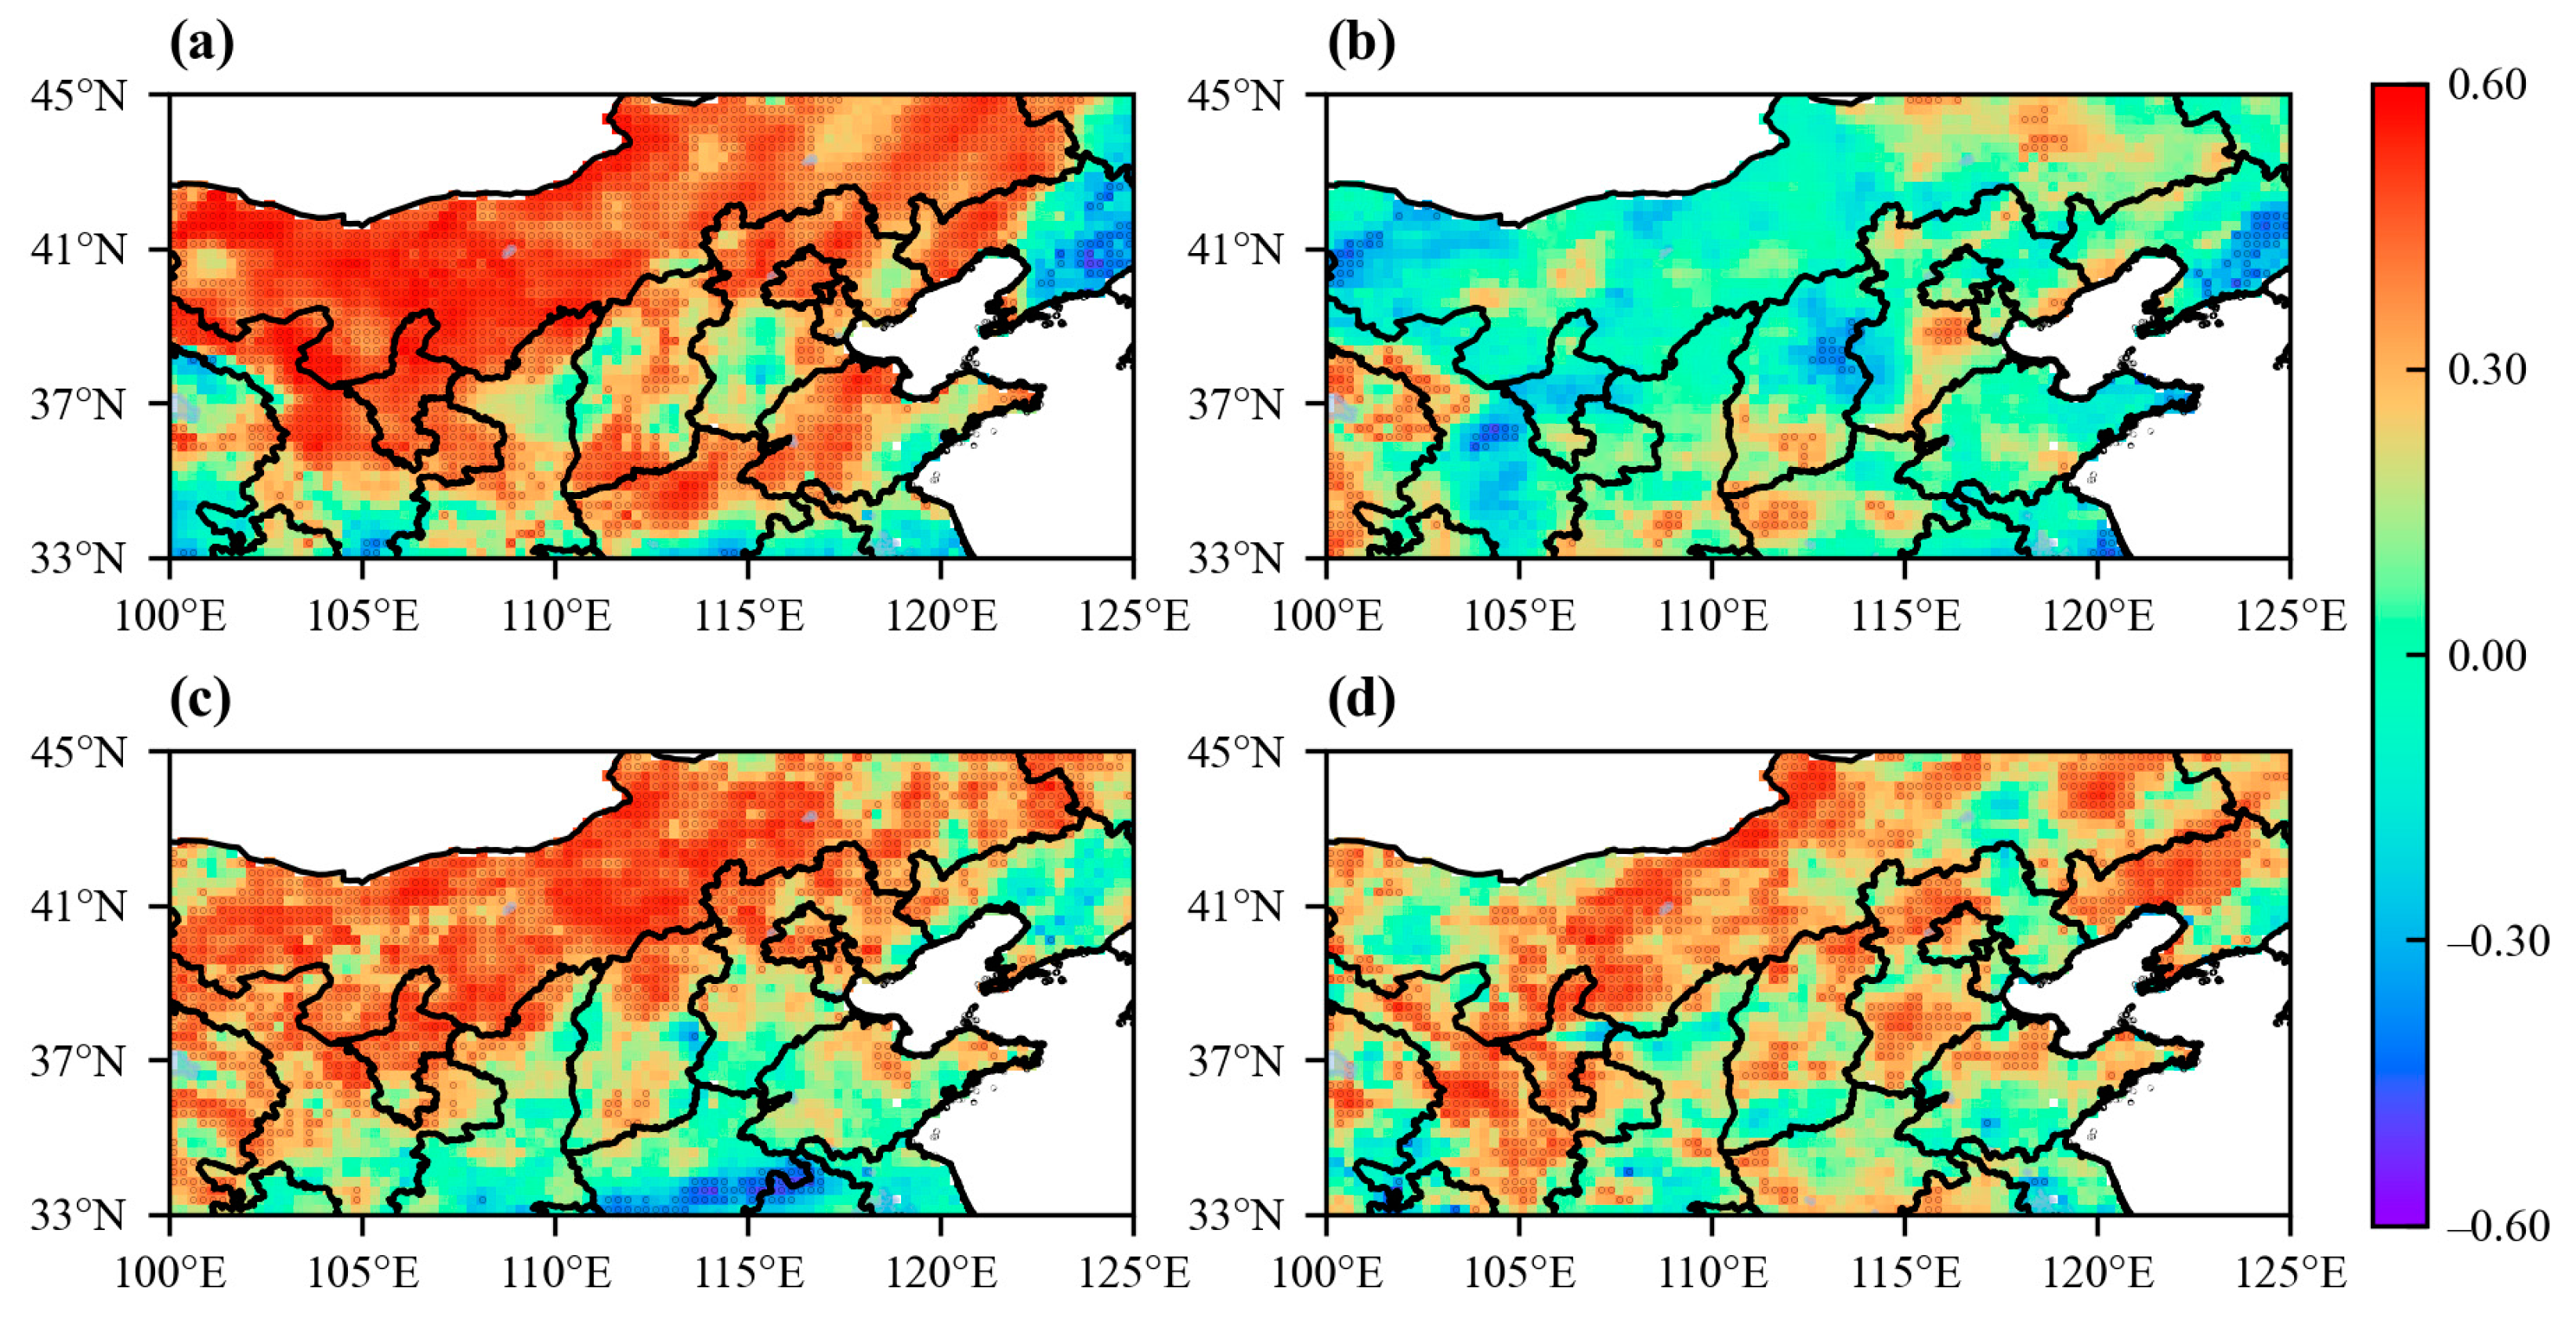
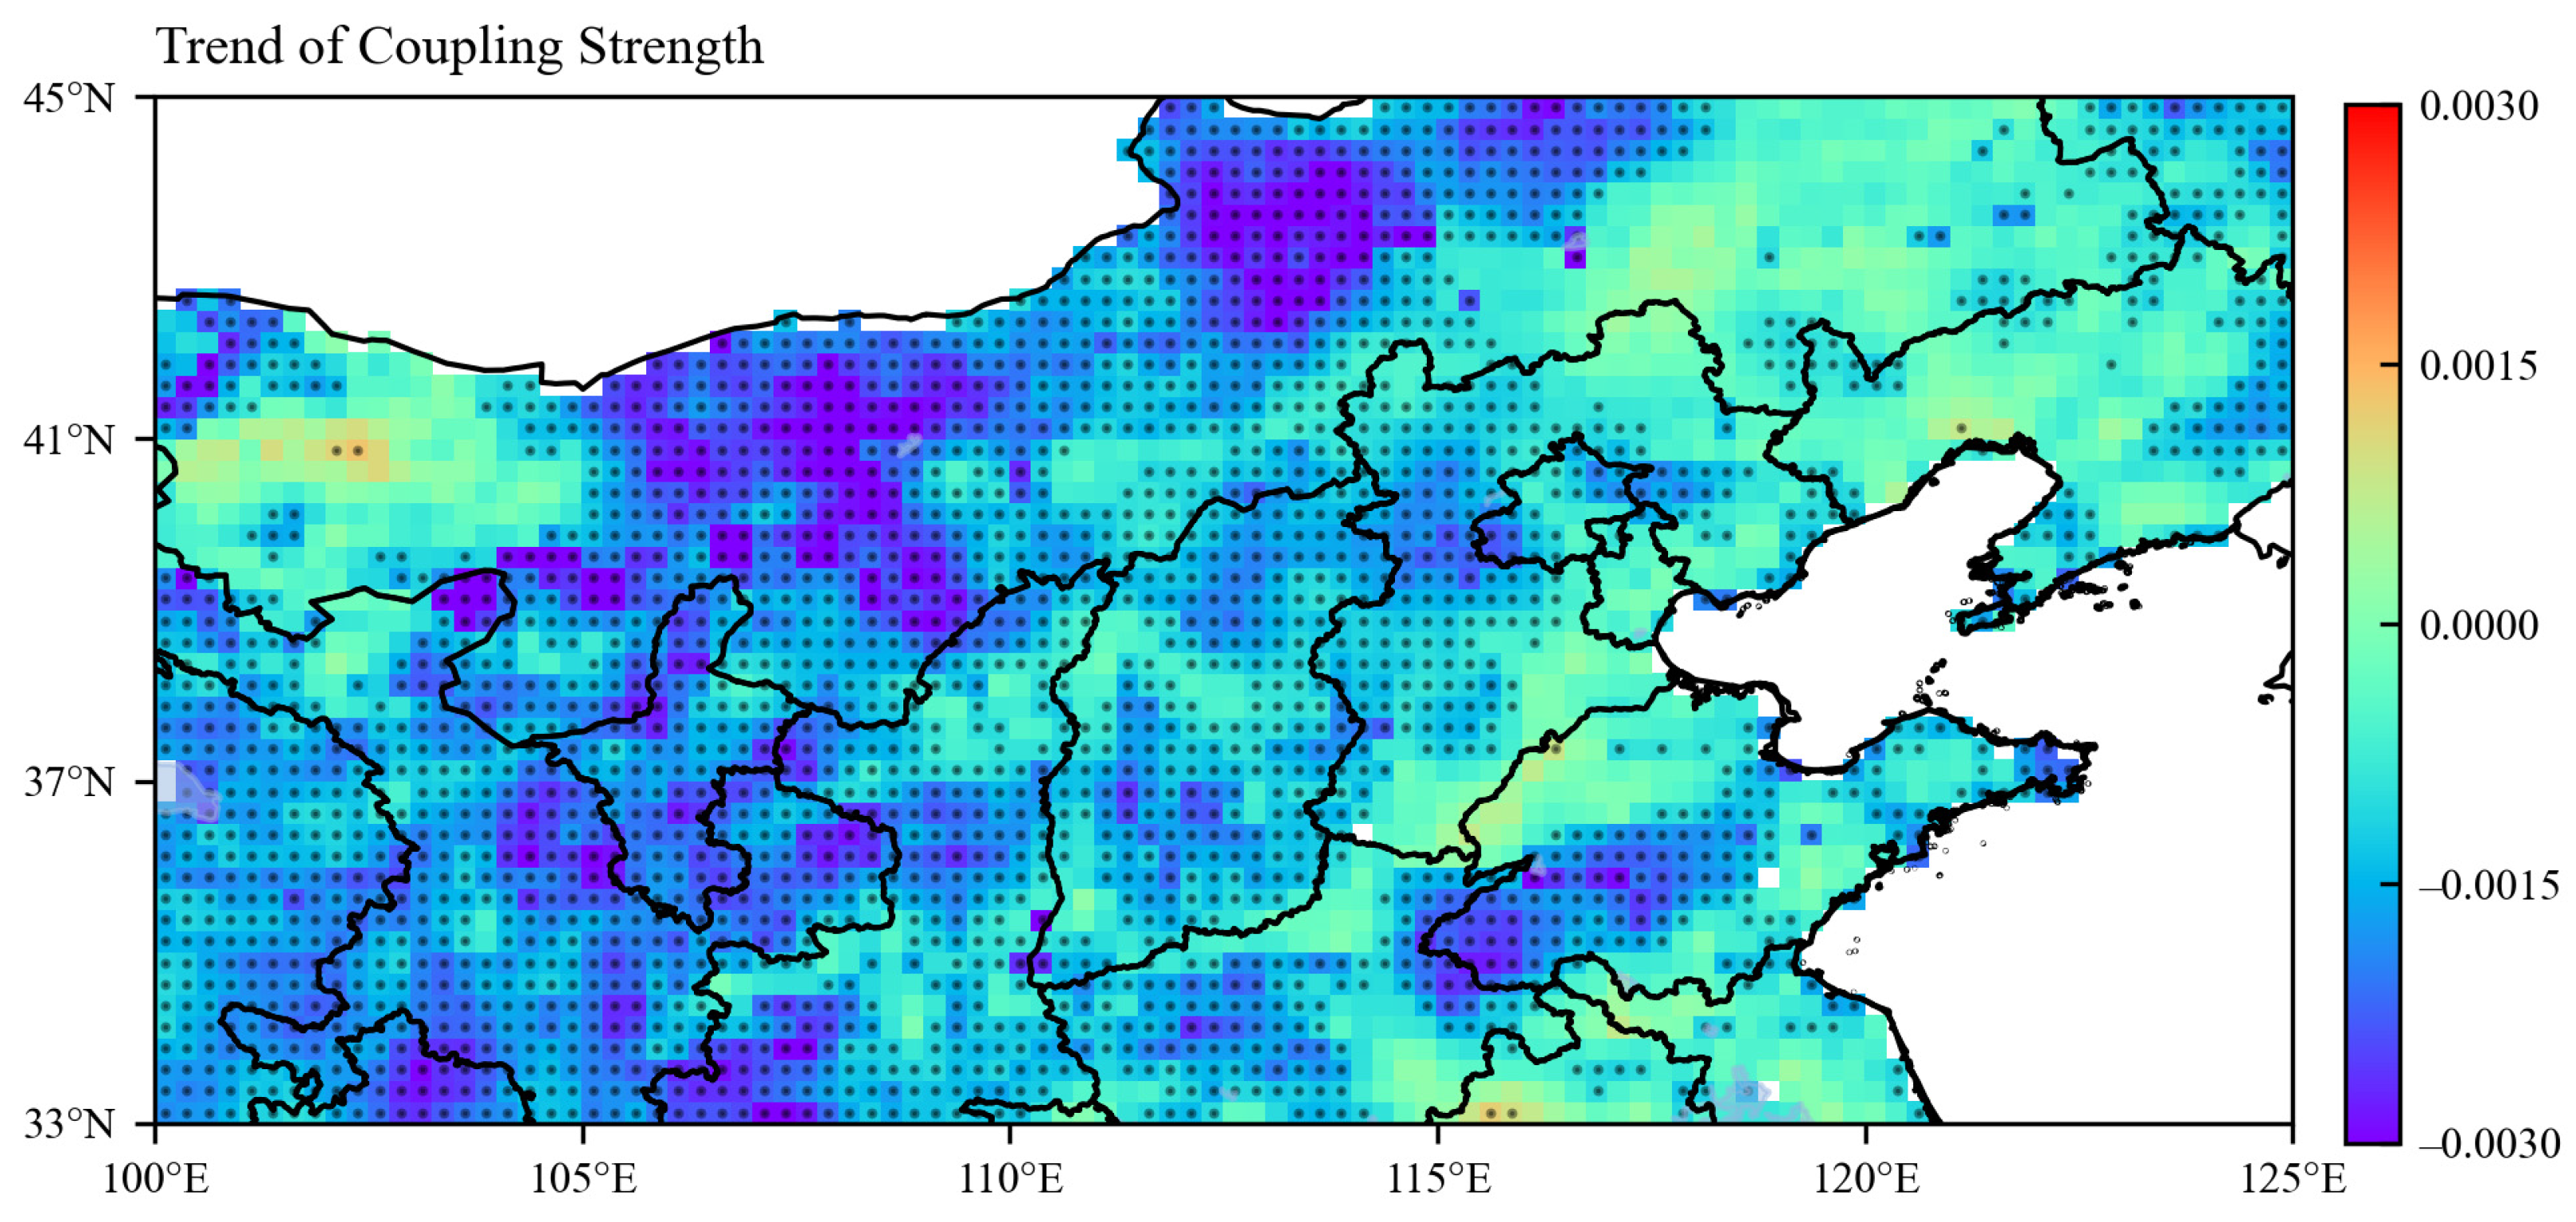
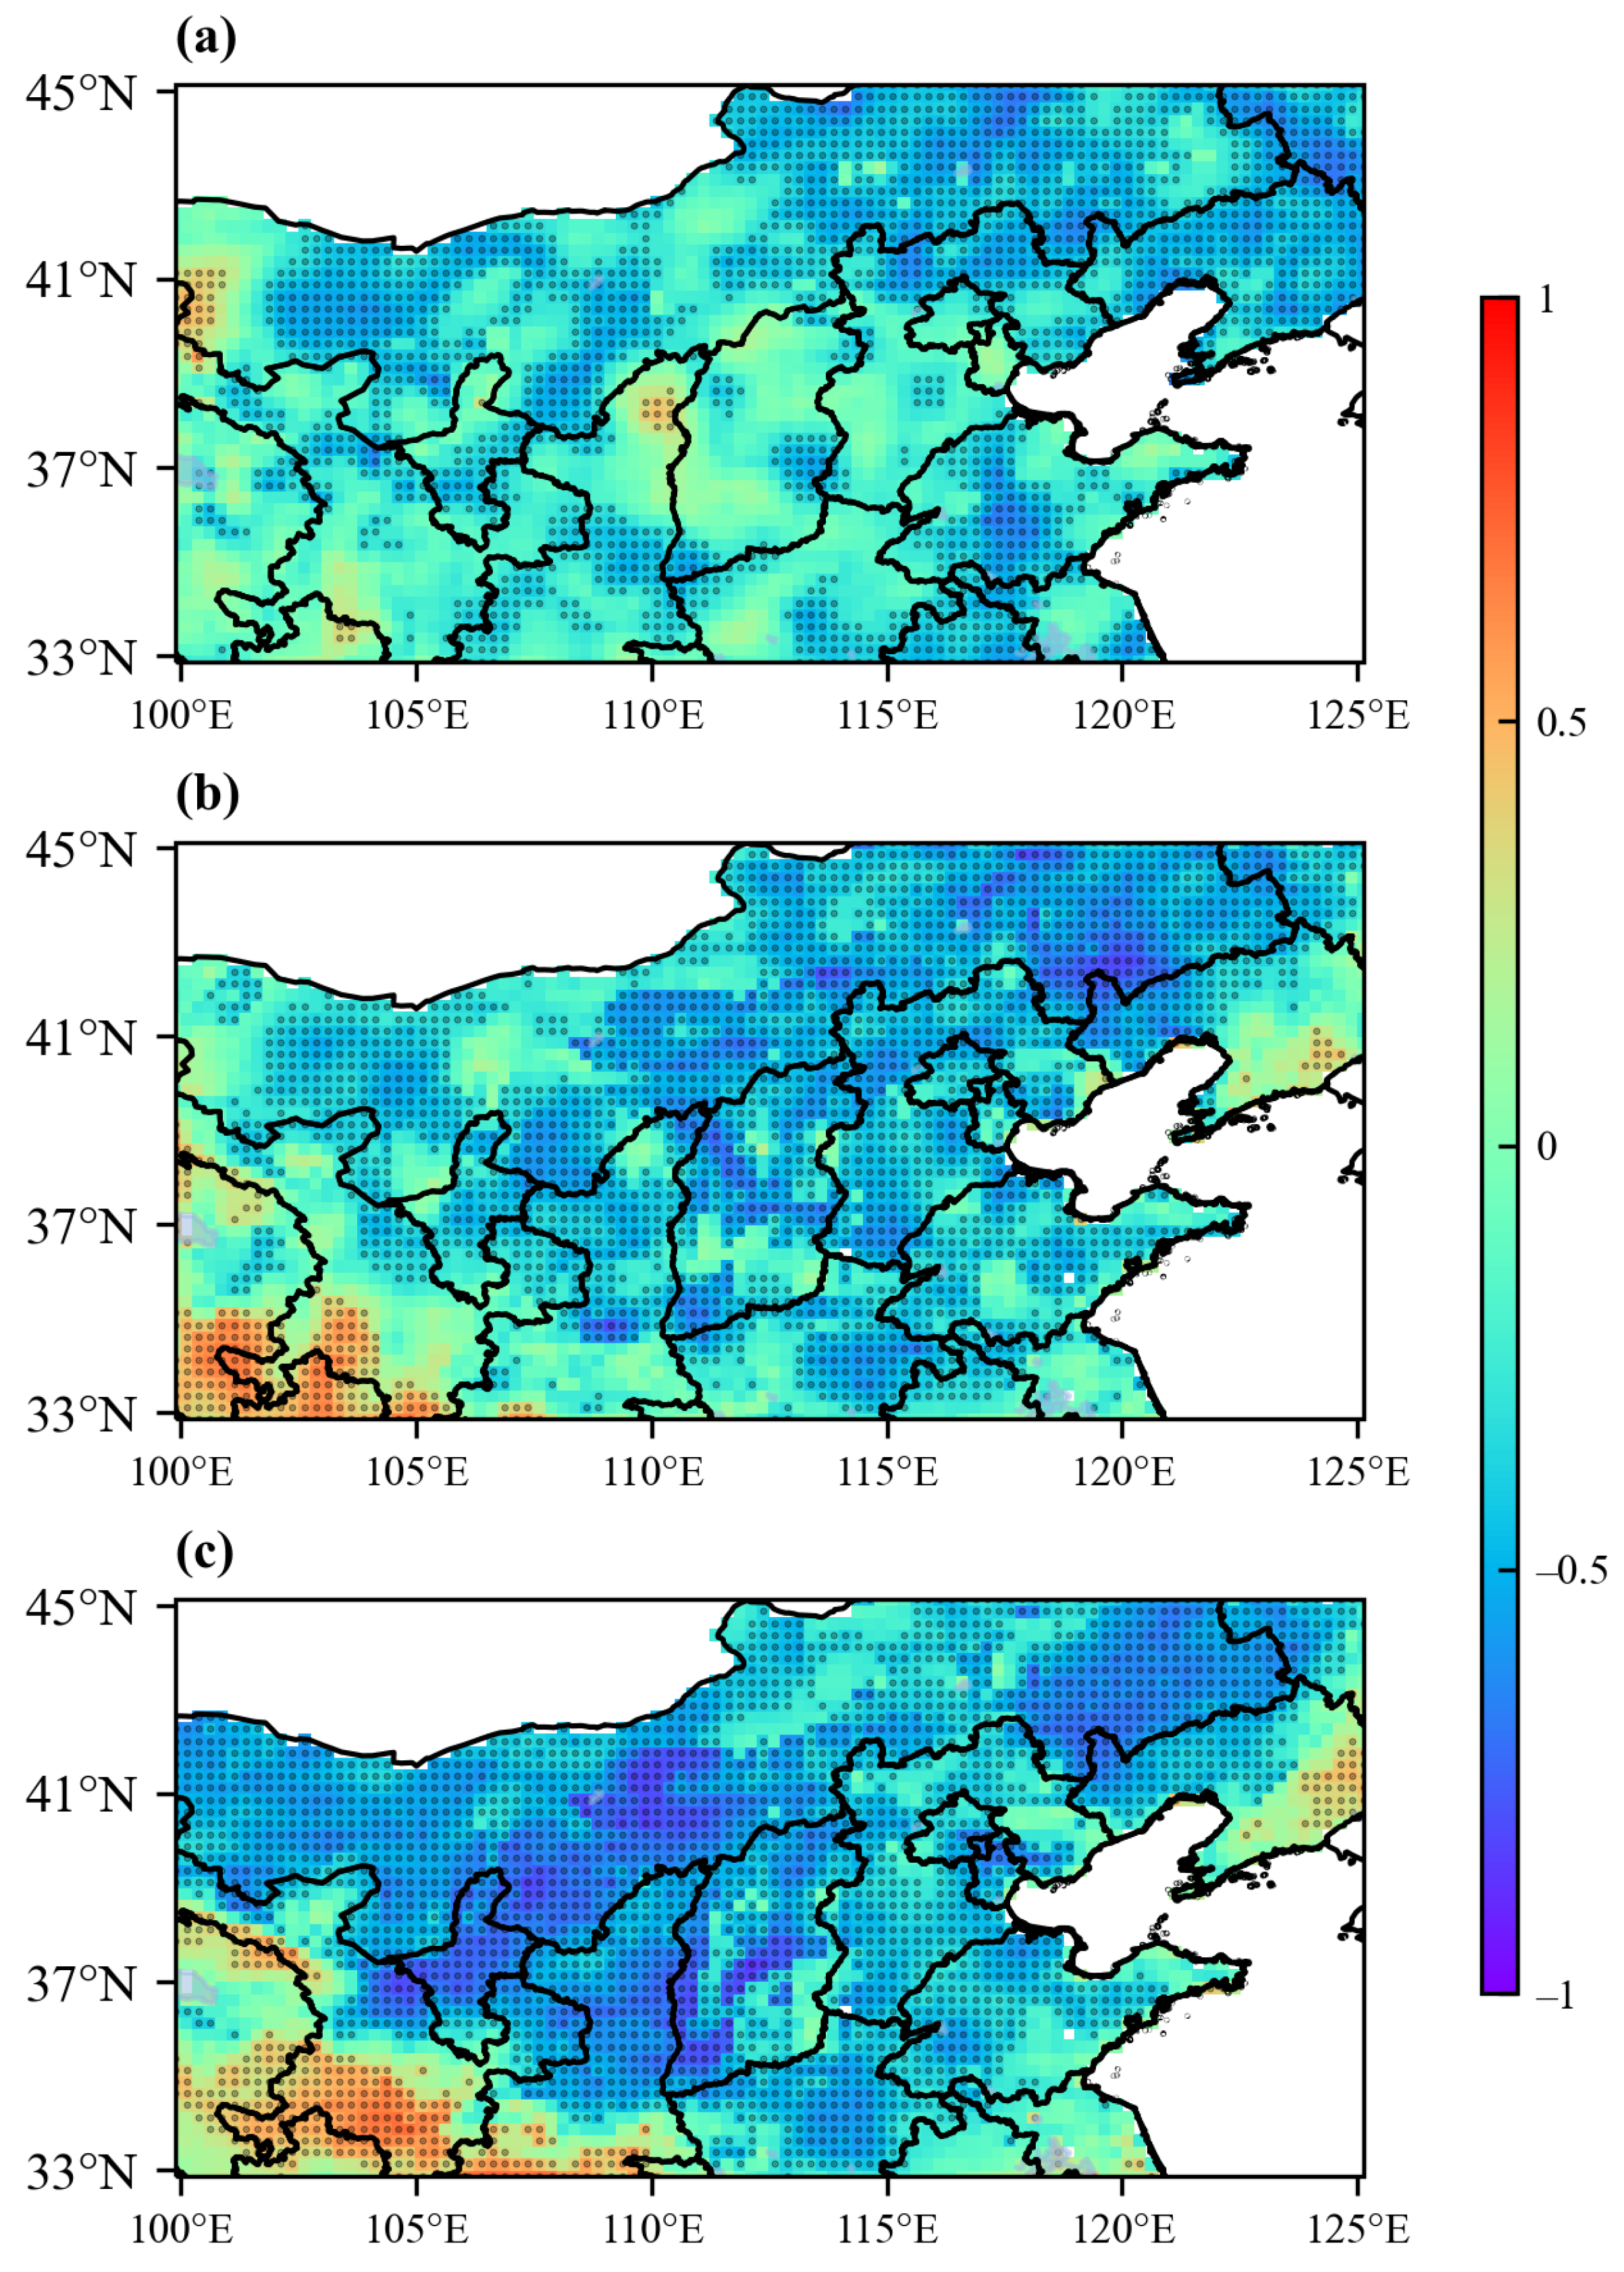
3.1. Spatial and Temporal Variation of Evapotranspiration-Precipitation Coupling Strength

To evaluate the spatial pattern of evapotranspiration-precipitation coupling over the climate transitional zone of northern China, the spatial distribution of evapotranspiration, precipitation, and their variations are shown in Figure 3. Precipitation gradually transitions from more than 800 mm in the southeast to less than 100 mm in the northwest. The standard deviation of precipitation has similar spatial distribution to annual precipitation, decreasing from southeast to northwest. This spatial distribution of precipitation is consistent with the situation of the study area of north China in the transition zone from the East Asian summer monsoon-influenced zone to the non-monsoon zone, where the monsoon precipitation gradually increases from the non-monsoon zone to the monsoon zone. Similarly, evapotranspiration likewise decreases from the southeast to northwest, with a maximum of about 600 mm in the southeast and a minimum of a few tens of millimeters in the northwest. The spatial distribution of evapotranspiration is similar to that of precipitation, indicating a close relationship between evapotranspiration and precipitation. Furthermore, the distribution of standard deviation of evapotranspiration is more complicated, which is larger in the middle region of transition area and smaller in wet and dry areas.
The results from the above analysis highlight a general consistency of the spatial distribution of mean precipitation and evapotranspiration. This suggests a close relationship between precipitation and evapotranspiration in the study region. Furthermore, an index of evapotranspiration–precipitation CS was applied to assessing the spatial and temporal variation in CS in the climate transitional zone of northern China. The spatial pattern of CS shows sharp transition features in the climate transitional zone of northern China (Figure 4), decreasing from the northwest to southeast. The northwest half of the study region is a strong positive coupling area, with CS between 0.2 and 0.6 (passing 0.05 significance test), while the southeast and northeast horn depict negative coupling zone, with CS ranging from –0.2 to –0.5 (passing 0.05 significance test). The middle region of the two regions marks the transition zone from positive to negative coupling, and CS is relatively small.
Due to the temporal changes in climate variables, land–atmosphere couplings also vary with time. Despite having a similar spatial pattern in all seasons, the CS is strongest in spring, when it is significantly larger than the other seasons, followed by summer, and the smallest coupling in autumn and winter (Figure 5). This indicates that the contribution of surface evapotranspiration to precipitation occurs mainly in spring.
On an interdecadal scale (Figure 6), the CS was highest in the 1980s and lowest in the 1990s. The spatial distribution of CS with stronger coupling in the 1980s and 2000s is similar to the distribution of annual coupling; however, it shows a more heterogeneous spatial pattern in the 2010s and 1990s.
The trend of annual CS was examined for the climate transitional zone of northern China for the period 1980–2018 (Figure 7). The CS showed a significant decreasing trend in the central and western parts. Except for a small area showing an increase trend in the northwest corner, the overall trend of CS gradually shifts from significant negative in the west to insignificant positive in the east. The northwest region has the strongest decreasing trend of CS, about –0.003/year, whereas the southeast region has a weak increasing trend of CS, with a rate of about 0.001/year.

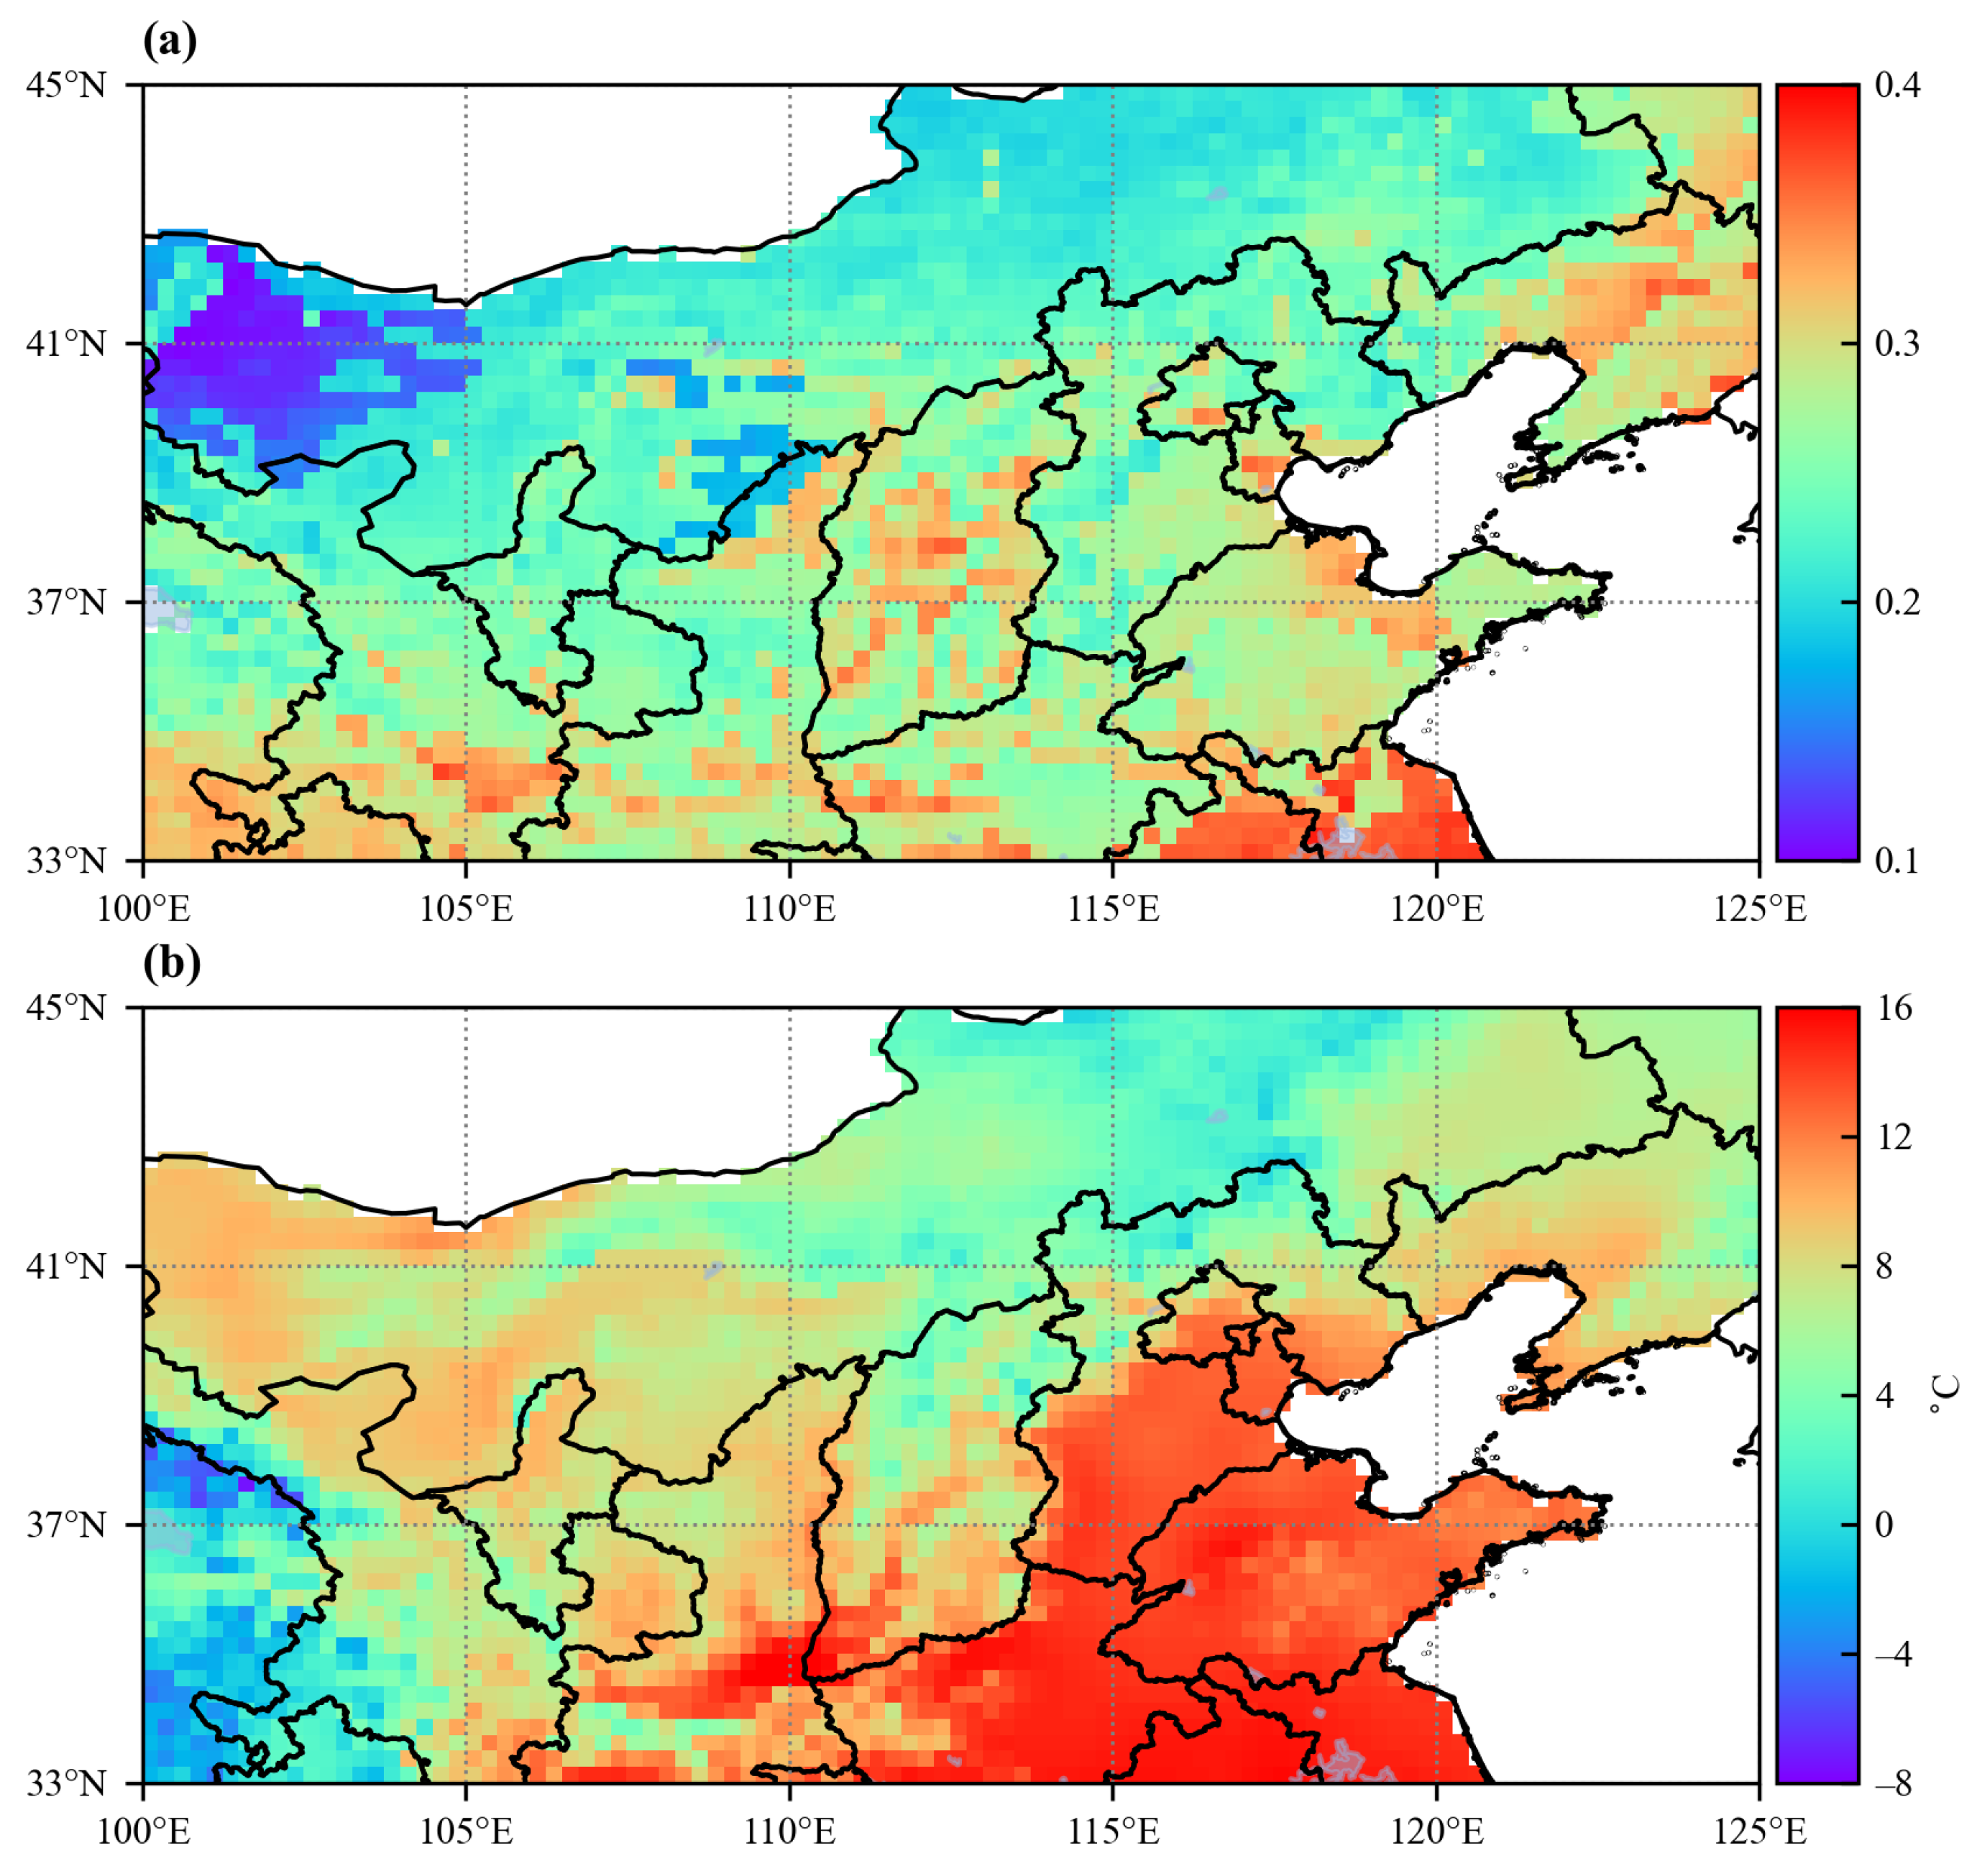
3.2. Spatial and Temporal Variation of Evapotranspiration-Precipitation Coupling in Relation to Moisture and Thermal Conditions

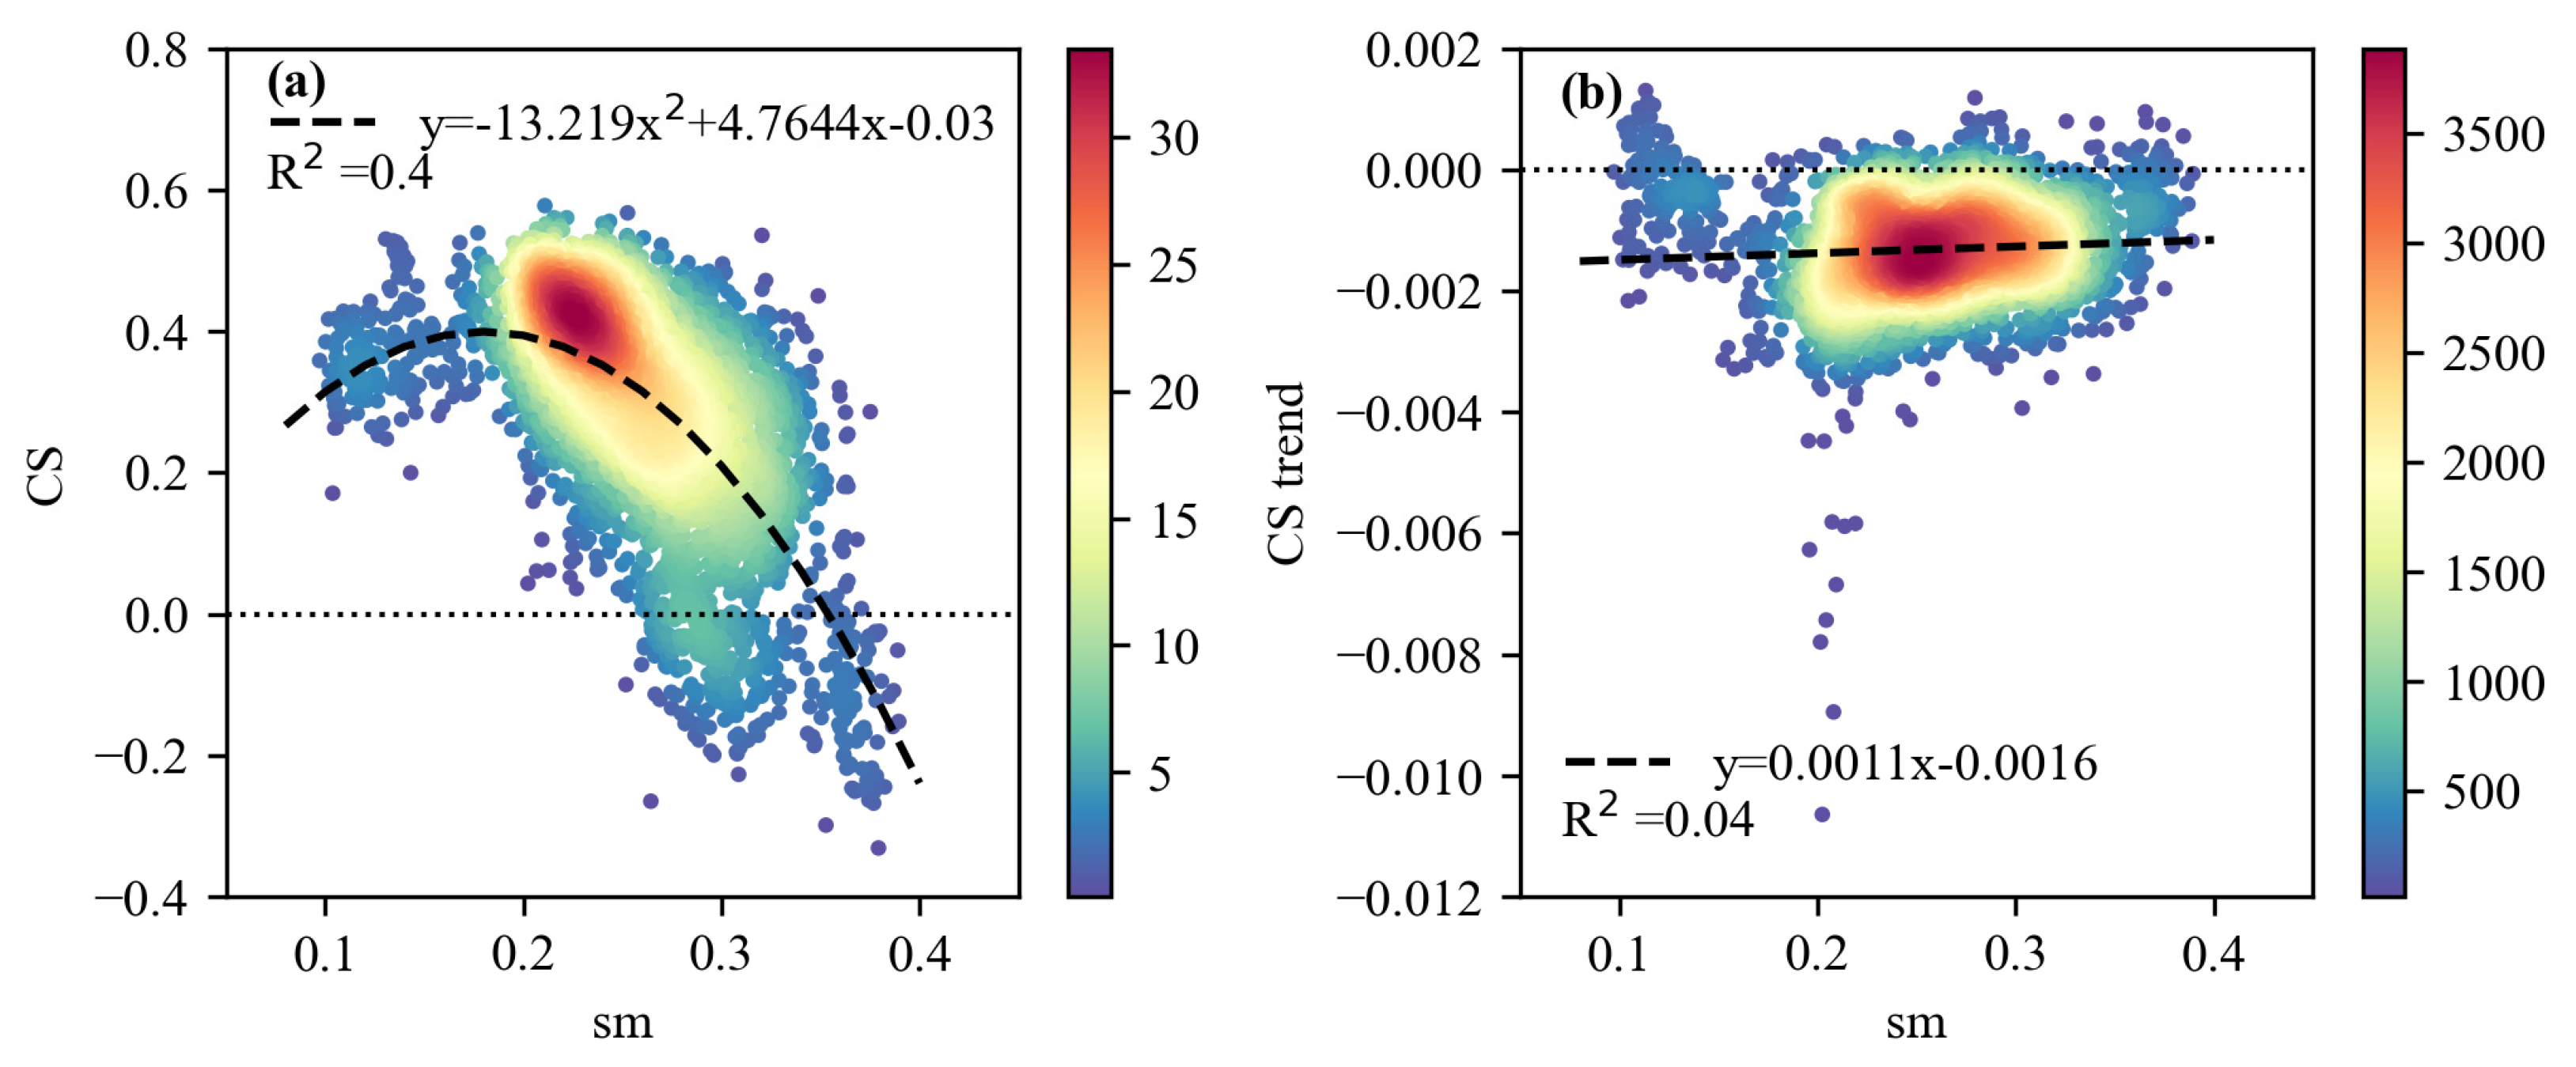
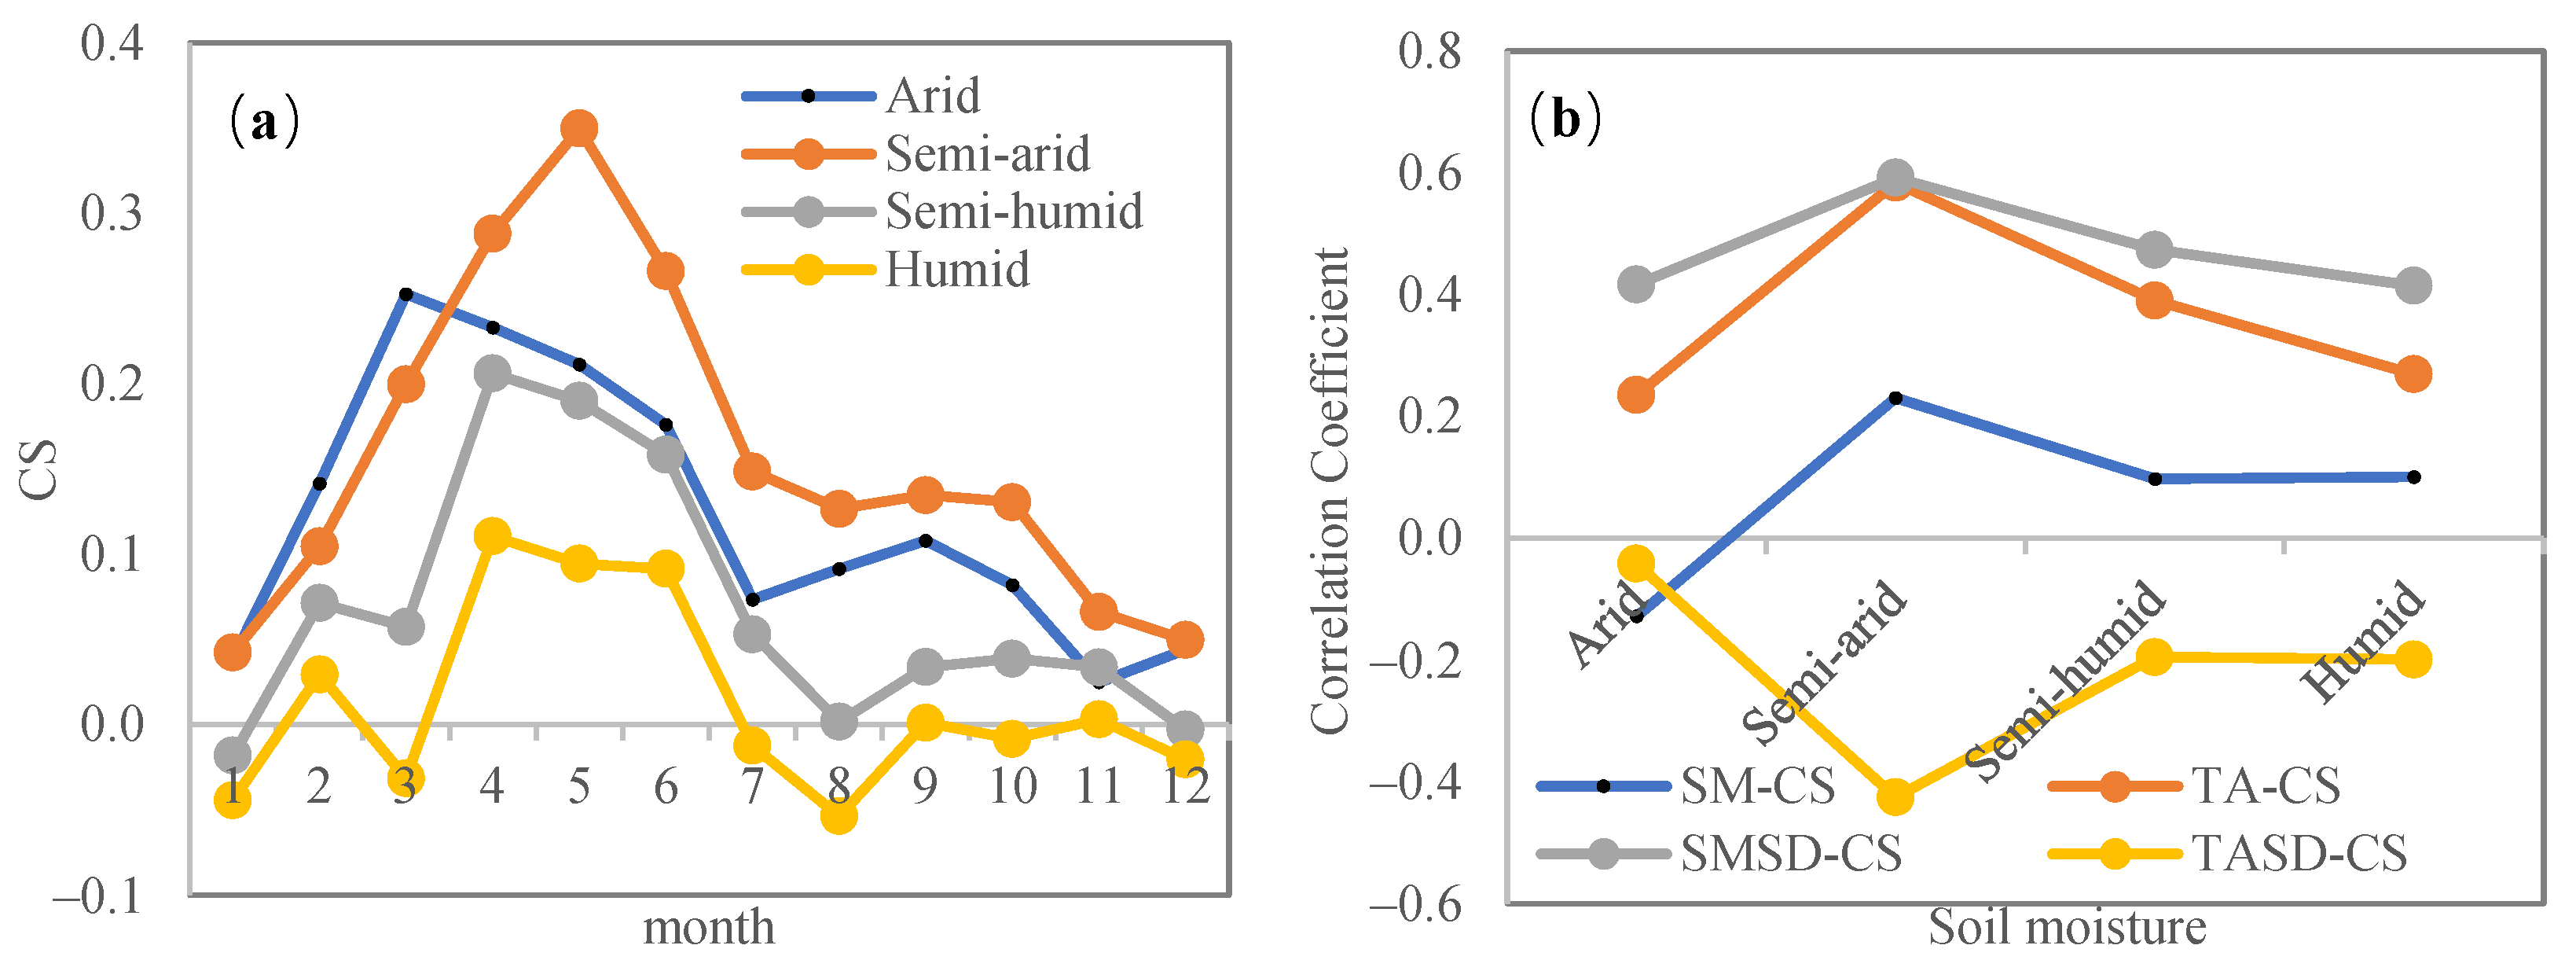
3.2.1. Spatial Variation of CS in Relation to Spatial Moisture and Thermal Conditions

The CS has large spatial differences and displays transitional characteristics in the climate transitional zone of northern China, which is closely related to the fact that the region is in a climatic transition zone with large spatial gradients of hydrothermal conditions in the region. Soil moisture and air temperature can aptly reflect hydrothermal conditions in the study region. Therefore, this section analyzes the dependences of CS on soil moisture and air temperature.
First, the spatial patterns of climatological mean soil moisture and air temperature were analyzed for the study region. Soil moisture has large spatial variability in the climate transitional zone of northern China, gradually increasing from 0.1 in the northwest to 0.4 in the southeast (Figure 8a). From the northwest to southeast, the climate is arid, semi-arid, sub-humid, and humid. Most of the study area belongs to a semi-arid or sub-humid climate, with only the northwest and southeast corners being arid and humid zones. Moreover, temperature has a similar spatial pattern as soil moisture (Figure 8b), increasing from the northwest of −8 °C to southeast of 16 °C in the study area. Notably, the southeast area was generally warmer with a lower gradient. In total, the soil moisture and air temperature have a general reversed spatial pattern compared to CS, and the spatial pattern of soil moisture is closer to that of CS in the study area.
To examine the influence of soil moisture on spatial CS, Figure 9a displays the relationship between CS and climatological soil moisture. Generally, CS increases slightly and is maintained at a strong level when the soil moisture is below 0.2, and CS decreases gradually with increase in soil moisture when the soil moisture is larger than 0.2 (Figure 8a). In areas where the soil moisture is greater than 0.35, the CS is negative; in areas where the soil moisture is below 0.25, the CS is positive; in areas where the soil moisture is between 0.25 and 0.35, CS gradually transits from negative to positive. The determination coefficient R2 of 0.4 indicates that variation in soil moisture explains 40% of the variation in CS. Figure 9b illustrates the relationship between the CS trend and soil moisture. The relationship between the CS trend and soil moisture is roughly opposite to that of between soil moisture and CS. In the range of soil moisture below 0.2, the CS trend decreases with increasing soil moisture; while in the range of soil moisture larger than 0.2, the CS trend increases with increasing soil moisture. Further, a negative CS trend occurs at moderate soil moisture, while a positive CS trend occurs at very dry or wet soil moisture.
Similarly, the relationships between CS, CS trend, and air temperature were analyzed to examine the influence of air temperature on the spatial distribution of CS and the CS trend. Figure 10a illustrates that CS logarithmically decreases with increasing temperature. CS is mainly positive below zero degrees, and both positive and negative coupling exist above zero degree. The percentage of negative coupling increases as the temperature rises. The determination coefficient R2 of 0.4 indicates that Ta only explains 26% of the variation in CS. In the contrary, the CS trend increases with increasing temperature (Figure 10b). The CS trend is negative below zero degrees, and the proportion of positive trend increases with increasing temperature. Clearly, the relationship between CS and temperature shows a significantly wider spread than that between CS and soil moisture. The spatial variation in soil moisture explains more of the spatial variation in CS compared to the spatial variation in TA. Therefore, the climatological soil moisture plays a more dominant role in determining the spatial pattern of CS compared to the temperature.

3.2.2. Temporal Variation of CS in Relation to Hydrothermal Conditions

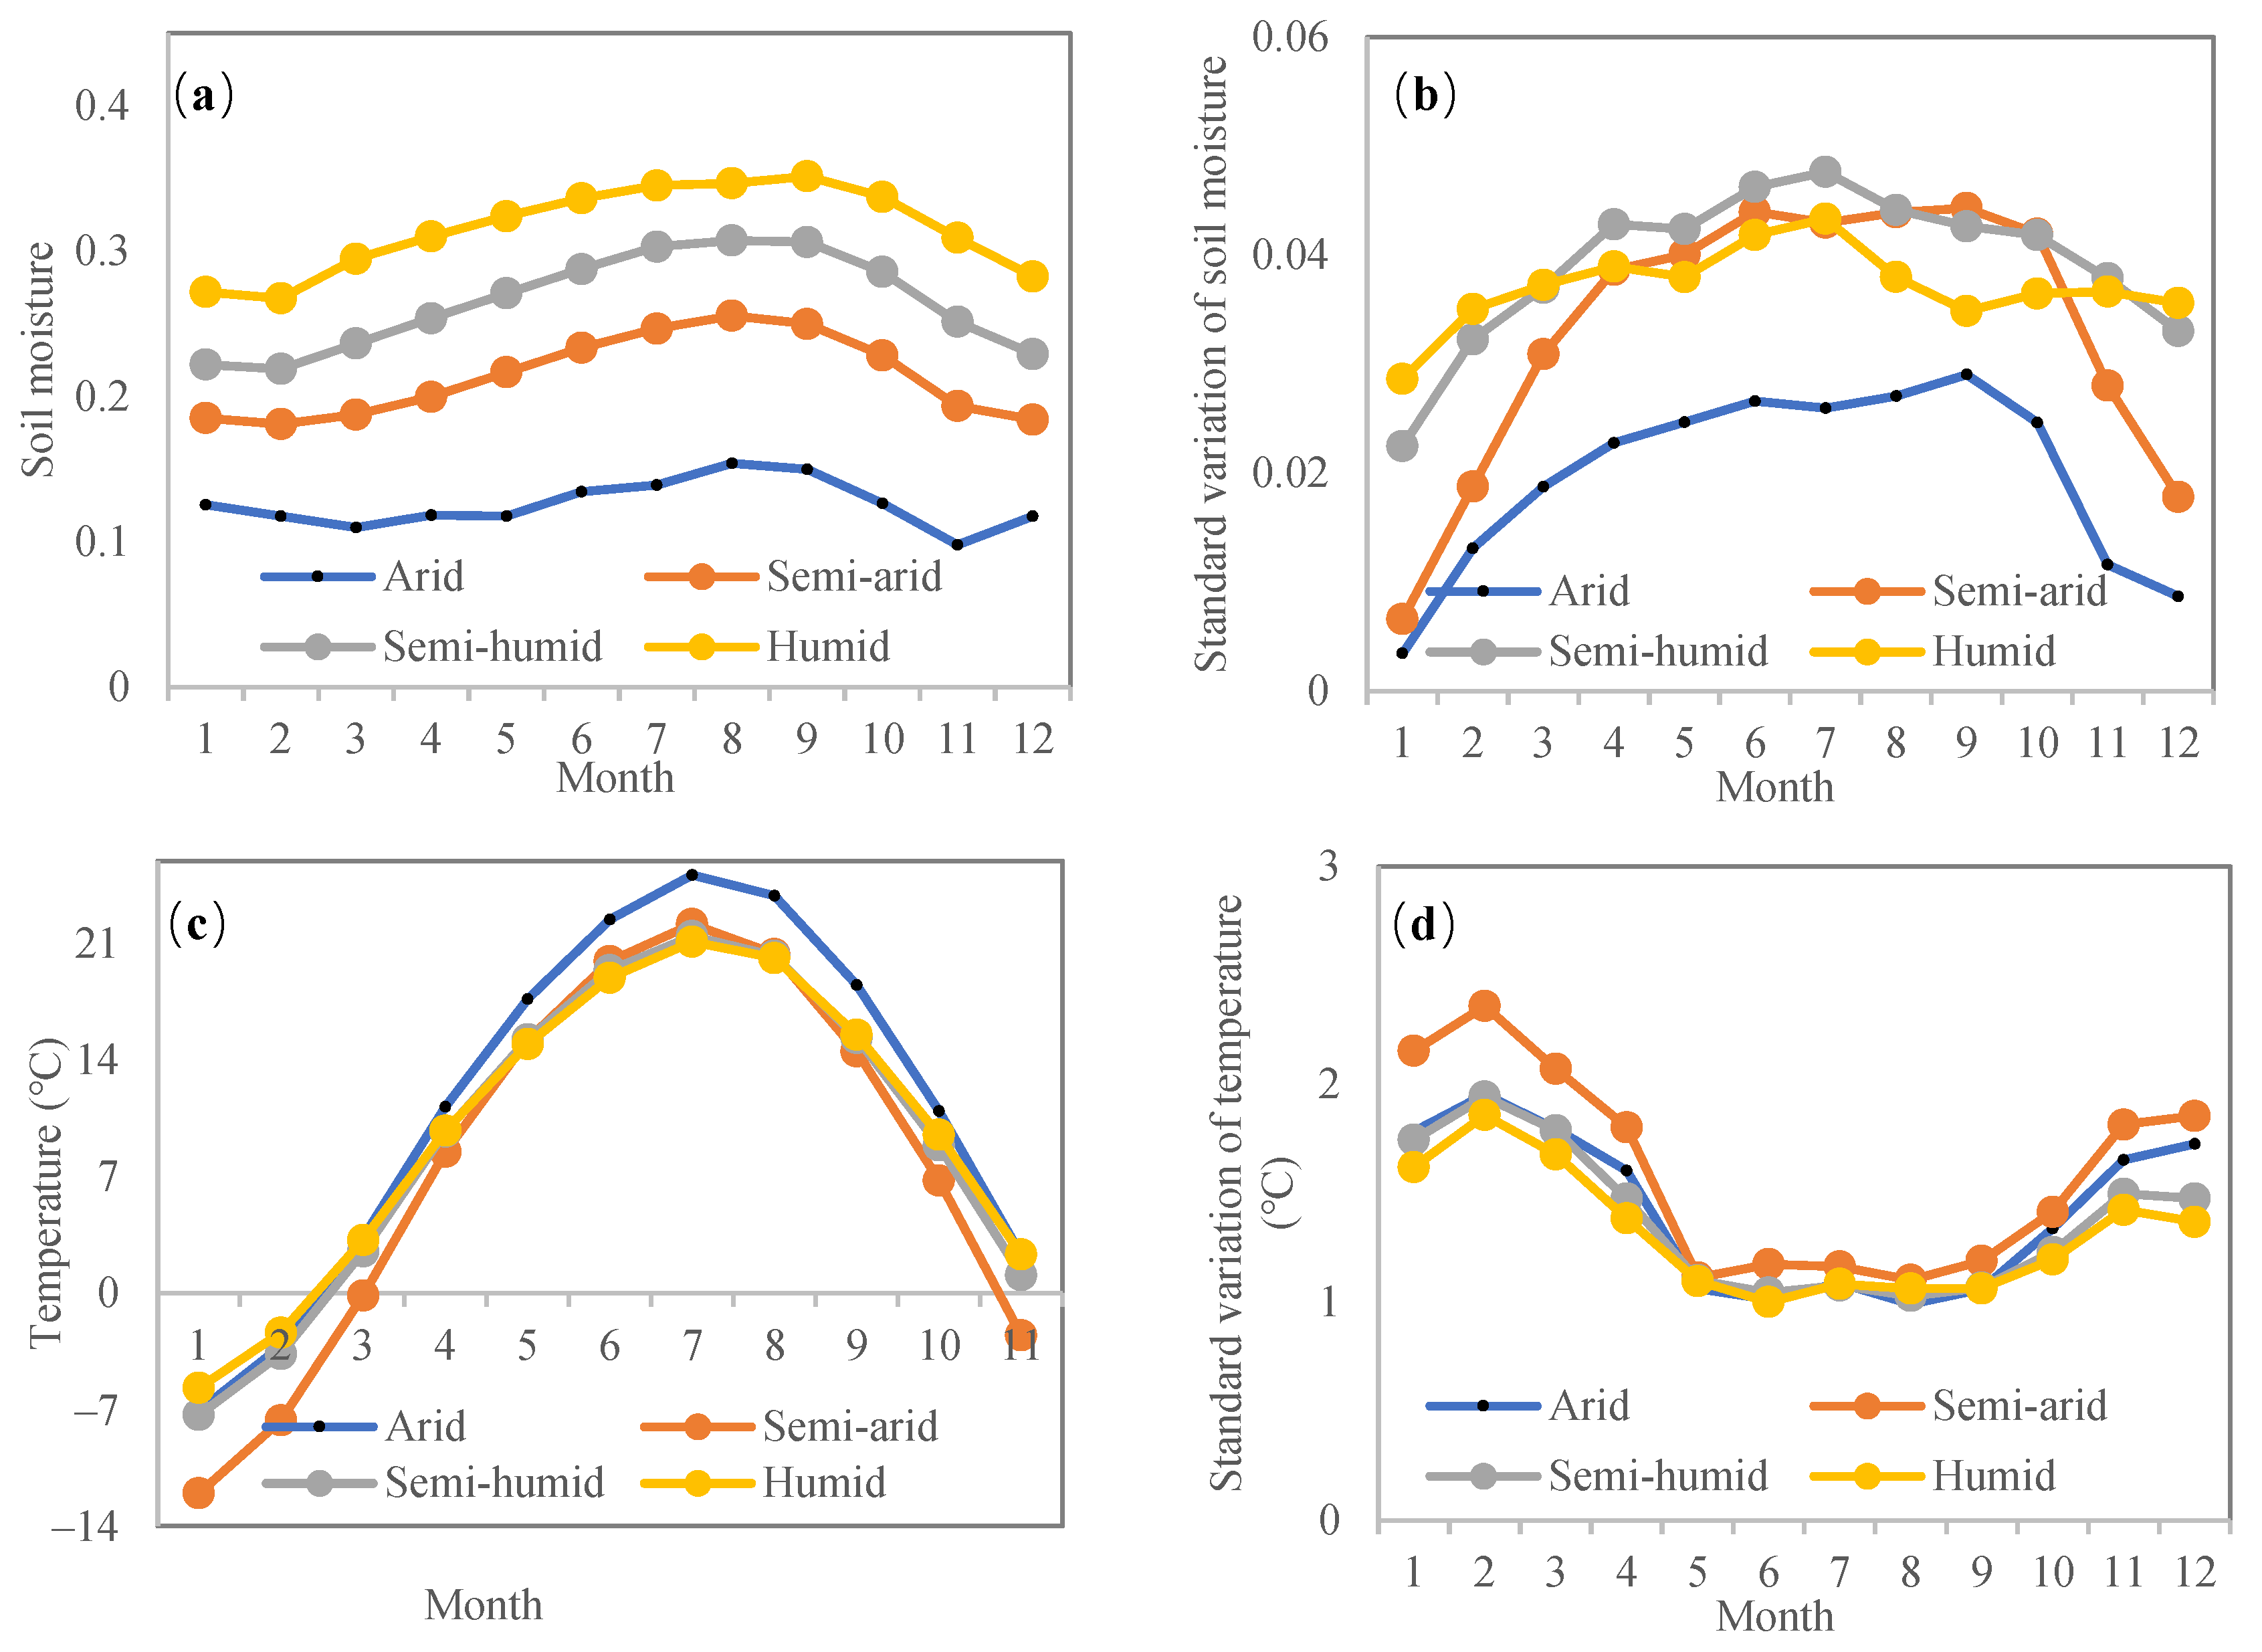
Inner-Annual Variability

The intra-annual variations of soil moisture and temperature were analyzed first (Figure 11). The soil moisture exhibits an evident intra-annual cycle reaching its minimum in the winter, followed by a rise in spring and autumn, and reaching its maximum in the summer (Figure 11a). Precipitation mainly concentrates in the summer over the water-scared northern areas, which serves as the primary method to replenish the soil moisture. Figure 10b shows the intra-annual variation in soil moisture variability. The soil moisture variability was small in winter and relatively larger in spring, summer, and autumn in all areas. The soil moisture variability is small in arid areas due to low soil moisture. Moreover, the air temperature in all regions shows a unimodal pattern of a low winter and high summer, peaking in July (Figure 11c). Temperature variability is U-shaped, with large variations in the winter and small in the summer (Figure 11d). Furthermore, the temperature variability is larger in semi-arid regions than in others.
Figure 12a further illustrates the intra-annual variation in CS, and shows that CS is smallest in winter months, reaching the maximum in spring months, and then decreasing again in summer and autumn months across all areas. The semi-arid region has the largest CS, followed by arid and semi-humid areas, and it has the smallest CS in humid areas. The CS is weak in the humid region, with small negative or positive values fluctuating around zero.
To determine this intra-annual variability of CS in relation to moisture and thermal factors, the intra-annual pattern of CS was compared to that of moisture (i.e., soil moisture and its variability) and thermal factors (i.e., temperature and its variability) for each dry and wet climate background. The intra-annual variation in CS is similar to the intra-annual variation in soil moisture variability, and temperature, and has roughly opposite characteristics to the intra-annual variation in temperature variability. Notably, soil moisture peaks in March–October, temperature peaks in July–August, temperature variability is at its minimum in May–August, whereas CS peaks in March–May. Generally, the coupling is most similar to the intra-annual variation of soil moisture variability.
From the correlation analysis of the CS with moisture and thermal factors (Figure 12b), soil moisture variability was found to have the highest correlation coefficient with CS, with the correlation coefficients larger than 0.4 in all regions. This suggests that a large soil moisture variability causes a large ET variability, and subsequently a large P variability, leading to a stronger ET-P coupling. The correlation coefficients of CS with temperature and temperature variability are large in semi-arid regions, but small in other regions, indicating that thermal factors have an important influence in semi-arid regions. Moreover, a higher temperature and temperature variability supplies more energy for the land–atmosphere interaction. The correlation coefficient between CS and soil moisture is low. Therefore, soil moisture variability is the main factor dominating the intra-annual variation of CS in the climate transitional zone of northern China.

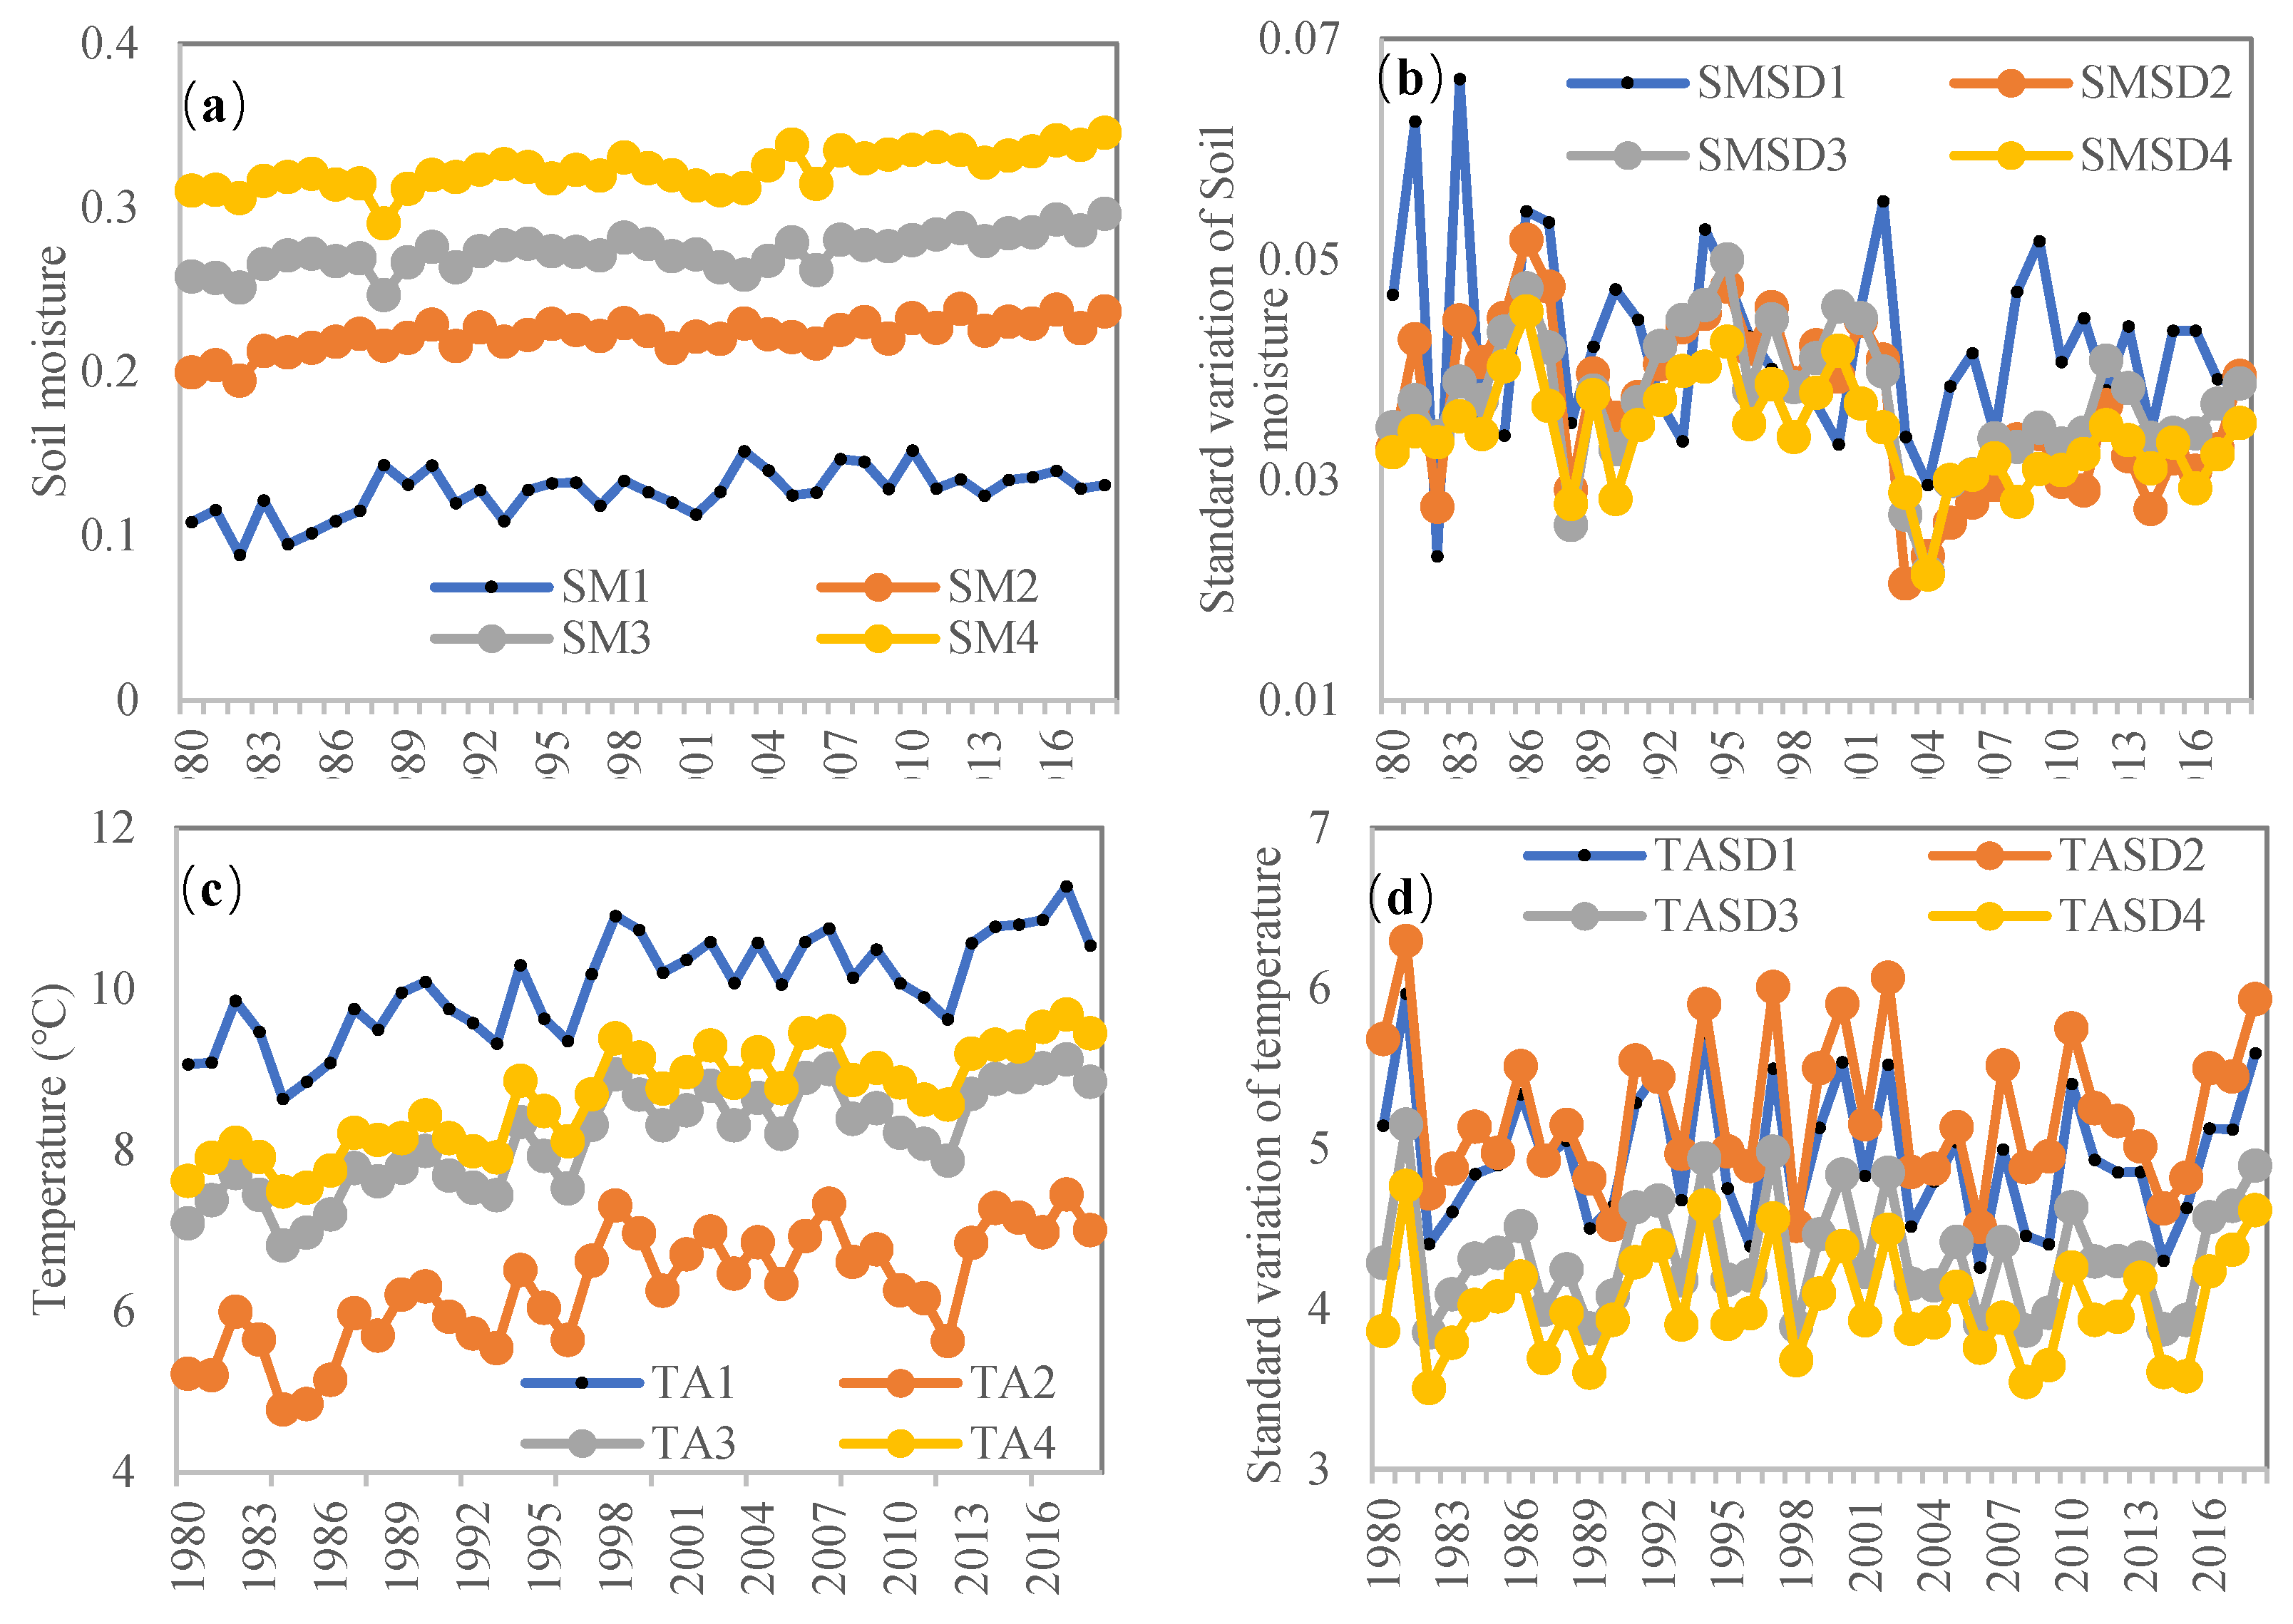
Inter-Annual Variability

Because the CS is the highest in the warm season (April–September) in the climate transitional zone of northern China, warm season CS was chosen as a representative to analyze the inter-annual variation of the CS with moisture and thermal factors. First, the inter-annual evolution of soil moisture and air temperature and their variability were analyzed. Soil moisture changed little during the study period, with a weak increase in all areas (Figure 13a). Instead, soil moisture variability fluctuated dramatically and declined during the study period (Figure 13b). Soil moisture variability was larger in the arid zone than other regions. In addition, temperature showed a significant increasing trend (Figure 13c), while the temperature variability displayed a fluctuating decreasing trend during the study period (Figure 13d).
Responding to changes in climatic conditions, the CS fluctuated strongly during the study period, and showed a slight decreasing trend in all subregions (Figure 14a). To find the dominant factors of inter-annual variation in CS, first, the time evolution of CS was compared with that of moisture and thermal factors. Soil moisture and temperature fluctuations were small, while soil moisture variability and temperature variability fluctuations were large and more similar to the inter-annual variation of CS. Figure 14b further presents the correlation of CS with soil moisture and temperature related variables for different soil moisture backgrounds in the warm season. The CS was significantly positive and correlated with soil moisture variability in arid and semi-arid regions, suggesting that inter-annual variation in soil moisture variability has a significant impact on the variation in ET and subsequently the variation in P. CS was negatively correlated with the soil moisture, demonstrating that soil moisture experiencing a relative dry state could cause a stronger CS. In the humid and sub-humid region, soil moisture and temperature related variables were weakly correlated with CS. This may be due to the joint influence of soil moisture and air temperature on CS giving rise to a more complex influence mechanism.

3.3. Reasons of Spatial Differences in Coupling Strength

To investigate the mechanism for the opposite signs of CS over different regions of the climate transitional zone of northern China, we analyzed boundary layer characteristics as an intermediate process of ET-P coupling. The distribution of correlation coefficients between the LCL and precipitation is shown in Figure 15a. The precipitation and LCL are negatively correlated in the majority of study areas, demonstrating that a lower LCL is more likely to trigger precipitation. This implies that the role of water vapor in precipitation is very prominent in the study area. The more saturated the atmosphere is, the lower the LCL, and the easier it is to trigger precipitation. This also shows that the effect of moisture recycling from evapotranspiration on precipitation is the main pathway of ET-P coupling.
The spatial distribution of correlation coefficients between ET and LCL is shown in Figure 15b. ET and LCL are negatively correlated in the majority of the study area, where CS are mainly positive; ET and LCL are positively correlated in the southern humid zone and eastern northeast, where CS is mainly negative. In fact, in the negative ET-LCL correlation zones in the climate transitional zone of northern China, the ET type is water-limited, and the increase in soil moisture causes an increase in ET, which increases air humidity and thus decreases LCL. Meanwhile, the increase in ET reduces the energy partitioning available to sensible heat, and the decrease in sensible heat inhibits the boundary layer development and decreases the boundary layer height (BLH), resulting in a negative correlation between ET and BLH in these regions (Figure 15c). In contrast, in the positive ET-LCL correlation zone in the south and northeast, the ET type is energy-limited, and an increase in the available energy leads to an increase in both sensible and latent heat. Hence, the boundary layer is developed, resulting in an increase in LCL and BLH.
The main reason behind positive and negative ET-P coupling is the different driving regimes of evapotranspiration in the study area: ET is energy-limited in the southern and northeast corner of the study area, leading to a positive correlation between ET and LCL, while ET is water-limited, and ET is negatively correlated with LCL in most of the northern part. Meanwhile, LCL has a negative correlation with P in the whole study area, it therefore leads to a negative ET-P coupling in the south and northeast corner and a positive coupling in the most northern region. Combined with the scatter plot of CS and soil moisture in Figure 8a, CS is positive in areas with soil moisture below 0.25, corresponding to moisture-limited evapotranspiration; both positive and negative CSs exist in areas with soil moisture in the range of 0.25–0.35, corresponding to the transition zone of evapotranspiration from moisture-limited to energy-limited; CS is negative in areas with soil moisture greater than 0.35, corresponding to an energy-limited evapotranspiration.

4. Discussion

4.1. Determination of Water and Temperature Factors via Spatial Pattern of CS

Both observation and simulation studies showed that the strong land–atmosphere coupling zone is mainly located in the semi-arid and sub-humid climate transition zone [5,6,7,29]. Because coupling is influenced by the evapotranspiration variability, the sensitivity of evapotranspiration to soil moisture, and sufficient water vapor conditions, which are optimal in the transition zone following a compromise, it is strongest in the transition zone. In these land–atmosphere coupling “hot spots”, the CS is further influenced by hydrothermal factors.
In semi-arid regions of southeastern South America and Africa, land–atmosphere coupling (soil moisture–precipitation coupling) is negatively correlated with soil moisture, with stronger coupling occurring in areas with lower soil moisture [26,33]. Wei et al. [30] found that the spatial distribution of soil moisture -precipitation CS is linked to the mean soil moisture, and the strong coupling area is mainly distributed in the areas with a soil moisture of 0.4–0.5.
Land–atmosphere coupling can be separated into two components: the terrestrial leg and the atmospheric leg [7]. For instance, soil moisture–precipitation coupling can be separated into soil moisture–evapotranspiration coupling (terrestrial leg) and evapotranspiration coupling (atmospheric leg). The current study focused on ET-P coupling, which is the atmospheric leg of land-precipitation coupling. The CS is found to be positively related to climatological soil moisture, and the data reveal the strong coupling in the climate transition zone with soil moisture in the range of 0.15–0.25, with relatively weak coupling in the arid and humid areas. The soil moisture range of the strongest coupling differs from the strong coupling zone of 0.4–0.55 in Wei’s study, which may be related to the different soil moisture data, where they used MERRA-LAND reanalysis soil moisture data (top 1 m), while we used CCI remotely sensed soil moisture (surface 5–10 cm).
Studies have shown that the areas where land–atmosphere coupling is controlled by thermal energy factors are mostly located in moist areas with sufficient moisture [35,39]. In the climate transitional zone of northern China, where the climate is non-humid, the influence of temperature is weak, and the relationship between the spatial distribution of CS and temperature is considerably weaker than that with soil moisture. Therefore, the moisture factor is the main factor dominating the spatial distribution of ET-P coupling.

4.2. Determination of Water and Temperature Factors on Temporal Variation of CS

The studies on the temporal variation of CS are fewer than those on the spatial pattern of CS. The findings based on GLACE and MERRA-LAND both indicate that interannual variation in land–atmosphere coupling is mainly caused by soil moisture variation, and suggest a phenomenon of “see-saw” that the CS is stronger in the wet period in the dry area and in the dry period in the wet area [30,31]. This is explained by the fact that where the CS is strongest in the transition zone, either the dry zone becomes wet or the wet zone becomes dry, and the coupling is thus enhanced. Recently, Lo et al. showed that hydrological events have a significant effect on temporal evolution of CS by changing the surface state [45]. After large-scale intensive precipitation events, the soil moisture increases significantly, causing evapotranspiration to change from moisture to transitional limitation. Thus, the dependence of evapotranspiration on soil moisture decreases, resulting in a decrease in CS.
In the current study, responding to the intra- and inter-annual fluctuations of environmental conditions, land–atmosphere coupling exhibits distinct intra-annual cycles and inter-annual fluctuations. Soil moisture variability (standard deviation) is the most important influencing factor in determining the CS in the northern China climate transition zone. This is in relation to evapotranspiration being moisture-limited across most of the climate transition zone, and a larger soil moisture variability causes a larger evapotranspiration variability, and subsequently a precipitation variability. This effect is more significant in arid and semi-arid regions.

4.3. Positive and Negative Coupling Mechanisms

Land–atmosphere couplings could be positive or negative. Drylands tend to show positive coupling, i.e., the lager the soil moisture, the higher the evapotranspiration, and the more likely to trigger convective precipitation [5,16]. The mechanism responsible for positive coupling involves dominant moisture recycling in land–atmosphere coupling. Negative coupling was also found in some studies, i.e., negative coupling exists in north Africa [26]. Negative coupling implies that a lower soil moisture is more likely to trigger precipitation. The mechanism responsible for negative CS is that in areas where the boundary layer is wet with a dry surface with strong heating, the convective available potential energy (CAPE) is large and convective inhibition (CIN) is small, causing the boundary layer to be more likely to develop deeper. Although a dry and hot boundary layer causes LCL lift, the well-developed BLH would exceed LCL and trigger convective precipitation. This mechanism is similar to the land–atmosphere coupling mechanism in the southern region of the study area in the current study.
LCL is a key variable in the linkage between surface and precipitation, and the development of LCL is closely related to the type of evapotranspiration [46]. The ET in the southern region of the study area is energy-limited, and the increase in available energy causes both sensible and latent heat to increase, and the increased sensible heat heats the boundary layer and increases the LCL, leading to a positive correlation between ET and LCL. In most northern regions, ET is moisture-limited, and increasing soil moisture results in an increase in ET and a decrease in sensible heat, causing LCL to decrease and the boundary layer to become wet and cold, leading negative correlation of ET with LCL. In contrast, over the whole study area, a lower LCL is more likely to trigger precipitation, and hence, LCL has a negative correlation with P. Thus, it leads to negative ET-P coupling in the part of south region and positive coupling in the north region. Therefore, the main reason for the positive and negative differences in ET-P coupling in the study area is the different driving regimes of evapotranspiration.

5. Conclusions

Employing an evapotranspiration–precipitation coupling index (CS) proposed by Zeng (2010), this study found that CS decreases gradually from the northwest to southeast in the north China climate transition zone, with strong positive coupling in the northwest and negative coupling in the southeast and northeast corners. The CS decreases sequentially in the spring, summer, autumn and winter, and is considerably stronger in spring than in other seasons. On the interdecadal scale, coupling is highest in the 1980s, lowest in the 1990s, and moderate in the 2000s and 2010s. The trend of CS gradually shifts from a significant declining trend in the west to an increasing trend (not significant) in the east.
The spatial distribution of CS is closely related to the distribution of climatology of moisture and temperature. The CS remained at a strong level and increased slightly by increasing soil moisture when it was below 0.2, and decreased with increasing soil moisture when the soil moisture was above 0.2. In the zone of study, areas with soil moisture below 0.25 have positive CS, areas with soil moisture between 0.25 and 0.35 experience a transitional coupling from positive to negative, and areas with soil moisture greater than 0.35 exhibit negative CS. The relationship between soil moisture and the CS trend is roughly opposite to that between the soil moisture and CS. The CS shows an exponential decreasing trend with the increase in temperature, while the CS trend gradually increases with increasing temperature. Climatological soil moisture plays a more dominant role in determining the distribution of CS.
The CS exhibits evident intra- and inter-annual variability in the climate transitional zone of northern China. Soil moisture variability has the highest correlation coefficient with the intra-annual CS, dominating the intra-annual variation in ET-P coupling in the northern region. At the interannual scale, soil moisture variability is significantly and positively correlated with CS in arid and semi-arid regions, determining the interannual variability in CS in these regions. In humid and semi-humid areas, the CS is more complex in relation to the hydrothermal factors, and subject to the combined effect of hydrothermal factors.
The boundary layer thermodynamic analysis revealed that the main reason for positive and negative differences in CS across the study area is the different driving regimes of evapotranspiration. ET is energy-limited in the southern part of the study area, leading to a positive correlation between ET and LCL, while in most of the northern part, ET is moisture-limited, and ET is negatively correlated with LCL. The effect of moisture recycling from evapotranspiration on precipitation represents the main pathway of ET-P coupling, and LCL has a negative correlation with P across the study area, therefore leading to a negative ET-P coupling in part of the south and a positive coupling in the north.

Author Contributions

Conceptualization, Z.Y. and Q.Z.; Methodology, Z.Y. and Q.Z.; Investigation and Data Acquisition, Z.Y.; Formal Analysis, Z.Y., Q.Z. and P.Y.; Writing—Original Draft Preparation, Z.Y.; Writing—Review & Editing, Z.Y., Q.Z., Y.Z., P.Y., L.Z. and J.Z.; Visualization, Z.Y. and Y.Q.; Funding Acquisition, Z.Y., Q.Z. and Y.Z. All authors have read and agreed to the published version of the manuscript.

Funding

This work was funded by the National Natural Science Foundation of China (Grant No. 42005071 and 41630426) supporting Z.Y. and Q.Z. The Second Tibetan Plateau Scientific Expedition and Research (STEP) program (grant no. 2019QZKK0102) supporting Y.Z. and Z.Y.

Institutional Review Board Statement

Not applicable.

Informed Consent Statement

Not applicable.

Data Availability Statement

The data presented in this study are available online: Evapotranspiration product can be download from https://dapds00.nci.org.au/thredds/catalog/ks32/CLEX_Data/DOLCE/v3-0/catalog.html (accessed on 30 July 2021); Precipitation and near-surface air temperature data from China Meteorological Forcing Dataset can be obtained from http://data.tpdc.ac.cn/zh-hans/ (accessed on 10 May 2021); CCI soil moisture data are available at http://www.esa-soilmoisture-cci.org/node/202 (accessed on 19 November 2020); Boundary layer heights of ERA5 are available at https://cds.climate.copernicus.eu/cdsapp#!/dataset/reanalysis-era5-single-levels-monthly-means-preliminary-back-extension?tab=form (accessed on 18 November 2021).

Conflicts of Interest

The authors declare no conflict of interest.

References

  1. Huang, R. Progresses in Research on the Formation Mechanism and Prediction Theory of Severe Climatic Disasters in China. Adv. Earth Sci. 2006, 21, 564–575. [Google Scholar]
  2. Seneviratne, S.I.; Lüthi, D.; Litschi, M.; Schär, C. Land–atmosphere coupling and climate change in Europe. Nature 2006, 443, 205–209. [Google Scholar] [CrossRef] [PubMed]
  3. Zhang, J.; Wu, L. Land-atmosphere coupling amplifies hot extremes over China. Chin. Sci. Bull. 2011, 56, 1905–1909. [Google Scholar] [CrossRef] [Green Version]
  4. Zhou, S.; Williams, A.P.; Berg, A.M.; Cook, B.I.; Zhang, Y.; Hagemann, S.; Lorenz, R.; Seneviratne, S.I.; Gentine, P. Land-atmosphere feedbacks exacerbate concurrent soil drought and atmospheric aridity. Proc. Natl. Acad. Sci. USA 2019, 116, 18848–18853. [Google Scholar] [CrossRef] [PubMed] [Green Version]
  5. Koster, R.D. Regions of Strong Coupling Between Soil Moisture and Precipitation. Science 2004, 305, 1138–1140. [Google Scholar] [CrossRef] [PubMed] [Green Version]
  6. Zeng, X.; Barlage, M.; Castro, C.; Fling, K. Comparison of Land–Precipitation Coupling Strength Using Observations and Models. J. Hydrometeorol. 2010, 11, 979–994. [Google Scholar] [CrossRef] [Green Version]
  7. Dirmeyer, P.A. The terrestrial segment of soil moisture-climate coupling. Geophys. Res. Lett. 2011, 38, L16702. [Google Scholar] [CrossRef]
  8. Koster, R.D.; Sud, Y.C.; Guo, Z.; Dirmeyer, P.A.; Bonan, G.; Oleson, K.W.; Chan, E.; Verseghy, D.; Cox, P.; Davies, H.; et al. GLACE: The Global Land–Atmosphere Coupling Experiment. Part I: Overview. J. Hydrometeorol. 2006, 7, 590–610. [Google Scholar] [CrossRef]
  9. Chen, H.; Zhou, J. Impact of Interannual Soil Moisture Anomaly on Simulation of Extreme Climate Events in China.Part II: Sensitivity Experiment Analysis. Chin. J. Atmos. Sci. 2013, 37, 1–13. [Google Scholar]
  10. Guo, W.; Ma, Z.; Yao, Y. Regional Characteristics of Soil Moisture Evolution in Northern China over Recent 50 Years. Acta. Geogr. Sin. 2003, 58, 83–90. [Google Scholar]
  11. Williams, I.N.; Torn, M.S. Vegetation controls on surface heat flux partitioning, and land-atmosphere coupling. Geophys. Res. Lett. 2015, 42, 9416–9424. [Google Scholar] [CrossRef]
  12. Weiqiang, M.; Yaoming, M.; Hirohiko, I. Evaluation of the SEBS for upscaling the evapotranspiration based on in-situ observations over the Tibetan Plateau. Atmos. Res. 2014, 138, 91–97. [Google Scholar]
  13. Seneviratne, S.I.; Corti, T.; Davin, E.L.; Hirschi, M.; Jaeger, E.B.; Lehner, I.; Orlowsky, B.; Teuling, A.J. Investigating soil moisture–climate interactions in a changing climate: A review. Earth-Sci. Rev. 2010, 99, 125–161. [Google Scholar] [CrossRef]
  14. Eltahir, E.A.B.; Bras, R.L. Precipitation recycling. Rev. Geophys. 1996, 34, 367–378. [Google Scholar] [CrossRef]
  15. Wei, J.; Dirmeyer, P.A.; Guo, Z. How Much Do Different Land Models Matter for Climate Simulation? Part II: A Decomposed View of the Land–Atmosphere Coupling Strength. J. Clim. 2010, 23, 3135–3145. [Google Scholar] [CrossRef]
  16. Goessling, H.F.; Reick, C.H. What do moisture recycling estimates tell us? Exploring the extreme case of non-evaporating continents. Hydrol. Earth Syst. Sci. 2011, 15, 3217–3235. [Google Scholar] [CrossRef] [Green Version]
  17. Gao, C.; Chen, H.; Li, G.; Ma, H.; Li, X.; Long, S.; Xu, B.; Li, X.; Zeng, X.; Yan, H.; et al. Land–atmosphere interaction over the Indo-China Peninsula during spring and its effect on the following summer climate over the Yangtze River basin. Clim. Dyn. 2019, 53, 6181–6198. [Google Scholar] [CrossRef]
  18. Findell, K.L.; Eltahir, E.A.B. Atmospheric Controls on Soil Moisture–Boundary Layer Interactions. Part II: Feedbacks within the Continental United States. J. Hydrometeorol. 2003, 4, 570–583. [Google Scholar] [CrossRef]
  19. Berg, A.; Findell, K.; Lintner, B.R.; Gentine, P.; Kerr, C. Precipitation Sensitivity to Surface Heat Fluxes over North America in Reanalysis and Model Data. J. Hydrometeorol. 2013, 14, 722–743. [Google Scholar] [CrossRef] [Green Version]
  20. Santanello, J.A.; Dirmeyer, P.A.; Ferguson, C.R.; Findell, K.L.; Tawfik, A.B.; Berg, A.; Ek, M.; Gentine, P.; Guillod, B.P.; van Heerwaarden, C.; et al. Land–Atmosphere Interactions: The LoCo Perspective. Bull. Am. Meteorol. Soc. 2018, 99, 1253–1272. [Google Scholar] [CrossRef]
  21. Ma, Y.; Yao, T.; Hu, Z.; Wang, J. The Cooperative Study on Energy and Water Cycle over the Tibetan Plateau. Adv. Earth Sci. 2009, 24, 1280. [Google Scholar]
  22. Yang, Z.; Zhang, Q.; Hao, X.; Yue, P. Changes in Evapotranspiration Over Global Semiarid Regions 1984–2013. J. Geophys. Res. Atmos. 2019, 124, 2946–2963. [Google Scholar] [CrossRef]
  23. Zhang, Q.; Yang, Z.; Hao, X.; Yue, P. Conversion features of evapotranspiration responding to climate warming in transitional climate regions in northern China. Clim. Dyn. 2019, 52, 3891–3903. [Google Scholar] [CrossRef]
  24. Findell, K.L.; Eltahir, E.A.B. Atmospheric Controls on Soil Moisture–Boundary Layer Interactions. Part I: Framework Development. J. Hydrometeorol. 2003, 4, 552–569. [Google Scholar] [CrossRef]
  25. Guillod, B.P.; Orlowsky, B.; Miralles, D.G.; Teuling, A.J.; Seneviratne, S.I. Reconciling spatial and temporal soil moisture effects on afternoon rainfall. Nat. Commun. 2015, 6, 6443. [Google Scholar] [CrossRef]
  26. Petrova, I.Y.; van Heerwaarden, C.C.; Hohenegger, C.; Guichard, F. Regional co-variability of spatial and temporal soil moisture–precipitation coupling in North Africa: An observational perspective. Hydrol. Earth Syst. Sci. 2018, 22, 3275–3294. [Google Scholar] [CrossRef] [Green Version]
  27. Luan, L.; Meng, X.; Lv, S.; Han, B.; Li, Z.; Zhao, L.; Li, R. Simulation on Afternoon Convective Precipitation Triggered by Soil Moisture over the Qinghai-Tibetan Plateau. Plateau Meteorol. 2018, 37, 873–885. [Google Scholar]
  28. Ford, T.W.; Rapp, A.D.; Quiring, S.M.; Blake, J. Soil moisture–precipitation coupling: Observations from the Oklahoma Mesonet and underlying physical mechanisms. Hydrol. Earth Syst. Sci. 2015, 19, 3617–3631. [Google Scholar] [CrossRef] [Green Version]
  29. Dirmeyer, P.A.; Chen, L.; Wu, J.; Shin, C.S.; Huang, B.; Cash, B.A.; Bosilovich, M.G.; Mahanama, S.; Koster, R.D.; Santanello, J.A.; et al. Verification of land-atmosphere coupling in forecast models, reanalyses and land surface models using flux site observations. J. Hydrometeorol. 2018, 19, 375–392. [Google Scholar] [CrossRef]
  30. Wei, J.; Dirmeyer, P.A. Dissecting soil moisture-precipitation coupling. Geophys. Res. Lett. 2012, 39, L19711. [Google Scholar] [CrossRef]
  31. Guo, Z.; Dirmeyer, P.A. Interannual Variability of Land–Atmosphere Coupling Strength. J. Hydrometeorol. 2013, 14, 1636–1646. [Google Scholar] [CrossRef]
  32. Phillips, T.J.; Klein, S.A. Land-atmosphere coupling manifested in warm-season observations on the U.S. southern great plains. J. Geophys. Res. Atmos. 2014, 119, 509–528. [Google Scholar] [CrossRef]
  33. Ruscica, R.C.; Sörensson, A.A.; Menéndez, C.G. Pathways between soil moisture and precipitation in southeastern South America. Atmos. Sci. Lett. 2015, 16, 267–272. [Google Scholar] [CrossRef] [Green Version]
  34. Ruscica, R.C.; Menéndez, C.G.; Sörensson, A.A. Land surface–atmosphere interaction in future South American climate using a multi-model ensemble. Atmos. Sci. Lett. 2016, 17, 141–147. [Google Scholar] [CrossRef] [Green Version]
  35. Li, M.; Ma, Z.; Gu, H.; Yang, Q.; Zheng, Z. Production of a combined land surface data set and its use to assess land-atmosphere coupling in China. J. Geophys. Res. Atmos. 2017, 122, 948–965. [Google Scholar] [CrossRef]
  36. Gao, C.; Chen, H.; Sun, S.; Xu, B.; Ongoma, V.; Zhu, S.; Ma, H.; Li, X. Regional Features and Seasonality of Land–Atmosphere Coupling over Eastern China. Adv. Atmos. Sci. 2018, 35, 689–701. [Google Scholar] [CrossRef]
  37. Genhou, S.; Zeyong, H.; Yaoming, M.; Zhipeng, X.; Fanglin, S.; Jiemin, W.; Song, Y. Analysis of local land atmosphere coupling characteristics over Tibetan Plateau in the dry and rainy seasons using observational data and ERA5. Sci. Total Environ. 2021, 774, 145138. [Google Scholar]
  38. Zhao, J.; Liu, S. Research on the impact of vegetation change on land-atmosphere coupling strength in northwest China. Chin. J. Geophys. 2015, 58, 47–62. [Google Scholar]
  39. Zscheischler, J.; Orth, R.; Seneviratne, S.I. A submonthly database for detecting changes in vegetation-atmosphere coupling. Geophys. Res. Lett. 2015, 42, 9816–9824. [Google Scholar] [CrossRef] [Green Version]
  40. Hobeichi, S.; Abramowitz, G.; Evans, J.; Ukkola, A. Derived Optimal Linear Combination Evapotranspiration (DOLCE): A global gridded synthesis ET estimate. Hydrol. Earth Syst. Sci. 2018, 22, 1317–1336. [Google Scholar] [CrossRef] [Green Version]
  41. Yang, K.; He, J. China meteorological forcing dataset (1979–2018). In National Tibetan Plateau Data; National Tibetan Plateau Data Center: Beijing, China, 2019. [Google Scholar]
  42. Gruber, A.; Scanlon, T.; van der Schalie, R.; Wagner, W.; Dorigo, W. Evolution of the ESA CCI Soil Moisture climate data records and their underlying merging methodology. Earth Syst. Sci. Data 2019, 11, 717–739. [Google Scholar] [CrossRef] [Green Version]
  43. Dorigo, W.A.; Gruber, A.; De Jeu, R.A.M.; Wagner, W.; Stacke, T.; Loew, A.; Albergel, C.; Brocca, L.; Chung, D.; Parinussa, R.M.; et al. Evaluation of the ESA CCI soil moisture product using ground-based observations. Remote Sens. Environ. Interdiscip. J. 2015, 162, 380–395. [Google Scholar] [CrossRef]
  44. Ma, S.; Zhu, K.; Li, M.; Ma, Z. A Comparative Study of Multi-source Soil Moisture Data for China’s Regions. Clim. Environ. Res. 2016, 21, 121–133. [Google Scholar]
  45. Lo, M.-H.; Wu, W.-Y.; Tang, L.I.; Ryu, D.; Rashid, M.; Wu, R.-J. Temporal Changes in Land Surface Coupling Strength: An Example in a Semi-Arid Region of Australia. J. Clim. 2021, 34, 1503–1513. [Google Scholar] [CrossRef]
  46. Wei, J.; Zhao, J.; Chen, H.; Liang, X.-Z. Coupling Between Land Surface Fluxes and Lifting Condensation Level: Mechanisms and Sensitivity to Model Physics Parameterizations. J. Geophys. Res. Atmos. 2021, 126, e2020JD034313. [Google Scholar] [CrossRef]
Figure 1. Climatic background of climate transitional zone of northern China (hyper-arid: AI < 0.05, arid: 0.05 < AI < 0.2, semi-arid: 0.2 < AI < 0.5, sub-humid: 0.5 < AI < 0.65, and humid: AI > 0.65). The soil moisture observation sites are indicated by stars.
Remotesensing 14 01448 g001
Figure 2. Taylor diagram of ESA CCI soil moisture data.
Remotesensing 14 01448 g002
Figure 3. Spatial distribution of (a) climatology of annual precipitation, (b) standard deviation of annual precipitation, (c) climatology of evapotranspiration, and (d) standard deviation of evapotranspiration in the climate transitional zone of northern China.
Remotesensing 14 01448 g003
Figure 4. Spatial distribution of evapotranspiration-precipitation CS in the climate transitional zone of northern China (dot denotes CS passing 0.05 significance test).
Remotesensing 14 01448 g004
Figure 5. Seasonal changes in spatial distribution of evapotranspiration–precipitation CS in the climate transitional zone of northern China, (a) for winter, (b) for spring, (c) for summer, and (d) for autumn (dot denotes CS passing 0.05 significance test).
Remotesensing 14 01448 g005
Figure 6. Decadal changes in spatial distribution of evapotranspiration–precipitation coupling in the climate transitional zone of northern China, (a) for 1980–1989, (b) for 1990–2000, (c) for 2000–2009, and (d) for 2010–2019 (dot denotes CS passing 0.05 significance test).
Remotesensing 14 01448 g006
Figure 7. Spatial distribution of evapotranspiration–precipitation coupling trends in the climate transitional zone of northern China (dot denotes trend passing the significance test).
Remotesensing 14 01448 g007
Figure 8. Distribution of climatology of (a) soil moisture and (b) air temperature in northern China.
Remotesensing 14 01448 g008
Figure 9. (a) Variation in evapotranspiration–precipitation CS and (b) its trend with soil moisture (shades of color indicate the density of the points).
Remotesensing 14 01448 g009
Figure 10. (a) Variation in evapotranspiration-precipitation CS and (b) its trend with air temperature (shades of color indicate the density of the points).
Remotesensing 14 01448 g010
Figure 11. Intra-annual variation in (a) soil moisture, (b) standard deviation of soil moisture, (c) temperature, and (d) standard deviation of temperature (standard deviation of each month data for the 39 years) under different dry-wet climatic backgrounds.
Remotesensing 14 01448 g011
Figure 12. (a) Intra-annual variation in ET-P CS and (b) its correlation coefficients with soil moisture (SM), standard deviation of soil moisture (SMCD), air temperature (TA) and standard deviation of temperature (TASD) under different dry-wet climatic backgrounds.
Remotesensing 14 01448 g012
Figure 13. Inter-annual variation in warm season (a) soil moisture, (b) standard deviation (standard deviation of monthly data within warm season of a year) of soil moisture, (c) temperature, and (d) standard deviation of temperature under different dry-wet climatic backgrounds.
Remotesensing 14 01448 g013
Figure 14. (a) Inter-annual variation of warm season ET-P CS and (b) its correlation coefficients with soil moisture (SM), standard deviation of soil moisture (SMCD), air temperature (TA) and standard deviation of temperature (TASD) under different dry-wet climatic conditions.
Remotesensing 14 01448 g014
Figure 15. Distribution of correlation coefficients between (a) P and LCL, (b) ET and LCL, (c) ET and BLH (dot denotes correlation coefficient passing 0.05 significance test).
Remotesensing 14 01448 g015
Table 1. Brief description of the soil moisture observatories.
StationLocationElevation (m)Land CoverPrecipitation (mm)Mean Air Temperature (°C)Climate
SACOL35°57′N, 104°08′E1966Grassland381.86.7Semi-arid
QY35°41′N, 107°51′E1280Cropland5628.8Sub-humid
NM43°33′N, 116°40′E1250Grassland3360.8Semi-arid
YC36°50′N, 116°34′E28Cropland58213.1Sub-humid
Publisher’s Note: MDPI stays neutral with regard to jurisdictional claims in published maps and institutional affiliations.

