
Inter- and Intra-Annual Glacier Elevation Change in High Mountain Asia Region Based on ICESat-1&2 Data Using Elevation-Aspect Bin Analysis Method


1
State Key Laboratory of Remote Sensing Science, Aerospace Information Research Institute, Chinese Academy of Sciences, Beijing 100101, China
2
University of Chinese Academy of Sciences, Beijing 100049, China
3
Key Laboratory of Tibetan Environment Changes and Land Surface Processes, Institute of Tibetan Plateau Research, Chinese Academy of Sciences, Beijing 100101, China
*
Author to whom correspondence should be addressed.
Remote Sens. 2022, 14(7), 1630; https://doi.org/10.3390/rs14071630
Submission received: 24 January 2022
/
Revised: 8 March 2022
/
Accepted: 16 March 2022
/
Published: 29 March 2022
(This article belongs to the Special Issue Land-Atmosphere Interactions and Effects on the Climate of the Tibetan Plateau and Surrounding Regions)
Abstract
:Glaciers are sensitive indicators of climate change and have a significant influence on regional water cycle, human survival and social development. Global warming has led to great changes in glaciers over the High Mountain Asia (HMA) region. Glacier elevation change is a measure of glacier mass balance driven by the processes of energy and mass exchange between the glacier surface and the atmosphere which are influenced by climatic factors and glacier surface properties. In this study, we estimated the inter-annual and intra-annual elevation changes of glaciers in the HMA region in 2003–2020 using Ice, Cloud and land Elevation Satellite (ICESat) data and Shuttle Radar Terrain Mission (SRTM) digital elevation model (DEM) data by developing an “elevation-aspect bin analysis method” that considered the difference of glacier elevation changes in different elevations and aspects of glacier topography. The results showed that: (1) The inter-annual change of glacier elevation in 2003–2020 had large spatial heterogeneity. Glacier elevation reduction mainly occurred in the marginal region of the HMA with the maximum decline in the Nyainqentanglha region, while glacier elevation showed increase in the West Kunlun of inner HMA regions in 2003–2020. The glacier elevation change rate showed an accelerating reduction trend in most of the HMA regions, except in the west HMA where the glacier elevation reduction rate showed slowdown tendency. Specifically, the glacier elevation change rate in the entire HMA was −0.21 ± 0.12 m/year in 2003–2008 and −0.26 ± 0.11 m/year in 2003–2020, respectively. (2) The intra-annual change of HMA glacier elevation in 2019 and 2020 showed obvious spatiotemporal heterogeneity, and the glacier thickening period was gradually delayed from the marginal area to the inner area of the HMA. The glaciers in the western marginal part of the HMA (the Tienshan Mountains, Pamir and Hindu Kush and Spiti Lahaul) and Karakoram thickened in winter or spring, the glaciers in the Nyainqentanglha Mountains exhibited spring accumulation. The glaciers in West Kunlun accumulated in two time periods, i.e., from March to June and from July to September. The glaciers in the Inner Tibetan Plateau and Bhutan and Nepal areas experienced spring or summer accumulation, especially in June or July. Moreover, we found that the inter-annual and intra-annual change of glacier elevation could be explained by the changes in temperature and precipitation. A similar analysis can be extended to mountain glaciers in other regions of the world, and glacier change trends could be further explored over a longer time span with the continuous operation of ICESat-2.
1. Introduction
In the past two decades, with global warming, great changes have taken place in global glaciers [1,2,3]. A recent study based on satellite data and modeling has revealed that the potential contribution of the world’s melting glaciers to sea level rise is 257 ± 85 mm in 2017–2018 [4]. High Mountain Asia (HMA) is the region with the largest distribution of glaciers and diverse glacier types in the middle latitudes of the earth. It is the birthplace of major rivers in Asia, such as the Amu Darya River, the Syr Darya River, the Yangtze River, the Yellow River, the Salween River, the Brahmaputra River and the Indus River [5,6,7]. To date, the glaciers in the HMA region have undergone significant changes, triggering a series of disasters and having a major impact on people’s production and lives. The glacier changes not only directly drive changes in the natural environment in the HMA region, but also have feedbacks to climate change in the whole northern hemisphere and even the whole world. Therefore, accurate monitoring of glacier changes in the HMA region is crucial for studying global glacier and climate change, as well as for understanding the potential impact of glacier retreat [8,9,10,11].
The method based on satellite stereoscopic imagery has good spatial coverage and is a common method to monitor glacier elevation changes [12,13]. Existing studies have shown that the glaciers in the HMA are generally in a melting state, but the rate of change varies in different regions and different time spans [9,14,15]. For example, in the Nyanqentanglha Mountains, Ren et al. [16] analyzed the ZY-3 satellite stereo image pair data and found that the glacier thinning rate in 2013–2017 was faster than that in 2000–2013. The results of Brun et al. [17] showed that the glacier thickness across the HMA region decreased by 0.21 m per year from 2000 to 2016. However, glaciers in East Pamir, Karakoram and West Kunlun are in a state of equilibrium or slightly rising, which is called the “Karakoram Anomaly” [18,19,20,21].
Lidar altimetry data, such as ICESat-1&2 data, have higher vertical accuracy than satellite-based stereo image pair data. Using lidar data to monitor glacier elevation change is a hot research topic [22]. At present, ICESat-1 equipped with the Geoscience Laser Altimeter System (GLAS), as the first generation of space-borne laser point cloud satellite, can provide global laser point cloud data from 2003 to 2009. The data have a high point frequency (40 Hz) and are widely used in ice sheet monitoring in the Arctic and Antarctic regions [23]. ICESat-1 GLAS data were also used to explore the mass balance changes of glaciers in the Tibetan Plateau, and found that the annual mass loss of glaciers from 2003 to 2009 was −26 ± 12 Gt [24]. However, ICESat-1 data points in the mid-latitude region are sparse, which limits its use in the HMA. In addition, ICESat-1 stopped operation after 2009. ICESat-2 is a new generation of spaceborne lidar satellite equipped with an Advanced Topographic Laser Altimeter System (ATLAS). Since 2018, the ATLAS has provided abundant laser point data every year. Compared with ICESat-1 data, ICESat-2 data not only improves the observation accuracy but can also observe more glaciers in the same time span, thus providing more complete and accurate glacier elevation information [25,26,27]. Therefore, ICESat-2 provides a new perspective for monitoring inter-annual glacier elevation changes.
At the same time, it would be interesting to explore the intra-annual changes of glacier elevation. Seasonal meltwater from glaciers is a guarantee of water resources in the surrounding and downstream regions of the HMA, in particular in arid and semi-arid regions [28]. Many studies on glacier elevation changes in the HMA region have focused on the inter-annual variability, and studies on monthly/seasonal changes in glacier elevation are still lacking. Although many studies have estimated the intra-annual loss of glaciers, most studies infer monthly/seasonal glacier elevation changes based on relationships with precipitation rather than directly extracting glacier elevation information from satellites observations. Existing studies have shown that the timing of glacier accumulation or melting varies widely in different regions. For example, Ageta [29] found that most of the glaciers in the inner Tibetan Plateau thickened in summer based on continuous ground observations of some specific glaciers, but the spatial patterns still need to be understood to a large extent. Maussion et al. [30] discovered that most glaciers in Pamir and Spiti Lahaul thickened in winter, but they used a clustering algorithm based on monthly precipitation data to calculate monthly changes in glacier elevation, rather than using direct observations of monthly glacier elevation. Wang et al. [31] utilized ICESat-1 and Gravity Recovery and Climate Experiment (GRACE) data to explore seasonal changes of glaciers in the HMA. However, due to sensor failure, the ICESat-1 data could only be obtained two to three times every year [32], and most of them were concentrated in March, June and October, and could not provide observations for each month. However, studying monthly/seasonal changes of glaciers is of great significance for disaster warning and an in-depth understanding of the mechanism of glacier changes [31]. In short, none of the existing studies have analyzed glacier elevation changes on a monthly/seasonal scale [33]. The lack of existing observations and effective monitoring methods has limited researchers to accurately analyze the intra-annual variation of glacier elevation. The rich data volume of ICESat-2 data, along with the increase of laser point emission rate (10 KHz) and the number of laser point beams (six beams), provides a new perspective for exploring the intra-annual changes of glacier elevation.
Terrain factors, i.e., elevation, slope and aspect, have impacts on the glacier mass balance and changes [34]. In general, the lower the altitude, the more glacier mass is lost, and vice versa. Existing studies show that precipitation affects glacier accumulation [35]. It is found that the glaciers on the windward side of the mountain retreated less, which was attributed to the effective recharge produced by more precipitation than that on the leeward side of the mountain [36,37,38]. For example, Wang et al. [39] found that due to the influence of climatic conditions, the glaciers on the northern slope of the Tienshan Mountains decreased more than that on the southern slope. This may be because the precipitation brought by the westerly wind supplemented the mass loss of the glacier on the southern slope, resulting in less glacier mass loss. Therefore, it is important to consider terrain aspect and elevation when monitoring glacier elevation changes using laser point data. Previous studies have rarely considered topographical aspect effects when extracting changes in glacier elevation using ICESat-1&2 data.
The objectives of this study are:
- (1)
- To improve the analysis method for glacier elevation change by comprehensively considering the glacier terrain elevation and slope aspect.
- (2)
- To analyze the inter-annual differences in the rate of glacier elevation change.
- (3)
- To analyze the intra-annual differences in glacier elevation changes on a monthly/seasonal scale.
2. Study Area and Datasets
2.1. Study Area
The HMA (26°N~47°N, 65°E~104°E), located in the central Asia (Figure 1), with an average altitude of more than 4000 m. It is the birthplace of many major rivers in central Asia, East Asia, Southeast Asia and South Asia [40]. The HMA is located in the intersection of various climates. The south of HMA is mainly affected by the Indian monsoon [41], the west and northwest of HMA are mainly affected by the westerly wind, the east is mainly affected by the East Asian monsoon, and the central region is mainly affected by the continental climate. The HMA is sensitive to climate change. Previous studies have shown that a 1.5 °C increase in global temperature will lead to a 2.1 °C increase in the temperature in the Tibetan Plateau [11]. In addition, various types of glaciers are formed in the HMA region due to the dense mountains and complex topography. According to the Randolph Glacier Inventory (RGI) 6.0 glacier catalog data, there are about 100,000 glaciers in the HMA region, covering an area of nearly 100,000 square kilometers [42]. As these glaciers are less affected by human activities, their changes are largely driven by natural factors. Therefore, glacier change is an important indicator of global warming, and it is of great significance to explore the changes in the HMA glacier and its relationship with the climate variations.
2.2. Datasets
2.2.1. ICESat-1 Data
ICESat-1 is part of NASA’s earth observation system and the first satellite with a lidar sensor to monitor the earth’s elevation information. The GLAS onboard ICESat-1 satellite emits 40 Hz laser pulses vertically along the orbit and estimates the surface elevation from the round-trip time of the laser pulses. The vertical detection accuracy of the GLAS is less than 34 cm [44]. Its main scientific purpose is to observe changes in the glacier mass balance, cloud layer and vegetation features from 2003–2009. GLAS14 data is GLAS Level 2 altimetry data that includes the geographical location of the laser beam footprint and the correction parameters for elevation measurement. In this study, GLAS14 data was used to extract glacier elevation information at laser points, including elevation, longitude, latitude, ellipsoid correction parameters, etc. The data were downloaded from the National Snow & Ice Data Center (NSIDC) (https://nsidc.org/data/icesat, accessed on 1 1 September 2020).
2.2.2. ICESat-2 Data
ICESat-2 uses ATLAS to monitor the elevation information of the earth’s surface [45]. Compared to the ICESat-1 GLAS, the working technology of the ICESat-2 ATLAS is greatly improved. The ATLAS emits six laser beams at a time, divided into three groups. Each group consists of a strong laser beam and a weak laser beam. The energy ratio of the strong laser beam to the weak laser beam is about 4:1. The smaller spatial sampling interval (~0.7 m) and higher frequency (10 kHz) [27] of the ATLAS allow it to collect denser data points for more effective monitoring of glacier elevation changes. For example, the data points observed by ATLAS in 2020 can occupy about 30,000 glaciers in the HMA region, which is about nine times as many as all data points observed by GLAS in 2003–2008 (Figure 2). In addition, the ATLAS has higher detection accuracy; Zhang et al. [46] found that the ICESat-2 data can extract glacier elevation in the Qilian Mountains with an accuracy of 0.08 m compared with the data of Unmanned Aerial Vehicle (UAV). In the Antarctic area, the accuracy can reach 1–2 cm [47]. Brunt et al. [48] used the Global Navigation Satellite Systems (GNSS) to verify that the accuracy of ICESat-2 data in extracting the elevation change of Antarctic ice sheet was better than 3 cm. In this study, the ICESat-2 ATL06 data were used, including elevation, time, latitude, longitude, confidence parameters, etc. The data were downloaded from the NSIDC (https://nsidc.org/data/icesat-2, accessed on 1 June 2021).
2.2.3. SRTM DEM
SRTM uses Synthetic Aperture Radar (SAR) technology to collect the earth’s surface elevation data. It uses C-band Synthetic Aperture Radar (C-SAR) and X-band Synthetic Aperture Radar (X-SAR) to collect data of the earth’s environment. The earth’s surface elevation information from these data is converted to the height information specified in the DEM and used to create an accurate earth map. The revisit period of the SRTM mission is 11 days. Since February 2000, the SRTM has used the phase difference between two SAR images to calculate the DEM information from 60°N to 56°S [23]. It obtains the topographic information of 80% of the earth’s surface (except the Arctic and Antarctic) and 95% of the residential areas. In this study, the SRTM DEM from C-SAR data were used as the reference elevation to obtain the glacier surface elevation information of the HMA in 2000. The data were downloaded from the EARTHDATA platform (https://search.earthdata.nasa.gov/, accessed on 1 September 2020).
2.2.4. ERA5
The fifth-generation European Centre for Medium-Range Weather Forecasts (ECMWF) global climate and weather reanalysis v5 (ERA5) data were used to analyze the changes in temperature and precipitation in the HMA region over the past 20 years. The reanalysis process combined model data with observations from the world into a globally complete and consistent dataset. We extracted the temperature and precipitation data for the HMA region from 2003 to 2020. The temperature data is the air temperature at 2 m height above the surface of land, ocean or inland water; the precipitation data is the accumulated liquid and frozen water that falls on the earth’s surface, including rain and snow, but does not include fog, dew or moisture that evaporates in the atmosphere before reaching the earth’s surface. The data were downloaded from the ECMWF (https://www.ecmwf.int/en/forecasts/datasets/reanalysis-datasets/era5, accessed on 1 September 2021).
2.2.5. Auxiliary Data
This study used the Randolph Glacier Inventory (RGI 6.0) data to determine glacier boundaries. The RGI 6.0 data provide a global list of glaciers, with Landsat TM/ETM+ images as the primary data source, and interpreted with high-resolution imagery and topographic maps such as ASTER, IKONOS and Systeme Probatoire d’Observation de la Terre (SPOT) as supplementary data.
According to the regional division of HMA by Brun et al. [17], the HMA is divided into Bhutan, Nepal, Nyainqentanglha, Spiti Lahaul, Karakoram, West Kunlun, Tienshan, Inner TP (Tibetan Plateau), Pamir and Hindu Kush (Figure 1a). Additionally, using the “One Belt, One Road” boundary map of the major Asian river basins [43], the HMA is divided into 14 basins, namely Amu Darya, Brahmaputra, Ebinur and Manas river, Ili river, Shule and Heihe river, Indus river, Qiangtang Plateau, Mekong river, Qardam, Salween river, Issyk-Kul lake, Syr Darya, Tarim river and Yangtze, for analysis of changes in glacier elevation in basin scale (Figure 1b).
3. Methods
Since the ICESat-1&2 data are laser point data and the spatial distribution of the data points is not uniform in space, the ICESat-1&2 data therefore cannot provide pixel-wised information covering the entire surface of glacier like the ZY-3 stereo image pair data. The spatial distribution of ICESat-1&2 data points on each glacier differs due to different satellite overpassing tracks and different sensor laser beam trajectories. In addition, due to the different atmospheric conditions and different radiation energy received by glaciers in different elevation and orientations, the glacier mass balance will differ in different aspects at the same altitude. Based on the above reasons, this paper proposed an analysis method, namely “elevation-aspect bin analysis method”, to investigate glacier elevation changes by considering the glacier terrain elevation, slope aspect and the corresponding glacier areas.
Our research workflow consists of: (1) extraction of the elevation differences between the ICESat-1&2 data and the SRTM DEM data in the ICESat-1&2 footprint scale; (2) extraction of glacier elevation difference in 1° × 1° grids; (3) estimation of the change of glacier elevation in sub-regions or river basins; and (4) uncertainty analysis for the quantitative assessment of the influences of data errors, processing errors and other factors on the results. Figure 3 shows the specific workflow, and the method details are described in the following sections.
3.1. Extraction of Elevation Difference in the ICESat-1&2 Data Footprints
Due to the differences in reference ellipsoid for projection and differences in vertical reference system between ICESat-1&2 data and SRTM DEM data, we first need to convert the elevation datum to extract elevation change information and eliminate outliers. In this study, bilinear interpolation method was used to extract the elevation information of SRTM DEM data in the footprint of the ICESat-1&2 data. Two corrections were applied before the difference between the elevation from ICESat-1&2 data and from SRTM DEM data can be calculated: (1) The Topex/Poseidon ellipsoid used by ICESat-1 data was converted to the World Geodetic System 1984 (WGS84) ellipsoid used by ICESat-2 data and SRTM DEM data [49,50]. (2) The Earth Gravity Model (EGM) 1996 used by the SRTM DEM geoid elevation was converted to EGM2008 used by ICESat-1&2 data [35].
The glacier elevation change in each year, (in meter), at each footprint point can then be calculated by:
where (m) is the elevation from ICESt-1&2 data in a year “yr” after ellipsoid correction; (m) is the elevation from SRTM DEM data in 2000 after leveling correction and bilinear interpolation within the footprint of ICESat-1&2 data point; (m) is the penetration depth of the SRTM DEM data in the glacier region, we set as 2.4 m in this study according to [51].
To reduce the influence of slope, ICESat-1&2 data points in slopes greater than 30° were excluded according to [35,52]. To remove outliers affected by detector saturation, only ICESat-1 GLAS14 data flagged with class “0” or “1” in the data quality layer “satCorrFlg” were selected according to [53]. For ICESat-2 data, we only selected the data flagged with category “0” in the data quality layer “atl06_quality_summary” to ensure the data quality according to [48]. Additionally, we excluded the data points with elevation differences greater than 100 m between ICESat-1&2 data and the SRTM DEM data to eliminate the influence of outliers that were possibly introduced by cloud interference [35].
3.2. Extraction of Glacier Elevation Difference in 1° × 1° Grids
To reduce the uncertainty caused by the uneven spatial distribution of the ICESat-1&2 data points in each elevation and slope aspect on the results, the core idea of the “elevation-aspect bin analysis method” proposed in this paper is to calculate the glacier elevation change in each 1° × 1° grid according to the distribution of ICESat-1&2 data points in different elevations and slope aspects and respective glacier areas. The whole HMA is divided into 1° × 1° grids. In each 1° × 1° grid, the elevation is divided into elevation bins (denoted by i), each elevation bin is divided into 8 aspect bins (denoted by j) with an interval of 45°.
The elevation difference for each elevation bin in a 1° × 1° grid is calculated by:
where, and are the fraction of glacier area and the median of glacier elevation difference (between a target year and 2000) in aspect bin j of the elevation bin i in a 1° × 1° grid.
The elevation difference between a target year and the reference year 2000 in a 1° × 1° grid, , was the area-weighted average of elevation difference for all elevation bins and calculated as:
where is the fraction of glacier area of the elevation bin i in a 1° × 1° grid. Following the method in [35], we repeated the calculation using Equations (2) and (3) by setting 6 different intervals of elevation bin, i.e., 200 m, 300 m, 400 m, 500 m, 600 m and 700 m, and used the average of the six results as the final glacier elevation difference in each 1° × 1° grid. ICESat-1 and ICESat-2 data from September to November of each year in 2003–2008 and 2018–2020, respectively, were used for annual change calculation.
Monthly glacier elevation difference between all months in 2019–2020 and the reference year 2000 in each 1° × 1° grid was calculated in the same way using the “elevation-aspect bin” area-weighting method.
3.3. Estimation of Annual and Monthly Change of Glacier Elevation in Sub-Regions
The annual glacier elevation changes in a sub-region or a river basin, , was calculated by the area-weighted average of glacier elevation differences in all 1° × 1° grids in a sub-region or river basin as:
where is the ratio of glacier area of each 1° × 1° grid over the total glacier area in either a sub-region or a river basin.
Following the method used in Kääb et al. [54], the rate of change of glacier elevation over multiple years was calculated by applying robust linear regression to the time series of . This way, the rate of change in glacier elevation between 2003–2008 and between 2003–2020 were obtained using ICESat-1 and ICESat-2 data, respectively.
3.4. Error Analysis
It is difficult to directly assess the uncertainty of ICESat-1&2 and SRTM DEM data using ground data due to insufficient in situ measurements of glacier elevations. Factors affecting the accuracy of the results include the vertical height error of SRTM DEM data, the penetration depth error of SRTM DRM data in the glacier area and the error of ICESat-1&2 data itself. In this study, the uncertainty assessment method of glacier monitoring by Wang et al. [35] was adopted, as shown below:
where is the glacier elevation change error (m), σstd is the standard deviation of the result in different elevation bins (m). The σdh includes the SRTM DEM vertical deviation (<16 m), ICESat-1&2 error (centimeter and decimeter scale) and radar penetration error (meter scale). In this study, the absolute error of each ICSat-1/2 footprint point is set to 20 m.
The uncertainty of glacier elevation change rate is obtained by
where is the glacier elevation change rate error, σfit is the linear fitting error, σspat and σtemp are spatial and temporal sampling errors, σbias is the comparison bias and unknown system uncertainty of crustal uplift [55]. We followed Wang et al. [22] and set σspat, σtemp and σbias to 0.06 m/year in this study.
4. Results
This study analyzed the change in glacier elevation from two perspectives, inter-annual and intra-annual. In the first part, we investigated the change in glacier elevation at different altitudes and slope aspects (Section 4.1) and analyzed the spatial differences in the inter-annual rate of change in glacier elevation (Section 4.2). In the third part, we conducted monthly/seasonal study by analyzing the 24-month pattern of glacier elevation changes from January 2019 to December 2020 (Section 4.3).
4.1. Glacier Elevation Change in Different Elevations and Slope Aspects
Firstly, we analyzed the glacier elevation changes between 2000 (from SRTM DEM data) and 2020 (from ICESat-2 data) in different elevations and slope aspects in the HMA sub-regions according to the regional division of Brun et al. [17], as shown in Figure 1a. Overall, the glacier elevation changes (i.e., the glacier thickness change) between 2000 and 2020 decreased with increasing altitudes in all sub-regions of the HMA (Figure 4a), which is consistent with the findings of Ragettli et al. [56]. In addition, the accumulation and melting characteristics of glaciers also varied in different slope aspects (Figure 4b). In general, in most sub-regions, the glacier elevation changes on the southern slope decreased more than that on the northern slopes from 2000 to 2020, because the southern slopes received more solar radiation, resulting in more melting of the glaciers. However, different features were found in the Nyainqentangla Mountains, Bhutan, Nepal and the Tienshan Mountains. In the Nyainqentangla Mountains, the glaciers thinning on the northern slopes thinned more than that in the southwestern slopes. Additionally, in Bhutan, the glacier on the northern slopes thinned more than that on the eastern and southwestern slopes. The reason might be that these regions were strongly influenced by monsoon which brings abundant precipitation and leads to less reduction in glacier thickness on the windward sides [57]. In Nepal, for example, the southern slopes of the mountains are windward, and the glaciers on the southern slopes were replenished by precipitation from the Indian monsoon, resulting in less reduction in glacier thickness. Similarly, in the Tienshan Mountains, under the influence of the westerly winds, the glacier thickness on the southwestern slopes (windward) decreased less than that on the northeastern slopes. To sum up, the water vapor carried by monsoon will affect the melting rate of the glaciers in the HMA region, resulting in a large difference in the glacier elevation changes on different slope aspects, especially in the areas greatly affected by the monsoon.
4.2. Inter-Annual Change Rate of Glacier Elevation
4.2.1. Spatial Pattern of Annual Glacier Elevation Change Rate
To calculate inter-annual rate of change in glacier elevation, ICESat-1&2 data in autumn months (September–November) from 2003 to 2008 and from 2018 to 2020 were selected (procedure described in Section 3). Autumn was chosen for the annual trend analysis because the ICESat-1&2 and SRTM observations are less influenced by snow cover in this season [35,54]. The year 2009 was not included in the trend analysis due to too little data available in autumn to ensure reliable results (ICESat-1 eventually ceased work in 2010). Figure 5 showed the spatial distribution of the annual rate of change in glacier elevation in the HMA region from 2003 to 2008 and from 2003 to 2020, respectively. The detailed annual changes in glacier elevation and the respective error information were shown in Table A1. The results showed that the spatial variation of glacier elevation change rate in the HMA was very significant, and the change rate was very different in some areas between 2003–2008 and 2003–2020. The glacier elevations have thinned across much of the HMA region. For the entire HMA, the annual rate of change in glacier elevation from 2003 to 2008 and from 2003 to 2020 were −0.21 ± 0.12 m/year and −0.26 ± 0.11 m/year, respectively, indicating a faster thinning rate in recent years. In Nyainqentanglha, the annual glacier elevation change rate increased from −0.81 ± 0.15 m/year in 2003–2008 to −1.12 ± 0.13 m/year in 2003–2020, which is the region with the fastest glacier loss. The annual glacier change rate in the Tienshan Mountains increased from −0.27 ± 0.13 m/year in 2003–2008 to −0.33 ± 0.11 m/year in 2003–2020. In contrast, the rate of glacier thinning decreased significantly in the west HMA. For example, in the Pamir, the glacier elevations decreased by 0.22 m/year in 2003–2008 and 0.13 m/year in 2003–2020, indicating a slowing down trend in glacier thinning rate. Although the elevation of most glaciers generally decreased between 2003–2020, some glaciers in the inner region of HMA showed an increase in elevation. Previous studies found that glaciers in the West Kunlun was thickening [17]. Our results showed that in West Kunlun, the glacier elevation change rate was 0.18 ± 0.11 m/year in 2003–2020 and 0.10 ± 0.13 m/year in 2003–2008. As a summary of our results, the glacier thinning rate across the entire HMA is gradually accelerating, except for the West Kunlun, Karakoram, Pamir and Hindu Kush.
4.2.2. Glacier Elevation Change Rate in Basin Scale
The melting of the HMA glaciers has an important impact on the changes in river flow and water resources in the HMA and its downstream regions. Therefore, obtaining information on glaciers changes in different basins of the HMA is of great significance for understanding the changes of water resources in the HMA and its surrounding areas. We estimated the glacier elevation change rate in each basin of the HMA during 2003–2008 and 2003–2020 (Table 1) (method described in Section 3.3).
Due to the differences in temperature, precipitation, evapotranspiration and other factors in different basins, rates of changes in glacier elevations varied greatly in time and space (Table 1). The results in Table 1 showed that from 2003 to 2020, the glacier elevations in almost all basins of the HMA showed a decreasing trend, except for Tarim. From 2003 to 2020, the Mekong River basin experienced the fastest thinning of glaciers, followed by the Salween and Brahmaputra basins. However, we found that the rate of thinning of glaciers in the Indus, Syr Darya and Amu Darya river basins slowed down. We will analyze the reasons for this phenomenon in Section 5.2.1.
4.3. Intra-Annual Change of Glacier Elevation
The period of thickening or thinning of glaciers varied in different regions of the HMA due to climate and topography. In this section, the HMA was divided into eight sub-regions to explore the monthly/seasonal characteristics of the glacier elevation changes in the HMA caused by differences in glacier accumulation and melting over time. The eight sub-regions are Spiti Lahaul, Bhutan and Nepal, Nyainqentanglha mountain, West Kunlun, Pamir and Hindu Kush, Tienshan mountain, Karakoram and Inner TP (Tibetan Plateau). The ICESat-2 monthly data in 2019–2020 were used for monthly/seasonal analysis.
In this study, we found that the period of glacier thickening from the marginal regions of the HMA to the interior HMA was gradually delayed from autumn to summer. The results in Figure 6 revealed that in Pamir and Hindu Kush and Karakoram, glaciers showed similar seasonal changes in thickening in autumn (SON: September–October–November) or winter (DJF: December–January–February). In Pamir and Hindu Kush, although the glaciers were at their highest elevations in spring, significant glacier thickening occurred mainly in October–March, followed by a significant thinning period. The glaciers in Karakoram had almost the same seasonal variation as in Pamir and Hindu Kush, except for a sudden drop in elevation in July 2019, which might be attributed to relatively low precipitation and warmer temperatures in July 2019 (see the discussion in Section 5.2.2). In West Kunlun and Bhutan and Nepal, the glaciers exhibited similar seasonal thickening variation in spring (MAM: March–April–May) or summer (JJA: June–July–August). The glaciers in West Kunlun Mountains showed two accumulation periods with obvious thickening, i.e., in March–June and in July–September. In the Bhutan and Nepal regions, the month with the least glacier elevation decline in 2019–2020 occurred in July. In the inner TP, the glaciers did not show an obvious consistency of accumulation (or melting) in the two years, although the months with the highest glacier elevations appeared in the summer of the two years. In the Tienshan Mountains, the glacier elevations fluctuated greatly, the glacier thickening time was mainly concentrated from December to April, and there was a weak thickening trend from September to December. In Spiti Lahual, the southwest of the HMA, the glacier thickening period was mainly concentrated in winter and spring, with thinning in summer. The glacier elevations in the Nyainqentanglha Mountains reached their highest points in spring.
5. Discussion
5.1. Comparison with Existing Studies
5.1.1. Comparison of Inter-Annual Glacier Elevation Change Rate
We compared our results with those by other studies in each sub-region of the HMA (Figure 7). Overall, our results are consistent with most previous studies.
However, there are some discrepancies between our results and existing studies, which may be due to the use of different methods and data. As shown in Section 4.1, glacier elevation changes varied with elevations and slope aspects. As shown in Figure 4b, the glacier elevation changes on the east and west slopes of the Nyainqentanglha Mountains were different. At the same time, the distribution of ICESat-1&2 data points in different slope aspects will also affect the changes of glacier elevations. The ICESat-1&2 laser point data cannot be guaranteed to be evenly distributed in space. In general, a large area may have more data points. However, due to factors such as satellite orbit or cloud cover, the spatiotemporal distribution of available laser points is irregular. We selected the computing unit (i.e., one 1° × 1° grid) around the Yalong glacier (96°E~97°E, 29°N~30°N) to investigate the distribution of ICESat-2 data and found that the data volume of ICESat-2 data in 2020 in the eastern slopes is about 1.6 times of that in the western slopes, while the area of glaciers in the eastern slopes is only 1.2 times of that in the western slope. In brief, the distribution of ICESat-1&2 data points will be different in various slope aspects due to the influence of topography, climate and satellite operation mode, which in turn affects the accuracy of the results of glacier elevation changes. Therefore, in this study, elevation and aspect are both factors that must be considered simultaneously when calculating the glacier elevation change.
Existing studies have shown that the glacier thinning rate based on ICESat-1&2 data is greater than that based on stereo pair data in the Nyainqentanglha region [22,59]. However, with the exception of Nyainqentanglha region, the difference between our results in 2003–2020 and the results of Brun et al. [17] and Shean et al. [10], both using stereo pair data, is very small (within two standard deviations), indicating that our results of glacier elevation change rate are within an acceptable range.
5.1.2. Comparison of Intra-Annual Glacier Elevation Change
The results of this study are basically consistent with the existing studies (Table 2) on intra-annual variation of glacier elevation. In general, glaciers in the marginal regions of the HMA (the Tienshan Mountains, Spiti Lahaul, etc.) thicken in winter. However, similar to existing studies, the glaciers in Bhutan and Nepal have an obvious thickening trend in summer. This may be due to the accumulation of water vapor in the whole Tibet Plateau mainly in summer. The southern slopes of Bhutan and Nepal are affected by the strong monsoon from the Indian Ocean and the Bay of Bengal, with the most precipitation in summer [60]. The impacts of precipitation outweigh the impacts of temperature, leading to summer replenishment of glaciers in Himalayas. However, there are also large fluctuations in glacier elevation changes in Bhutan and Nepal. Our findings show that in 2019 the glaciers generally accumulated between January and June, while in 2020 the opposite was true, although the months with the highest glacier elevation were all in July. Kansakar et al. [61] found large variation in precipitation patterns in Nepal suggesting that there may be large differences in glacier elevation changes in the Himalayas Mountain, which is consistent with studies by Maussion et al. [30] and Wang et al. [31]. Similarly, the greater variability in the glacier elevation change in the Nyainqentanglha Mountains may be partly due to the influence of hydrothermal conditions, because the inter-annual variability of precipitation due to abnormal anticyclones in the northern Indian subcontinent and the Bay of Bengal varies greatly [62,63]. Different from the existing research, in the Tienshan Mountains, our results showed a clear trend of glacier thickening in autumn, although the glacier elevation in autumn was the lowest. This is mainly due to the large glacier loss from July to September. However, looking at the monthly distribution, we found a slight increase in autumn during the two-year period (September to December). The same phenomenon occurred in Nyainqentanglha, Pamir and Hindu Kush. This is also an advantage of our study based on monthly data from ICESat-2, as we could highlight the details between seasons. In short, using the ICESat-2 data, we can more precisely monitor the intra-annual changes in glacier elevation. However, when the analysis is carried out on a monthly/seasonal scale, the amount of data is reduced, which also affects the accuracy of regional results. For example, some glaciers may have only a few hundred points in a month, which may be the reason for the large fluctuations in glacier elevation change in some areas. Nevertheless, our method is a direct calculation of glacier elevation change that can represent the intra-annual variation pattern of glacier elevation. With the continuous observation by ICESat-2 satellite, we will obtain more accurate monthly/seasonal variation characteristics of glacier in the future.
5.2. Factors Controlling Glacier Elevation Change
5.2.1. Factors Controlling Inter-Annual Glacier Elevation Change Rate
Previous studies have shown that the sensitivity of glaciers to climate is the main controlling factor of the HMA glacier change [64]. The rate at which a glacier melts is related to the energy gain or loss on the glacier surface. The main factors affecting glacier changes include temperature and precipitation. Warmer temperatures will lead to accelerated glacier loss [65], while increased precipitation will compensate for glacier mass loss. To explore the factors affecting the changes of glacier thickness, we calculated the change of glacier elevation change rate from 2003 to 2020 and from 2003 to 2008 (Figure 8a), and used the ERA5 data to investigate the average temperature and precipitation changes in autumn in the HMA from 2003 to 2020 and from 2003 to 2008 (Figure 8b,c).
The result showed strong warming in the central and southeastern regions of the HMA, while the temperature decreased in the western, northwestern and southwestern regions. The precipitation in the HMA generally showed an overall increasing trend, but the increased precipitation was mainly concentrated in the Tienshan Mountains in the northwest of the HMA, the western part of the HMA, parts of the central HMA and southern edge of the HMA. Our study revealed that in the context of global warming, most glaciers in the HMA experienced accelerated mass loss. Spatially, the change of glacier elevation change rate in the Tienshan Mountains is consistent with the change in precipitation, indicating that the change of glaciers in the Tienshan Mountains may be more affected by precipitation. However, the rate of glacier thinning in the southwest of HMA has slowed down. Guo et al. [66] found that, compared with the warming trend (+0.18 °C/decade) of the Tibetan Plateau since 2001, the temperature in the southwest of the Tibetan Plateau decreased by 0.15 °C/decade, and we found that Pamir and Hindu Kush also appeared to have a similar pattern. Overall, a decrease in temperature (Figure 8b) and an increase in precipitation (Figure 8c) explained the slowing of glacier mass loss in the west HMA region. The analysis of climatic factors of precipitation and temperature showed that the regional pattern of glacier elevation changes was consistent with the patterns of precipitation and temperature. Existing studies showed that for every 1 degree increase in temperature, precipitation needs to increase by 25−35% to compensate for the impact of temperature on glaciers [67]. Both temperature and precipitation within the HMA are increasing overall, and while more precipitation can compensate for the mass loss of the glaciers, it is still far from being able to compensate for the overall melting of glaciers caused by the increase in temperature, which contributes to the accelerated glacier mass loss in most parts of the HMA.
5.2.2. Factors Controlling Intra-Annual Glacier Elevation Variation
The glaciers in the HMA region have multiple types of accumulation and ablation patterns, which are largely related to precipitation [68,69]. This study analyzed the monthly/seasonal variations in temperature and precipitation from January 2019 to December 2020. In all regions of the HMA, the temperature throughout the year showed a trend of first rising and then falling. The changes in precipitation can explain the characteristics of intra-annual glacier elevation variations (Figure 9).
For example, precipitation in the Himalayas has a clear upward trend in summer, which explains the accumulation of its glaciers in summer. In the Nyainqentanglha Mountains, the thickening of the glaciers in spring is attributed to that the concentration of about 20−40% of the precipitation in spring [70]. The strength and nature of the coupling between the monsoon system and the westerly system are important factors that cause precipitation changes. Glaciers in Pamir, Hindu Kush and Spiti Lahaul, located at the intersection zones of westerly and monsoon air flows, may be more sensitive to changes in weather and atmospheric circulation [30]. Compared with other regions, Spiti Lahaul and Pamir have significantly more precipitation in winter and spring, which is the reason for the thickening of glaciers here. April in particular is the rainiest month in Pamirs and in Spiti Lahaul from November to March, while the rest of the HMA is around July. As shown in Section 4.3, the overall trend of glacier elevation changes in Karakoram is similar to that in Pamir and Hindu Kush, except in July 2019, which may be due to less precipitation in July 2019. Existing studies have shown that in areas affected by the westerly climate, the precipitation in winter is more than that in summer [71]. At the same time, affected by the atmospheric circulation and the deviation of the earth’s rotation, the Tienshan Mountains, Pamir and Hindu Kush are mainly affected by the Atlantic southwesterly wind. Coupled with the barriers of mountains, the westerly wind in spring will bring sufficient precipitation here and reduce the mass loss of glaciers. For example, in Pamir and Hindu Kush, the glacier elevation is highest in spring, due to the continuous thickening of the glaciers from October to March. There is less glacier mass loss in spring as precipitation remains high from March to May. In conclusion, the difference of precipitation can explain the difference in the glacier accumulation in different regions of the HMA.
5.3. Advantages and Disadvantages of ICESat-1&2 Data in Estimating Glacier Elevation Change
The ICESat-1&2 data have high vertical detection accuracy, and their applications in the cryosphere will be worth exploring. The emergence of ICESat-1&2 data allows us to obtain a large amount of data every year or even every month, which provides us with an opportunity to understand the glacier changes at higher temporal resolutions (monthly/seasonal), which is of great significance to disaster prevention and rational use of water resources [24,72]. For example, the ICESat-2 data are observed more frequently and therefore have more data points in space, providing a new perspective for the monitoring changes in glacier elevation. Its main disadvantage is that the large orbital spacing in the middle latitudes [73]. As shown in Figure 2, the ICESat-1 GLAS data have less data density. Although the amount of ICESat-2 ATLAS data and glacier coverage have been greatly improved, it still cannot cover all glaciers completely, which is an unavoidable problem when using ICESat-1&2 data in mid latitudes. The number and spatial distribution of data points will directly affect the accuracy of the results. In some regions, the reduction in data volume can increase the uncertainty of the results. For example, in the monthly analysis in Section 4.3, there were only a few hundred points per month in some regions, resulting in large fluctuations in annual performance. The spatiotemporal sampling of the data will affect the accuracy of the results, especially the ICESat-1 data with a small amount of data. There is no doubt that the more complete the data points, the more reliable the results will be. In future study, systematic analysis should be carried out to explore the impact of the spatial distribution of the ICESat-1&2 data points on the accuracy of the results. The second disadvantage is that the orbital revisit positions of ICESat-1&2 are not constant, so the observation points of each orbit do not repeat at the same position. While the track crossing method or plane fitting method can help reduce uncertainty, these methods are mostly applicable to polar regions [74] and are not reliable in mid-latitudes. The method proposed in this paper can better calculate the glacier elevation changes, but the uncertainty of the ICESat-1&2 data itself cannot be eliminated compared with studies based on stereo image pairs.
It should be noted that the data record of ICESat-1&2 is short (2003–2008 & 2018-onwards), making it is difficult to draw ultimate and firm conclusions about the trend in glacier elevation changes. With more ICESat-2 data becomes available over time, the glacier thickness change and seasonal dynamics can be monitored with longer record and data of better quality.
6. Conclusions
This study applied the “elevation-aspect bin analysis method” to ICESat-1&2 data to estimate glacier elevation changes in the HMA region and explored the inter-annual and intra-annual changes of glacier elevation in the HMA. The main conclusions of this study are as follows: (1) The “elevation-aspect bin analysis method” can efficiently capture the glacier elevation change and reduce the uncertainty caused by uneven spatial distribution of data points of ICESat-1&2 observations. (2) The result of the inter-annual rate of change in glacier elevation in the HMA showed spatial heterogeneity. The glacier elevation in the marginal regions of HMA declined more (i.e., thinned faster), while the elevation of the glaciers in West Kunlun rose. The declined rate of glacier elevation in the HMA in 2003–2020 (−0.26 ± 0.11 m/year) was faster than that in 2003–2008 (−0.21 ± 0.12 m/year). Glacier retreat is accelerating in all regions of the HMA except in the western part of the HMA. The regional variability of the glacier elevation change rate from 2003 to 2020 was large, ranging from −1.12 ± 0.13 m/year in the Nyaingentanglha Mountains to +0.18 ± 0.11 m/year in the West Kunlun Mountains. (3) For the intra-annual variation of glacier elevation, the results show that glacier elevation change has spatial heterogeneity, and the glacier thickening period is gradually delayed from the marginal regions to inner regions of the HMA. The glaciers in the Spiti Lahaul (December to March) and the Tienshan Mountains (September to April) tend to thicken during winter to spring, while glacier elevation in the Tienshan Mountains tends to rise slightly in autumn. The glaciers in Pamir and Hindu Kush (October to March) and Karakoram (October to January) thicken during winter. The glaciers in Nyainqentanglha thicken during spring (October to April or June). The glaciers in West Kunlun, Inner TP and Bhutan and Nepal thicken in spring and summer. West Kunlun has two accumulation periods (March–June and July–September). The glaciers in the Bhutan and Nepal (February to July) thicken in spring and summer, with elevation peaking in July. The glacier elevation in Inner TP reaches the highest level in June or July, but the accumulation trend is not obvious. In addition, the factors affecting glacier elevation changes are analyzed and the results indicate that the inter-annual and intra-annual changes in glacier elevation are consistent with the changes in air temperature or precipitation patterns.
Author Contributions
Conceptualization, C.S. and L.J.; methodology, C.S., L.J. and S.R.; software, C.S.; validation, C.S. formal analysis, C.S. and L.J.; investigation, C.S. and L.J.; resources, L.J. and C.S; data curation, C.S., L.J.; writing—original draft preparation, C.S.; writing—review and editing, C.S., L.J. and S.R.; visualization, C.S.; supervision, L.J.; project administration, L.J.; funding acquisition, L.J. All authors have read and agreed to the published version of the manuscript.
Funding
This research was funded jointly by the Second Tibetan Plateau Scientific Expedition and Research Program (STEP) (grant no. 2019QZKK0103); the projects of National Natural Science Foundation of China (grant no. 91737205, 42171039); the Strategic Priority Research Program of the Chinese Academy of Sciences (grant no. XDA19070102); the MOST High-Level Foreign Expert program (grant no. GL20200161002).
Conflicts of Interest
The authors declare no conflict of interest.
Appendix A

Table A1.
The annual elevation difference and error of glaciers in each region of HMA based on ICESat-1&2 data and SRTM DEM data (m). The errors are the values of standard deviation of spatial glacier elevation difference in the corresponding years calculated by Equation (5) at 1σ level.
Table A1.
The annual elevation difference and error of glaciers in each region of HMA based on ICESat-1&2 data and SRTM DEM data (m). The errors are the values of standard deviation of spatial glacier elevation difference in the corresponding years calculated by Equation (5) at 1σ level.
| Region | 2003 | 2004 | 2005 | 2006 | 2007 | 2008 | 2018 | 2019 | 2020 |
|---|---|---|---|---|---|---|---|---|---|
| Bhutan | −2.1 ± 1.63 | 0.69 ± 1.3 | 0.52 ± 1.53 | 0.11 ± 1.51 | −1.33 ± 1.74 | −1.21 ± 1.08 | −8.46 ± 0.89 | −8.92 ± 0.46 | −9.19 ± 0.61 |
| East Nepal | −1.67 ± 1.06 | −1.64 ± 1.07 | −2.86 ± 1.13 | −2.70 ± 1.17 | −2.70 ± 1.18 | −1.99 ± 1.04 | −9.34 ± 0.3 | −10.84 ± 0.36 | −9.86 ± 0.22 |
| Hindu Kush | −2.51 ± 0.69 | −2.27 ± 1.01 | −1.85 ± 0.91 | −2.57 ± 1.1 | −3.62 ± 0.93 | −3.55 ± 1.32 | −4.87 ± 0.21 | −5.37 ± 0.16 | −4.83 ± 0.35 |
| Inner TP | −0.36 ± 0.41 | −0.53 ± 0.55 | −0.35 ± 0.53 | −1 ± 0.59 | −0.9 ± 0.55 | −0.62 ± 0.48 | −4.22 ± 0.19 | −4.59 ± 0.15 | −4.78 ± 0.12 |
| Karakoram | 2.33 ± 0.46 | 1.98 ± 0.57 | 3.37 ± 0.56 | 3.65 ± 0.6 | 2.23 ± 0.55 | 1.38 ± 0.47 | −0.15 ± 0.17 | 1.76 ± 0.15 | 2.02 ± 0.11 |
| West Kunlun | 2.28 ± 0.47 | 2.02 ± 0.63 | 3.19 ± 0.637 | 2.16 ± 0.63 | 2.23 ± 0.63 | 3.04 ± 0.62 | 4.60 ± 0.62 | 5.10 ± 0.26 | 4.92 ± 0.13 |
| Nyainqentanglha | −1.12 ± 0.76 | −0.66 ± 0.94 | −2.13 ± 0.89 | −3.38 ± 0..99 | −4.48 ± 1.36 | −4.28 ± 0.92 | −16.13 ± 0.8 | −18.18 ± 0.38 | −19.52 ± 0.49 |
| Pamir | −1.12 ± 0.61 | −1.09 ± 0.75 | −0.43 ± 0.72 | −1.68 ± 0.97 | −1.90 ± 0.65 | −2.14 ± 0.78 | −2.68 ± 0.3 | −3.35 ± 0.13 | −3.37 ± 0.19 |
| Tienshan | 0.25 ± 0.5 | −0.18 ± 0.58 | 0.48 ± 0.55 | −0.47 ± 0.54 | −0.39 ± 0.57 | −1.39 ± 0.54 | −4.99 ± 0.2 | −4.94 ± 0.15 | −4.68 ± 0.16 |
| West Nepal | −2.08 ± 0.79 | −3.15 ± 0.95 | −2.58 ± 0.97 | −3.17 ± 1.04 | −3.35 ± 0.99 | −3.54 ± 0.9 | −10.96 ± 0.21 | −10.47 ± 0.19 | −11.35 ± 0.23 |
| Spiti Lahaul | −1.10 ± 0.6 | −1.55 ± 0.76 | −0.93 ± 0.81 | −1.76 ± 0.73 | −2.94 ± 0.76 | −2.98 ± 0.75 | −7.82 ± 0.26 | −7.53 ± 0.15 | −8.74 ± 0.27 |
| HMA | 0.11 ± 0.17 | −0.07 ± 0.22 | 0.48 ± 0.2 | −0.15 ± 0.24 | −0.71 ± 0.23 | −0.87 ± 0.25 | −3.63 ± 0.11 | −3.85 ± 0.04 | −4.06 ± 0.04 |
References
- Ai, B.-B.; Qin, C.-Z.; Ye, Q.; Zhu, A.-X.; Cogley, G. An approach to extracting surface supply relationships between glaciers and lakes on the Tibetan Plateau. Int. J. Digit. Earth 2017, 11, 1151–1165. [Google Scholar] [CrossRef]
- Immerzeel, W.W.; Van Beek, L.P.H.; Bierkens, M.F.P. Climate change will affect the Asian Water Towers. Science 2010, 328, 1382–1385. [Google Scholar] [CrossRef] [PubMed]
- Raper, S.C.B.; Braithwaite, R. Low sea level rise projections from mountain glaciers and icecaps under global warming. Nature 2006, 439, 311–313. [Google Scholar] [CrossRef]
- Millan, R.; Mouginot, J.; Rabatel, A.; Morlighem, M. Ice velocity and thickness of the world’s glaciers. Nat. Geosci. 2022, 15, 124–129. [Google Scholar] [CrossRef]
- Jacob, T.; Wahr, J.M.; Pfeffer, W.T.; Swenson, S.C. Recent contributions of glaciers and ice caps to sea level rise. Nature 2012, 482, 514–518. [Google Scholar] [CrossRef] [PubMed]
- Kaser, G.; Groβhauser, M.; Marzeion, B. Contribution potential of glaciers to water availability in different climate regimes. Proc. Natl. Acad. Sci. USA 2010, 107, 20223–20227. [Google Scholar] [CrossRef] [PubMed] [Green Version]
- Liang, L.; Cuo, L.; Liu, Q. Long-Term Temporal Scale-Dependent Warming Effects on the Mass Balance in the Dongkemadi Glacier, Tibetan Plateau. J. Geophys. Res. Atmos. 2020, 125. [Google Scholar] [CrossRef]
- Xiao, C.-D.; Wang, S.-J.; Qin, D.-H. A preliminary study of cryosphere service function and value evaluation. Adv. Clim. Chang. Res. 2015, 6, 181–187. [Google Scholar] [CrossRef]
- Huss, M.; Hock, R. Global-scale hydrological response to future glacier mass loss. Nat. Clim. Chang. 2018, 8, 135–140. [Google Scholar] [CrossRef] [Green Version]
- Shean, D.E.; Bhushan, S.; Montesano, P.; Rounce, D.R.; Arendt, A.; Osmanoglu, B. A Systematic, Regional Assessment of High Mountain Asia Glacier Mass Balance. Front. Earth Sci. 2020, 7, 363. [Google Scholar] [CrossRef] [Green Version]
- Kraaijenbrink, P.; Bierkens, M.F.; Lutz, A.; Immerzeel, W. Impact of a global temperature rise of 1.5 degrees Celsius on Asia’s glaciers. Nature 2017, 549, 257–260. [Google Scholar] [CrossRef]
- Gardelle, J.; Berthier, E.; Arnaud, Y.; Kääb, A. Region-wide glacier mass balances over the Pamir-Karakoram-Himalaya during 1999–2011. Cryosphere 2013, 7, 1263–1286. [Google Scholar] [CrossRef] [Green Version]
- Bajracharya, S.R.; Maharjan, S.B.; Shrestha, F. The status and decadal change of glaciers in Bhutan from the 1980s to 2010 based on satellite data. Ann. Glaciol. 2014, 55, 159–166. [Google Scholar] [CrossRef] [Green Version]
- Wu, K.; Liu, S.; Jiang, Z.; Xu, J.; Wei, J.; Guo, W. Recent glacier mass balance and area changes in the Kangri Karpo Mountains from DEMs and glacier inventories. Cryosphere 2018, 12, 103–121. [Google Scholar] [CrossRef] [Green Version]
- Paul, F.; Bolch, T.; Kääb, A.; Nagler, T.; Nuth, C.; Scharrer, K.; Shepherd, A.; Strozzi, T.; Ticconi, F.; Bhambri, R.; et al. The glaciers climate change initiative: Methods for creating glacier area, elevation change and velocity products. Remote Sens. Environ. 2015, 162, 408–426. [Google Scholar] [CrossRef] [Green Version]
- Ren, S.; Menenti, M.; Jia, L.; Zhang, J.; Zhang, J.; Li, X. Glacier Mass Balance in the Nyainqentanglha Mountains between 2000 and 2017 Retrieved from ZiYuan-3 Stereo Images and the SRTM DEM. Remote Sens. 2020, 12, 864. [Google Scholar] [CrossRef] [Green Version]
- Brun, F.; Berthier, E.; Wagnon, P.; Kääb, A.; Treichler, D. A spatially resolved estimate of High Mountain Asia glacier mass balances from 2000 to 2016. Nat. Geosci. 2017, 10, 668–673. [Google Scholar] [CrossRef]
- Dehecq, A.; Gourmelen, N.; Trouve, E. Deriving large-scale glacier velocities from a complete satellite archive: Application to the Pamir–Karakoram–Himalaya. Remote Sens. Environ. 2015, 162, 55–66. [Google Scholar] [CrossRef] [Green Version]
- Yin, B.; Zeng, J.; Zhang, Y.; Huai, B.; Wang, Y. Recent Kyagar glacier lake outburst flood frequency in Chinese Karakoram unprecedented over the last two centuries. Nat. Hazards 2018, 95, 877–881. [Google Scholar] [CrossRef]
- Bhambri, R.; Hewitt, K.; Kawishwar, P.; Pratap, B. Surge-type and surge-modified glaciers in the Karakoram. Sci. Rep. 2017, 7, 15391. [Google Scholar] [CrossRef]
- Rankl, M.; Kienholz, C.; Braun, M. Glacier changes in the Karakoram region mapped by multimission satellite imagery. Cryosphere 2014, 8, 977–989. [Google Scholar] [CrossRef] [Green Version]
- Wang, Q.; Yi, S.; Sun, W. Continuous Estimates of Glacier Mass Balance in High Mountain Asia Based on ICESat-1,2 and GRACE/GRACE Follow-On Data. Geophys. Res. Lett. 2021, 48, e2020GL09095. [Google Scholar] [CrossRef]
- Nuth, C.; Kääb, A. Co-registration and bias corrections of satellite elevation data sets for quantifying glacier thickness change. Cryosphere 2011, 5, 271–290. [Google Scholar] [CrossRef] [Green Version]
- Gardner, A.S.; Moholdt, G.; Cogley, J.G.; Wouters, B.; Arendt, A.A.; Wahr, J.; Berthier, E.; Hock, R.; Pfeffer, W.T.; Kaser, G.; et al. A Reconciled Estimate of Glacier Contributions to Sea Level Rise: 2003 to 2009. Science 2013, 340, 852–857. [Google Scholar] [CrossRef] [PubMed] [Green Version]
- Yuan, C.; Gong, P.; Bai, Y. Performance Assessment of ICESat-2 Laser Altimeter Data for Water-Level Measurement over Lakes and Reservoirs in China. Remote Sens. 2020, 12, 770. [Google Scholar] [CrossRef] [Green Version]
- Ma, Y.; Xu, N.; Liu, Z.; Yang, B.; Yang, F.; Wang, X.H.; Li, S. Satellite-derived bathymetry using the ICESat-2 lidar and Sentinel-2 imagery datasets. Remote Sens. Environ. 2020, 250, 112047. [Google Scholar] [CrossRef]
- Neumann, T.A.; Martino, A.J.; Markus, T.; Bae, S.; Bock, M.R.; Brenner, A.C.; Brunt, K.M.; Cavanaugh, J.; Fernandes, S.T.; Hancock, D.W.; et al. The Ice, Cloud, and Land Elevation Satellite—2 mission: A global geolocated photon product derived from the Advanced Topographic Laser Altimeter System. Remote Sens. Environ. 2019, 233, 111325. [Google Scholar] [CrossRef]
- Pritchard, H.D. Asia’s glaciers are a regionally important buffer against drought. Nature 2017, 545, 169–174. [Google Scholar] [CrossRef]
- Ageta, Y. Characteristics of mass balance of summer-accumulation type glaciers in the Himalayas and Tibetan Plateau. Z. Fur Gletsch. Und Glazialgeol. 1996, 32, 61–65. [Google Scholar]
- Maussion, F.; Scherer, D.; Mölg, T.; Collier, E.; Curio, J.; Finkelnburg, R. Precipitation Seasonality and Variability over the Tibetan Plateau as Resolved by the High Asia Reanalysis. J. Clim. 2013, 27, 1910–1927. [Google Scholar] [CrossRef] [Green Version]
- Wang, Q.; Yi, S.; Chang, L.; Sun, W. Large-Scale Seasonal Changes in Glacier Thickness across High Mountain Asia. Geophys. Res. Lett. 2017, 44, 10427–10435. [Google Scholar] [CrossRef]
- Schutz, B.E.; Zwally, H.J.; Shuman, C.A.; Hancock, D.; DiMarzio, J.P. Overview of the ICESat Mission. Geophys. Res. Lett. 2005, 32, L21S01. [Google Scholar] [CrossRef] [Green Version]
- Zhang, G.; Yao, T.; Shum, C.K.; Yi, S.; Yang, K.; Xie, H.; Feng, W.; Bolch, T.; Wang, L.; Behrangi, A.; et al. Lake volume and groundwater storage variations in Tibetan Plateau’s endorheic basin. Geophys. Res. Lett. 2017, 44, 5550–5560. [Google Scholar] [CrossRef]
- Kaldybayev, A.; Chen, Y.; Vilesov, E. Glacier change in the Karatal river basin, Zhetysu (Dzhungar) Alatau, Kazakhstan. Ann. Glaciol. 2016, 57, 11–19. [Google Scholar] [CrossRef] [Green Version]
- Wang, Q.; Yi, S.; Sun, W. Precipitation-driven glacier changes in the Pamir and Hindu Kush mountains. Geophys. Res. Lett. 2017, 44, 2817–2824. [Google Scholar] [CrossRef]
- Yao, T.D.; Thompson, L.; Yang, W.; Yu, W.S.; Gao, Y.; Guo, X.J.; Yang, X.X.; Duan, K.Q.; Zhao, H.B.; Xu, B.Q.; et al. Different glacier status with atmospheric circulations in Tibetan Plateau and surroundings. Nat. Clim. Chang. 2012, 2, 663–667. [Google Scholar] [CrossRef]
- Lin, H.; Li, G.; Cuo, L.; Hooper, A.; Ye, Q. A decreasing glacier mass balance gradient from the edge of the Upper Tarim Basin to the Karakoram during 2000–2014. Sci. Rep. 2017, 7, 6712. [Google Scholar] [CrossRef]
- Zhang, Z.; Liu, S.Y. Area Changes and Mass Balance of Glaciers in KangzhagRi of the Tibetan Plateau from 1970 to 2016 Derived from Remote Sensing Data. J. Geo-Inf. Sci. 2018, 20, 1338–1349. [Google Scholar] [CrossRef]
- Wang, S.; Zhang, M.; Li, Z.; Wang, F.; Li, H.; Li, Y.; Huang, X. Glacier area variation and climate change in the Chinese Tianshan Mountains since 1960. J. Geogr. Sci. 2011, 21, 263–273. [Google Scholar] [CrossRef]
- Nuimura, T.; Sakai, A.; Taniguchi, K.; Nagai, H.; Lamsal, D.; Tsutaki, S.; Kozawa, A.; Hoshina, Y.; Takenaka, S.; Omiya, S.; et al. The GAMDAM glacier inventory: A quality-controlled inventory of Asian glaciers. Cryosphere 2015, 9, 849–864. [Google Scholar] [CrossRef] [Green Version]
- Webster, P.J.; Magaña, V.O.; Palmer, T.; Shukla, J.; Tomas, R.A.; Yanai, M.; Yasunari, T. Monsoons: Processes, predictability, and the prospects for prediction. J. Geophys. Res. Earth Surf. 1998, 103, 14451–14510. [Google Scholar] [CrossRef]
- Mu, J. The global glacierized area: Current situation and recent change, based on the Randolph Glacier Inventory(RGI6.0) published in 2017. J. Glaciol. Geocryol. 2018, 440, 238–248. [Google Scholar] [CrossRef]
- Ran, Y.; Wang, L.; Zeng, T.; Ge, C.; Li, H. “One belt, one road” boundary map of key basins in Asia. National Tibetan Plateau Data Center 2020. In Proceedings of the 22nd EGU General Assembly, held online, 4–8 May 2020. [Google Scholar] [CrossRef]
- Magruder, L.A.; Webb, C.E.; Urban, T.J.; Silverberg, E.C.; Schutz, B.E. ICESat Altimetry Data Product Verification at White Sands Space Harbor. IEEE Trans. Geosci. Remote Sens. 2007, 45, 147–155. [Google Scholar] [CrossRef]
- Markus, T.; Neumann, T.; Martino, A.; Abdalati, W.; Brunt, K.; Csatho, B.; Farrell, S.; Fricker, H.; Gardner, A.; Harding, D.; et al. The Ice, Cloud, and land Elevation Satellite-2 (ICESat-2): Science requirements, concept, and implementation. Remote Sens. Environ. 2017, 190, 260–273. [Google Scholar] [CrossRef]
- Zhang, Y.; Pang, Y.; Cui, D.; Ma, Y.; Chen, L. Accuracy Assessment of the ICESat-2/ATL06 Product in the Qilian Mountains Based on CORS and UAV Data. IEEE J. Sel. Top. Appl. Earth Obs. Remote Sens. 2020, 14, 1558–1571. [Google Scholar] [CrossRef]
- Li, R.; Li, H.; Hao, T.; Qiao, G.; Cui, H.; He, Y.; Hai, G.; Xie, H.; Cheng, Y.; Li, B. Assessment of ICESat-2 ice surface elevations over the Chinese Antarctic Research Expedition (CHINARE) route, East Antarctica, based on coordinated multi-sensor observations. Cryosphere 2021, 15, 3083–3099. [Google Scholar] [CrossRef]
- Brunt, K.M.; Neumann, T.A.; Smith, B.E. Assessment of ICESat-2 Ice Sheet Surface Heights, Based on Comparisons Over the Interior of the Antarctic Ice Sheet. Geophys. Res. Lett. 2019, 46, 13072–13078. [Google Scholar] [CrossRef] [Green Version]
- Wang, Q.; Yi, S.; Sun, W. The changing pattern of lake and its contribution to increased mass in the Tibetan Plateau derived from GRACE and ICESat data. Geophys. J. Int. 2016, 207, 528–541. [Google Scholar] [CrossRef] [Green Version]
- Zhang, G.; Chen, W.; Xie, H. Tibetan Plateau’s Lake Level and Volume Changes from NASA’s ICESat/ICESat-2 and Landsat Missions. Geophys. Res. Lett. 2019, 46, 13107–13118. [Google Scholar] [CrossRef]
- Li, C.; Jiang, L.; Liu, L.; Wang, H. Regional and Altitude-Dependent Estimate of the SRTM C/X-Band Radar Penetration Difference on High Mountain Asia Glaciers. IEEE J. Sel. Top. Appl. Earth Obs. Remote Sens. 2021, 14, 4244–4253. [Google Scholar] [CrossRef]
- Wu, H.; Guo, Z. Characteristics of ICESat-GLAS full waveforms and the errors of GLAS footprints elevation change influenced by the surface slope and roughness. Geogr. Geo-Inf. Sci. 2016, 32, 02S03. [Google Scholar] [CrossRef]
- Huang, T.; Jia, L.; Menenti, M.; Lu, J.; Zhou, J.; Hu, G. A New Method to Estimate Changes in Glacier Surface Elevation Based on Polynomial Fitting of Sparse ICESat—GLAS Footprints. Sensors 2017, 17, 1803. [Google Scholar] [CrossRef] [PubMed] [Green Version]
- Kääb, A.; Berthier, E.; Nuth, C.; Gardelle, J.; Arnaud, Y. Contrasting patterns of early twenty-first-century glacier mass change in the Himalayas. Nature 2012, 488, 495–498. [Google Scholar] [CrossRef] [PubMed]
- Moholdt, G.; Wouters, B.; Gardner, A. Recent mass changes of glaciers in the Russian High Arctic. Geophys. Res. Lett. 2012, 39. [Google Scholar] [CrossRef] [Green Version]
- Ragettli, S.; Bolch, T.; Pellicciotti, F. Heterogeneous glacier thinning patterns over the last 40 years in Langtang Himal, Nepal. Cryosphere 2016, 10, 2075–2097. [Google Scholar] [CrossRef] [Green Version]
- Romatschke, U.; Houze, R.A. Characteristics of Precipitating Convective Systems in the South Asian Monsoon. J. Hydrometeorol. 2011, 12, 3–26. [Google Scholar] [CrossRef]
- Kääb, A.; Treichler, D.; Nuth, C.; Berthier, E. Brief Communication: Contending estimates of 2003–2008 glacier mass balance over the Pamir–Karakoram–Himalaya. Cryosphere 2015, 9, 557–564. [Google Scholar] [CrossRef] [Green Version]
- Zhao, F.; Long, D.; Li, X.; Huang, Q.; Han, P. Rapid glacier mass loss in the Southeastern Tibetan Plateau since the year 2000 from satellite observations. Remote Sens. Environ. 2022, 270, 112853. [Google Scholar] [CrossRef]
- Wu, G.; Liu, Y.; He, B.; Bao, Q.; Duan, A.; Jin, F.-F. Thermal Controls on the Asian Summer Monsoon. Sci. Rep. 2012, 2, 404. [Google Scholar] [CrossRef] [Green Version]
- Kansakar, S.R.; Hannah, D.M.; Gerrard, J.; Rees, G. Spatial pattern in the precipitation regime of Nepal. Int. J. Clim. 2004, 24, 1645–1659. [Google Scholar] [CrossRef]
- Chen, B.; Xu, X.-D.; Yang, S.; Zhang, W. On the origin and destination of atmospheric moisture and air mass over the Tibetan Plateau. Theor. Appl. Climatol. 2012, 110, 423–435. [Google Scholar] [CrossRef]
- Feng, L.; Zhou, T. Water vapor transport for summer precipitation over the Tibetan Plateau: Multidata set analysis. J. Geophys. Res. Earth Surf. 2012, 117, D20. [Google Scholar] [CrossRef] [Green Version]
- Fujita, K.; Ohta, T.; Ageta, Y. Characteristics and climatic sensitivities of runoff from a cold-type glacier on the Tibetan Plateau. Hydrol. Process. 2007, 21, 2882–2891. [Google Scholar] [CrossRef]
- Wang, J.; Ye, B.; Cui, Y.; He, X.; Yang, G. Spatial and temporal variations of albedo on nine glaciers in western China from 2000 to 2011. Hydrol. Process. 2014, 28, 3454–3465. [Google Scholar] [CrossRef]
- Guo, D.; Sun, J.; Yang, K.; Pepin, N.; Xu, Y.; Xu, Z.; Wang, H. Satellite data reveal southwestern Tibetan plateau cooling since 2001 due to snow-albedo feedback. Int. J. Clim. 2019, 40, 1644–1655. [Google Scholar] [CrossRef]
- Oerlemans, J. Extracting a Climate Signal from 169 Glacier Records. Science 2005, 308, 675–677. [Google Scholar] [CrossRef] [Green Version]
- Fujita, K. Effect of precipitation seasonality on climatic sensitivity of glacier mass balance. Earth Planet. Sci. Lett. 2008, 276, 14–19. [Google Scholar] [CrossRef]
- Shi, Y.; Liu, S. Estimation on the response of glaciers in China to the global warming in the 21st century. Chin. Sci. Bull. 2000, 45, 668–672. [Google Scholar] [CrossRef]
- Ouyang, L.; Yang, K.; Lu, H.; Chen, Y.; La, Z.; Zhou, X.; Wang, Y. Ground-Based Observations Reveal Unique Valley Precipitation Patterns in the Central Himalaya. J. Geophys. Res. Atmos. 2020, 125. [Google Scholar] [CrossRef]
- Huang, W.; Chen, F.; Feng, S.; Chen, J.; Zhang, X. Interannual precipitation variations in the mid-latitude Asia and their association with large-scale atmospheric circulation. Chin. Sci. Bull. 2013, 58, 3962–3968. [Google Scholar] [CrossRef] [Green Version]
- Bolch, T. Asian glaciers are a reliable water source. Nature 2017, 545, 161–162. [Google Scholar] [CrossRef] [PubMed] [Green Version]
- Treichler, D.; Kääb, A. ICESat laser altimetry over small mountain glaciers. Cryosphere 2016, 10, 2129–2146. [Google Scholar] [CrossRef] [Green Version]
- Moholdt, G.; Nuth, C.; Hagen, J.O.; Kohler, J. Recent elevation changes of Svalbard glaciers derived from ICESat laser altimetry. Remote Sens. Environ. 2010, 114, 2756–2767. [Google Scholar] [CrossRef]
Figure 1.
Overview of the High Mountain Asia with background image as elevation above sea level. The white regions in the HMA are the glacier areas. The blue, black and red arrows show the climate-influencing sphere of the Westerly, East Asian monsoon and Indian monsoon, respectively. (a) The HMA sub-regions according to the regional division of Brun et al. [17]; (b) Major river basins in the HMA according to [43].

Figure 2.
Comparison of observation capabilities by ICESat-1 and ICESat-2: the number of glaciers and the total area of glaciers in the HMA region observed by ICESat-1 data in 2003–2008 and by ICESat-2 data in 2020.
Figure 2.
Comparison of observation capabilities by ICESat-1 and ICESat-2: the number of glaciers and the total area of glaciers in the HMA region observed by ICESat-1 data in 2003–2008 and by ICESat-2 data in 2020.
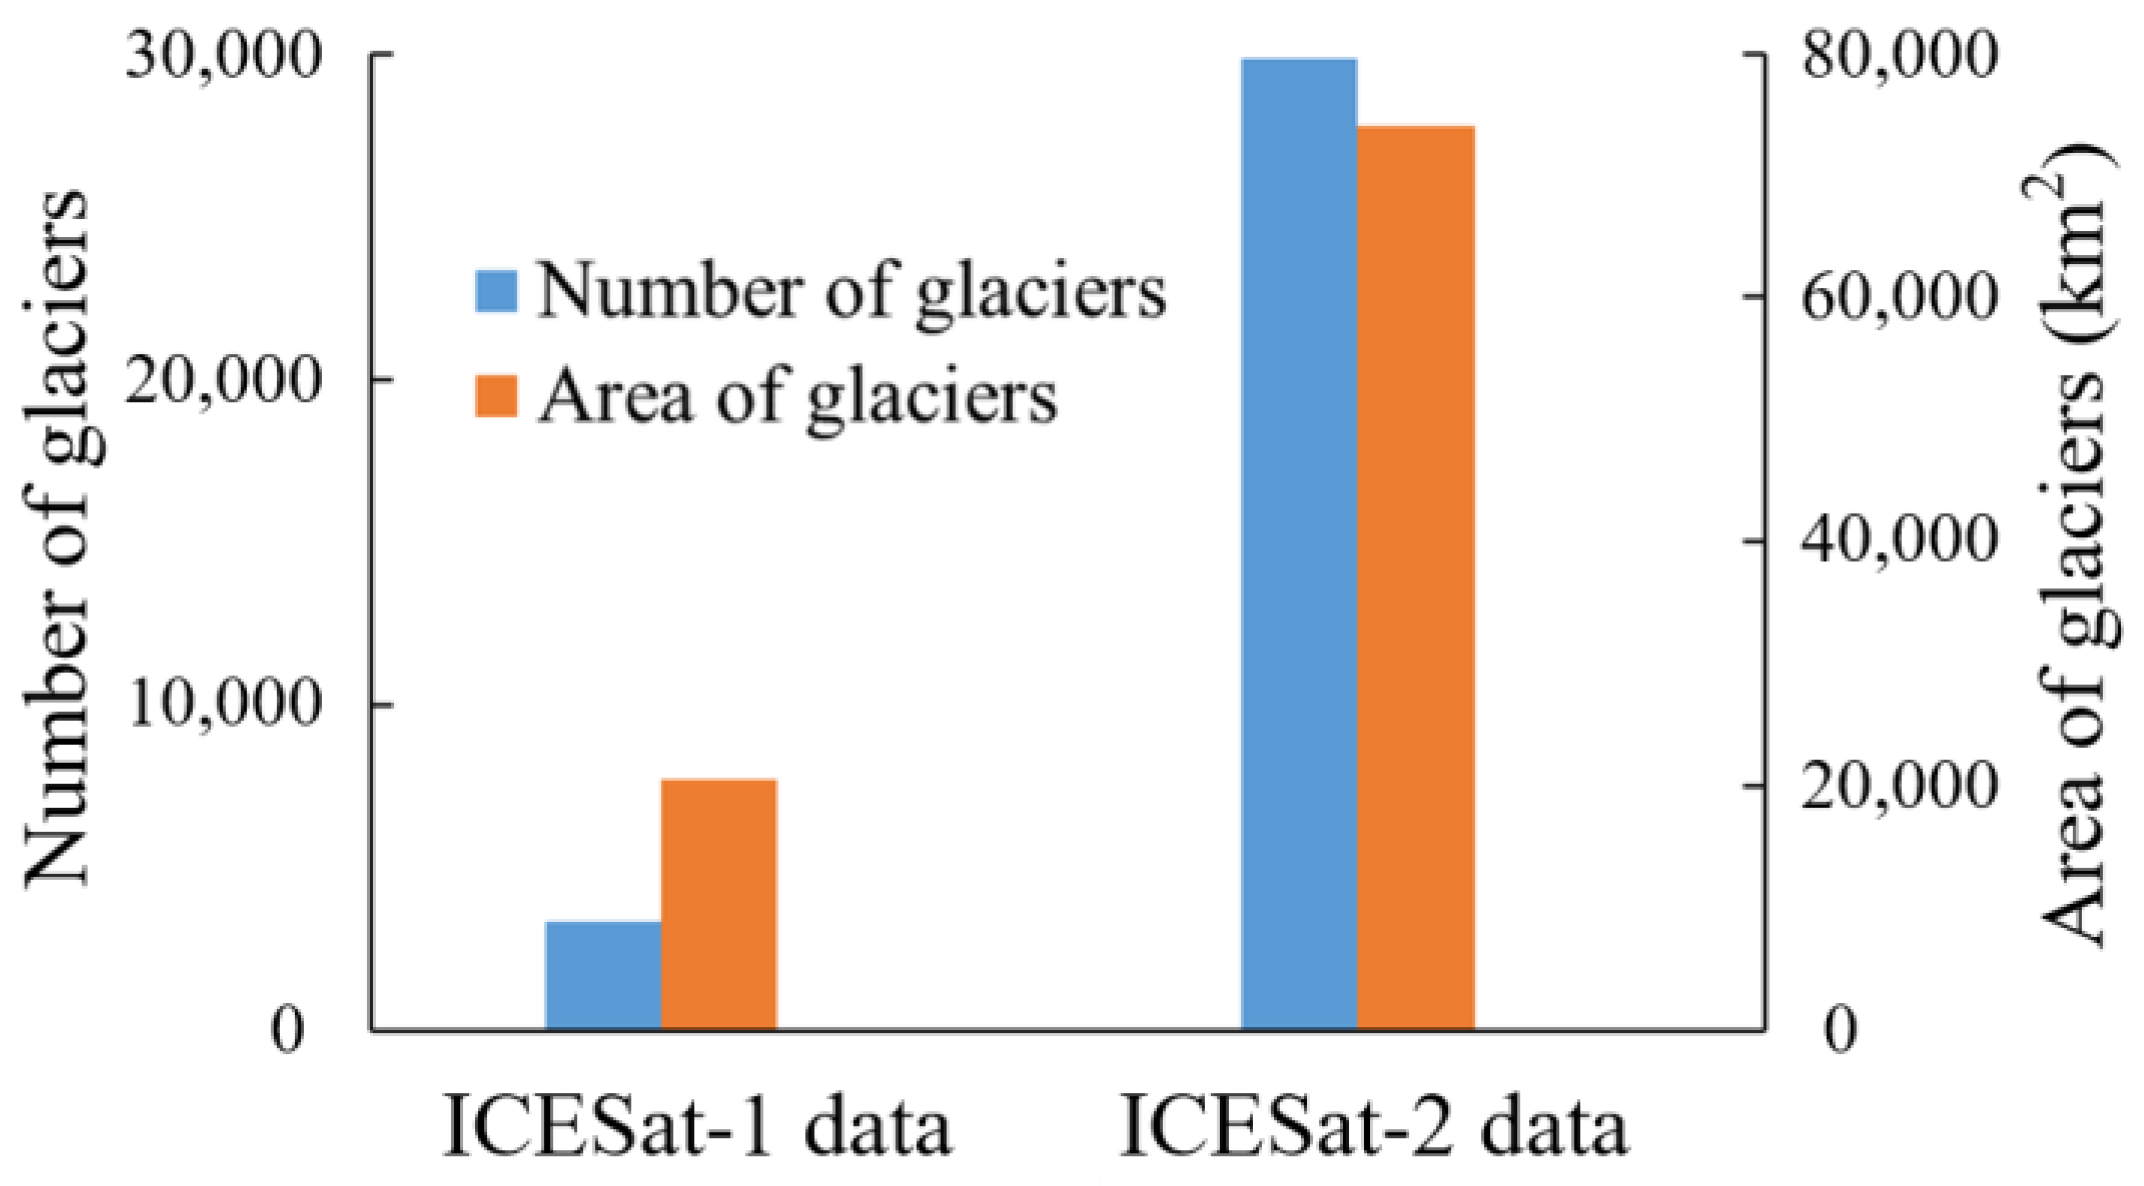
Figure 3.
Flowchart of glacier elevation change extraction and analysis using ICESat-1&2 data and SRTM DEM data.
Figure 3.
Flowchart of glacier elevation change extraction and analysis using ICESat-1&2 data and SRTM DEM data.
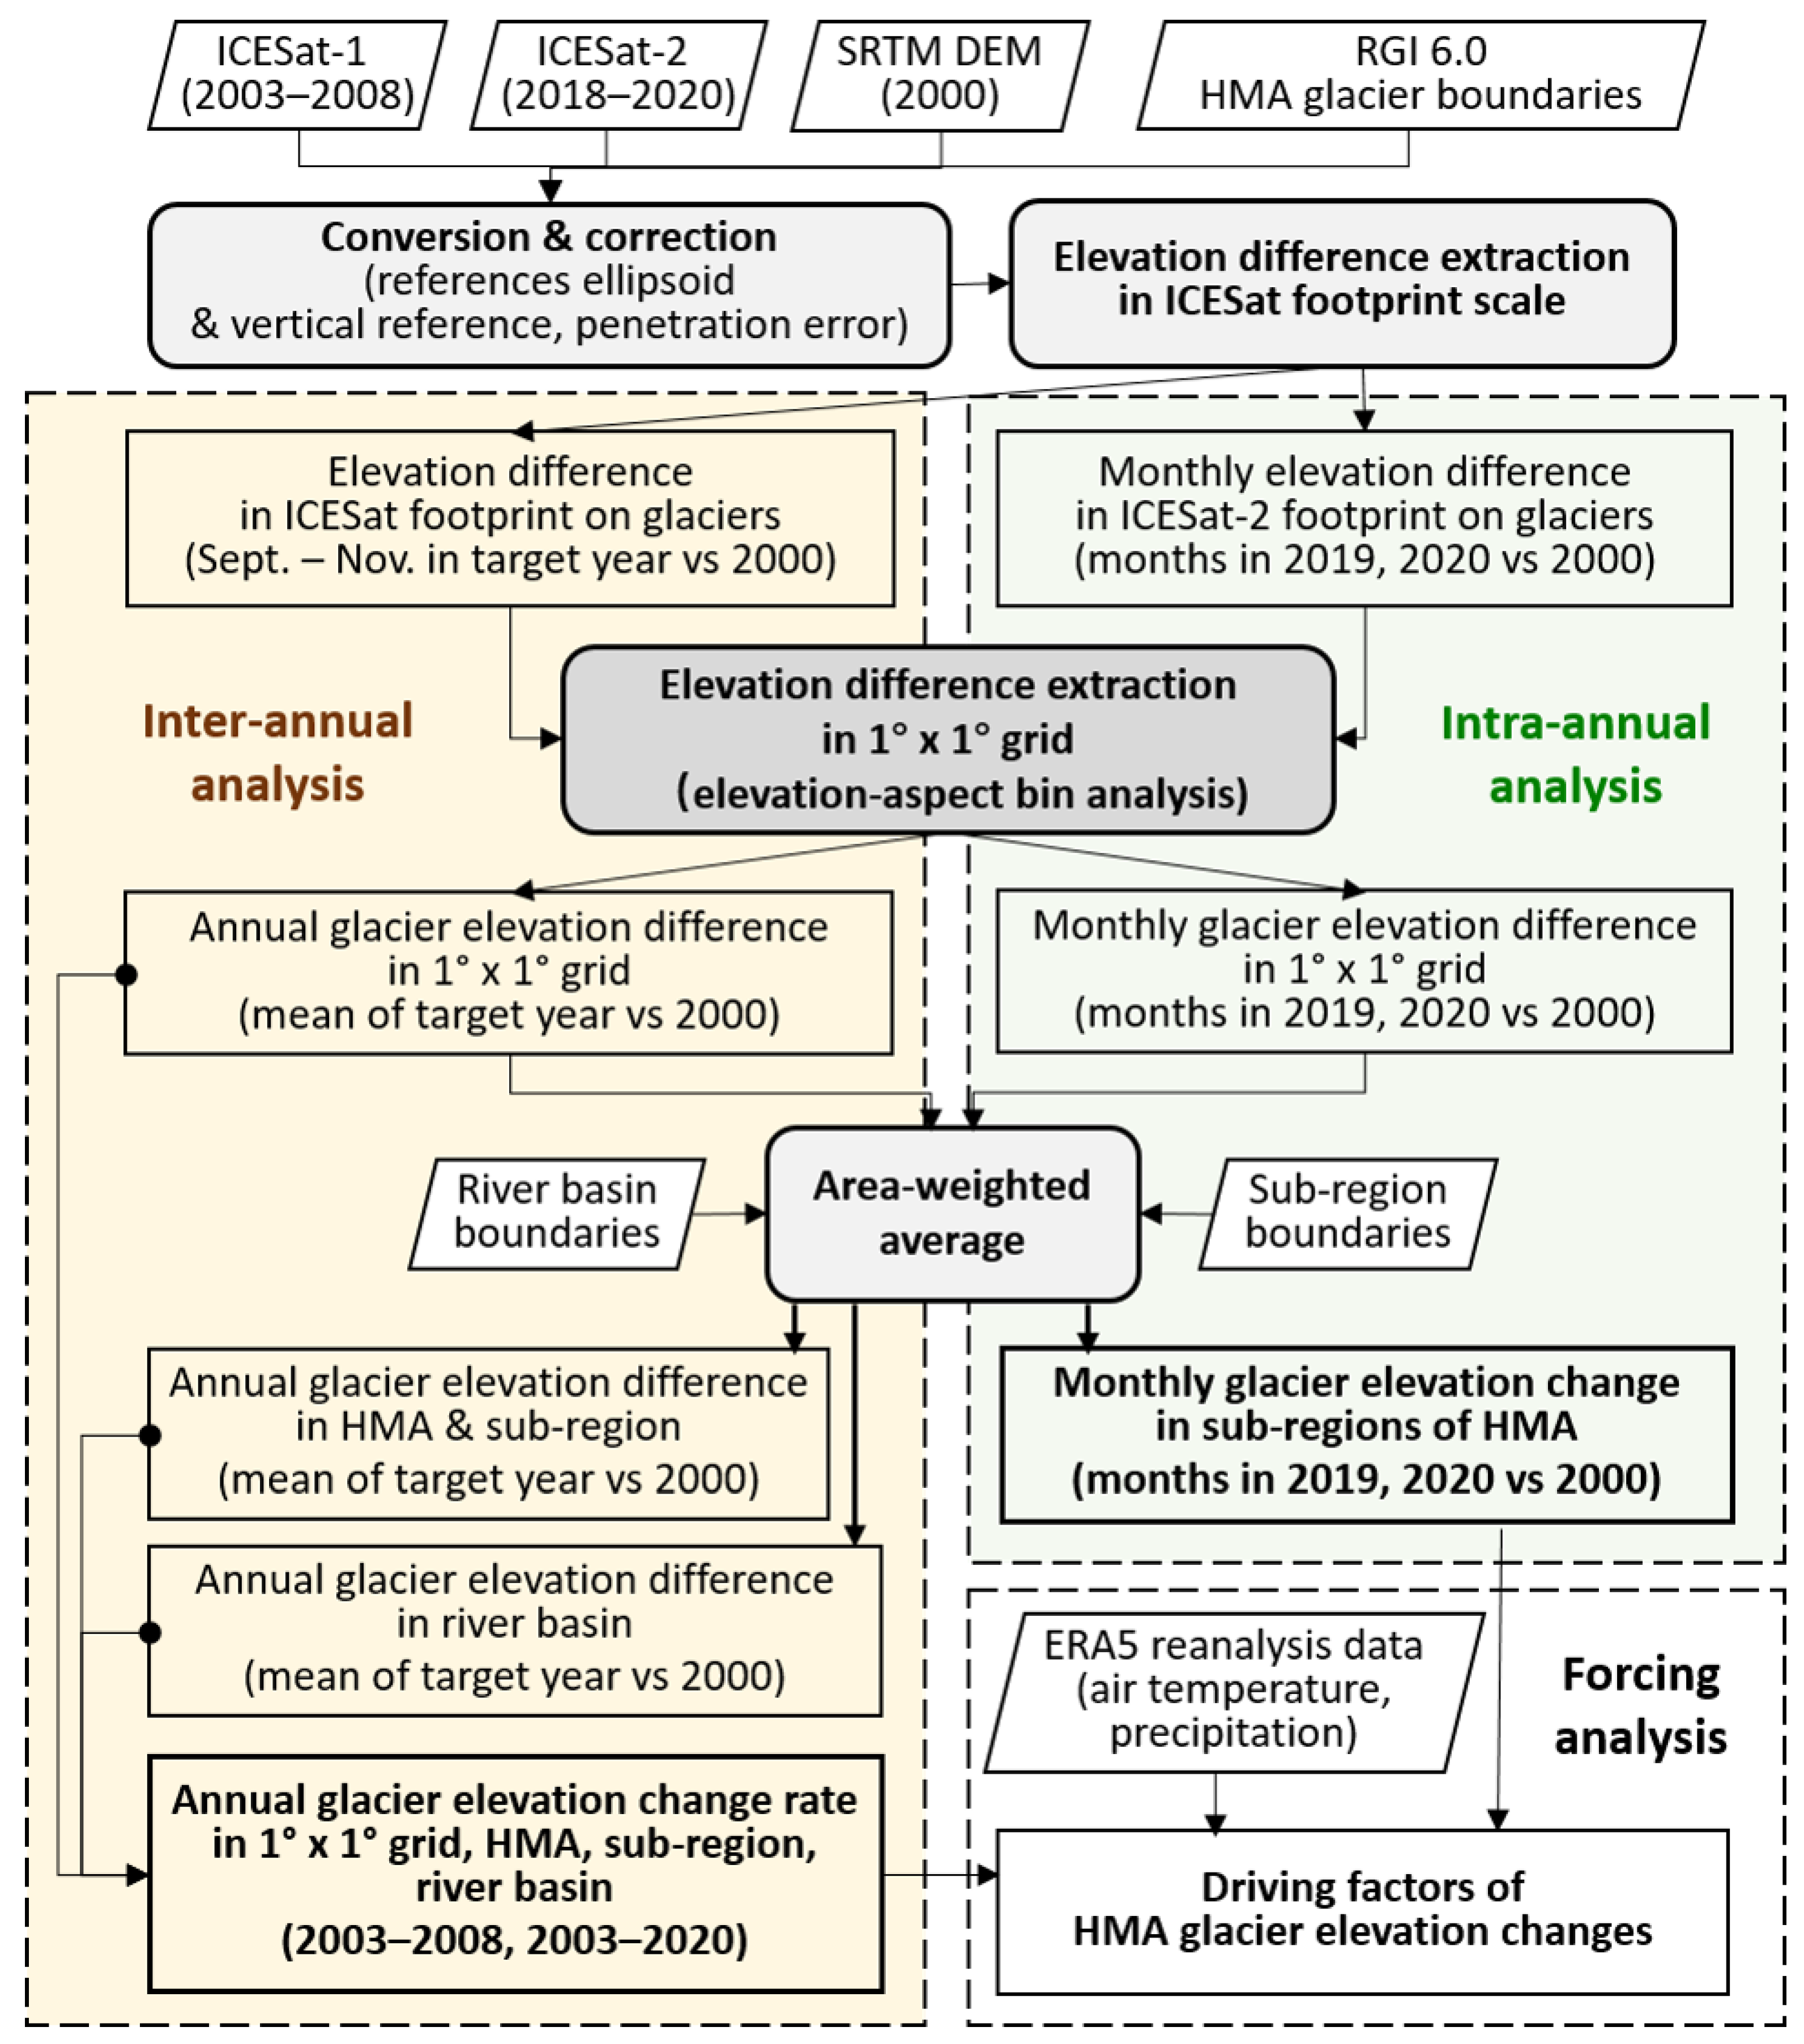
Figure 4.
Glacier elevation change between 2000 and 2020 in each sub-region of the HMA in: (a) different elevations, and (b) different slope aspects. (The sub-regions were defined in Figure 1a).
Figure 4.
Glacier elevation change between 2000 and 2020 in each sub-region of the HMA in: (a) different elevations, and (b) different slope aspects. (The sub-regions were defined in Figure 1a).
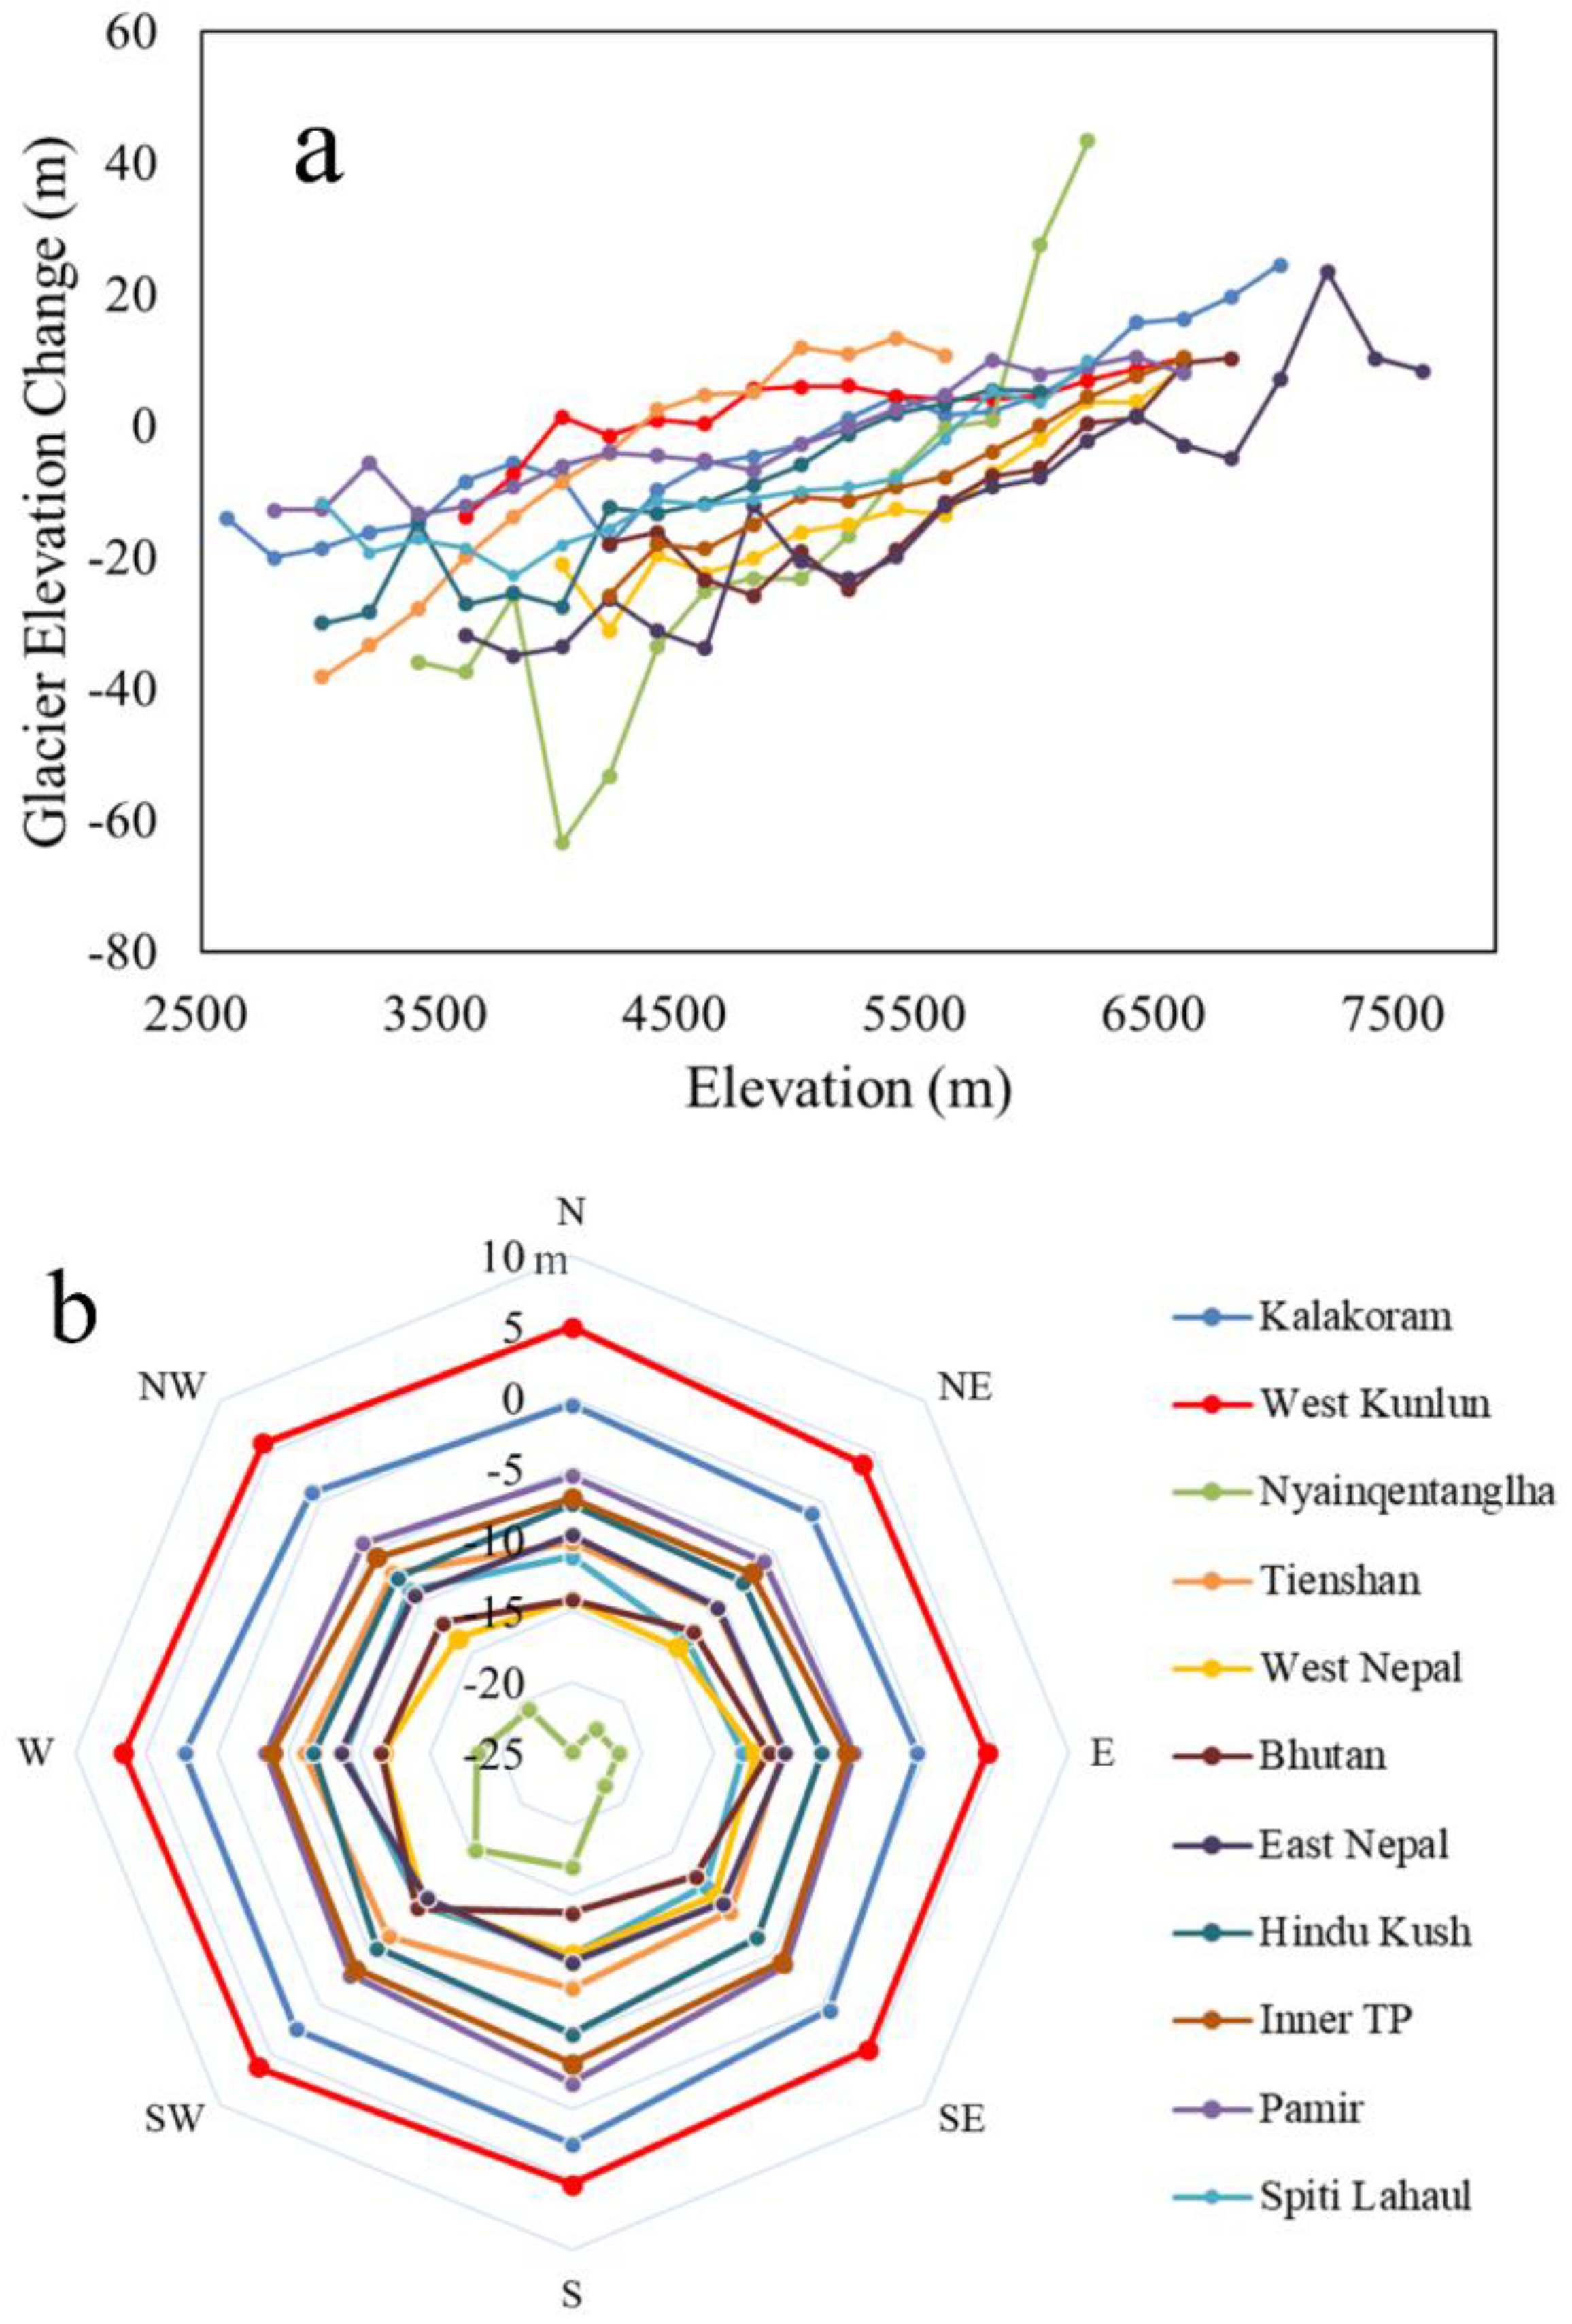
Figure 5.
Glacier elevation change rate in the HMA in 2003–2008 (a) and in 2003–2020 (b) (Statistics in 1° × 1° grids).
Figure 5.
Glacier elevation change rate in the HMA in 2003–2008 (a) and in 2003–2020 (b) (Statistics in 1° × 1° grids).
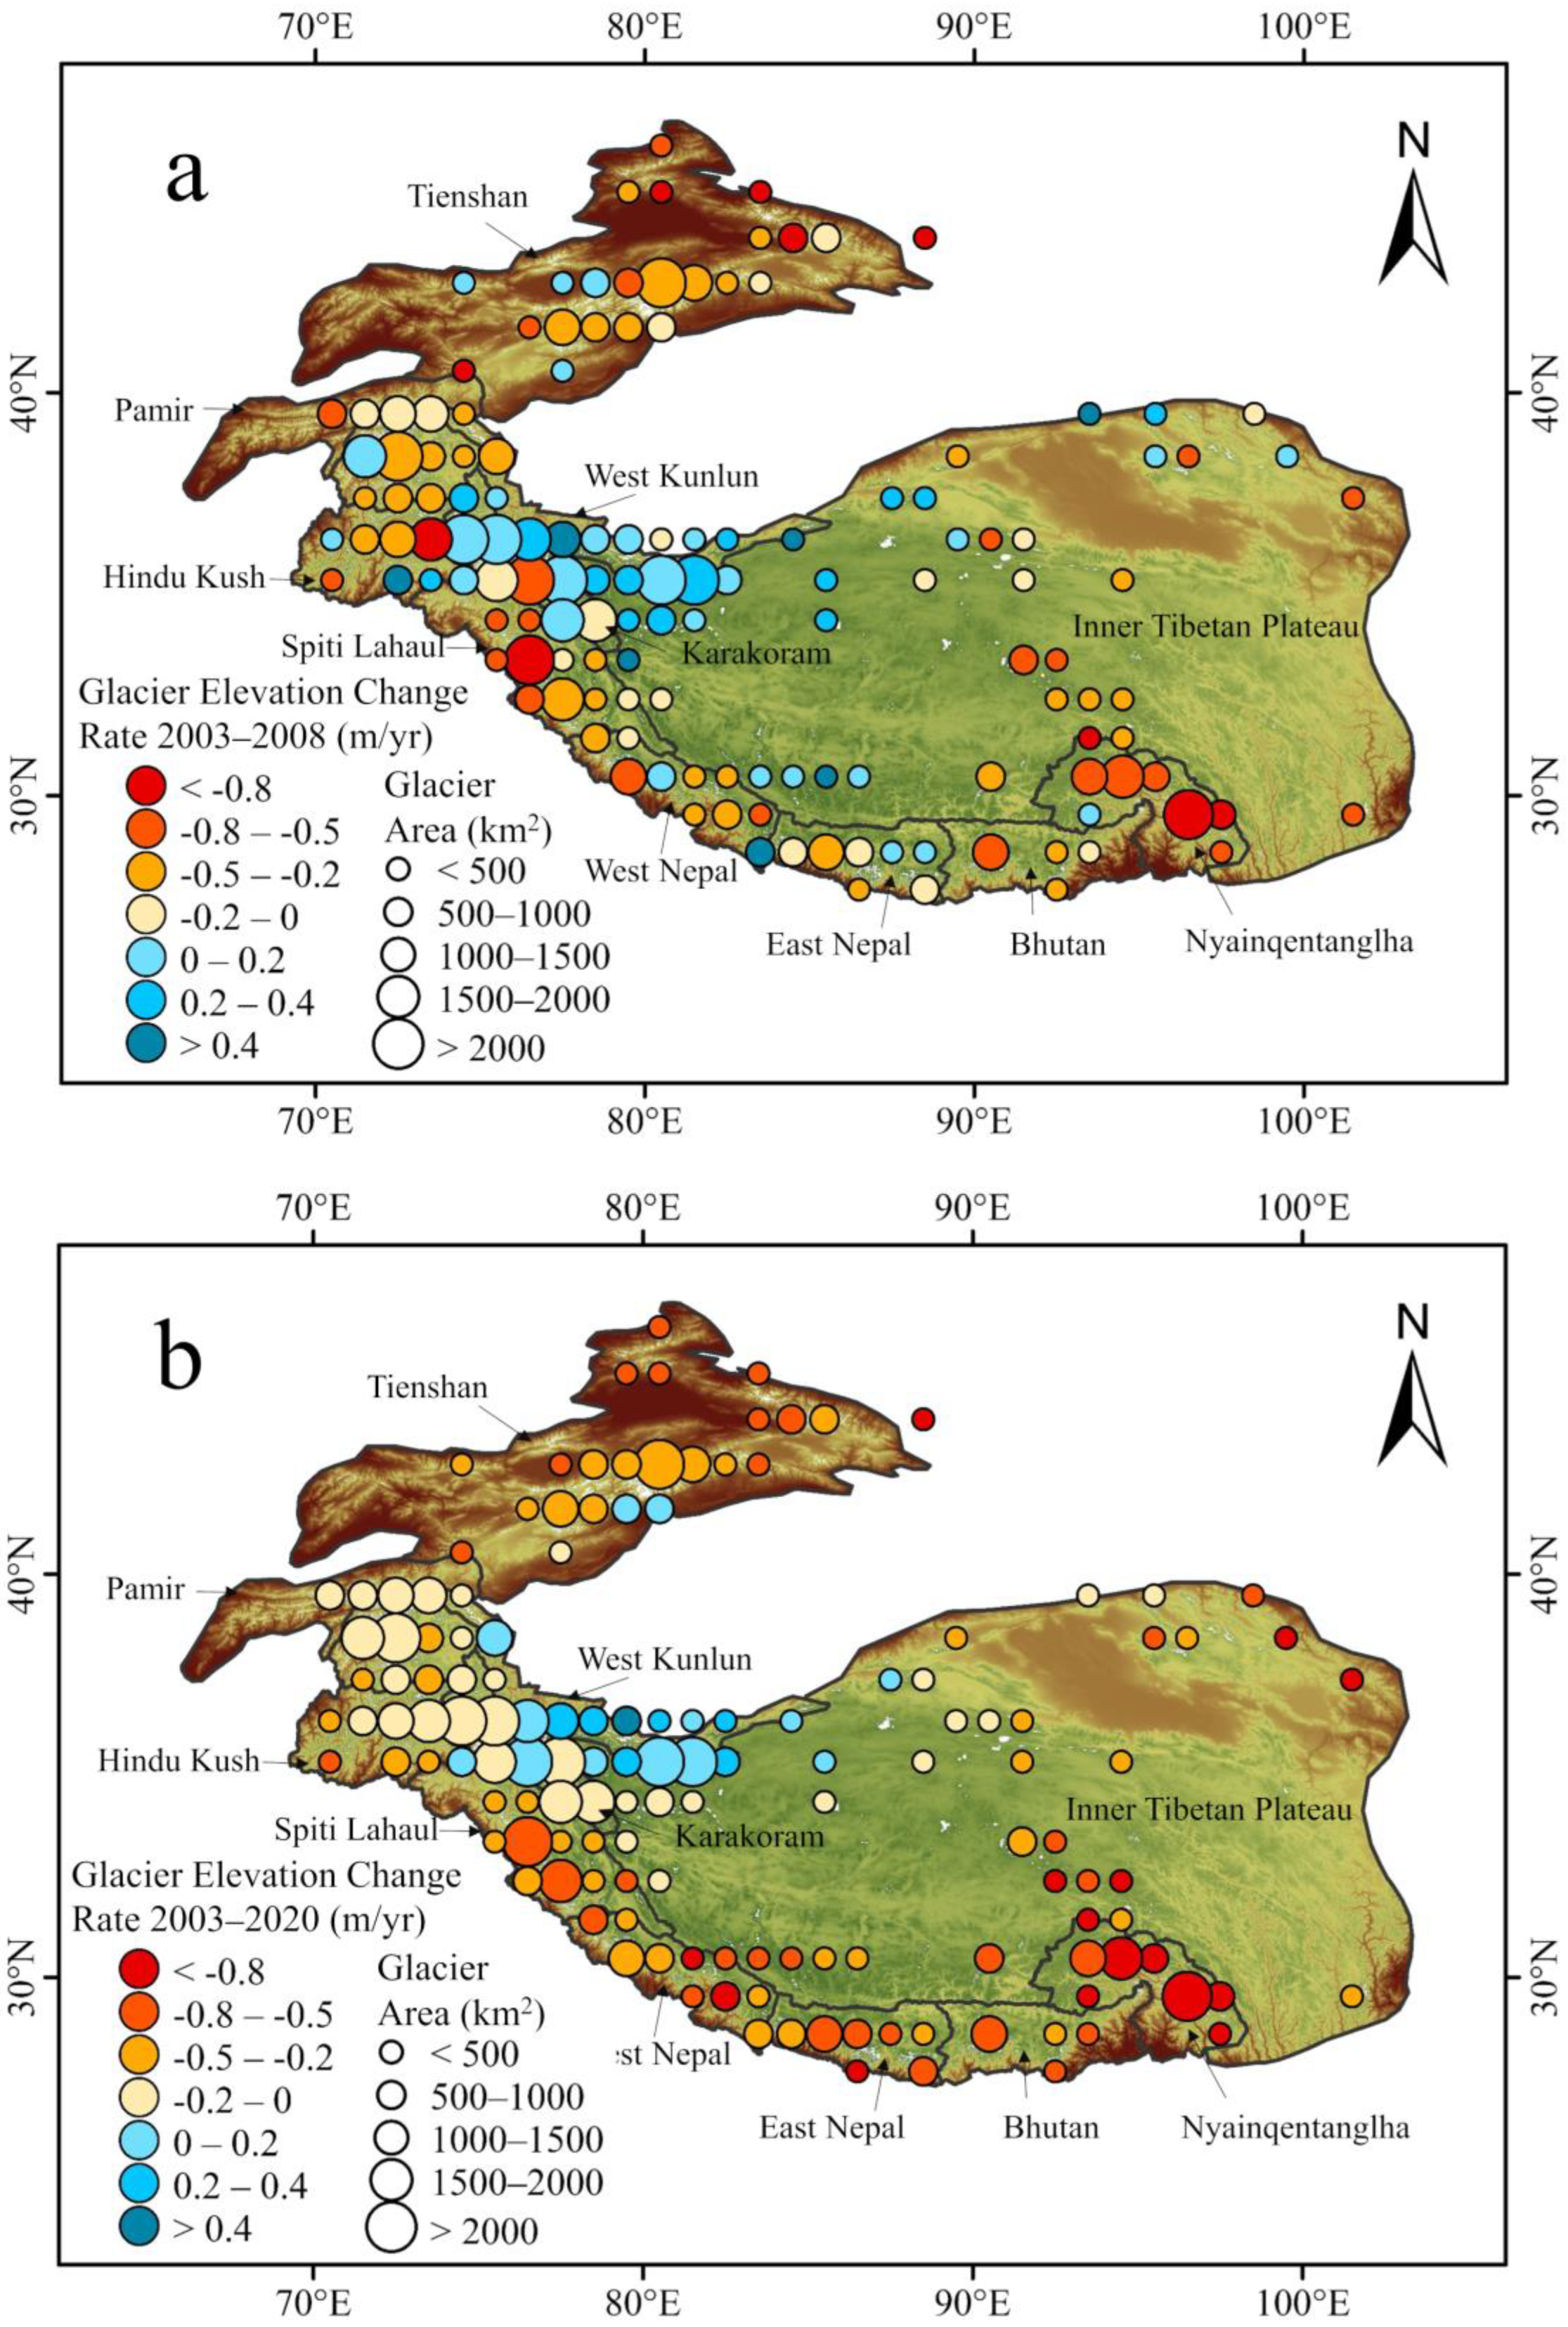
Figure 6.
The monthly change of glacier elevation in different regions of the HMA from January of 2019 to December of 2020. The red line (left Y-axis) represents the glacier elevation difference between the ICESat-2 data in 2019–2020 and the SRTM DEM data in 2000, the blue column (right Y-axis) represents the number of ICESat-2 data points in each month. The error bars are the values of standard deviation of spatial glacier elevation difference in the corresponding months calculated by Equation (5) at 1σ level.
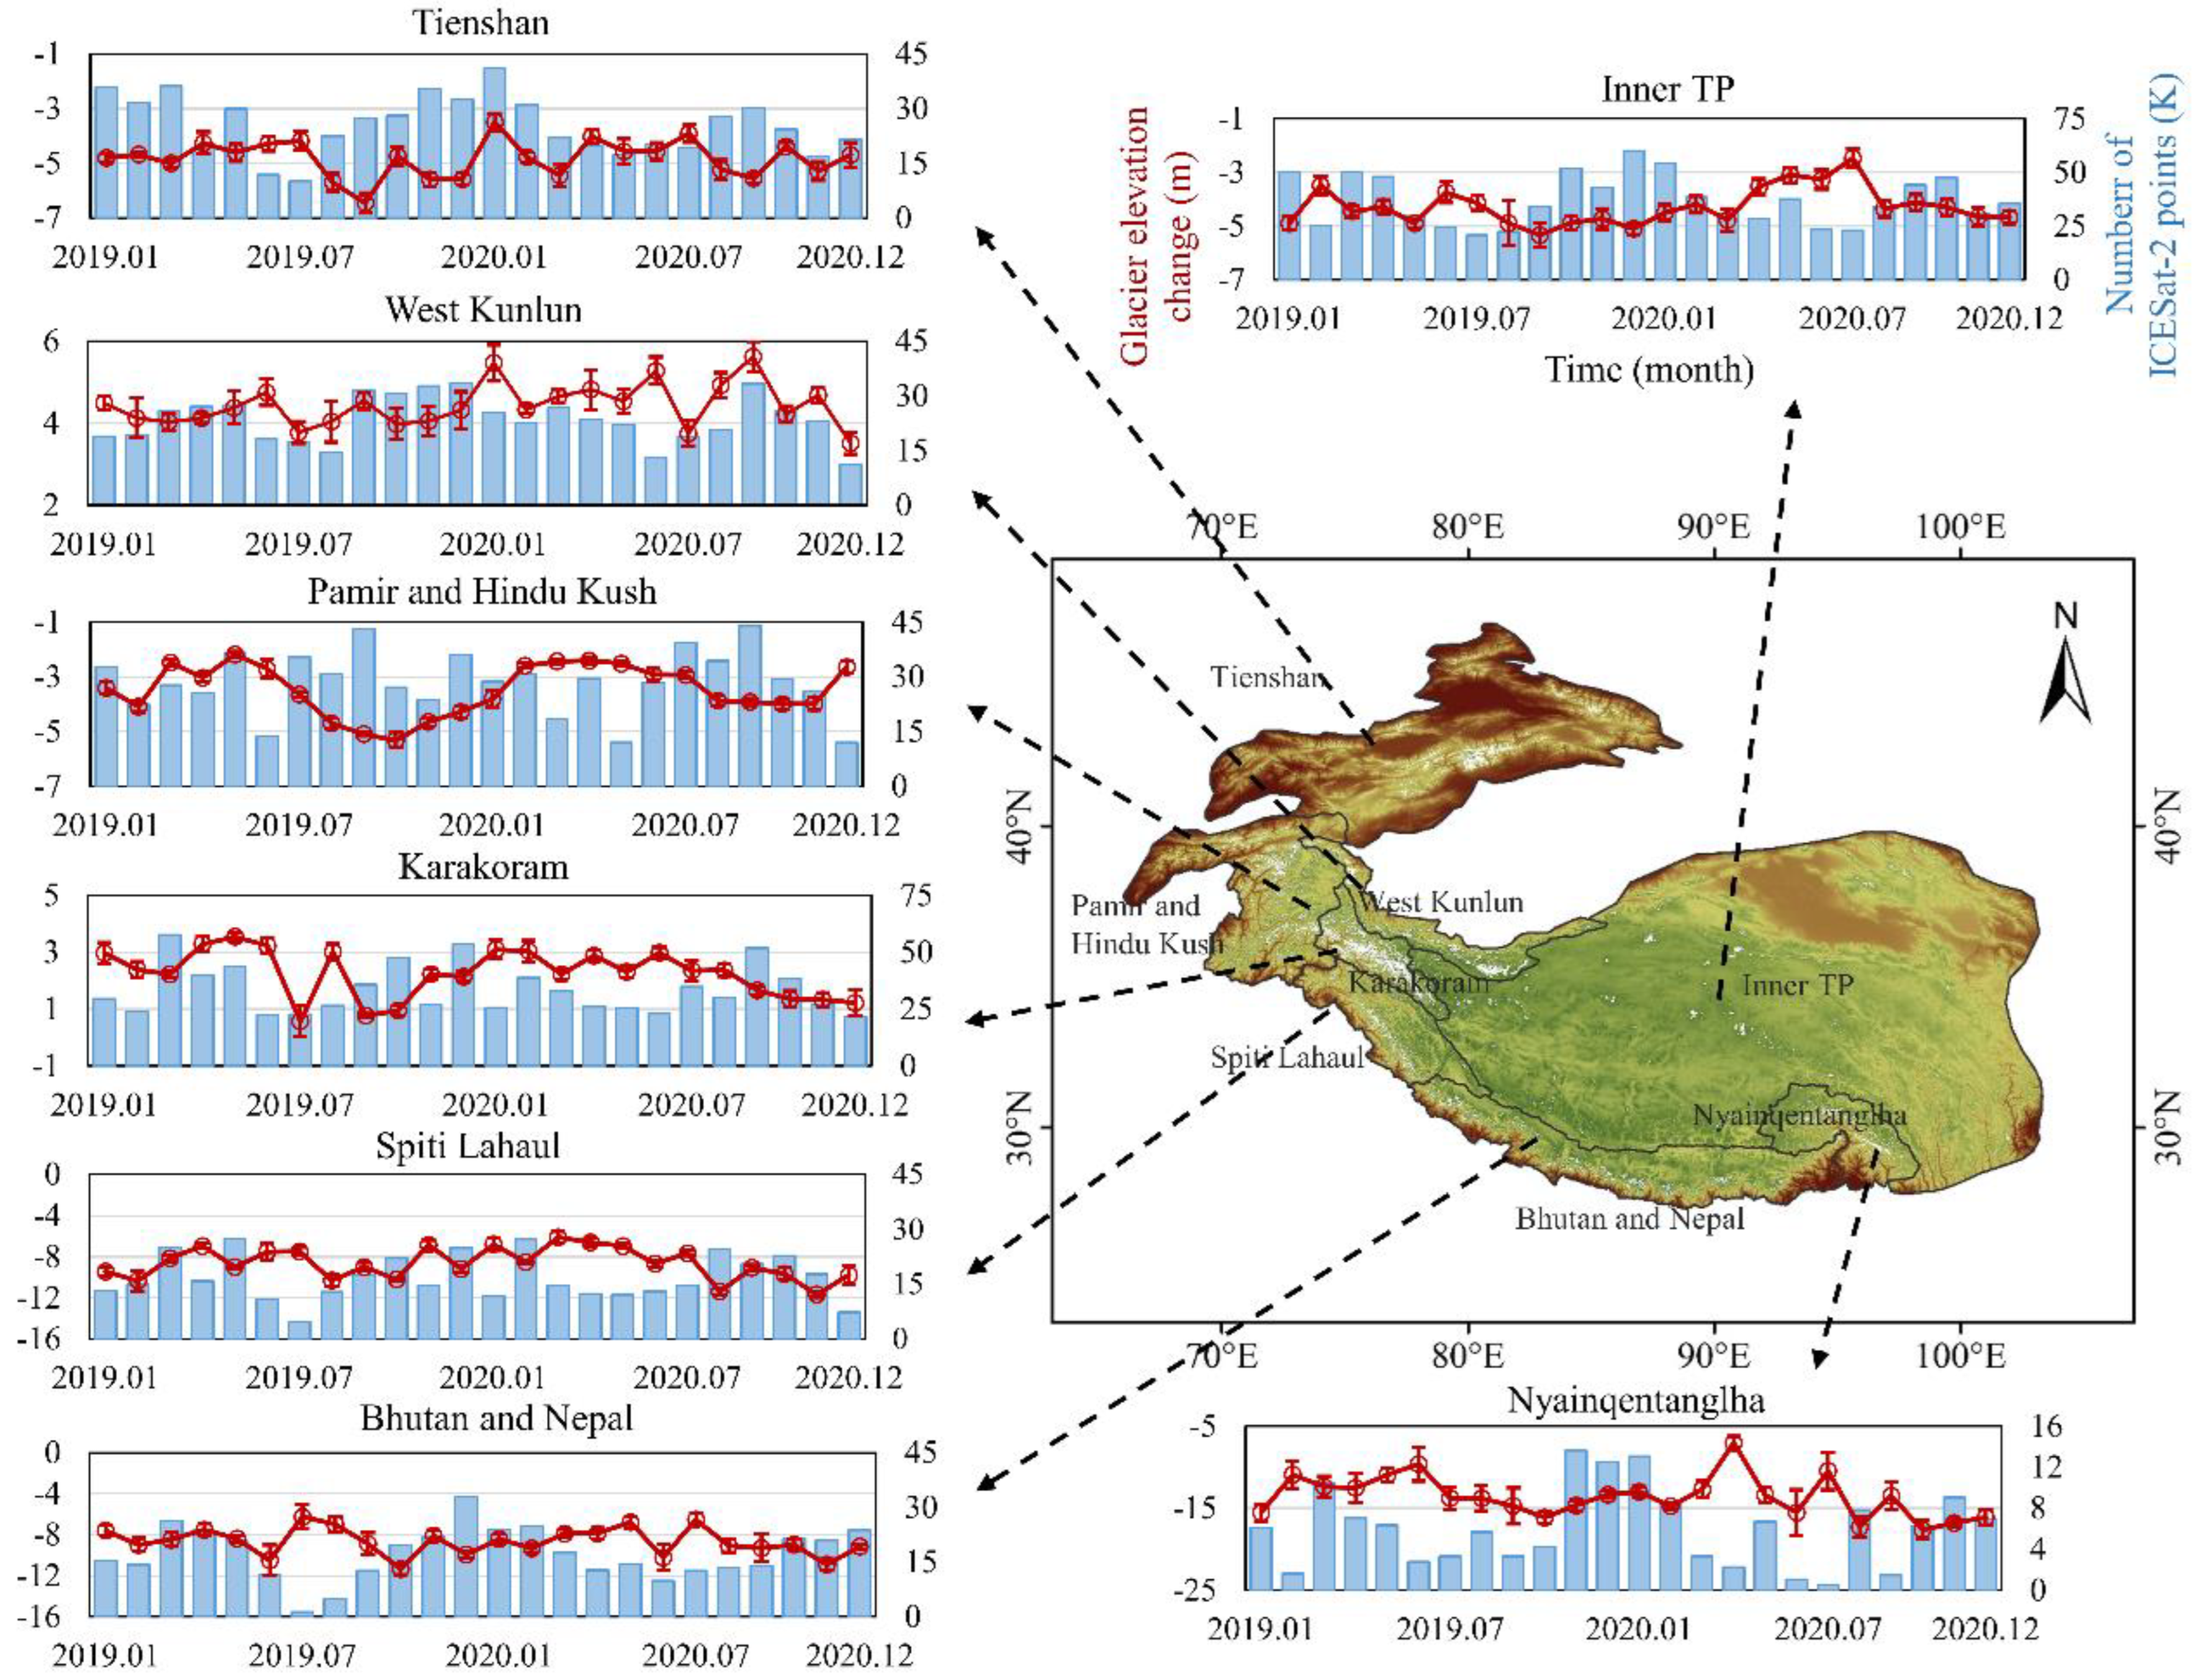
Figure 7.
Comparison of results on glacier elevation change rate in the HMA in 2003–2020 and 2003–2008 between this study with existing studies. Wang et al. [22] calculated the glacier elevation change rate in 2003–2019 using the ICESat-1&2 data. Brun et al. [17] and Shean et al. [10] calculated the glacier elevation change rates in 2000–2016 and 2000–2018 using ASTER data in 2016/2018 and SRTM DEM data in 2000, respectively. Kääb et al. [58] calculated the glacier elevation change rate in 2003–2008 using ICESat-1 data. The error bars are the standard deviation of spatial glacier elevation change rate calculated by Equation (6) at 1σ level.

Figure 8.
Difference between 2003–2020 and 2003–2008 (in autumn) in: (a) glacier elevation change rate, (b) mean temperature, and (c) mean precipitation.
Figure 8.
Difference between 2003–2020 and 2003–2008 (in autumn) in: (a) glacier elevation change rate, (b) mean temperature, and (c) mean precipitation.
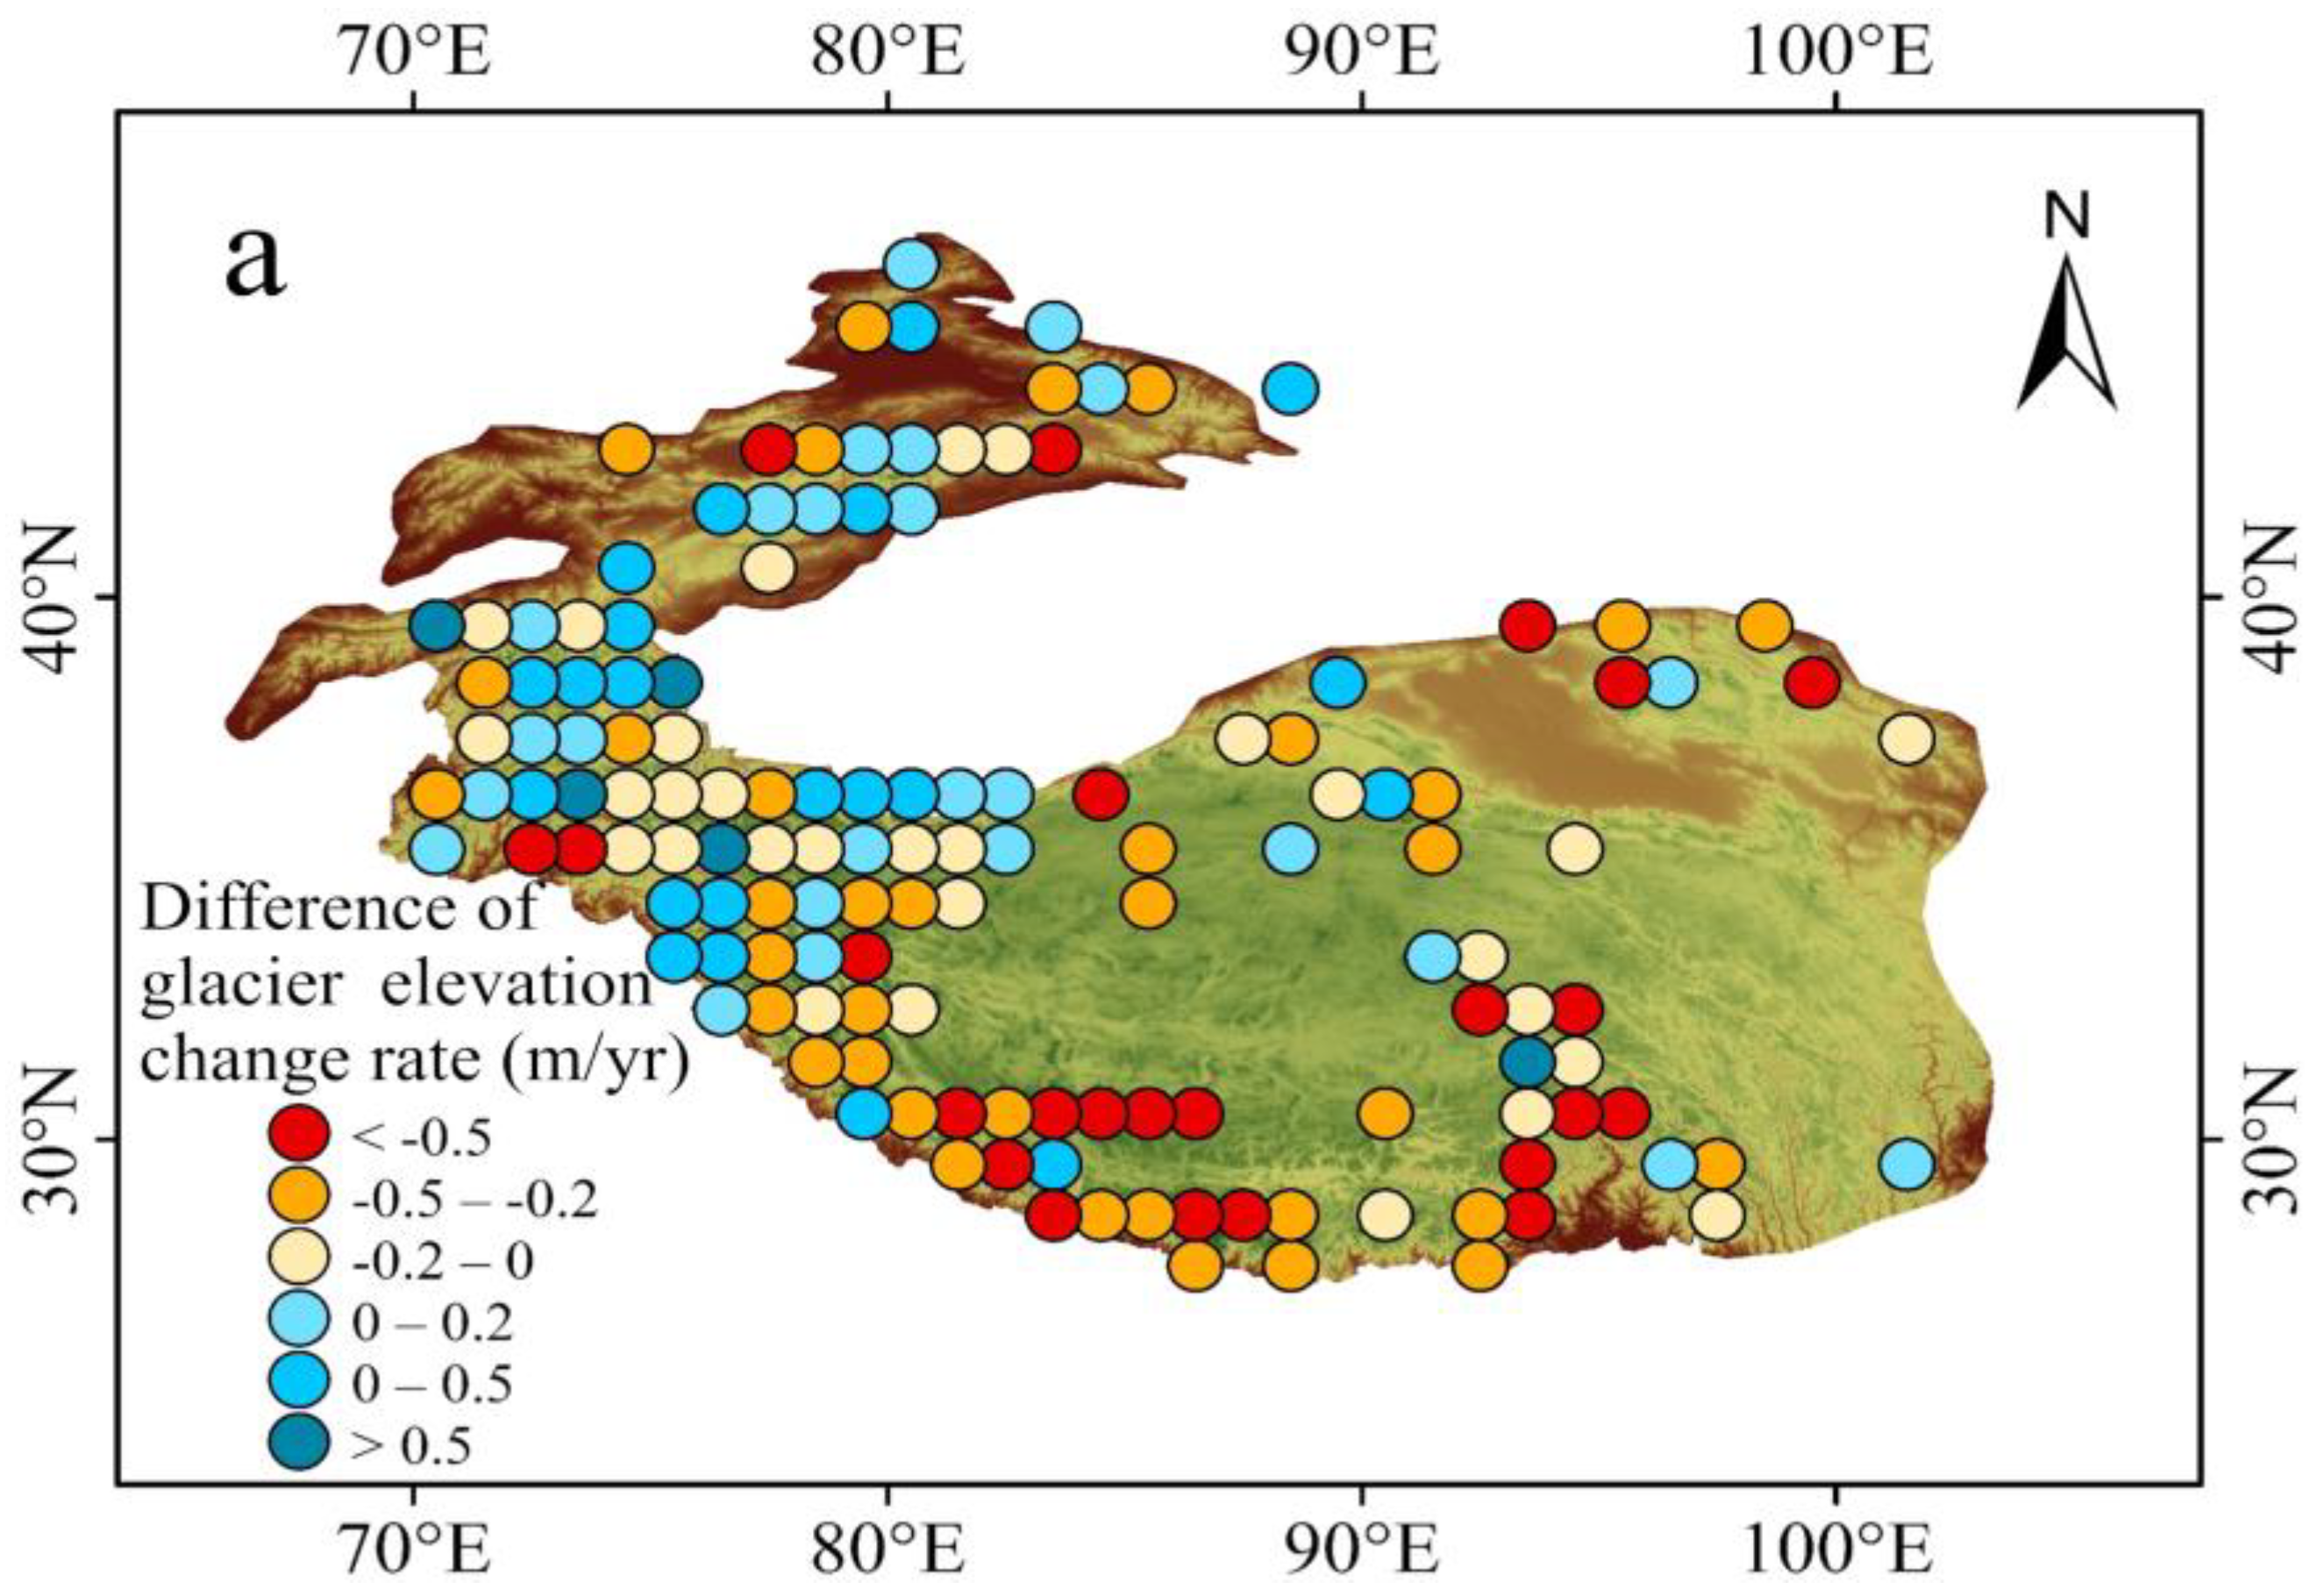

Figure 9.
Monthly temperature and precipitation from January 2019 to December 2020 in each sub-region of the HMA. The red line (left Y-axis) represents the monthly temperature, and the blue column (right Y-axis) represents the monthly precipitation.
Figure 9.
Monthly temperature and precipitation from January 2019 to December 2020 in each sub-region of the HMA. The red line (left Y-axis) represents the monthly temperature, and the blue column (right Y-axis) represents the monthly precipitation.
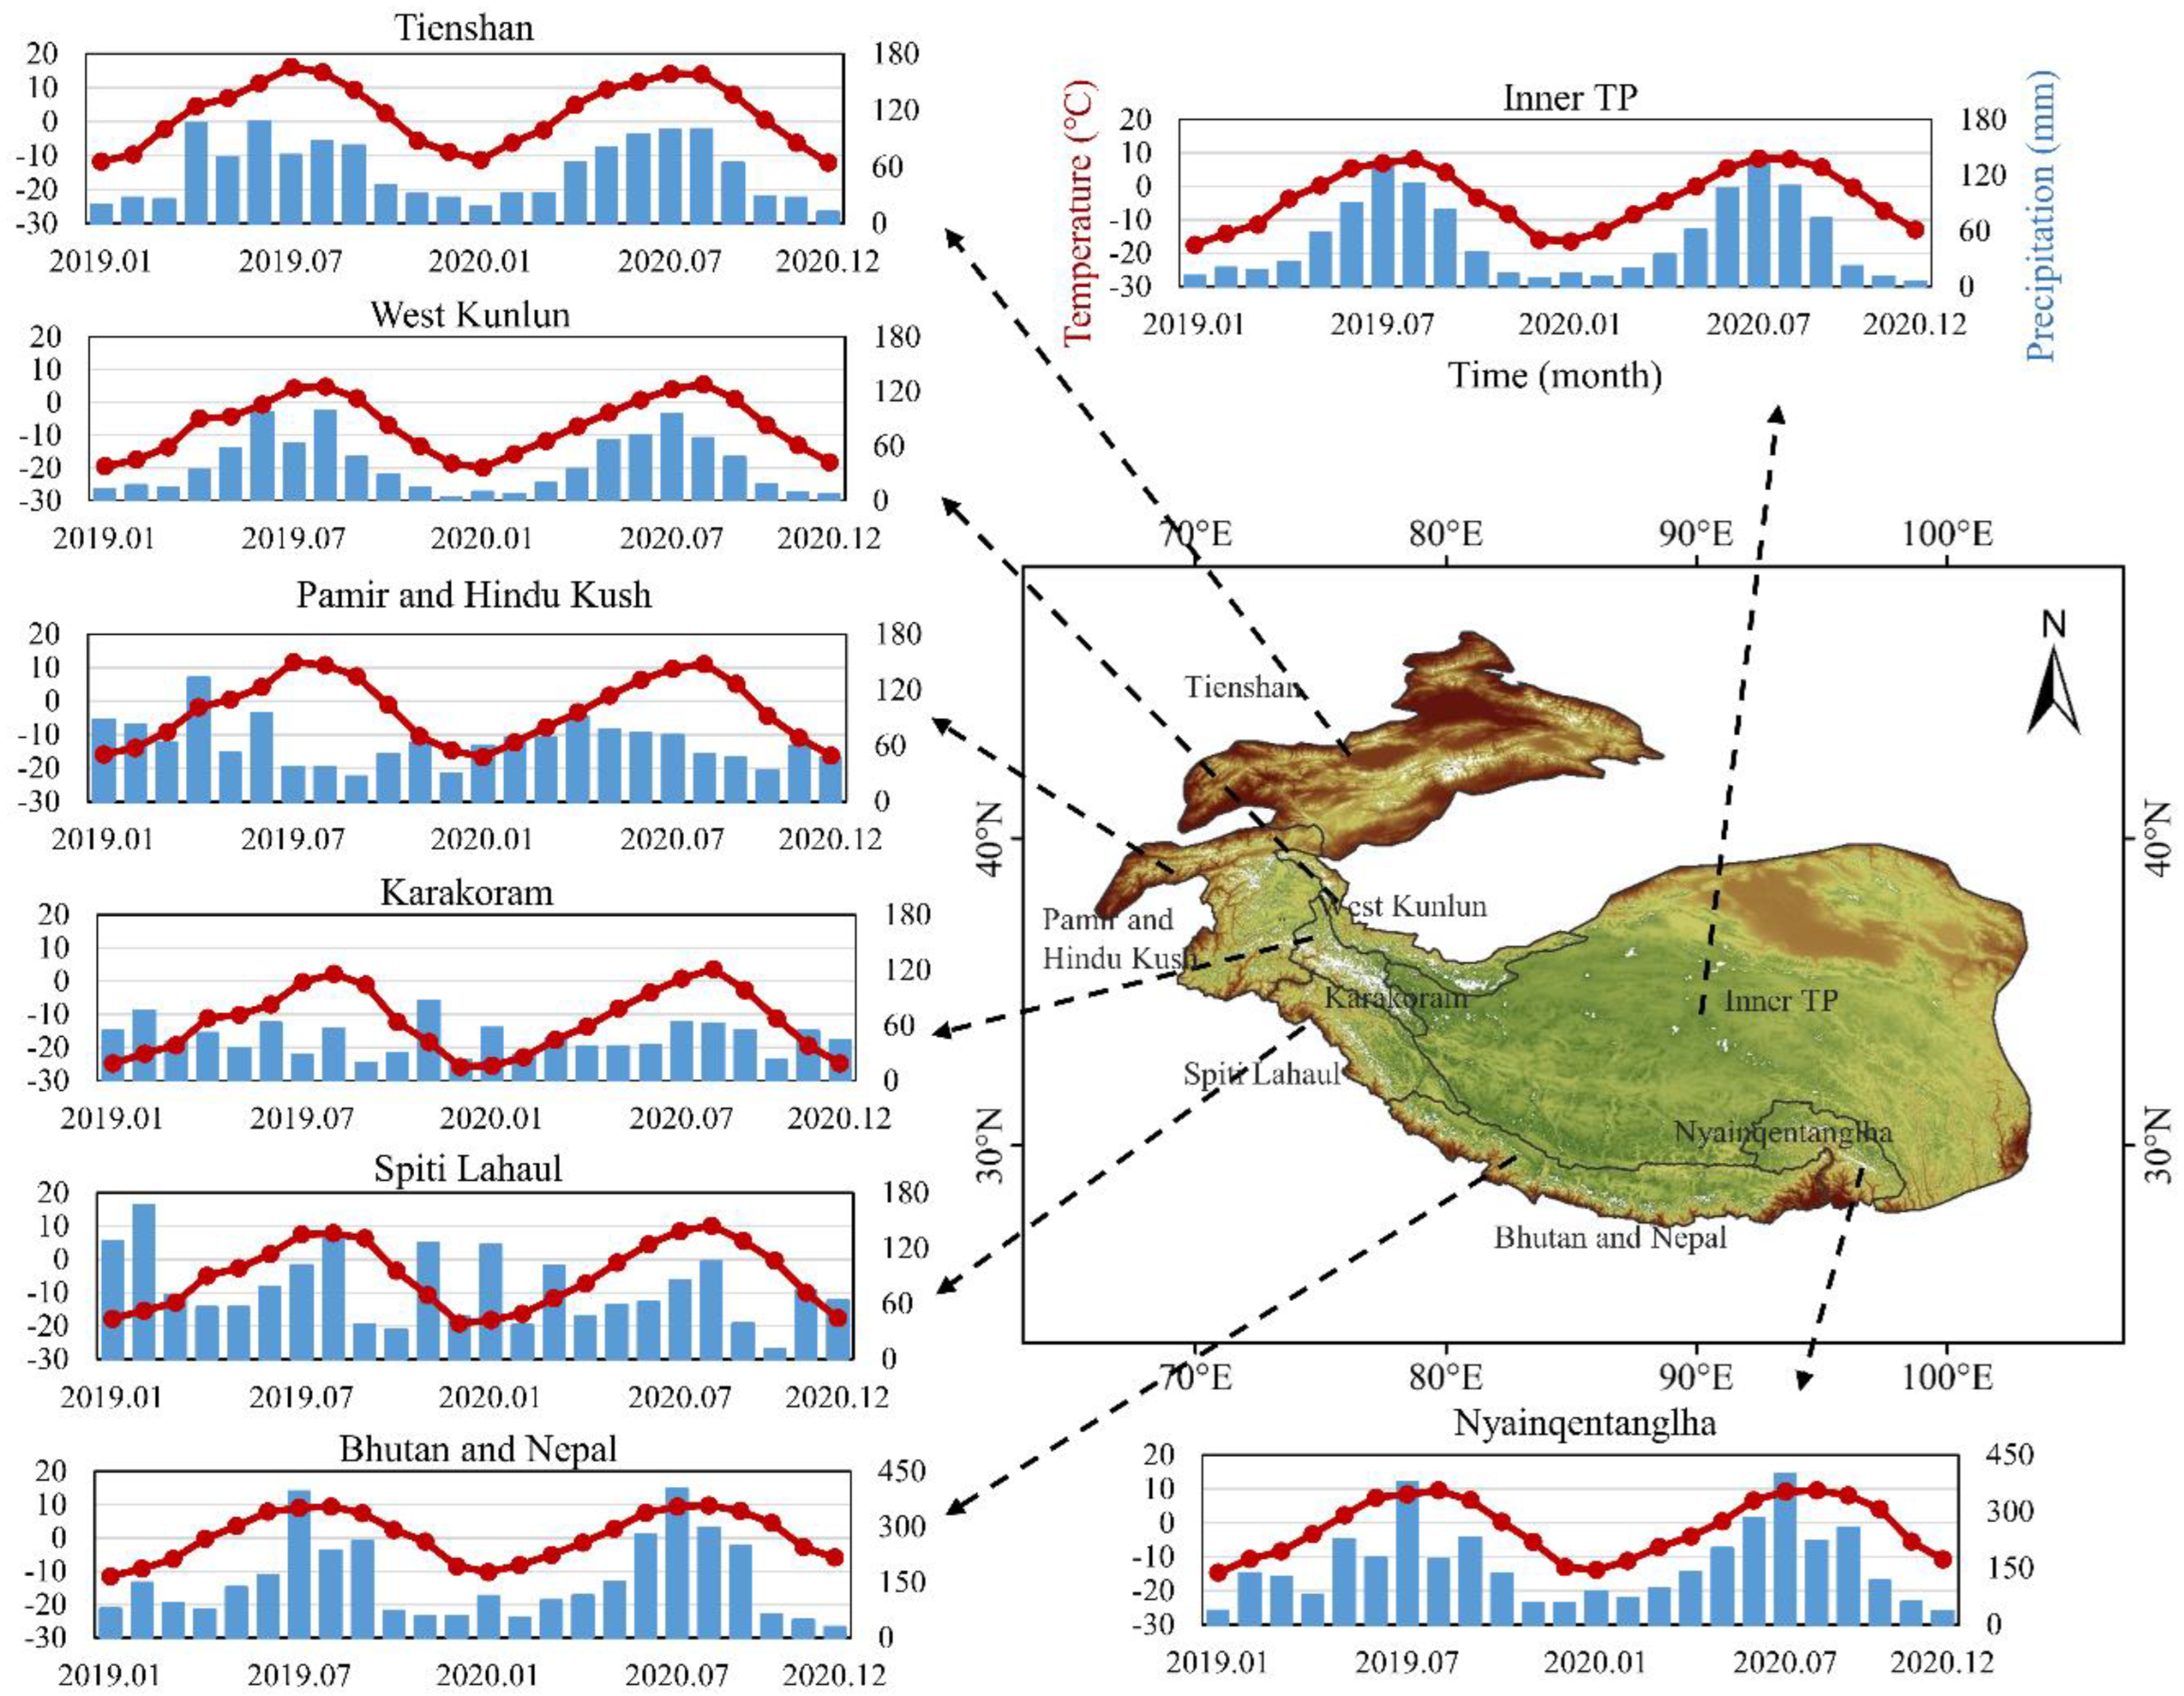
Table 1.
The rate of change in glacier elevation in the basins of the HMA in 2003–2008 and 2003–2020. The errors are given at the 1σ level calculated by Equation (6).
Table 1.
The rate of change in glacier elevation in the basins of the HMA in 2003–2008 and 2003–2020. The errors are given at the 1σ level calculated by Equation (6).
| Basin Name | Glacier Elevation Change Rate (m/year) | |
|---|---|---|
| 2003–2008 | 2003–2020 | |
| Amu Darya | −0.21 ± 0.13 | −0.12 ± 0.11 |
| Brahmaputra | −0.43 ± 0.18 | −0.78 ± 0.13 |
| Ili river | −0.46 ± 0.13 | −0.40 ± 0.12 |
| Indus river | −0.25 ± 0.15 | −0.20 ± 0.12 |
| Qiangtang Plateau | 0.07 ± 0.12 | −0.04 ± 0.11 |
| Shule and Heihe river | −0.11 ± 0.18 | −0.44 ± 0.15 |
| Ebinur and Manas river | −0.10 ± 0.30 | −0.42 ± 0.18 |
| Mekong river | −0.34 ± 0.43 | −1.2 ± 0.33 |
| Qardam | −0.21 ± 0.20 | −0.37 ± 0.13 |
| Issyk-Kul lake | 0.10 ± 0.2 | −0.39 ± 0.14 |
| Salween | −0.69 ± 0.20 | −1.02 ± 0.14 |
| Syr Darya | −0.67 ± 0.16 | −0.34 ± 0.13 |
| Tarim river | 0.08 ± 0.14 | 0.08 ± 0.11 |
| Yangtze | −0.43 ± 0.19 | −0.48 ± 0.13 |
Table 2.
The period of glacier accumulation in the sub-regions of the HMA from this study and the comparison with previous studies.
Table 2.
The period of glacier accumulation in the sub-regions of the HMA from this study and the comparison with previous studies.
| Sub-Regions | This Study | Wang et al. [31] | Maussion et al. [30] |
|---|---|---|---|
| Spiti Lahaul | December–March | December–March | December–February |
| Bhutan and Nepal | February–July | / | March–August |
| Nyainqentanglha | October–April (June) | December–June | December–August |
| West Kunlun | March–June, July–September | March–June (August) | March–May |
| Pamir and Hindu Kush | October–March | November–April | December–February |
| Tienshan | September–April | December–June | / |
| Karakoram | October–January | / | December–February |
| Inner TP | summer | April–August | June–August |
Publisher’s Note: MDPI stays neutral with regard to jurisdictional claims in published maps and institutional affiliations. |
© 2022 by the authors. Licensee MDPI, Basel, Switzerland. This article is an open access article distributed under the terms and conditions of the Creative Commons Attribution (CC BY) license (https://creativecommons.org/licenses/by/4.0/).
Share and Cite
MDPI and ACS Style
Shen, C.; Jia, L.; Ren, S. Inter- and Intra-Annual Glacier Elevation Change in High Mountain Asia Region Based on ICESat-1&2 Data Using Elevation-Aspect Bin Analysis Method. Remote Sens. 2022, 14, 1630. https://doi.org/10.3390/rs14071630
AMA Style
Shen C, Jia L, Ren S. Inter- and Intra-Annual Glacier Elevation Change in High Mountain Asia Region Based on ICESat-1&2 Data Using Elevation-Aspect Bin Analysis Method. Remote Sensing. 2022; 14(7):1630. https://doi.org/10.3390/rs14071630
Chicago/Turabian StyleShen, Cong, Li Jia, and Shaoting Ren. 2022. "Inter- and Intra-Annual Glacier Elevation Change in High Mountain Asia Region Based on ICESat-1&2 Data Using Elevation-Aspect Bin Analysis Method" Remote Sensing 14, no. 7: 1630. https://doi.org/10.3390/rs14071630
Note that from the first issue of 2016, this journal uses article numbers instead of page numbers. See further details here.