Article

Change Trend and Restoration Potential of Vegetation Net Primary Productivity in China over the Past 20 Years

1
The Institute of Geographical Sciences and Natural Resources Research, Chinese Academy of Sciences, Beijing 100101, China
2
University of Chinese Academy of Sciences, Beijing 100049, China
3
Shanghai Kaiqing Intelligent Technology Co., Ltd., Shanghai 201101, China
*
Author to whom correspondence should be addressed.
Remote Sens. 2022, 14(7), 1634; https://doi.org/10.3390/rs14071634
Submission received: 25 December 2021 / Revised: 5 March 2022 / Accepted: 25 March 2022 / Published: 29 March 2022

Abstract

:
As an important vegetation parameter and ecological index, vegetation net primary productivity (NPP) can intuitively reflect changes in the ecological environment and the level of the carbon budget. However, the change trend of NPP and its recovery potential in China over the past 20 years remain unclear. Here, we used trend analysis, multiple regression analysis and residual analysis methods to analyse the change trend in the NPP of China’s terrestrial ecosystems from 2000 to 2019, as well as the climax background, restoration status and restoration potential of the NPP of forest, grassland and desert ecosystems. The results showed that (1) the change in vegetation NPP in China from 2000 to 2019 showed a continuous upward trend, with a change slope of 2.39 gC/m2/a2, and the area with a positive slope of change accounted for 68.10% of the country’s land area. The contribution rates of meteorological conditions and human activities to vegetation NPP changes were 85.41% and 14.59%, respectively. (2) The results obtained by the regression analysis method of meteorological conditions based on nature reserves could reflect the zonal climax vegetation status to a large extent, and the obtained values had a smooth transition within each ecogeographical division and between each ecogeographical division, which truly reflected the law of gradual change in climate, vegetation and natural conditions. The annual total NPP of the climax background vegetation in China’s forest, grassland and desert ecosystems was approximately 2.76 ± 0.28 PgC, and the annual total NPP of the three ecosystems was 1.90 ± 0.2 PgC, 0.80 ± 0.07 PgC and 0.009 ± 0.0005 PgC, respectively. (3) The annual total vegetation NPP of the restoration status of China’s forest, grassland and desert ecosystems was 2.24 PgC, and the annual total vegetation NPP of the three was 1.54 PgC, 0.65 PgC and 0.007 PgC, respectively. Benefiting from the effective implementation of climate warming and humidification and ecological engineering, the agro-pastoral zone, the Loess Plateau, the eastern Sichuan Basin and the Greater Khingan Range had the most significant increases in the past 20 years. (4) The annual total vegetation NPP of China’s forest, grassland and desert ecosystem restoration potential was approximately 0.52 ± 0.28 PgC, which accounted for approximately 19.05% of the annual total NPP of the climax background vegetation. The annual total vegetation NPP of forest, grassland and desert ecosystems restoration status was 0.36 ± 0.2 PgC, 0.16 ± 0.07 PgC and 0.002 ± 0.0005 PgC, respectively; the restoration potential accounted for 18.80%, 9.67% and 23.95% of the climax background vegetation NPP, respectively. The deployment of ecological projects should fully consider the restrictive climate conditions for decision makers and ecological scholars, and the benefits and costs of the projects should be considered comprehensively.

1. Introduction

In recent decades, climate change has attracted widespread attention [1,2]. Under the combined influence of natural and anthropogenic factors, the processes, structures and functions of terrestrial ecosystems have undergone significant changes. These changes will have an impact on the net primary productivity (NPP) of terrestrial vegetation, which is comprehensively manifested [3]. As an important vegetation parameter and ecological indicator, NPP can directly reflect the changes in the ecological environment and the level of the carbon budget [1,4]. Thus, determining the carbon sink or source potential of ecosystems under future climate projections is of critical importance [5].
A large number of studies since the 1990s reported that the annual total NPP of vegetation in China’s terrestrial ecosystem was approximately 3.64 ± 0.57 PgC [6,7,8,9,10,11,12,13,14,15], and its spatial pattern decreased from southeast to northwest due to the influence of meteorological conditions and topography. Meteorological conditions such as precipitation and temperature were the main factors that determined the change trend of NPP [16,17]. Since the beginning of the 21st century, benefiting from climate warming and humidification, and the effective implementation of ecological engineering [18,19,20], the NPP in areas such as the Qinghai-Tibet Plateau [21,22,23,24,25] and the Loess Plateau [16,26] has significantly increased. However, due to differences in research methods, data sources and research periods, the above studies still lack a clear understanding of the spatiotemporal pattern and variation trend of vegetation NPP in China over the past 20 years.
Furthermore, the research on NPP restoration potential is still relatively weak due to the difficulty in obtaining the ecological parameters of zonal climax vegetation [27]. For example, some scholars have evaluated the status and potential of carbon sequestration in grassland [28], wetlands [29] and forests [30] in China on the basis of positioning experiments, literature or sample survey data. However, the research on the carbon sequestration potential of a single vegetation type at a point scale is difficult to extend to a regional scale. Zhang et al. [31] calculated the productivity potential of grassland based on precipitation, temperature and evapotranspiration, but the method focused on meteorological elements, and ignored the differences in zonal climax vegetation. Zhao et al. [26] used a similar habitat method on the Loess Plateau to predict the future vegetation coverage in each district. However, the classification standard of terrain and meteorological conditions in this method were greatly affected by subjective factors, and the restoration potential of each district adopted the same degree of vegetation coverage, ignoring the spatial continuity of water and heat conditions. Most areas of the Loess Plateau are subject to human disturbance, and the vegetation coverage in each district obtained by geostatistical methods was not the ideal climax vegetation coverage. Therefore, the current theoretical and technical system for research on the NPP restoration potential of large-scale vegetation is still imperfect, and it is difficult to support the differentiated implementation of ecological engineering. It was urgent to make new attempts in theory and technical methods. For a long time, the Chinese government has built a large number of nature reserves [32,33] to protect representative natural ecosystems, the purpose of which is to reduce human interference and protect the authenticity, integrity and stability of the ecosystem in the region and to restore the degraded ecosystem to an ecosystem with species composition, diversity and community structures that are close to the levels of zonal community. The nature reserves provide an ideal reference standard for obtaining the zonal ecosystem climax background.
What is the spatiotemporal pattern and changing trend of vegetation NPP in China in the past 20 years? How can the zonal climax background of vegetation be selected with the help of nature reserves, and how can the zonal climax background of China’s vegetation NPP be evaluated at the national scale? On this basis, how large is the restoration status and restoration potential of vegetation NPP in China, and what are the spatial differences? To address these questions, we used the NPP data of MODIS (moderate-resolution imaging spectroradiometer) to analyse the change trend of NPP and its influencing factors. Additionally, the vegetation status of nature reserves was regarded as the zonal ecosystem climax background and used to evaluate the NPP restoration potential of China’s forest, grassland and desert ecosystem vegetation. This approach has important theoretical and practical significance for research on the carbon cycle and carbon budget of terrestrial ecosystems under the background of global climate change and carbon neutrality and provides a scientific basis for the sustainable use of terrestrial ecosystems and the implementation of regional differentiation of ecological engineering.

2. Materials and Methods

2.1. Study Area

In this study, we focused on the dynamics of vegetation NPP in China. The land area of China is approximately 9,600,000 km2. The landscape of China varies significantly across its width, where the diverse landscape types and different hydrothermal conditions in the latitudinal, longitudinal and vertical terrains have formed a complex natural and geographical environment [34,35]. Geographically, the northwestern part of China is located in the hinterland of the Eurasian continent, the southeastern part of China faces the Pacific and the Qinghai-Tibet Plateau in southwestern China has some of the highest terrain on Earth. The distribution characteristics of major land covers in China showed significant spatial differences (Figure 1). The Greater and Lesser Khingan Range in the northeast, the Changbai Mountains, the Qinling Mountains in the middle and the southeast, central and southwest mountainous and hilly areas are covered by forestland. The Northeast Plain, the North China Plain, the Jianghuai River basin and the Sichuan basin are covered by cultivated land. Eastern Inner Mongolia to the Qinghai-Tibet Plateau and northern Xinjiang are covered by grassland. Most of the northwestern area is covered by desert [36,37,38].

2.2. Data and Processing

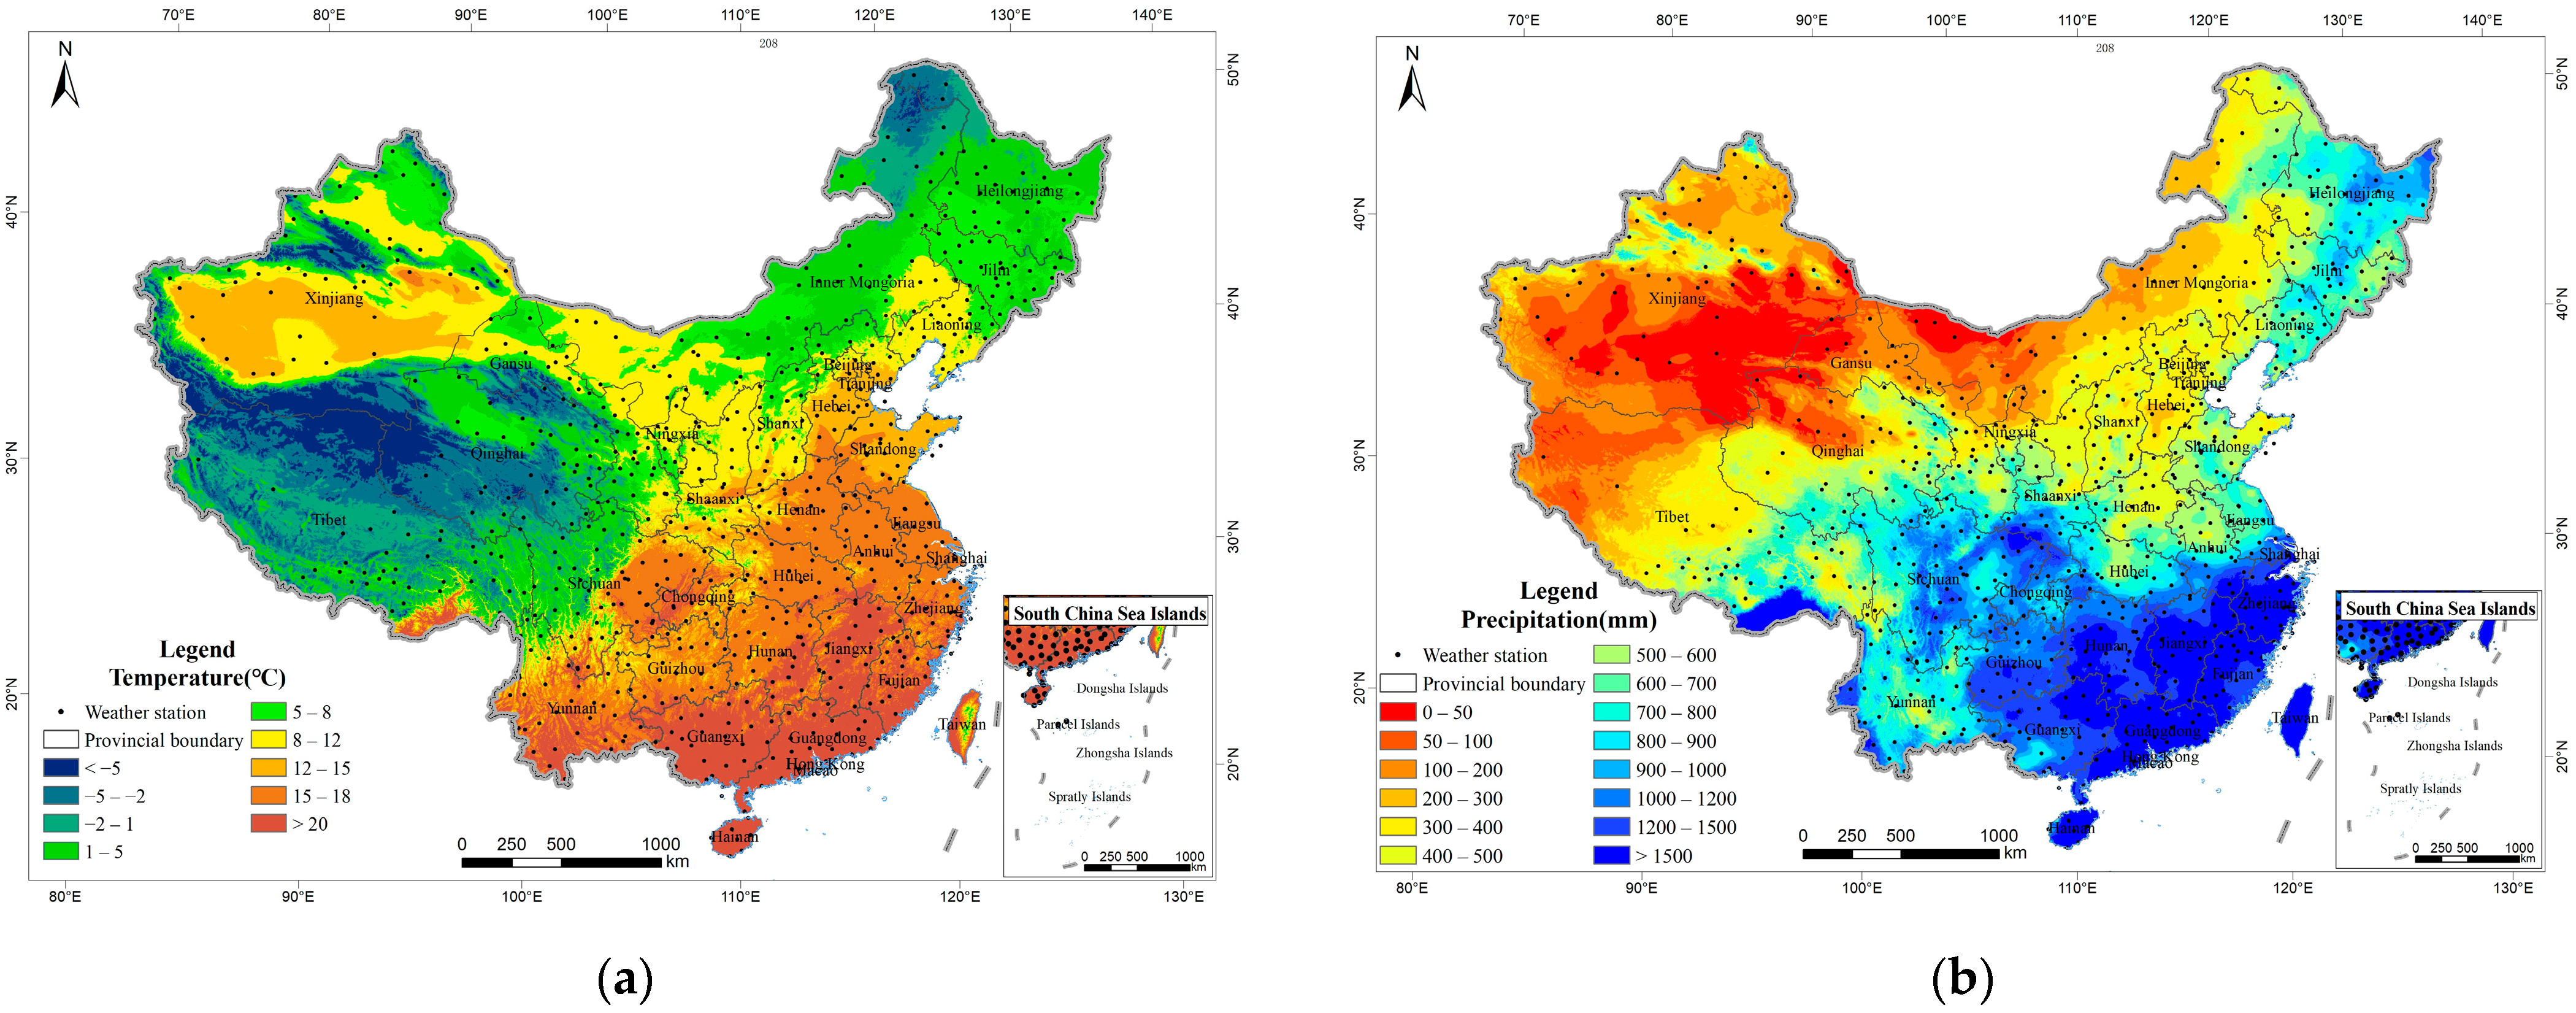
2.2.1. Meteorological Data

The meteorological data came from the “China Surface Climate Data Daily Value Data Set (V3.0)” of the China Meteorological Data Network (http://data.cma.cn, accessed on 24 December 2021) [39], which contains daily temperature and precipitation data from 699 weather stations in China since January 1951 (Figure 2). First, this study used the ANUSPLIN method [40,41,42,43] based on thin-slice spline theory to spatially interpolate the temperature and precipitation of the site and obtain the daily temperature and precipitation data at a resolution of 1 km across the country from 2000 to 2019. Second, the 0.25° × 0.25° daily precipitation grid data provided by the China Meteorological Data Network were used to control the quality of the interpolated precipitation data, and finally, the revised daily precipitation data with 1 km resolution across the country from 2000 to 2019 were obtained. Finally, the total annual precipitation (MTP) at a 1 km resolution was obtained by summing the corrected daily precipitation data at a resolution of 1 km. The average annual temperature (MAT) with a resolution of 1 km was obtained by averaging the interpolated daily temperature data with a resolution of 1 km.

2.2.2. The NPP Data of MODIS

The NPP data were derived from the MOD17A3HGF v006 product (https://lpdaac.usgs.gov/products/mod17a3hgfv006/, accessed on 24 December 2021) [44], which provides data on the annual value of vegetation NPP after 2000; the unit is kgC/m2/a, the numerical scaling factor is 0.0001, the time resolution is 1 year and the spatial resolution is 500 m. The data product level is L4 [45], and it has been processed by atmospheric correction, radiation correction, geometric correction and cloud removal. We used MRT tools and Python language to perform subset extraction, format conversion, projection transformation, image mosaicking, research area cropping and other processing on MOD17A3HGF v006 products and finally obtained the NPP data of MODIS for China from 2000 to 2019, which is called MODIS-NPP in this article.

2.2.3. NPP Verification Data

There are two types of NPP data used for MODIS-NPP accuracy verification (Figure 3): (1) Grassland quadrat biomass data set. The data set includes 120 sample data collected by Fan [46,47] in the Three-River Headwaters Region (TRHR) from 2004 to 2006 and 48 grassland sample plot data collected in Inner Mongolia in 2010. The biomass data of grassland quadrats has been were converted into NPP data. The quadrat biomass data set was obtained by randomly setting five 1 m × 1 m small sample frames (alpine meadow 0.5 m × 0.5 m) during the period of maximum cultivation and growth, and collecting the plant sample in the square by the method of full rotation cutting. Information was collected on the latitude and longitude, topography, records, climate conditions, community characteristics, coverage of dominant species and other information. After drying for 48 h at 65 °C in a constant temperature drying oven, the dry weight (DM/m2) of the plant sample was measured and recorded as the above-ground biomass of the sample. The underground biomass was sampled from the 10–30 cm deep soil layer in the sample plots, and then washed in clean water using a 0.3 mm mesh screen to separate the roots and other underground biomass from the soil. To minimise human interference, sample plots were usually selected on grasslands that were enclosed and were not grazed or mowed in the same year. (2) Reference data set for carbon cycle research of China’s typical forest ecosystems [48]. This data set provides long-term carbon cycle benchmark observation data products of 10 typical forest ecosystems in China from 2005 to 2015, based on the CERN long-term dynamic monitoring database. These monitoring data were collected in keeping with CERN’s protocols of observation and quality control [49,50]. There were occasional missing data in time-continuous meteorological observations; therefore, the data were processed by standardised gap filling [51]. The data set represents 80% of China’s forest areas, including basic observation data sets such as biology, soil, atmosphere and moisture, as well as vegetation, soil carbon pools, productivity, respiration and carbon sinks.

2.2.4. Ecosystem Macro Structure Data

The 2015 ecosystem macro structure data (Figure 3) came from the research results of Liu’s research group at the Institute of Geographic Sciences and Natural Resources Research, Chinese Academy of Sciences [37]. The spatial distribution data of China’s terrestrial ecosystem types were formed by the identification, research and classification of various ecosystem types based on the 1:100,000 scale land use/land cover data (LUCC) obtained after remote sensing interpretation [52,53]. The spatial resolution of these data is 1 km, and data are included for seven types of ecosystems, including farmland, forest, grassland, water and wetland, desert, settlement and other. The farmland ecosystem mainly includes paddy and dry fields. The forest ecosystem mainly includes forestland, shrubland, sparse woodland and other woodlands. The grassland ecosystem includes high-coverage grassland, medium-coverage grassland and low-coverage grassland. The water and wetland ecosystem includes canals, lakes, reservoir ponds, permanent glacier snow, tidal flats and beaches. The desert ecosystem includes sandy land, Gobi, saline land, alpine desert and tundra. The settlement ecosystem includes urban land, rural settlement and other construction land. The other ecosystems mainly include bare soil and bare rock texture.

2.2.5. Nature Reserve Data

China’s nature reserves refer to areas where typical ecosystems, concentrated distribution areas of rare and endangered wild animals and plants, and natural relics of special significance are protected. The “2013–2016 National Nature Reserve Spatial Distribution Data Set” used in this study was derived from the special scientific and technological basic work “Data Integration and Standardization of Basic Science and Technology Work (2013FY110900)”. The data set contains 1134 national, provincial or county-level nature reserves and 10 protection types (Table 1). It should be noted that many wild animal and wild plant nature reserves are distributed with forest, grassland and desert ecosystems, so these three ecosystems are effectively protected here. This research selected 741 national and provincial nature reserves (Figure 4), with a total area of 1,302,200 km2, and then used LUCC data to eliminate water bodies, glaciers, snow and artificial surfaces in nature reserves. The remaining part was used to simulate the vegetation NPP of the climax background of the forest, grassland and desert ecosystems in China. This study believes that the abovementioned nature reserves have undergone years of strict protection with little human disturbance, and the authenticity, integrity and stability of the forest, grassland and desert ecosystems in their areas have approached their zonal climax backgrounds.

2.2.6. Ecological Geographic Area Data

This study adopted the framework plan of China’s ecogeographical zonal system formulated by Zheng Du et al. [54], that is, the three-level classification of China’s ecogeographical zones, which includes 10 first-level zones, 21 second-level zones and 49 third-level zones. In the process of subregional regression analysis of climax background NPP and meteorological elements, two conditions needed to be met: (1) A certain number of nature reserves must be included in each ecogeographical zone; and (2) a more refined ecogeographical division was used to make the fitting analysis more accurate. Based on the above two conditions, we selected the 21 second-level zones of China’s ecogeographical divisions as the ecogeographical zones of this study (Table 2). We adopted the principle of proximity or similar climate conditions to merge the zones in which nature reserves were not included into other zones.
There were 15 secondary zones after adjustment (Figure 4). The adjusted zones and their adjustment bases were as follows: (1) The former IA and the IIA were merged because the area of the original IA zone was not large, the climax background in the IA zone was less distributed and the climate was not much different from the original IIA zone, so the two zones were merged. (2) Combining the original IIIA zone with the original IIIB zone, the original IIIA zone was a low mountain and hilly deciduous broad-leaved forest and an artificial forest area in Jiaodong-Liaodong. We merged the two zones because the original IIIA zone had less climax background distribution, and it was adjacent to the original IIIB zone. (3) The original HID zone and the HIID zone were merged. The original HID zone was small and surrounded by the HIID zone, so the HID zone and the HIID zone were merged. (4) The original VIIA zone and the VIIIA zone were merged with the VIA zone. The areas of the original VIIA and VIIIA zones were small, and these three zones had less climax background distribution but had relatively small differences in climate, so we merged them into one zone. (5) The original IXA zone was an equatorial tropical humid area, mainly distributed in the Spratly Islands. This zone was not the key area of this study, so we did not include it.

2.3. Methods

2.3.1. Trend and Significance Test of NPP

The trend of NPP for many years was calculated using Sen’s slope [55]. Sen’s slope avoids the loss of time series data and the influence of data distribution on the analysis results, and it can eliminate the interference of outliers on the time series [56]. It has superior performance in the trend analysis of time series. The calculation formula of Sen’s slope is as follows:
S = m e d i a n ( x j x i ) j i   ,   1 < i < j < n
where S is Sen’s slope, and x j and x i are the sequence values at times j and i, respectively. If S > 0, the time series data show an upwards trend; otherwise, they show a downwards trend.
Sen’s slope is obtained by calculating the median value of the sequence. It can reduce the noise interference very well, but it cannot realise the significance test of the sequence trend by itself [57]. The Mann–Kendall (MK) trend test method is a nonparametric test method recommended by the World Meteorological Organization (WMO) and has been widely used [58,59,60,61]. The advantage of using the MK test is that the sample does not need to obey a certain distribution, and it is not sensitive to missing values and outliers; thus, the MK method was introduced to test the significance of the trend of long-term NPP data [59,62]. The statistical test method is as follows:
For the time series X k , k = 1, 2, 3, … i, …j, …, n, define the standardised test statistic Z :
Z = { S V a r ( S )   S > 0   0                         S = 0 S + 1 V a r ( S )   S < 0
S = i = 1 n 1 j = i + 1 n s i g n ( x j x i )
s i g n ( θ ) = { 1   θ > 0 0   θ = 0 1   θ < 0
where, x j and x i are the sequence values at time j and i, respectively. n is the number of data. When n ≥ 8, the test statistic S is approximately normally distributed, and its mean and variance are as follows:
E ( S ) = 0
V a r ( S ) = n ( n 1 ) ( 2 n + 5 ) 18
Given the significance level α, if | Z | > Z 1 α / 2 , the hypothesis indicating that the current time series data does not have a trend is rejected, and there is an obvious trend change; Z 1 α / 2 is the value corresponding to the standard normal function distribution table at the significance level α. This research considered the significance levels α = 0.1 and α = 0.05 for the significance test. When | Z | is greater than 1.65 or 1.96, the change trend of the data series passes the significance test with a confidence of 90% or 95%, respectively. Additionally, combined with the positive and negative Sen trends, the significance test results were defined as five types: Significant decrease, relatively significant decrease, no significant change, relatively significant increase and significant increase (Table 3).

2.3.2. Climax Background Vegetation NPP Simulation of Forest, Grassland and Desert Ecosystems

To protect representative natural ecosystems, the Chinese government has built a large number of nature reserves with the purpose of reducing human interference; protecting the authenticity, integrity and stability of the ecosystem in the zones; and restoring the degraded ecosystem climax background ecosystems in which species compositions, diversities and community structures are close to those of the zonal communities. China’s national and provincial nature reserves can effectively reduce human interference and protect the authenticity, integrity and stability of the excellent ecosystems in the region. They can also restore degraded ecosystems to the climax background ecosystems in which the species compositions, diversities and community structures are close to those of the zonal communities. Therefore, the vegetation in nature reserves with forests, grasslands and deserts as the protection objects selected in this research is suitable as the climax background.
The zonal climax background in this study refers to a zonal community on the surface of the earth that is compatible with meteorological conditions and can fully reflect the climate characteristics of a region. While the vegetation NPP of artificial oasis, irrigated agricultural area and artificial forestation area is relatively high, it does not meet the concept of the climax background of our research. Furthermore, to make the simulation results consistent with the actual natural environment, the simulations of sandy land, permanent snow glaciers and water bodies simulations eliminated in this research.
There are two ways to extend the climax background NPP of the local scale to the regional scale: (1) The direct assignment method. That is, the climax background value of the local scale is directly assigned to the larger-scale ecogeographic area. The advantage of this method is that it is relatively simple. The disadvantage is that each ecogeographic area uses only one value, thus ignoring the spatial differences in the climate and other factors at the cell scale, which results in large errors in the research at the pixel scale. (2) Regression analysis method for meteorological conditions. This method assumes that the various types of ecosystems in the nature reserve are less affected by human interference, and the vegetation NPP can be regarded as only affected by natural factors such as climate. It can be divided into ecological geographic zones and ecosystem types. The vegetation NPP, temperature, precipitation and other natural elements of each zone can be regression analysed at the pixel scale, and the regression relationship can be calculated for a larger area to obtain a larger area climax background NPP.
The meteorological conditions regression analysis method was used to obtain the vegetation NPP of the climax background of the forest, grass and desert ecosystems in China. The specific process mainly includes the following three stages:
(1)
Multiyear mean meteorological and NPP data preparation. (1) The MAT and MTP of China from 2000 to 2019 were averaged and the 20-year M A T a v g and M T P a v g were obtained. (2) The China NPP data from 2017 to 2019 were averaged, and the 3-year average NPP data N P P a v g were averaged. The NPPavg values of the nature reserves were regarded as the climax background NPP.
(2)
ArcGIS software was used to obtain the ecogeographical zones, ecosystem types, MATavg, MTPavg and NPPavg of each point within the nature reserve. (1) ArcGIS’s ‘Raster To Point’ function was used to transfer the nature reserves in raster format NR to a vector point file N R p o i n t . (2) We used the vector point file N R p o i n t to extract the values of ecological geographic zones, nature reserves, M A T a v g , M T P a v g and N P P a v g data by the ArcGIS ‘Extract Multi Values To Points’ function, and obtained the vector point file N R p o i n t 1 . (3) The N R p o i n t 1 data’s attribute table contained each ecogeographical zone, ecosystem type, MATavg, MTPavg and NPPavg of each point.
(3)
Linear fitting of climax NPP and meteorological factors in nature reserves. (1) The attribute table of the N R p o i n t 1 data was exported to an Excel table file. (2) Taking NPPavg as the dependent variable and MATavg and MTPavg as the independent variables, 41 binary linear regression equations were fitted according to the ecogeographical zones and ecosystem type (Table 4), and each equation obtained three parameters a i j , b i j and c i j , where i and j represent the parameters of ecosystem type j in the ecogeographical zone i.
(4)
According to the MATavg and MTPavg of China, the regression equations obtained by stage 3 were used to calculate the climax background vegetation NPP of China’s forest, grass and desert ecosystems. NPP was calculated as follows:
N P P i j = a i j + b i j × M A T a v g + c i j × M T P a v g
where N P P i j is the climax background vegetation NPP (gC/m2/a) of the ecosystem type j in the ecogeographical zone i; M A T a v g is the average temperature of China (°C); and M T P a v g is the average precipitation of China (mm). a i j , b i j and c i j are the parameters of the linear regression equations of the ecosystem type j in the ecogeographical zone i. The obtained fitting equation, R2 and significance values are shown in the Table 4.
For deserts in HIIA-B, forests in IIIC, forests and grasslands in IVA and grasslands in VIA, the fitting equations were not significant (p > 0.5) because the number of nature reserves for these ecosystem types in the abovementioned zones was relatively small. For this reason, this research used the F test to test the significance of the fitting equation and found that the model significance satisfies p < 0.05, so we still used the fitting equations to calculate the climax background NPP of China’s forest, grass and desert ecosystems.
Theoretically, the climax background NPP as the expected target value of ecological restoration should be no worse than the data of all historical years. The maximum value of each year also objectively showed the target restoration value that the current pixel could achieve, so this pixel could be used. The maximum NPP in historical years was regarded as the climax background NPP. On this basis, the maximum value of NPP in historical years was used to correct the climax background NPP.

2.3.3. Restoration Potential of NPP Calculation of Forest, Grassland and Desert Ecosystems

The restoration potential is the difference between the restoration status of the NPP of the ecosystem vegetation and the NPP of the zonal climax background in the same ecosystem. The calculation formula is as follows:
N P P p = N P P T o p N P P c u r
where N P P p is the restoration potential of vegetation NPP; N P P T o p is the climax background NPP; and N P P c u r is the restoration status of vegetation NPP.
Considering that the vegetation NPP data in a single year are greatly affected by climate fluctuations and cannot accurately reflect the restoration status of the ecosystem, this paper used the 3-year average value of the vegetation NPP of the forest, grassland and desert ecosystems from 2017 to 2019 as the restoration status. Furthermore, to compare with the climax vegetation NPP, we eliminated the restoration status NPP data of sandy land, permanent snow glaciers and water bodies.
The word “potential” is usually regarded as a commendatory word; that is, the greater the potential is, the better the result. However, in this study, the restoration potential of vegetation is a neutral term that represents the gap between the current vegetation restoration status and the climax background of the natural zones.

2.3.4. Multiple Regression Residual Analysis

Residual analysis analyses the reliability, periodicity or other interference of the data through the information provided by the residual. The residual refers to the difference between the observed value and the predicted value. The multiple regression residual analysis method can be used to study the influence and relative contribution of meteorological conditions and human activities on vegetation change [63,64,65]. The main steps are as follows: (1) Based on the national MODIS-NPP ( N P P o b s ), MAT and MTP time series data from 2000 to 2019, with N P P o b s as the dependent variable and MAT and MTP as the independent variables to fit a binary linear regression equation pixel by pixel, each equation obtained three parameters a m n , b m n and c m n . m and n represent the parameters of the mth row and nth column in the raster data. (2) Based on the MAT and MTP time series data and regression model, the vegetation NPP predicted value ( N P P c c ) was calculated. (3) The difference between N P P o b s and N P P c c , that is, the residual of vegetation NPP ( N P P h a ), was calculated.
N P P k m n c c = a m n × M A T k m n + b m n × M T P k m n + c m n
N P P k m n h a = N P P k m n o b s N P P k m n c c
where N P P k m n c c is the predicted value of vegetation NPP of the mth row and nth column in the kth year, and the unit is gC/m2/a. N P P k m n o b s is the MODIS-NPP observation value of the mth row and nth column in the kth year, and the unit is gC/m2/a. a m n , b m n and c m n are model parameters of the mth row and nth column in the raster data. M A T k m n and M T P k m n are the average annual temperature and total annual precipitation of the mth row and nth column in the kth year, respectively. N P P k m n h a is the residual of the mth row and nth column in the kth year. The ratio of the trend of N P P k m n c c and N P P k m n h a to the trends of N P P k m n o b s was used to characterise the contribution rates of meteorological conditions and human activities to vegetation NPP changes, respectively.

2.3.5. Uncertainty Estimation Approaches

In this paper, we analysed the uncertainty of the climax background vegetation NPP according to the uncertainty of the climax vegetation NPP simulation equation (Table 4). The method replaced the upper and lower limits (significance level 0.05) of the regression equation parameters a i j , b i j and c i j in Table 4 with the a i j , b i j and c i j parameters in Equation (7), respectively, and simulated the climax background vegetation NPP. The upper and lower limits of the climax vegetation NPP were obtained, that is, the uncertainty of the climax vegetation NPP.
The restoration potential is the difference between the restoration status of the NPP of the ecosystem vegetation and the zonal climax background vegetation NPP (Equation (8)). The restoration status was obtained by averaging the annual MODIS-NPP values over many years, and its uncertainty did not need to be calculated, so the uncertainty of restoration potential was determined by the uncertainty of the climax background vegetation NPP according to the principle of error conduction.

3. Results and Analysis

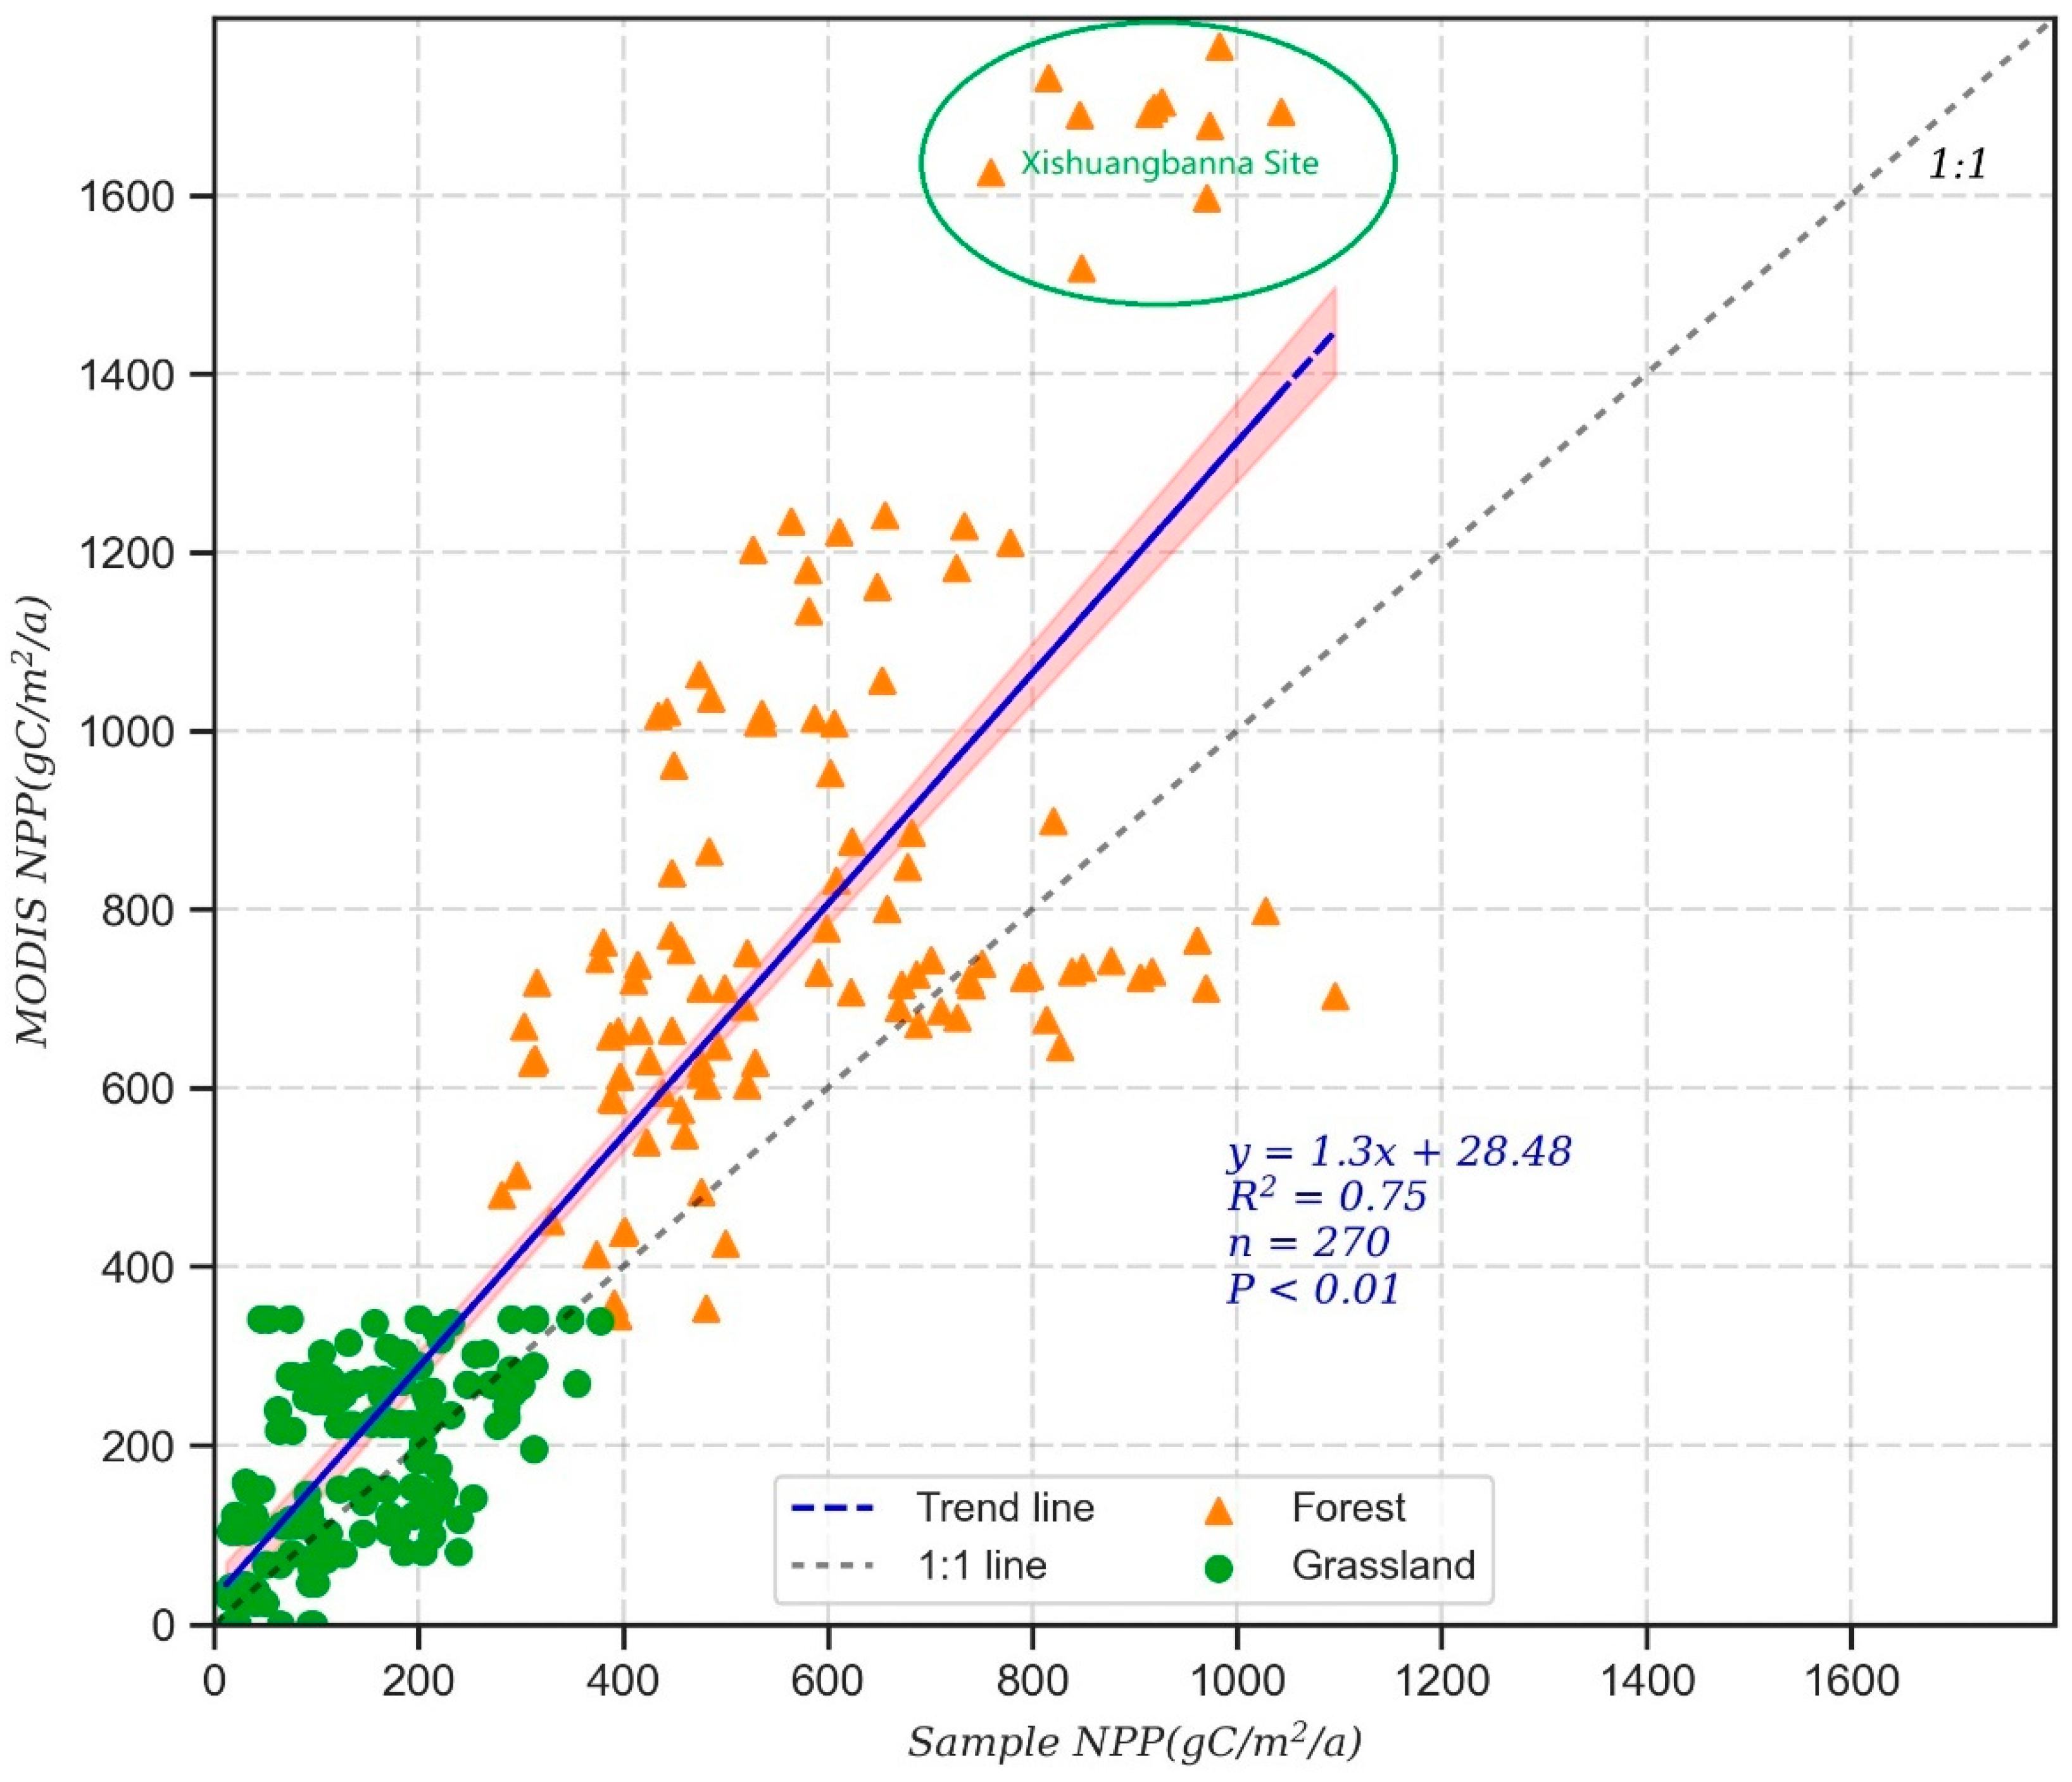
3.1. MODIS-NPP Data Accuracy Verification

The accuracy verification of vegetation NPP simulation results is one of the main difficulties faced by current regional NPP estimation model research. We used the measured NPP data to verify MODIS-NPP data [13,17]. First, according to the location information of each station (or sample), we extracted the MODIS-NPP pixel values at the same location and the same year at the station (or sample), and finally obtained 270 station-years with the measured NPP data and MODIS-NPP pairs. Then, considering the impact of the flux tower carbon footprint, this study used the MODIS-NPP average value in a 3 × 3 pixel window around the station (or sample) for comparison and verification with the measured NPP data [5,66,67,68]. Finally, the Python statistical analysis toolkit was used to perform statistical analysis on the measured NPP data and MODIS-NPP data pairs. The results showed that the trend line of MODIS-NPP and the measured NPP was near the 1:1 line, and the coefficient of determination R2 was 0.75. The MODIS-NPP data had high simulation accuracy and high consistency with the measured NPP data, which was suitable for NPP research on China’s terrestrial ecosystem.
The MODIS-NPP value of the Xishuangbanna site (Figure 5 in the green circle) was greater than 1400 gC/m2/a, which was higher than that of the other sites. The vegetation type of the Xishuangbanna site is tropical monsoon forest, the forest age is 200 year and the dominant tree species are evergreen trees, including Pometia pinnata and Terminalia myriocarpa. Because this site has better climate conditions, more green plant biomass and stronger photosynthesis, the MODIS-NPP value is higher. However, MODIS-NPP will be somewhat overestimated in grassland and forest by using a t test. For example, the NPP values of the grassland (Figure 4, green circle points) samples and MODIS were 134.66 ± 87.45 and 172.90 ± 100.18 (p < 0.01), respectively. The NPP values of the forest (Figure 5, yellow triangle points) samples and MODIS were 603.11 ± 200.55 and 853.36 ± 343.44 (p < 0.01), respectively.

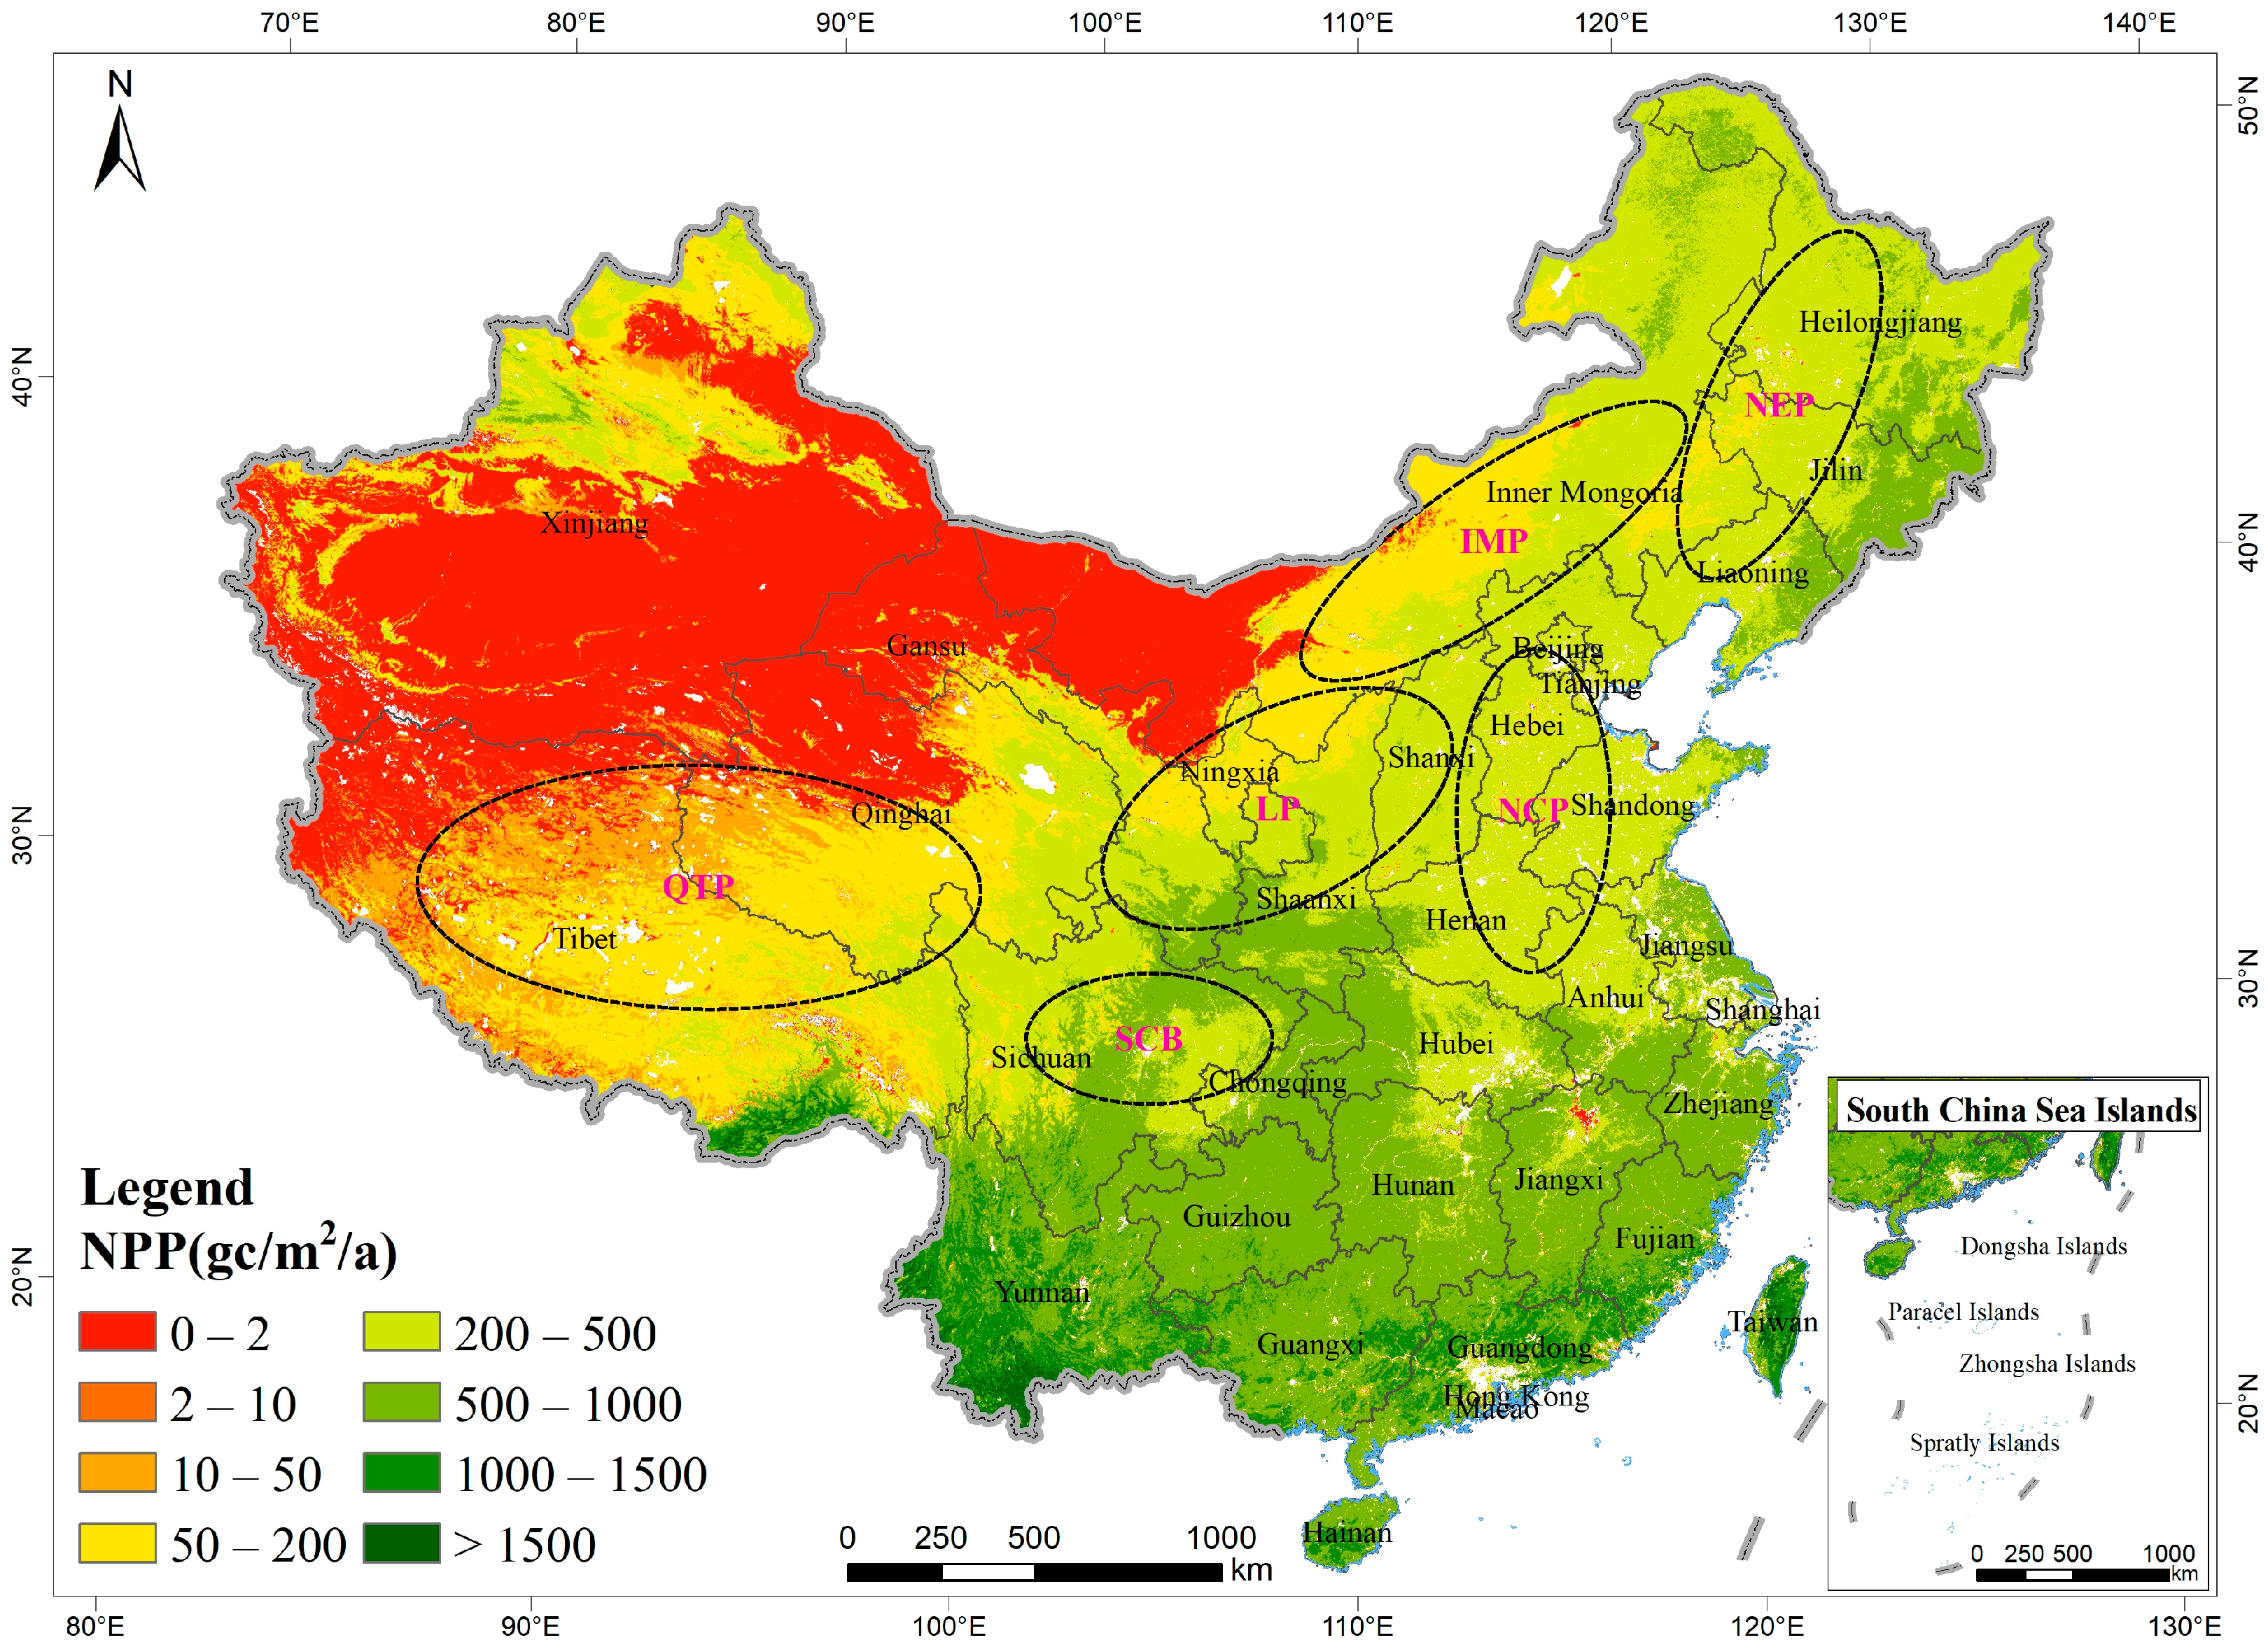
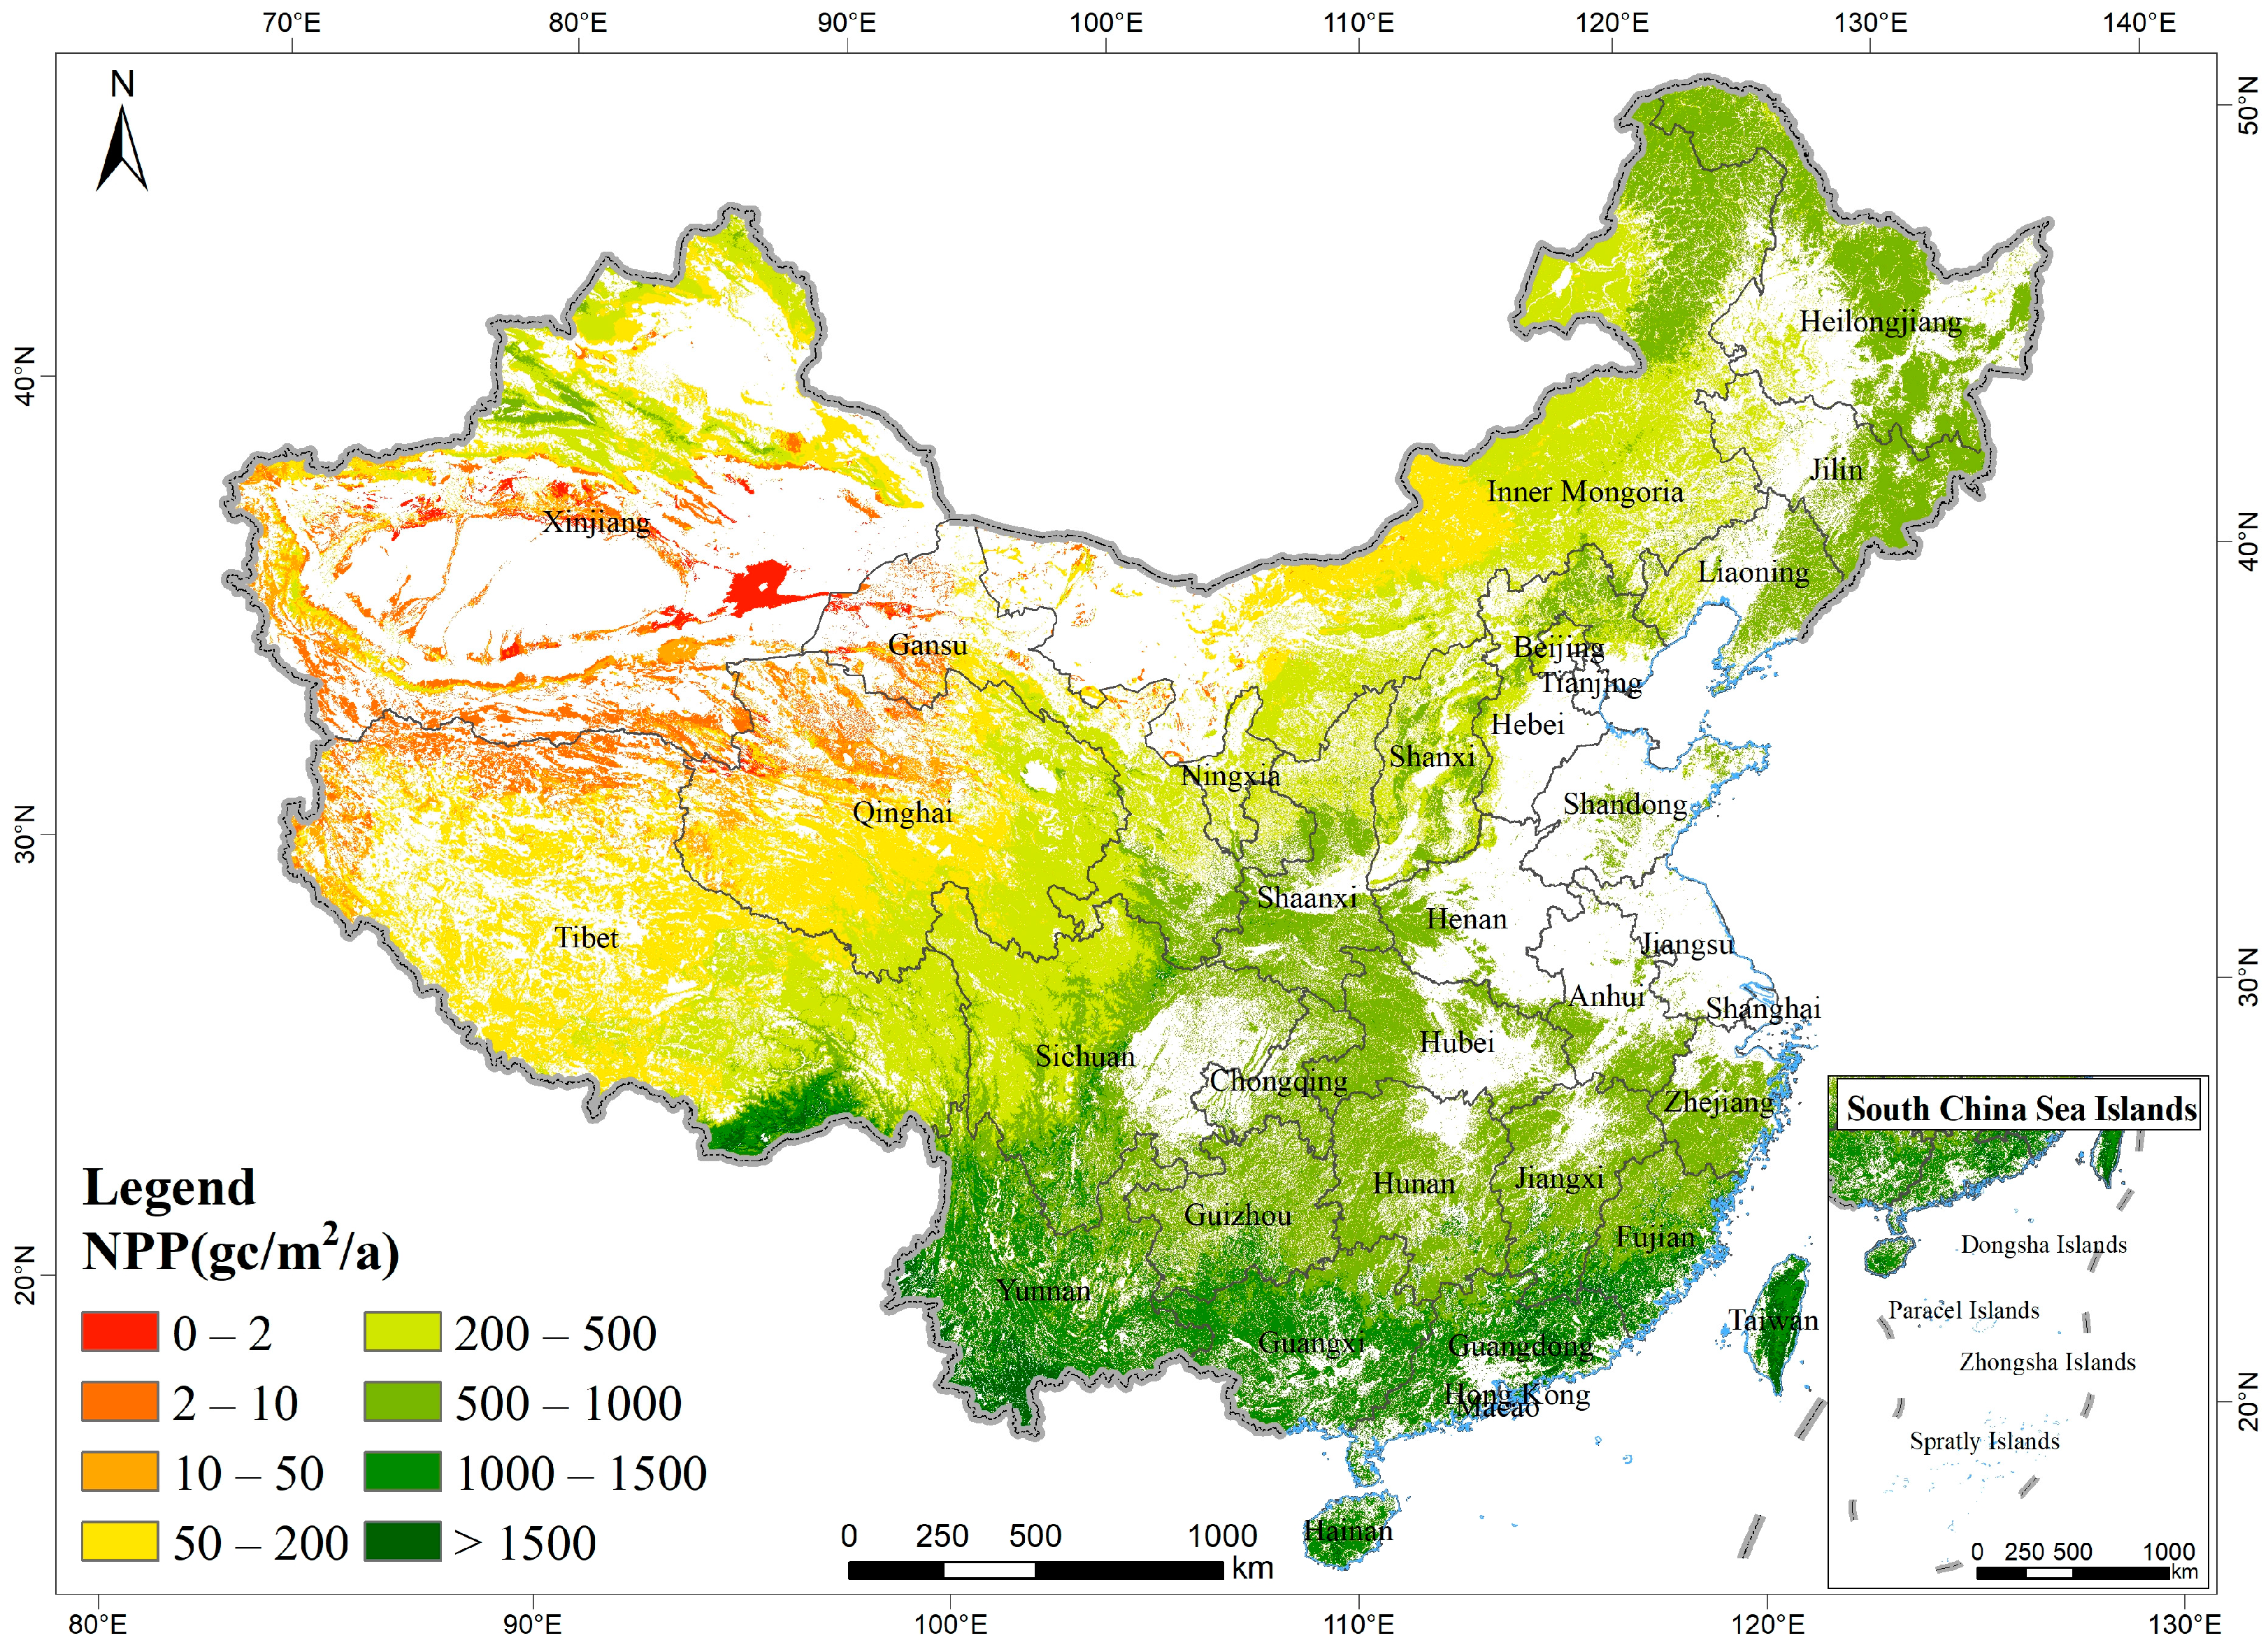
3.2. Spatial Patterns of Vegetation NPP

The spatial patterns of vegetation NPP in China had obvious spatial distribution differences. Generally, there was a decreasing trend from southeast to northwest along the water and heat gradients (Figure 6), and this trend was related to the spatial distributions of meteorological conditions, topography, soil and vegetation [13,69]. The water and heat conditions in southern China were relatively good, forest vegetation accounted for a relatively large proportion of vegetation and the vegetation coverage was relatively high; thus the NPP in southern China was relatively high. For example, the NPP of the southern Qinghai-Tibet Plateau, Yunnan and Guangxi was greater than 500 gC/m2/a, while the NPP was relatively low in northwestern China because northwestern China is mainly composed of grassland and deserts, so vegetation growth is obviously restricted by precipitation. For example, vegetation NPP was less than 200 gC/m2/a in most areas of southwestern Qinghai, southwestern Tibet and central and western Inner Mongolia. The statistical results show that the area with vegetation NPP between 200 and 500 gC/m2/a accounted for the largest proportion (Table 5), which was 30.59%, mainly distributed in the Northeast Plain, North China Plain, eastern Inner Mongolia Plateau and the southeastern Qinghai-Tibet Plateau, where farmland or grassland ecosystems are widely distributed in the abovementioned areas.
From the perspective of the ecosystem, the average NPP per unit area of forest vegetation in China was 667.35 gC/m2/a, and the annual total NPP of vegetation was approximately 1.50 PgC. The average per unit area of grassland vegetation NPP was 229.45 gC/m2/a, and the annual total NPP of vegetation was approximately 0.60 PgC. The average unit area of desert vegetation NPP was 15.93 gC/m2/a, and the annual total NPP was approximately 0.02 PgC.

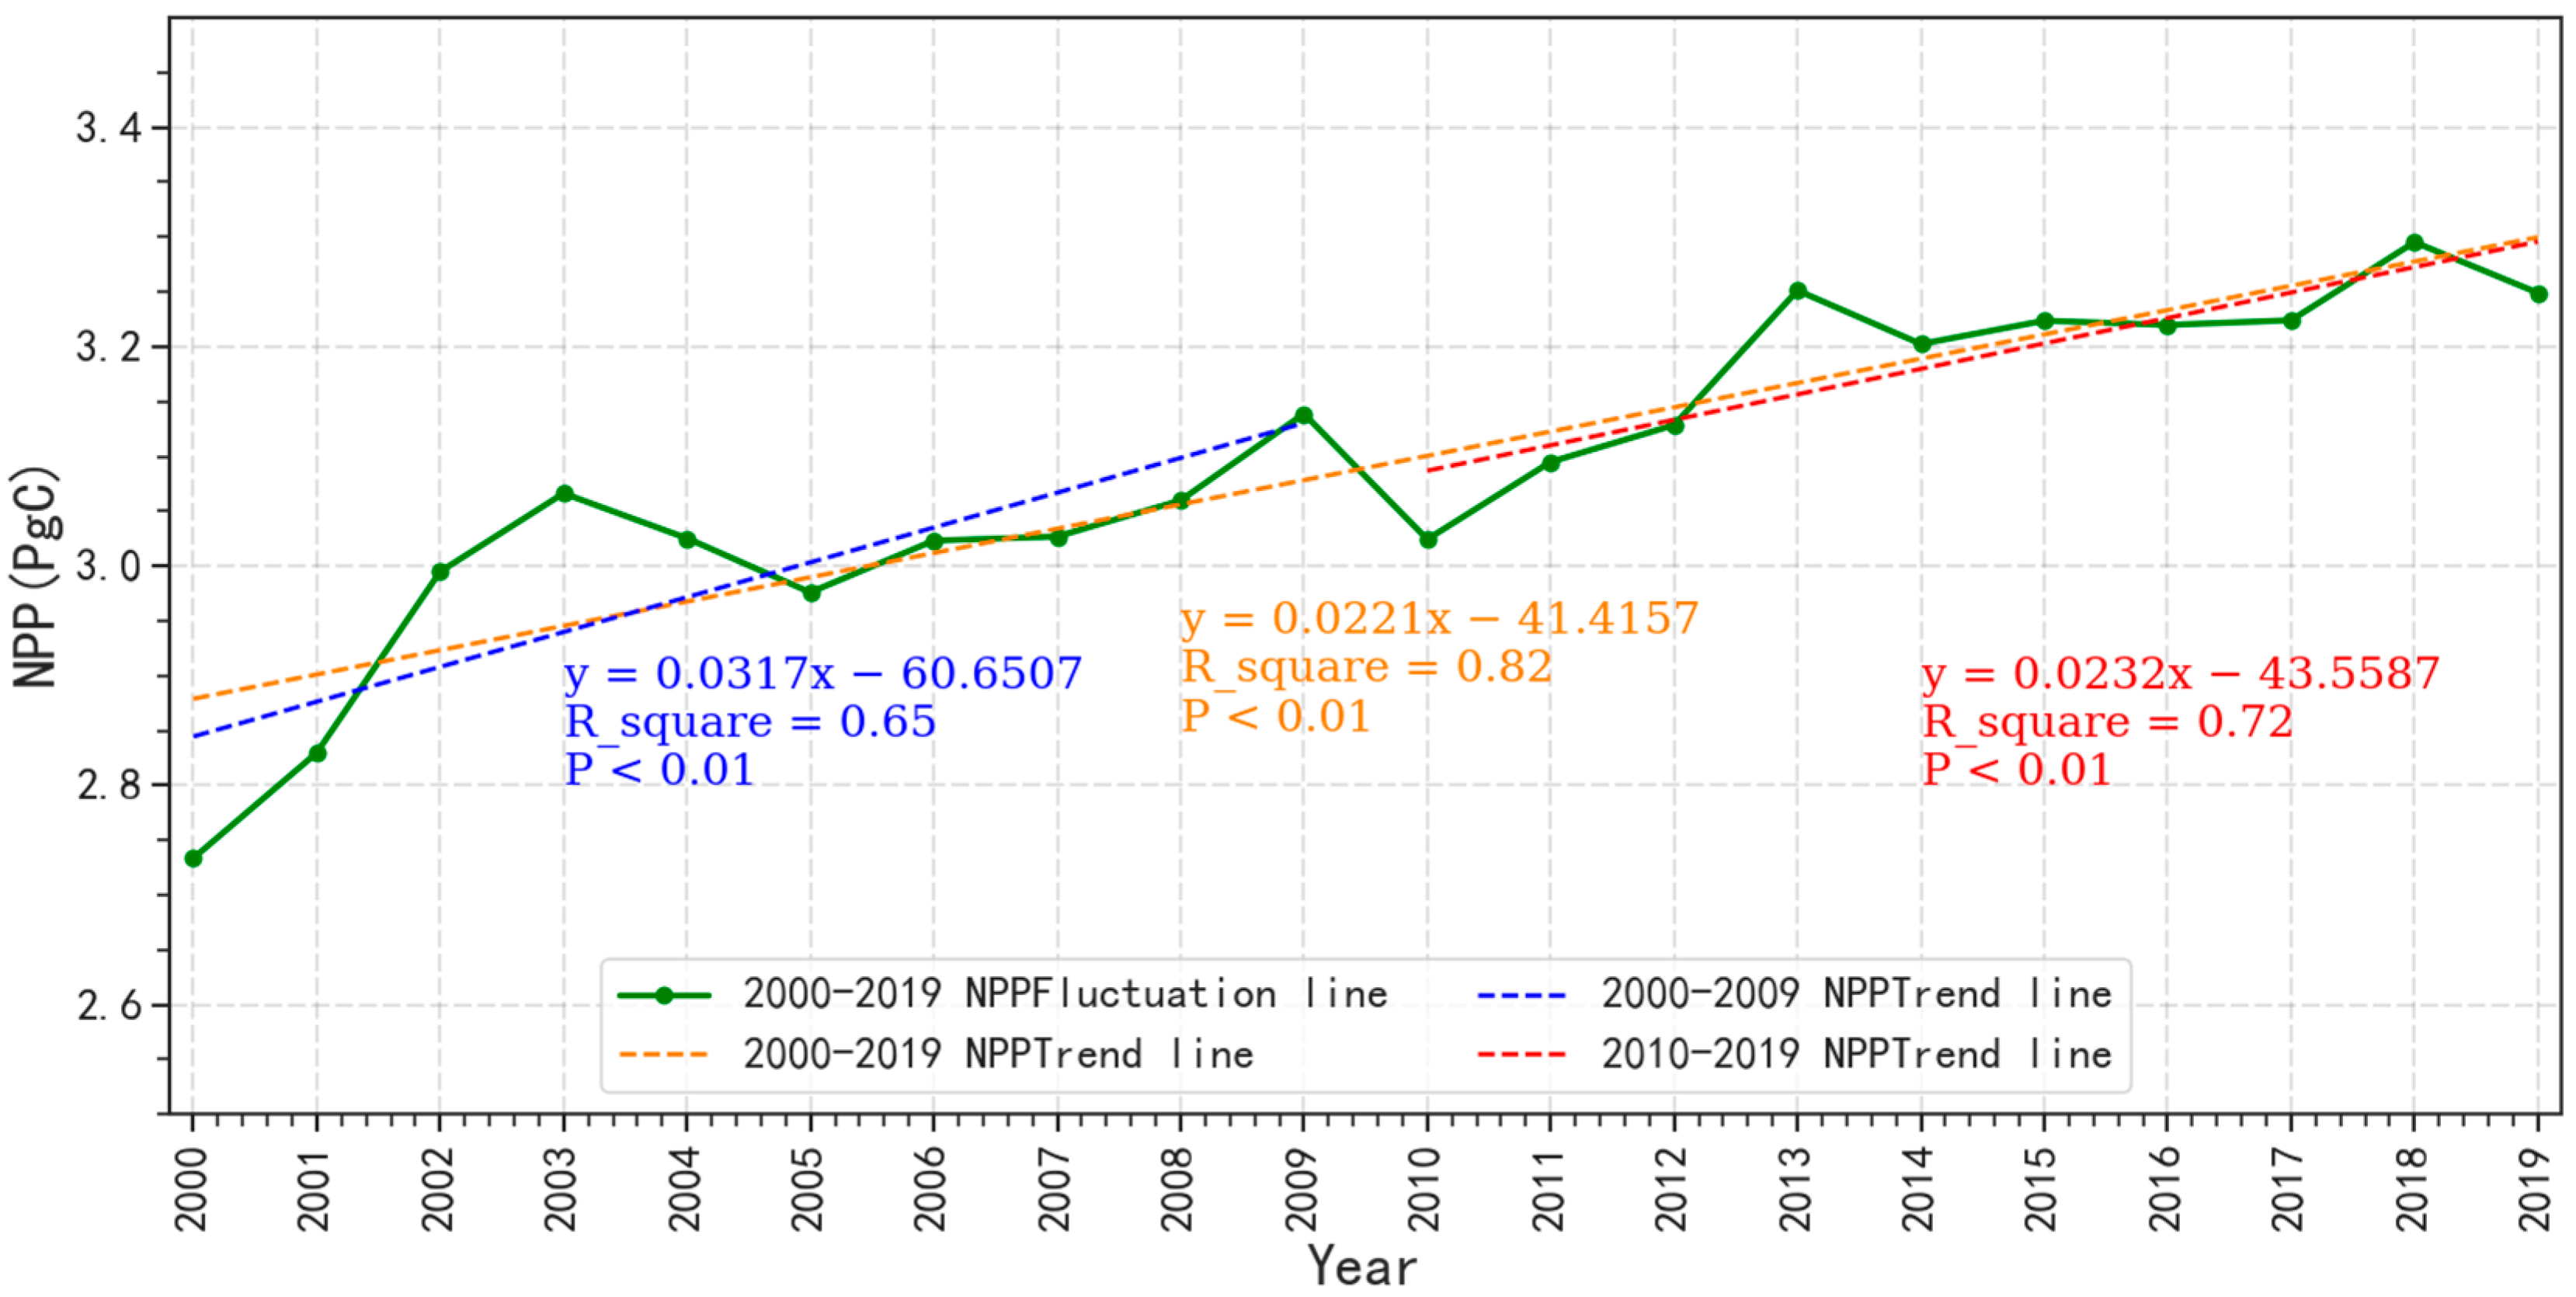
3.3. Change Trend of Vegetation NPP

The annual total NPP of vegetation in China’s terrestrial ecosystems varied between 2.72 and 3.29 PgC from 2000 to 2019 (Figure 7), with a multiyear average of 3.09 PgC, which accounted for approximately 5.15% of the total global NPP of 60 PgC in the IPCC 6th Assessment Report [70]. In the past 20 years, the annual total NPP of China’s terrestrial ecosystem vegetation has increased by approximately 15.86%, or 0.52 PgC. The annual total NPP of China’s terrestrial ecosystem vegetation fluctuated significantly from 2000 to 2019 (p < 0.01), and the trend was 0.022 PgC/a. In the first ten years of the study period, the trend was 0.03 PgC/a, and the increasing trend was significant (p < 0.01); in the next ten years, the trend was 0.023 PgC/a, and the increasing trend was significant (p < 0.01).
The highest value appeared in 2018, and the annual total NPP was 3.29 PgC. The lowest value appeared in 2000, and the annual total NPP was 2.73 PgC. Since the reform and opening up, due to the accelerated development of industrialization, urbanization and agricultural modernization and the irrational or excessive utilization of resources, the ecosystem has been severely degraded, so the NPP in 2000 was relatively lower than that in other years. Since the beginning of the 21st century, benefiting from climate warming and humidification, and the effective implementation of ecological engineering [18,19,20], which have effectively protected and restored vegetation in some project areas, the NPP in 2018 was higher than that in other years.
From the perspective of the trend of vegetation NPP (Figure 8a), the average trend of vegetation NPP in China from 2000 to 2019 was 2.39 gC/m2/a2. The trend of vegetation NPP in most areas was positive, while the area with a negative trend accounted for 10.21%, and the area with no obvious change accounted for 21.69%. This result was consistent with Zhao’s report that the national NPP from 2001 to 2015 appeared as a growth trend, accounting for 65.29% of the area [15]. The places with a change trend of more than 5 gC/m2/a2 were mainly distributed in the agro-pastoral zone, the eastern Sichuan Basin and the Greater Khingan Range. The average increasing trend in the Loess Plateau was 7.12 gC/m2/a2. The places with a change trend of less than −5 gC/m2/a2 were mainly distributed in the southern Qinghai-Tibet Plateau and Guangdong, Fujian, Yunnan and other places in the south. The decreasing trend in southern Tibet was below −10 gC/m2/a2. The NPP change trend in most areas of the Qinghai-Tibet Plateau was between 0 and 3 gC/m2/a2. The NPP in the vast area of the northwest showed a certain decreasing trend, between −3 and 0 gC/m2/a2.
The MK method was used to test the significance of the trend of vegetation NPP across the country from 2000 to 2019 on a pixel scale (Figure 8b). The spatial distribution pattern of significance was relatively consistent with the spatial distribution of change trends. (1) The area with significant increases included the Loess Plateau, which was 274.69 × 10⁴ km2 (Table 6), and included the agro-pastoral zone, the eastern Sichuan Basin, the Loess Plateau and the Greater Khingan Range. (2) The areas with relatively significant increases were mainly distributed around places with significant increases, such as the Qinghai-Tibet Plateau, Inner Mongolia Plateau and North China Plain. (3) The area with a significant decrease was 6.47 × 10⁴ km2, and was found in southern Tibet. (4) The area with no significant change was 457.28 × 10⁴ km2, in northwestern China and the western Qinghai-Tibet Plateau. (5) The area with a relatively significant increase was 166.06 × 10⁴ km2. The area with a relatively significant decrease was 16.56 × 10⁴ km2, scattered in southern China, including Guangdong, Fujian, Yunnan and other places.

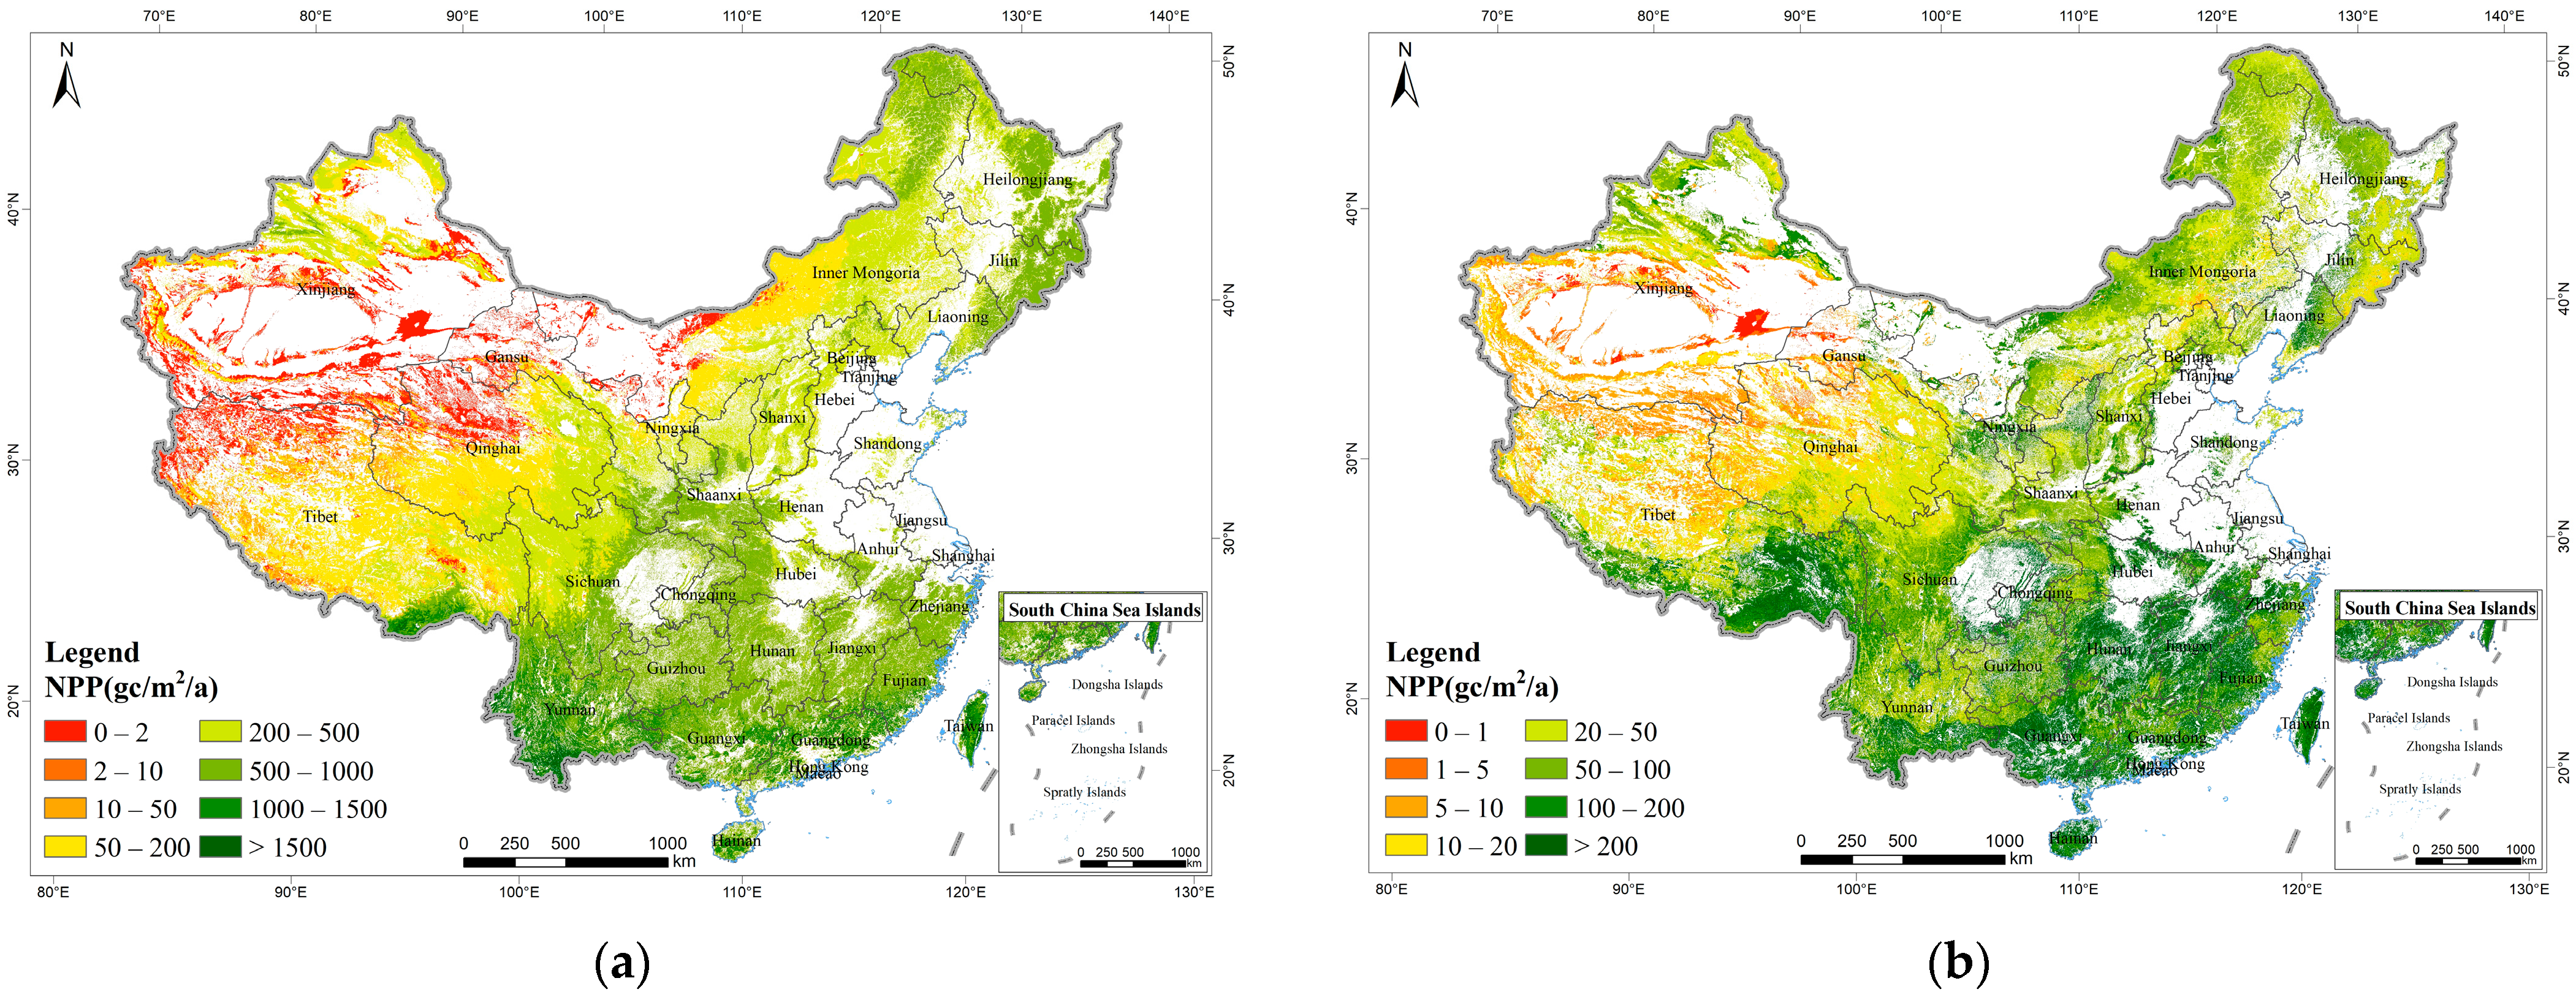
3.4. Climax Background NPP of Forest, Grassland and Desert Ecosystems

The climax background NPP of the forest, grassland and desert ecosystems across the country showed large spatial differences. Generally, there was a decreasing trend from southeast to northwest along the water and heat gradients (Figure 9). The NPP was approximately 545.80 ± 55 gC/m2/a, and the annual total NPP was approximately 2.76 ± 0.28 PgC. The area of 500–1000 gC/m2/a accounted for the largest proportion, which was 33.52% (Table 7). Among them, tropical areas, northeastern regions and most areas of southern Tibet had the largest climax background NPP due to their extensive distribution of forests, shrubs and high-coverage grasslands and the vegetation NPP in some areas reached above 1000 gC/m2/a. However, the climax background NPP in most areas of the western Inner Mongolia Plateau and the northwestern Qinghai-Tibet Plateau was relatively small, generally below 200 gC/m2/a.
According to ecosystem types, the climax background NPP per unit area of the forest ecosystem in China was approximately 849.36 ± 88.32 gC/m2/a, and the annual total NPP was approximately 1.90 ± 0.2 PgC. The climax background NPP per unit area of the grassland ecosystem was approximately 306.75 ± 28.14 gC/m2/a, the annual total NPP is approximately 0.80 ± 0.07 PgC. After eliminating the sandy and other non-vegetation areas, the NPP per unit area of the desert ecosystem was approximately 67.56 ± 4.16 gC/m2/a and the annual total NPP was approximately 0.009 ± 0.0005 PgC.

3.5. Restoration Status and Restoration Potential NPP of Forest, Grassland and Desert Ecosystems

The spatial patterns of restoration status NPP in China had obvious spatial distribution differences. Generally, there was a decreasing trend from southeast to northwest along the water and heat gradients (Figure 10a). The restoration status NPP of the national forest, grassland and desert ecosystems was 441.84 gC/m2/a, and the annual total NPP was 2.24 PgC. The area of 500–1000 gC/m2/a accounted for the largest proportion, which was 32.20%. The area of 0–2 gC/m2/a accounted for 9.95% (Table 8), which was mainly distributed in the desert ecosystem in the northwestern China.
Among them, the restoration status NPP per unit area of China’s forest ecosystem was approximately 689.69 gC/m2/a, and the annual total NPP was approximately 1.54 PgC. The restoration status NPP per unit area of the grassland ecosystem was approximately 246.42 gC/m2/a, and the annual total NPP was approximately 0.65 PgC. The restoration status NPP per unit area of desert ecosystem was approximately 51.38 gC/m2/a, and the annual total NPP was approximately 0.007 PgC. The ecological reconstruction projects with ecological protection and vegetation restoration as the main goal have achieved remarkable results since 2000 [21,22,23,24,25], and the ecosystems on the Loess Plateau and in other places have been effectively restored.
The spatial patterns of restoration potential NPP in China had obvious spatial distribution differences. Generally, there was a decreasing trend from southeast to northwest along the water and heat gradients (Figure 10b). The restoration potential NPP of the national forest, grassland and desert ecosystem types was approximately 103.96 ± 55 gC/m2/a, and the annual total restoration potential NPP was approximately 0.52 ± 0.28 PgC, which accounted for approximately 19.05% of the annual total climax background NPP. The area of 50–100 gC/m2/a accounted for the largest proportion, which was 24.93% (Table 8).
Among them, the restoration potential NPP in China’s forest ecosystem was approximately 159.67 ± 88.32 gC/m2/a, and the annual total vegetation NPP was approximately 0.36 ± 0.2 PgC, accounting for approximately 18.80% of the annual total climax background NPP. The restoration potential NPP in the grassland ecosystem was approximately 60.33 ± 28.14 gC/m2/a, and the annual total vegetation NPP was approximately 0.16 ± 0.07 PgC, accounting for approximately 19.67% of the total annual climax background NPP. The restoration potential NPP of the desert ecosystem was approximately 16.18 ± 4.16 gC/m2/a. The annual total vegetation NPP was approximately 0.002 ± 0.0005 PgC, accounting for approximately 23.95% of the annual total climax background NPP.

4. Discussion

4.1. Methodological Approaches and Uncertainty

The results obtained by the regression analysis method of meteorological conditions based on nature reserves reflected the zonal climax vegetation status to a large extent, and the obtained values had a smooth transition within each eco-geographical division and between each eco-geographical division, which truly reflected the law of gradual change in the climate, vegetation and natural conditions. However, there was still some uncertainty associated with the NPP simulation of climax background vegetation.
(1)
The MODIS NPP product, partly due to the uncertainty in the default Biome- specified Parameters Look-Up Table (BPLUT) of the MODIS photosynthesis (PSN) model [71]. Parameter optimization is a promising method that can be used to calibrate uncertain parameters of the carbon cycle model.
(2)
Choice of zonal climax background. In the core areas of some nature reserves, such as LiboMaolan Nature Reserve, Jinggangshan Nature Reserve and other places, due to inconvenient transportation and small population, after years of strict protection, it can be considered that the vegetation condition is close to its zonal climax background. However, vegetation in nature reserves is not always in a climax state. For example, some nature reserves do not protect good natural ecosystems, only the ecological location may be important, but the reserve could still have damaged zones. Additionally, some nature reserves still have a certain degree of human disturbance due to inadequate management and other reasons. However, in nature reserves where overmature forests exist and in grassland nature reserves that have been enclosed for many years, the vegetation NPP is not maximised due to slowed or discontinued forest growth, or a lack of appropriate human disturbance [72,73]. Therefore, some indicators, such as biomass, can be added to characterise climax vegetation in future research [74].
(3)
Uncertainty of the simulation method. The regression analysis of climax vegetation status and natural factors is not only closely related to meteorological conditions such as precipitation and temperature, but also related to natural factors such as soil, vegetation and topography. Generally, adding the above natural factors for multiple regression will obtain a more accurate fitting equation, but when there are more natural factor combinations, the number of corresponding nature reserves will be fewer, which will affect the accuracy of the fitting equation. Therefore, choosing between these natural factors requires a weighing process.

4.2. Change Trend of Vegetation NPP and Its Classification

The trend of vegetation NPP in most areas of China was positive. The main factors affecting this change trend of vegetation NPP included meteorological conditions and human activities on a large scale [1,64,75]. Many studies have shown that China has experienced dramatic climate change characterised by warming and humidification in the past 20 years [76,77] (Figure 11). For example, the temperature and precipitation in the Inner Mongolia Plateau, Loess Plateau, Northeast Plain and Sichuan Basin showed an increasing trend, which promote the increase of NPP. On the Qinghai-Tibet Plateau, the temperature showed an increasing trend, which promoted the increase in NPP. Benefiting from climate warming and humidification and the effective implementation of ecological engineering [18,19,20], the NPP in areas such as the Qinghai-Tibet Plateau [21,22,23,24,25] and the Loess Plateau [16,26] has significantly increased. Satellite data showed an increasing leaf area of vegetation due to direct factors (e.g., human land-use management) and indirect factors (e.g., climate change, CO2 fertilization, nitrogen deposition and recovery from natural disturbances). Among these, climate change and CO2 fertilization effects seemed to be the dominant drivers [78,79]. However, the significance of change trends and impact factors were different in different regions, and the main features of the different classifications were as follows:
(1)
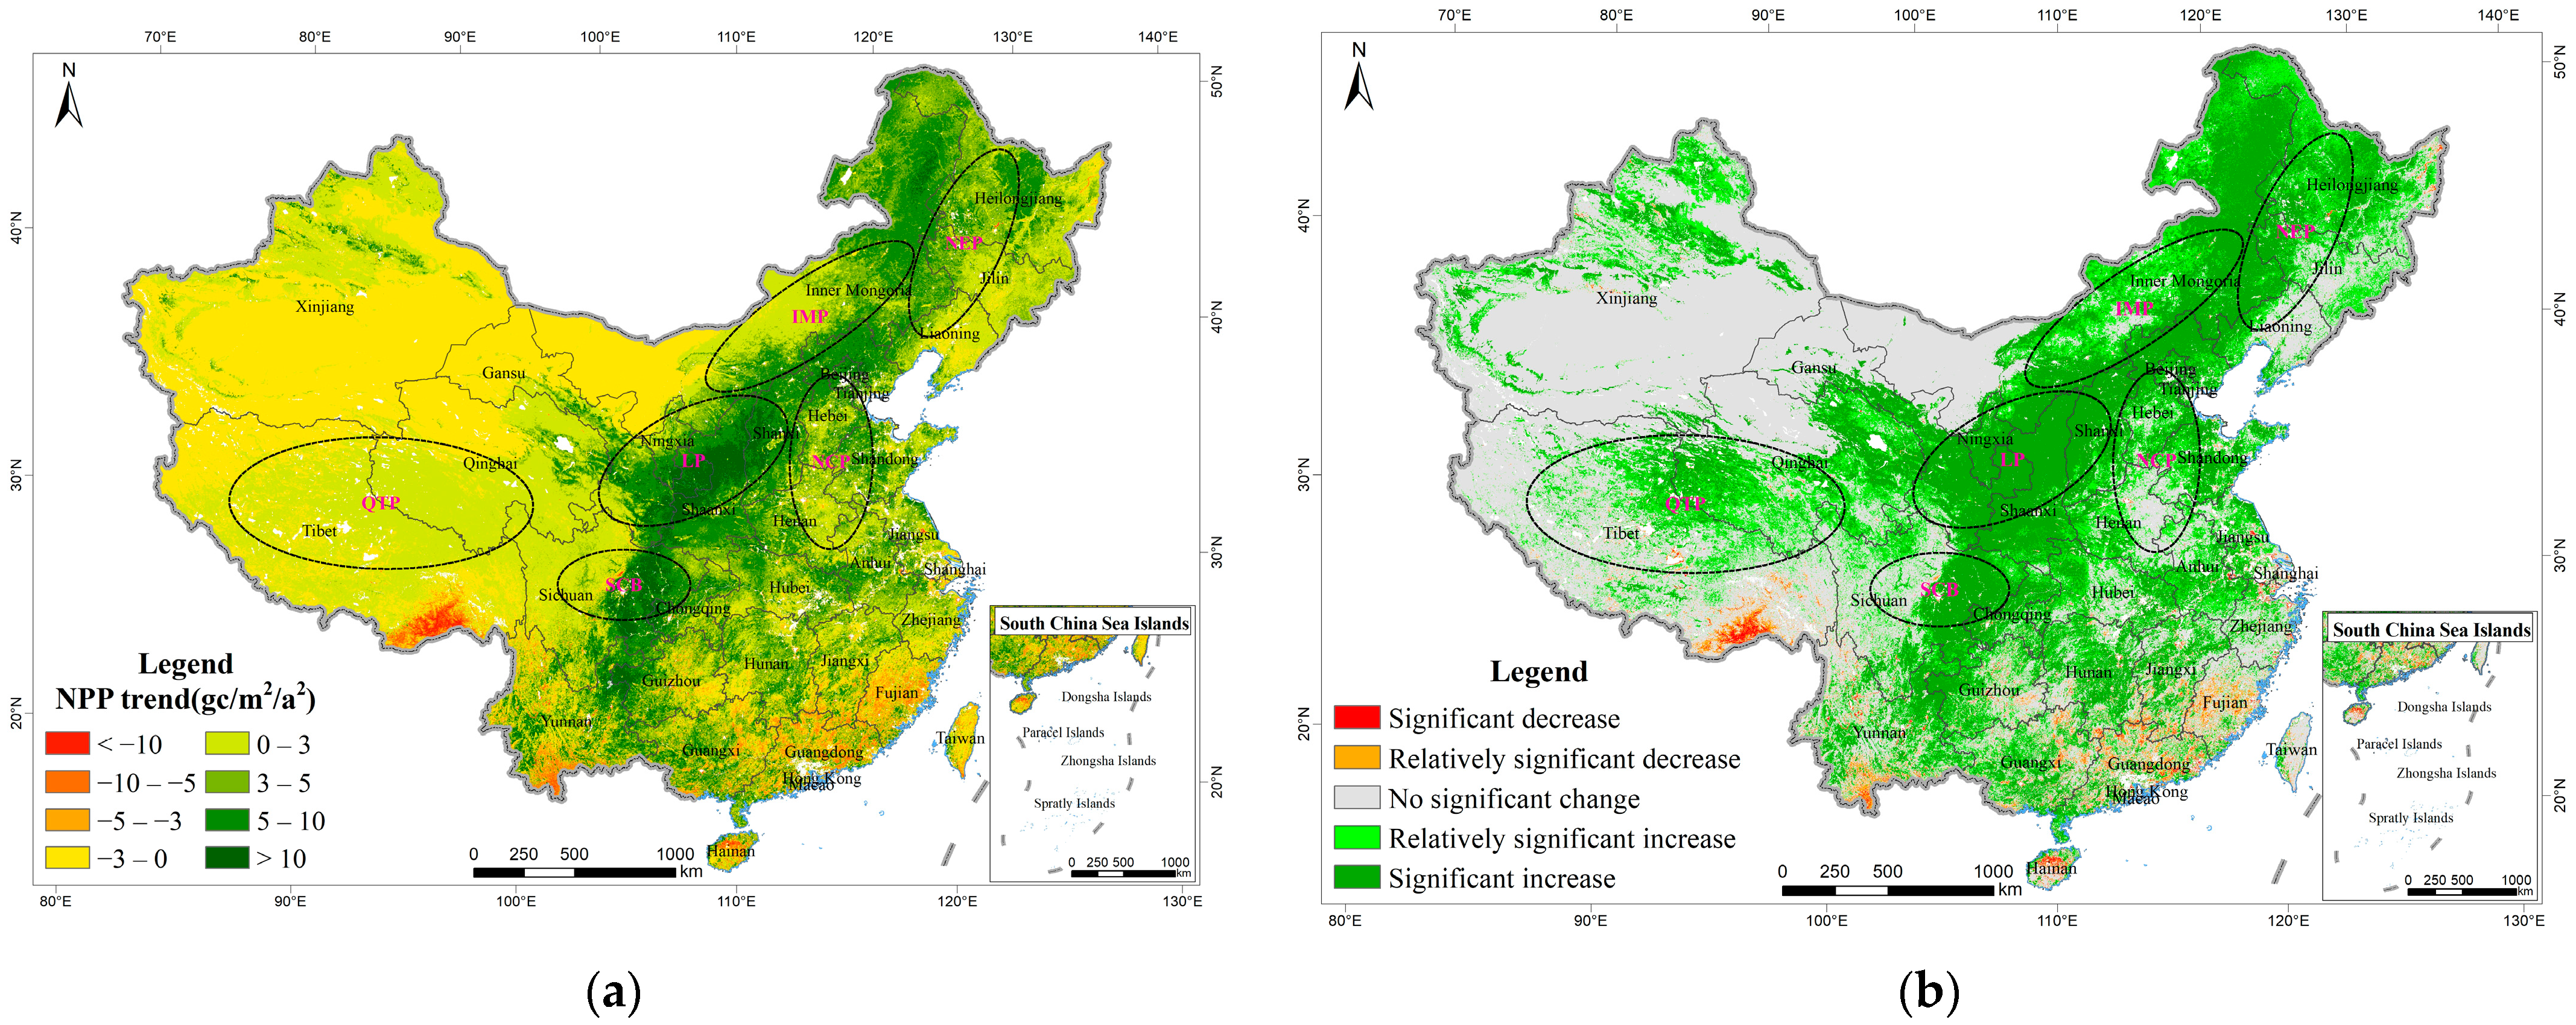
The areas with a significant increase in vegetation NPP were mainly distributed in the agro-pastoral zone, the Loess Plateau, the eastern Sichuan Basin and the Greater Khingan Range (p < 0.05). Ecological projects such as tree planting and afforestation in the abovementioned areas were the leading factors affecting the increase in NPP [80].
(2)
The areas with a relatively significant decrease in vegetation NPP were mainly distributed in the Qinghai-Tibet Plateau and Inner Mongolia Plateau. There were many grassland and desert ecosystems in these places. While ecological projects such as the Returning Rangeland to Grassland and the Grain for Green Program were also implemented, the change trend was not as obvious as that in the agro-pastoral zone due to natural factors such as high cold and drought.
(3)
The areas with a significant decrease in vegetation NPP were mainly distributed on the southern Qinghai-Tibet Plateau. The decrease in precipitation was also an important reason affecting the decrease in NPP. Human activities such as deforestation are more frequent in southern Tibet and have caused the extensive destruction of forests and other vegetation.
(4)
The Guangdong, Fujian, Yunnan and other places in the south (p < 0.05), and the decreasing trend in southern Tibet was the most significant; the decreasing trend in most areas was below −10 gC/m2/a2. Due to the rapid development of cities and industries in Guangdong, southern Jiangsu, Hainan Province and other places [17], the increase in atmospheric aerosol concentration has led to a decrease in solar radiation, which has led to a decrease in the effective photosynthetic radiation of vegetation [81], which was caused by a relatively significant decrease in vegetation NPP. On the Yunnan-Guizhou Plateau, the decrease in precipitation was also an important reason for the decrease in NPP (Figure 11b).
(5)
The areas that failed the significance test were mainly distributed in most areas of the western Qinghai-Tibet Plateau, southern Xinjiang, western Inner Mongolia and other places. The Gobi and deserts in these places were widely distributed, the surface was bare or the vegetation coverage was low and the vegetation NPP was almost 0, so there was no obvious trend for vegetation NPP. Additionally, some places, such as the central part of the North China Plain, were mainly farmland, and the types of crops were relatively fixed, so there was no obvious trend for vegetation NPP.
We used a multiple regression residual analysis method to determine the contribution rates of climate factors and human activities to NPP. We found that the contribution rate of meteorological conditions to the change in vegetation NPP from 2000 to 2019 was 85.41%. The contribution rate of human activities to the change in vegetation NPP is 14.59%, so precipitation and temperature were the main controlling factors that determined the size and change in vegetation NPP. This result was more consistent with the research results of Hou et al. [12,16,17]. The results showed that it was reasonable to use the two meteorological conditions of precipitation and temperature to simulate the climax background NPP. Additionally, human activities had a relatively large contribution rate on the Loess Plateau, in the Three-North Shelter Forest Program Area and in the Returning Rangeland to Grassland Area, mainly through the effective implementation of large-scale afforestation, returning of grazing to grass and the balance of grass and livestock. The changes in meteorological conditions such as precipitation and temperature were largely caused by human activities [70,82]. How to clarify the impact of human activities on the climate system is the focus of research on the driving forces of changes in terrestrial ecosystems. Difficulties regarding the direction of this research remain and need to be further improved.

4.3. Climax Background Vegetation NPP of Forest, Grassland and Desert Ecosystems

The spatial distribution of climax background vegetation NPP of forest, grassland and desert ecosystems in China has obvious regional characteristics. Generally, it decreases from southeast to northwest along the water and heat gradients. The maximum NPP occurs in Hainan and Yunnan, and the lowest occurs in Xinjiang and on the Qinghai-Tibet Plateau.
According to ecosystem types, the climax background NPP per unit area of the forest ecosystem in China was approximately 849.36 ± 88.32 gC/m2/a. For example, forest ecosystems were located in subtropical humid and temperate semi-humid monsoon climate zones due to their rich vegetation and the larger proportion forest vegetation, so their productivity was higher than that of other ecosystems.
The climax background NPP per unit area of the grassland ecosystem was approximately 306.75 ± 28.14 gC/m2/a. In the eastern Inner Mongolia Plateau and on the southeastern Qinghai-Tibet Plateau, grassland ecosystems were widely distributed, and the climax background vegetation NPP was mainly between 200 and 500 gC/m2/a.
The NPP per unit area of the desert ecosystem was approximately 67.56 ± 4.16 gC/m2/a. For example, the northwestern inland areas such as Gansu and Xinjiang had low productivity due to their dry climate and low annual precipitation, so the climax background vegetation NPP was lower than that of forest and grassland ecosystems.

4.4. Spatial Patterns of Vegetation NPP Restoration Potential

The spatial distribution of vegetation NPP restoration potential in China had obvious regional characteristics. Generally, it decreased from southeast to northwest along the water and heat gradients, which was similar to the spatial distribution of vegetation NPP. The vegetation NPP was relatively large in most parts of the south due to the better water and heat conditions, and the degree of human influence was also greater, so the restoration potential NPP was greater, and the restoration potential NPP values in the Yunnan-Guizhou Plateau and most of southern China were above 103.96 gC/m2/a. While the vegetation NPP was relatively small in arid and semiarid zones or parts of the Qinghai-Tibet Plateau, the restoration potential NPP was relatively small. The northwestern inland area was less than 50 gC/m2/a. In the agro-pastoral zone, the Loess Plateau, the eastern Sichuan Basin and the Greater Khingan Range areas, due to their relatively good recovery degree and local natural condition limitations, the recovery potential of most areas was less than 50 gC/m2/a.
Therefore, the deployment of major ecological projects in the future should fully consider the limitations of climatic conditions. For areas with an annual precipitation below 300 mm and an annual average temperature below 0 °C (Figure 2), artificial ecological restoration measures should be avoided as much as possible to reduce human disturbance. The natural restoration of the ecology should be promoted.
The restoration potential is an absolute measure of the gap, but the size of the restoration potential does not indicate the difficulty of restoration. In some areas of the south where the restoration potential NPP is relatively large, it is only necessary to further strengthen the protection, restoration and construction measures of the ecosystem. With the help of excellent hydrothermal conditions, vegetation NPP can reach or approach the climax of natural vegetation within a certain period of time. In arid and semiarid regions or on the Qinghai-Tibet Plateau, which is restricted by harsh natural conditions, although the restoration potential is relatively small, ecological restoration will be a slow process and it will take a relatively long time to achieve the restoration of degraded vegetation.

5. Conclusions

Based on data from MODIS-NPP, meteorology and nature reserves, this paper used trend analysis, multiple regression analysis and residual analysis methods to analyse the change trend in NPP of China’s terrestrial ecosystems, as well as the climax background, restoration status and restoration potential of forest, grassland and desert ecosystems from 2000 to 2019. The main conclusions are as follows:
(1)
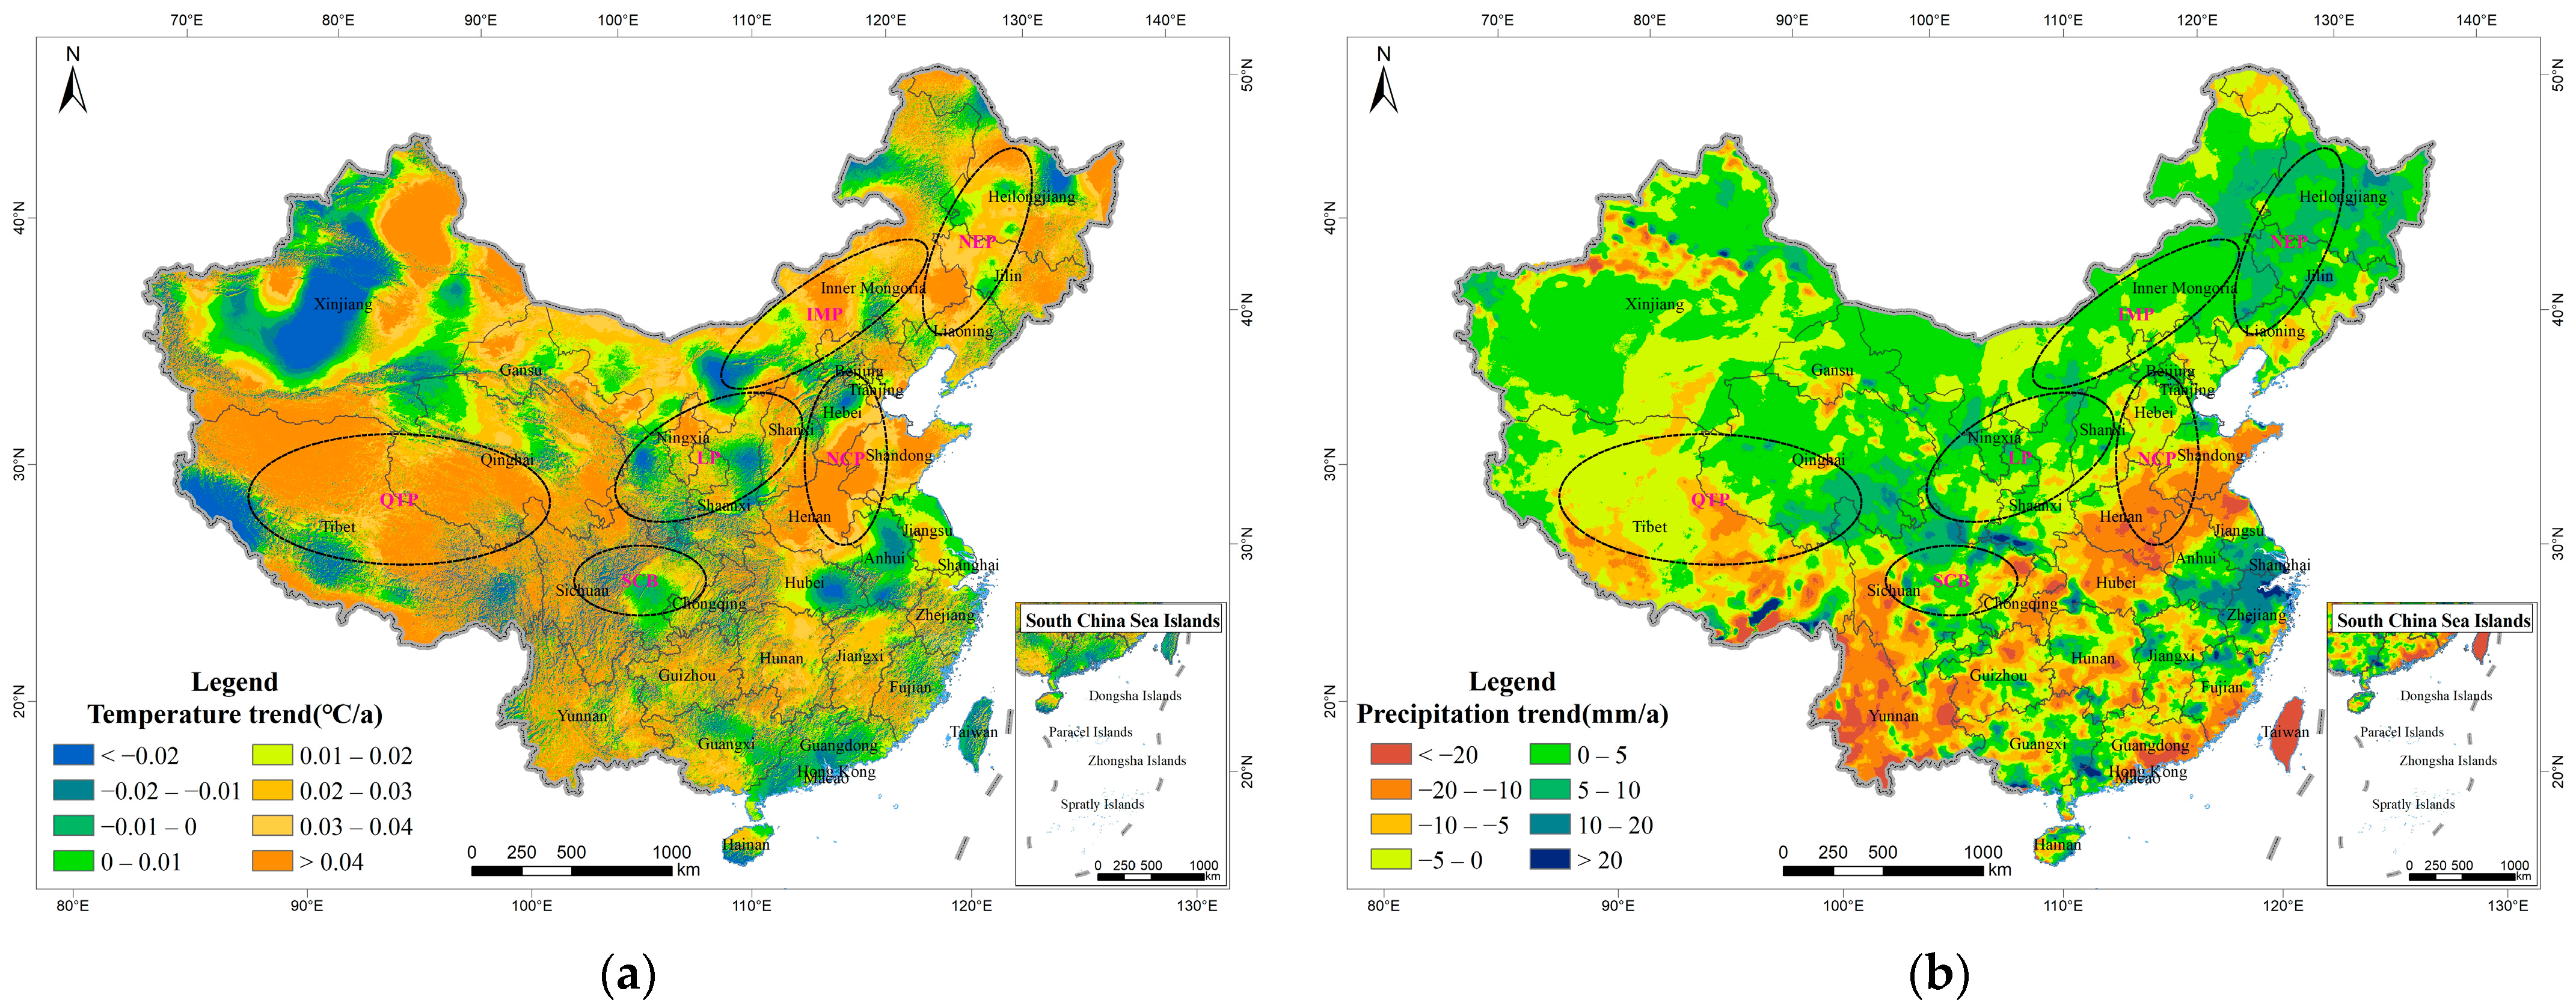
The change in China’s vegetation NPP showed a continuous upwards trend from 2000 to 2019. The two meteorological conditions, precipitation and temperature, contributed 85.41% to the change in vegetation NPP. It could meet the needs of the ecosystem’s climax background vegetation NPP simulation in nature reserves that were less affected by human activities.
(2)
The results obtained by the regression analysis method of meteorological conditions based on nature reserves reflected the zonal climax vegetation status to a large extent, and the obtained values had a smooth transition within each eco-geographical division and between each eco-geographical division, which truly reflected the law of gradual changes in climate, vegetation and natural conditions. The annual total climax background NPP of China’s forest, grassland and desert ecosystems was 2.76 ± 0.28 PgC, and the annual total NPP of the three ecosystems was 1.90 ± 0.2 PgC, 0.80 ± 0.07 PgC and 0.009 ± 0.0005 PgC, respectively. In future research, it is necessary to strengthen the acquisition of zonal climax background reference standards and try to select vegetation NPP in the core area of nature reserves and grassland enclosure areas that have been protected for many years.
(3)
Benefiting from the effective implementation of climate warming and humidification and ecological engineering, the agro-pastoral zone, the Loess Plateau, the eastern Sichuan Basin and the Greater Khingan Range had the most significant increase in the past 20 years. The total annual restoration status NPP in China’s forest, grassland and desert ecosystems was 2.24 PgC, and the total annual NPP of the three ecosystems was 1.54 PgC, 0.65 PgC and 0.007 PgC, respectively.
(4)
The annual total restoration potential NPP of China’s forest, grassland and desert ecosystems was approximately 0.52 ± 0.28 PgC, which accounted for approximately 19.05% of the total annual climax background NPP. The annual total restoration potential NPP of the forest, grassland and desert ecosystems was 0.36 ± 0.2 PgC, 0.16 ± 0.07 PgC and 0.002 ± 0.0005 PgC, respectively; additionally, the restoration potential accounted for 18.80%, 9.67% and 23.95% of the climax background NPP, respectively. The deployment of ecological projects should fully consider the restrictive climate conditions for decision makers and ecological assessment scholars, and the benefits and costs of the projects should be considered comprehensively.

Author Contributions

All the authors contributed significantly to this study. Conceptualization, J.L., Q.S. and J.F.; methodology, J.L., Q.S., J.F. and G.L.; writing-original draft preparation, G.L.; writing-review and editing, J.F., Q.S. and G.L.; data curation, G.L., J.N., K.R. and H.H.; software, G.L. and K.R.; visualization, G.L., J.N., S.L., L.N. and X.Z. All authors have read and agreed to the published version of the manuscript.

Funding

This research was funded by the National Key Research and Development Program of China (Grant No. 2017YFC0506501), and the CAS Strategic Leading Science and Technology Project Category A (Grant No. XDA23100203).

Institutional Review Board Statement

Not applicable.

Informed Consent Statement

Not applicable.

Data Availability Statement

The data that support the findings of this study are available from the corresponding author, upon reasonable request.

Conflicts of Interest

The authors declare no conflict of interest.

References

  1. Cao, M.; Woodward, I.F. Dynamic responses of terrestrial ecosystem carbon cycling to global climate change. Nature 1998, 393, 249–252. [Google Scholar] [CrossRef]
  2. Leimbach, M.; Giannousakis, A. Burden sharing of climate change mitigation: Global and regional challenges under shared socio-economic pathways. Clim. Chang. 2019, 155, 273–291. [Google Scholar] [CrossRef]
  3. Nemani, R.R.; Keeling, C.D.; Hashimoto, H.; Jolly, W.M.; Piper, S.C. Climate-Driven Increases in Global Terrestrial Net Primary Production from 1982 to 1999. Science 2003, 300, 1560–1563. [Google Scholar] [CrossRef] [PubMed] [Green Version]
  4. Sun, Q.L.; Li, B.L.; Li, F.; Zhang, Z.J.; Ding, L.L.; Zhang, T.; Xu, L.L. Review on the estimation of net primary productivity of vegetation in the Three-River Headwater Region, China. Acta Geogr. Sin. 2016, 71, 1596–1612. (In Chinese) [Google Scholar]
  5. Wang, J.; Dong, J.; Yi, Y.; Lu, G.; Oyler, J.; Smith, W.K.; Zhao, M.; Liu, J.; Running, S. Decreasing net primary production due to drought and slight decreases in solar radiation in China from 2000 to 2012. J. Geophys. Res-Biogeo. 2017, 122, 261–278. [Google Scholar] [CrossRef] [Green Version]
  6. Piao, S.L.; Fang, J.Y.; Guo, Q.H. Application of CASA model to the estimation of Chinese terrestrial net primary productivity. Acta Phytoecol. Sin. 2001, 25, 603–608. (In Chinese) [Google Scholar]
  7. Zhou, W.; Mu, F.Y.; Gang, C.C.; Guan, D.J.; He, J.F.; Li, J.L. Spatio-temporal dynamics of grassland net primary productivity and their relationship with climatic factors from 1982 to 2010 in China. Acta Ecol. Sin. 2017, 37, 4335–4345. (In Chinese) [Google Scholar]
  8. Li, G.C. Estimation of Chinese Terrestrial Net Primary Production Using LUE Model and MODIS Data; Graduate School of Chinese Academy of Sciences: Bejing, China, 2004. (In Chinese) [Google Scholar]
  9. Wang, J.B. Chinese Terrestrial Ecosystem Productive Model Applied Remote Sensing Data; Zhejiang University: Hangzhou, China, 2004. (In Chinese) [Google Scholar]
  10. Yuan, W.P.; Cai, W.W.; Liu, D.; Dong, W.J. Satellite-based vegetation production models of terrestrial ecosystem: An overview. Adv. Earth Sci. 2014, 29, 541–550. (In Chinese) [Google Scholar]
  11. Fang, J.Y.; Chen, A.P.; Peng, C.H.; Zhao, S.Q.; Ci, L.J. Changes in Forest Biomass Carbon Storage in China Between 1949 and 1998. Science 2001, 292, 2320–2322. [Google Scholar] [CrossRef]
  12. Liu, G.; Sun, R.; Xiao, Z.Q.; Cui, T.X. Analysis of spatial and temporal variation of net primary productivity and climate controls in China from 2001 to 2014. Acta Ecol. Sin. 2017, 37, 4936–4945. (In Chinese) [Google Scholar]
  13. Yuan, Q.Z.; Wu, S.H.; Zhao, D.S.; Dai, E.F.; Chen, L.; Zhang, L. Modeling net primary productivity of the terrestrial ecosystem in China from 1961 to 2005. J. Geogr. Sci. 2013, 24, 3–17. [Google Scholar] [CrossRef]
  14. Zhu, W.Q.; Pan, Y.Z.; Yang, X.Q.; Song, B.G. Analysis of the Impact of Climate Change on China’s Terrestrial Vegetation Net Primary Productivity. Chin. Sci. Bull. 2007, 52, 2535–2541. (In Chinese) [Google Scholar] [CrossRef]
  15. Zhao, M.M.; Liu, Y.; Yang, J.L.; Liu, Y.; Zhao, N.; Yue, T.X. Spatio-temporal patterns of NPP and its relations to climate in China based on HASM. Ecol. Environ. Sci. 2019, 28, 215–225. (In Chinese) [Google Scholar]
  16. Chen, Y.; Feng, X.; Tian, H.; Wu, X.; Gao, Z.; Feng, Y.; Piao, S.; Lv, N.; Pan, N.; Fu, B. Accelerated increase in vegetation carbon sequestration in China after 2010: A turning point resulting from climate and human interaction. Glob. Chang. Biol. 2021, 27, 5848–5864. [Google Scholar] [CrossRef] [PubMed]
  17. Hou, Y.Y.; Mao, L.X.; Li, C.S.; Qian, S. Spatio-temporal pattern of vegetation net primary productivity changes in China. Chin. J. Ecol. 2008, 27, 1455–1460. (In Chinese) [Google Scholar]
  18. Huang, L.; Cao, W.; Xu, X.L.; Fan, J.W.; Wang, J.B. The Ecological Effects of Ecological Security Barrier Protection and Construction Project in Tibet Plateau. J. Nat. Resour. 2018, 33, 398–411. (In Chinese) [Google Scholar]
  19. Shao, Q.Q.; Fan, J.W.; Liu, J.Y.; Huang, L.; Cao, W.; Xu, X.L.; Ge, J.S.; Wu, D.; Li, Z.Q.; Gong, G.L.; et al. Assessment on the effects of the first-stage ecological conservation and restoration project in Sanjiangyuan region. Acta Geogr. Sin. 2016, 71, 3–20. (In Chinese) [Google Scholar]
  20. Liu, F.; Zeng, Y.N. Spatial-temporal change in vegetation Net Primary Productivity and its response to climate and human activities in Qinghai Plateau in the past 16 years. Acta Ecol. Sin. 2019, 39, 1528–1540. (In Chinese) [Google Scholar]
  21. Sun, H.L.; Zheng, D.; Yao, T.D.; Zhang, Y.L. Protection and Construction of the National Ecological Security Shelter Zone on Tibetan Plateau. Acta Geogr. Sin. 2012, 67, 3–12. (In Chinese) [Google Scholar]
  22. Tang, Y.Z.; Shao, Q.Q.; Liu, J.Y.; Zhang, H.Y.; Yang, F.; Cao, W.; Wu, D.; Gong, G.L. Did Ecological Restoration Hit Its Mark? Monitoring and Assessing Ecological Changes in the Grain for Green Program Region Using Multi-Source Satellite Images. Remote Sens. 2019, 11, 358. [Google Scholar] [CrossRef] [Green Version]
  23. Shao, Q.Q.; Fan, J.W.; Liu, J.Y.; Huang, L.; Cao, W.; Liu, L.L. Target-based Assessment on Effects of First-stage Ecological Conservation and Restoration Project in Three-river Source Region, China and Policy Recommendations. Bull. Chin. Acad. Sci. 2017, 32, 35–44. (In Chinese) [Google Scholar]
  24. Huang, L.; Zhu, P.; Xiao, T.; Cao, W.; Gong, G.L. The Sand Fixation Effects of Three-North Shelter Forest Program in Recent 35 Years. Sci. Geogr. Sin. 2018, 38, 600–609. (In Chinese) [Google Scholar]
  25. Zhang, B.; Wang, S.; Li, Q.X.; Xie, G.D. Spatio-temporal changes of water conservation service in the Beijing-Tianjin sandstorm source control project area. Acta Ecol. Sin. 2021, 41, 7530–7541. (In Chinese) [Google Scholar]
  26. Zhao, G.J.; Mu, X.M.; Tian, P.; Gao, P.; Sun, W.Y.; Xu, W.L. Prediction of vegetation variation and vegetation restoration potential in the Loess Plateau. J. Soil Water Conserv. 2021, 35, 205–212. (In Chinese) [Google Scholar]
  27. He, N.P.; Xu, L.; He, H.L. The methods of evaluation ecosystem quality: Ideal reference and key parameters. Acta Ecol. Sin. 2020, 40, 1877–1886. (In Chinese) [Google Scholar]
  28. Guo, R.; Wang, X.K.; Lu, F.; Duan, X.N.; Ouyang, Z.Y. Soil carbon sequestration and its potential by grassland ecosystems in China. Acta Ecol. Sin. 2008, 28, 862–867. (In Chinese) [Google Scholar]
  29. Duan, X.N.; Wang, X.K.; Lu, F.; Outyang, Z.Y. Carbon sequestration and its potential by wetland ecosystems in China. Acta Ecol. Sin. 2008, 28, 463–469. (In Chinese) [Google Scholar]
  30. Liu, Y.C.; Wang, Q.F.; Yu, G.R.; Zhu, X.J.; Zhan, X.Y.; Guo, Q.; Yang, H.; Li, S.G.; Hu, Z.M. Ecosystems carbon storage and carbon sequestration potential of two main tree species for the Grain for Green Project on China’s hilly Loess Plateau. Acta Ecol. Sin. 2011, 31, 4277–4286. (In Chinese) [Google Scholar]
  31. Zhang, J.; Li, J.P.; Wang, Y.T.; Zhang, Y.; Jing, L.; Li, J.P. Climate change in arid regions of Northwest China and its impact on potential grassland productivity. Ecol. Sci. 2020, 39, 182–192. (In Chinese) [Google Scholar]
  32. Xue, D.Y.; Jiang, M.K. Research on the Classification Standards of Types of Nature Reserves in China. China Environ. Sci. 1994, 4, 246–251. (In Chinese) [Google Scholar]
  33. Zhu, P.; Huang, L.; Xiao, T.; Wang, J.B. Dynamic changes of habitats in China’s typical nature reserves on spatial and temporal scales. Acta Geogr. Sin. 2018, 73, 92–103. (In Chinese) [Google Scholar] [CrossRef] [Green Version]
  34. Wang, X.; Ta, K.; Chen, B.; Du, P. Assessing the Spatiotemporal Variation and Impact Factors of Net Primary Productivity in China. Sci Rep. 2017, 7, 44415. [Google Scholar] [CrossRef] [PubMed] [Green Version]
  35. Gong, S.H.; Xiao, Y.; Zhang, L.; Ouyang, Z.Y. Driving forces and their effects on water conservation services in forest ecosystems in China. Chin. Geogr. Sci. 2017, 27, 216–228. [Google Scholar] [CrossRef] [Green Version]
  36. Liu, J.Y.; Kuang, W.H.; Zhang, Z.X.; Xu, X.L.; Qin, Y.W.; Ning, J.; Zhou, W.C.; Zhang, S.W.; Li, R.D.; Yan, C.Z.; et al. Spatiotemporal characteristics, patterns and causes of land use changes in China since the late 1980s. Acta Geogr. Sin. 2014, 69, 3–14. (In Chinese) [Google Scholar] [CrossRef]
  37. Liu, J.Y.; Ning, J.; Kuang, W.H.; Xu, X.L.; Yang, C.Z.; Li, R.D.; Chi, W.F.; Wu, S.X.; Hu, Y.F.; Pan, T.; et al. Spatio-temporal patterns and characteristics of land-use change in China during 2010–2015. Acta Geogr. Sin. 2018, 73, 789–802. (In Chinese) [Google Scholar]
  38. He, H.J.; Shi, X.L. Spatio-Temporal Characteristics of Land Cover Changes in China During 1990–2010. J. Geo. Info. Sci. 2015, 17, 1323–1342. (In Chinese) [Google Scholar]
  39. National Meteorological Information Center. Daily Meteorological Dataset of Basic Meteorological Elements of China National Surface Weather Station (V3.0) (1951–2010). 2019. Available online: http://data.cma.cn (accessed on 24 December 2021).
  40. Liu, Z.H.; Tim, R.V.; Li, L.T.; Tom, G.N.; Yang, Q.K.; Li, R.; Mu, X.M. Interpolation for time series of meteorological variables using ANUSPLIN. J. Northwest Sci-Tech Univ. Agric. For. 2008, 36, 227–234. (In Chinese) [Google Scholar]
  41. Hutchinson, T.X. Anusplin Version 4.4 User Guide; The Australian National University: Canberra, Australia, 2013. [Google Scholar]
  42. Guo, B.B.; Zhang, J.; Meng, X.Y.; Xu, T.B.; Song, Y.Y. Long-term spatio-temporal precipitation variations in China with precipitation surface interpolated by ANUSPLIN. Sci. Rep. 2020, 10, 1–17. [Google Scholar] [CrossRef]
  43. Hutchinson, M.F. Interpolating mean rainfall using thin plate smoothing splines. Int. J. Geogr. Inf. Syst. 1995, 9, 385–403. [Google Scholar] [CrossRef]
  44. Running, S.; Zhao, M. MOD17A3HGF MODIS/Terra Net Primary Production Gap-Filled Yearly L4 Global 500 m SIN Grid V006. 2019. Available online: https://lpdaac.usgs.gov/products/mod17a3hgfv006/ (accessed on 1 December 2021).
  45. Berrick, S. Data Processing Levels [EB/OL]. 2021[2021.1.13]. Available online: https://earthdata.nasa.gov/collaborate/open-data-services-and-software/data-information-policy/data-levels (accessed on 24 December 2021).
  46. Fan, J.W.; Shao, Q.Q.; Liu, J.Y.; Wang, J.B.; Chen, Z.Q.; Zhong, H.P.; Xu, X.L.; Liu, R.G. Dynamic Changes of Grassland Yield in Three River Headwater Region from 1988 to 2005. Acta Agrestia Sin. 2010, 18, 5–10. (In Chinese) [Google Scholar]
  47. Zhang, H.Y.; Fan, J.W.; Cao, W.; Zhong, H.P.; Harris, W.; Gong, G.L.; Zhang, Y.X. Changes in multiple ecosystem services between 2000 and 2013 and their driving factors in the Grazing Withdrawal Program, China. Ecol. Eng. 2018, 116, 67–79. [Google Scholar] [CrossRef]
  48. He, H.L.; Ge, R.; Ren, X.L.; Zhang, L.; Chang, Q.Q.; Xu, Q.; Zhou, G.Y.; Xie, Z.Q.; Wang, S.L.; Wang, H.M.; et al. Reference carbon cycle dataset for typical Chinese forests via colocated observations and data assimilation. Sci. Data. 2021, 8, 1–13. [Google Scholar] [CrossRef] [PubMed]
  49. Liu, G.R. Protocols for Standard Atmosphere Environmental Observation and Measurement in Terrestrial Ecosystems. China Environmental Science Press: Beijing, China, 2007. [Google Scholar]
  50. Yuan, G.; Tang, D.; Sun, X. Protocols for Standard Water Observation and Measurement in Terrestrial Ecosystems; China Environmental Science Press: Beijing, China, 2007. [Google Scholar]
  51. Luo, Y.J.; Wang, X.K.; Lu, F. Comprehensive Database of Biomass Regressions for China’S Tree Species; China Forestry Publishing House: Bejing, China, 2015. [Google Scholar]
  52. Liu, J.Y.; Xu, X.L.; Shao, Q.Q. The Spatial and Temporal Characteristics of Grassland Degradation in the Three-River Headwaters Region in Qinghai Province. Acta Geogr. Sin. 2008, 63, 363–376. (In Chinese) [Google Scholar]
  53. Xu, X.L.; Liu, J.Y.; Shao, Q.Q.; Fan, J.W. The dynamic changes of ecosystem spatial pattern and structure in the Three-River Headwaters region in Qinghai Province during recent 30 years. Geogr. Res. 2008, 27, 829–838. (In Chinese) [Google Scholar]
  54. Zheng, D. Research on China’s Ecological Geographical Region System; The Commercial Press: Bejing, China, 2008. (In Chinese) [Google Scholar]
  55. Sen, P.K. Estimates of the Regression Coefficient Based on Kendall’s Tau. J. Am. Stat. Assoc. 1968, 63, 1379–1389. [Google Scholar] [CrossRef]
  56. Yin, H.; Li, Z.G.; Wang, Y.L.; Cai, F. Assessment of Desertification Using Time Series Analysis of Hyper-temporal Vegetation Indicator in Inner Mongolia. Acta Geogr. Sin. 2011, 66, 653–661. (In Chinese) [Google Scholar]
  57. Long, Y.H.; Qin, J.X.; He, X.G.; Yang, Z. Wavelet multi-resolution analysis of vegetation dynamic change in Dongting Lake Basin. Acta Geogr. Sin. 2018, 70, 1491–1502. (In Chinese) [Google Scholar]
  58. Daneshvar, V.F.; Dinpashoh, Y.; Aalami, M.T.; Jhajharia, D. Trend analysis of groundwater using non-parametric methods (case study: Ardabil plain). Stoch. Environ. Res. Risk. A. 2012, 27, 547–559. [Google Scholar] [CrossRef]
  59. Wu, S.H.; Yin, Y.H.; Zheng, D.; Yang, Q.Y. Climate changes in the Tibetan Plateau during the last three decades. Acta Geogr. Sin. 2005, 60, 3–11. (In Chinese) [Google Scholar]
  60. Hamed, K.H.; Rao, A.R. A modified Mann-Kendall trend test for autocorrelated data. J. Hydrol. 1998, 204, 182–196. [Google Scholar] [CrossRef]
  61. Gocic, M.; Trajkovic, S. Analysis of changes in meteorological variables using Mann-Kendall and Sen’s slope estimator statistical tests in Serbia. Glob. Planet. Chang. 2013, 100, 172–182. [Google Scholar] [CrossRef]
  62. Wang, D.L.; Liu, W.P.; Huang, X.Y. Trend analysis in vegetation cover in Beijing based on Sen+Mann-Kendall method. Comput. Eng. Appl. 2013, 49, 13–17. (In Chinese) [Google Scholar]
  63. Jason, E.; Roland, G. Discrimination between climate and human- induced dryland degradation. J. Arid Environ. 2004, 57, 535–554. [Google Scholar]
  64. Pan, T.; Zou, X.T.; Liu, Y.J.; Wu, S.H.; He, G.M. Contributions of climatic and non-climatic drivers to grassland variations on the Tibetan Plateau. Ecol. Eng. 2017, 108, 307–317. [Google Scholar] [CrossRef]
  65. Jin, K.; Wang, F.; Han, J.Q.; Shi, S.Y.; Ding, W.B. Contribution of climatic change and human activities to vegetation NDVI change over China during 1982–2015. Acta Geogr. Sin. 2020, 75, 961–974. (In Chinese) [Google Scholar]
  66. Wu, C.; Munger, J.W.; Niu, Z.; Kuang, D. Comparison of multiple models for estimating gross primary production using MODIS and eddy covariance data in Harvard Forest. Remote Sens. Environ. 2010, 114, 2925–2939. [Google Scholar] [CrossRef]
  67. Friend, A.D.; Arneth, A.; Kiang, N.Y.; Lomas, M.; Oge, J.; Rodenbeck, C.; Running, S.W.; Santaren, J.D.; Sitch, S.; Viovy, N.; et al. FLUXNET and modelling the global carbon cycle. Glob. Chang. Biol. 2007, 13, 610–633. [Google Scholar] [CrossRef]
  68. Wu, C.; Chen, J.M.; Huang, N. Predicting gross primary production from the enhanced vegetation index and photosynthetically active radiation: Evaluation and calibration. Remote Sens. Environ. 2011, 115, 3424–3435. [Google Scholar] [CrossRef]
  69. Xu, X. Response of net primary productivity (NPP) of Sichuan vegetations to global climate changes. Chin. J. Ecol. 2004, 23, 19–24. (In Chinese) [Google Scholar]
  70. IPCC. Climate Change and Land: An IPCC Special Report on Climate Change, Desertification, Land Degradation, Sustainable Land Management, Food Security, and Greenhouse Gas Fluxes in Terrestrial Ecosystems; Shukla, P.R., Skea, J., Buendia, E.C., Masson-Delmotte, V., Pörtner, H.-O., Roberts, D.C., Zhai, P., Slade, R., Connors, S., van Diemen, R., et al., Eds.; IPCC: Geneva, Switzerland, 2019; in press. [Google Scholar]
  71. Huang, X.; Xiao, J.; Wang, X.; Ma, M. Improving the global MODIS GPP model by optimizing parameters with FLUXNET data. Agr. Forest Meteorol. 2021, 300, 108314–108327. [Google Scholar] [CrossRef]
  72. Xu, L.; Shi, Y.; Fang, H.; Zhou, G.; Xu, X.; Zhou, Y.; Tao, J.; Ji, B.; Xu, J.; Li, C.; et al. Vegetation carbon stocks driven by canopy density and forest age in subtropical forest ecosystems. Sci. Total Environ. 2018, 631, 619–626. [Google Scholar] [CrossRef] [PubMed]
  73. Zhang, H.; Fan, J.; Wang, J.; Cao, W.; Harris, W. Spatial and temporal variability of grassland yield and its response to climate change and anthropogenic activities on the Tibetan Plateau from 1988 to 2013. Ecol. Indic. 2018, 95, 141–151. [Google Scholar] [CrossRef]
  74. Assumma, V.; Bottero, M.; Monaco, R.; Soares, A.J. An integrated evaluation methodology to measure ecological and economic landscape states for territorial transformation scenarios: An application in Piedmont (Italy). Ecol. Indic. 2019, 105, 156–165. [Google Scholar] [CrossRef]
  75. Jiang, C.; Li, D.; Wang, D.; Zhang, L. Quantification and assessment of changes in ecosystem service in the Three-River Headwaters Region, China as a result of climate variability and land cover change. Ecol. Indic. 2016, 66, 199–211. [Google Scholar] [CrossRef]
  76. Zhao, D.S.; Gao, X.; Wu, S.H.; Zheng, D. Trend of climate variation in China from 1960 to 2018 based on natural regionalization. Adv. Earth Sci. 2020, 35, 750–760. (In Chinese) [Google Scholar]
  77. Peng, S.; Ding, Y.; Liu, W.; Li, Z. 1 km monthly temperature and precipitation dataset for China from 1901 to 2017. Earth Syst. Sci. Data 2019, 11, 1931–1946. [Google Scholar] [CrossRef] [Green Version]
  78. Chen, C.; Park, T.; Wang, X.; Piao, S.; Xu, B.; Chaturvedi, R.K.; Fuchs, R.; Brovkin, V.; Ciais, P.; Fensholt, R.; et al. China and India lead in greening of the world through land-use management. Nat. Sustain. 2019, 2, 122–129. [Google Scholar] [CrossRef]
  79. Piao, S.; Wang, X.; Park, T.; Chen, C.; Lian, X.; He, Y.; Bjerke, J.W.; Chen, A.; Ciais, P.; Tømmervik, H.; et al. Characteristics, drivers and feedbacks of global greening. Nat. Rev. Earth Environ. 2019, 1, 14–27. [Google Scholar] [CrossRef]
  80. Feng, X.M.; Fu, B.J.; Lu, N.; Zeng, Y.; Wu, B.F. How ecological restoration alters ecosystem services: An analysis of carbon sequestration in China’s Loess Plateau. Sci. Rep. 2013, 3, 2846. [Google Scholar] [CrossRef]
  81. Duan, J.; Mao, J.T. Study on the distribution and variation trends of atmospheric aerosol optical depth over the Yangze River Delta. Acta Sci. Circumstantiae 2007, 27, 537–543. (In Chinese) [Google Scholar]
  82. Burrell, A.L.; Evans, J.P.; Kauwe, M.G. Anthropogenic climate change has driven over 5 million km2 of drylands towards desertification. Nat. Commun. 2020, 11, 1–11. [Google Scholar] [CrossRef] [PubMed]
Figure 1. Spatial distribution of China’s land cover.
Remotesensing 14 01634 g001
Figure 2. The spatial distribution of China’s total annual precipitation (a) and annual average temperature (b) in 2019.
Remotesensing 14 01634 g002
Figure 3. Spatial distribution of grassland sample plots, forest flux stations and China’s terrestrial ecosystems.
Remotesensing 14 01634 g003
Figure 4. Spatial distribution of the secondary regions of China’s ecogeographical divisions after adjustment.
Remotesensing 14 01634 g004
Figure 5. The NPP from MOD17A3HGF v006 compared with sample NPP.
Remotesensing 14 01634 g005
Figure 6. The spatial distribution of vegetation NPP in China from 2000 to 2019 (IMP: Inner Mongolia Plateau, NEP: Northeast Plain, QTP: Qinghai-Tibet Plateau, LP: Loess Plateau, NCP: North China Plain, SCB: Sichuan Basin).
Remotesensing 14 01634 g006
Figure 7. Interannual changes in China’s vegetation NPP from 2000 to 2019.
Remotesensing 14 01634 g007
Figure 8. The 2000–2019 national vegetation NPP trend (a) and its significance test (b) (IMP: Inner Mongolia Plateau, NEP: Northeast Plain, QTP: Qinghai-Tibet Plateau, LP: Loess Plateau, NCP: North China Plain, SCB: Sichuan Basin).
Remotesensing 14 01634 g008
Figure 9. Spatial distribution of climax background NPP in China’s forest, grassland and desert ecosystems.
Remotesensing 14 01634 g009
Figure 10. Restoration status (a) and restoration potential (b) of NPP in China’s forest, grassland and desert ecosystems.
Remotesensing 14 01634 g010
Figure 11. National temperature trend (a) and precipitation trend (b) from 2000 to 2019 (IMP: Inner Mongolia Plateau, NEP: Northeast Plain, QTP: Qinghai-Tibet Plateau, LP: Loess Plateau, NCP: North China Plain, SCB: Sichuan Basin).
Remotesensing 14 01634 g011
Table 1. General information on Nature Reserves in China.
AttributeValue 1
Protection levelsNational (422), provincial (319), county (393)
Protection typesgrassland meadows (6), geological relics (30), ancient biological relics (13), ocean coasts (24), desert ecology (17), inland wetlands (79), forest ecology (333), wetland ecology (3), wild animals (205) and wild plants (31)
1 The numbers in parentheses are the number of nature reserves of a certain protection level or the number of nature reserves of a certain protection type.
Table 2. The 21 second-level zones.
NameAbbreviationNameAbbreviation
Cold temperate humid zoneIATemperate arid zone of Qinghai-Tibet PlateauHIID
Mid-temperate subhumid zoneIIAWarm temperate humid zoneIIIA
Humid mid-temperate zoneIIBWarm temperate subhumid zoneIIIB
Mid-temperate semiarid zoneIICWarm temperate semiarid zoneIIIC
Mid-temperate arid zoneIIDWarm temperate arid zoneIIID
Humid central subtropical zoneVAHumid north subtropical zoneIVA
Sub-frigid and semiarid zone of Qinghai-Tibet PlateauHICSouth subtropical humid zoneVIA
Frigid and Arid zone of the Qinghai-Tibet PlateauHIDMarginal tropical humid zoneVIIA
Sub-frigid and subhumid zone of the Qinghai-Tibet PlateauHIBHumid mid-tropics zoneVIIIA
Humid and semi-humid temperate zone of the Qinghai-Tibet PlateauHIIA-Bequatorial tropical humid zoneIXA
Temperate semiarid zone of Qinghai-Tibet PlateauHIIC--
Table 3. Significance test of the trend of NPP.
Significance TypesSen Trend ValueMK p Value
Significant decrease<0p < 0.05
Relatively significant decrease<00.05 ≤ p ≤ 0.1
No significant changeValid range0.1 < p
Relatively significant increase>00.05 ≤ p ≤ 0.1
Significant increase>0p < 0.05
Table 4. The regression equations of NPPavg, MATavg and MTPavg of the climax background of forest, grassland and desert ecosystems in each eco-geographical zone.
CodeZoneEcosystemFitting EquationR2Significance
IIAMid-temperate subhumid zoneForestNPPavg = 128.52 + 12.54 × MATavg + 0.54 × MTPavg0.75p < 0.05
grasslandNPPavg = 78.65 + 5.36 × MATavg + 0.37 × MTPavg0.81p < 0.05
desertNPPavg = −4.3 + 10.63 × MATavg + 0.32 × MTPavg0.85p < 0.05
IIBHumid mid-temperate zoneForestNPPavg = 379.37 + 12.82 × MATavg + 0.24 × MTPavg0.54p < 0.05
grasslandNPPavg = 306.74 − 2.77 × MATavg + 0.24 × MTPavg0.59p < 0.05
desertNPPavg = 74.01 − 0.29 × MATavg + 0.34 × MTPavg0.73p < 0.05
IICMid-temperate semiarid zoneForestNPPavg = 57.56 + 25.12 × MATavg + 0.55 × MTPavg0.72p < 0.05
grasslandNPPavg = 62.54 + 4.48 × MATavg + 0.53 × MTPavg0.83p < 0.05
desertNPPavg = −36.33 + 9.14 × MATavg + 0.46 × MTPavg0.89p < 0.05
IIDMid-temperate arid zoneForestNPPavg = 191.89 + 13.81 × MATavg + 0.28 × MTPavg0.73p < 0.05
grasslandNPPavg = 69.89 + 9.1 × MATavg + 0.2 × MTPavg0.69p < 0.05
desertNPPavg = −8.28 + 1.23 × MATavg + 0.02 × MTPavg0.6p < 0.05
IIAHumid central subtropical zoneForestNPPavg = 333.68 + 35.71 × MATavg − 0.03 × MTPavg0.61p < 0.05
grasslandNPPavg = 346.97 + 34.72 × MATavg − 0.03 × MTPavg0.49p = 0.1
HIBSub-frigid and subhumid zone of the Qinghai-Tibet PlateauForestNPPavg = 263.54 + 21.23 × MATavg − 0.04 × MTPavg0.66p < 0.05
grasslandNPPavg = 235.78 + 19.4 × MATavg − 0.05 × MTPavg0.71p < 0.05
desertNPPavg = 213.65 + 18.79 × MATavg − 0.06 × MTPavg0.77p < 0.05
HICSub-frigid and semiarid zone of Qinghai-Tibet PlateauForestNPPavg = 101.18 + 9.35 × MATavg + 0.08 × MTPavg0.62p < 0.05
grasslandNPPavg = 64.23 + 6.05 × MATavg + 0.02 × MTPavg0.70p < 0.05
desertNPPavg = 36.84 + 4.52 × MATavg + 0.02 × MTPavg0.74p < 0.05
HIIA-BHumid and semi-humid temperate zone of the Qinghai-Tibet PlateauForestNPPavg = 529.24 + 15.85 × MATavg − 0.17 × MTPavg0.62p < 0.05
grasslandNPPavg = 356.31 + 7 × MATavg − 0.1 × MTPavg0.54p < 0.05
desertNPPavg = 259.61 + 5.79 × MATavg + 0.0002 × MTPavg0.17p = 0.76
HIICTemperate semiarid zone of Qinghai-Tibet PlateauForestNPPavg = 243.75 + 22.04 × MATavg + 0.12 × MTPavg0.77p < 0.05
grasslandNPPavg = 116.31 + 10.05 × MATavg + 0.06 × MTPavg0.63p < 0.05
desertNPPavg = 71.31 + 6.34 × MATavg + 0.04 × MTPavg0.69p < 0.05
HIIDTemperate arid zone of Qinghai-Tibet PlateauForestNPPavg = 59.13 − 0.06 × MATavg + 0.19 × MTPavg0.49p < 0.05
grasslandNPPavg = 8.86 + 0.92 × MATavg + 0.006 × MTPavg0.71p < 0.05
desertNPPavg = 1.37 + 0.14 × MATavg + 0.004 × MTPavg0.61p < 0.05
IIIBWarm temperate subhumid zoneForestNPPavg = 41.7 + 18.05 × MATavg + 0.37 × MTPavg0.42p = 0.19
grasslandNPPavg = 55.64 + 11.11 × MATavg + 0.45 × MTPavg0.50p = 0.09
IIICWarm temperate semiarid zoneForestNPPavg = 147.89 + 13.42 × MATavg + 0.48 × MTPavg0.75p < 0.05
grasslandNPPavg = 44.06 + 11.06 × MATavg + 0.49 × MTPavg0.78p < 0.05
IIIDWarm temperate arid zoneForestNPPavg = 23.69 − 0.89 × MATavg − 0.002 × MTPavg0.20p = 0.71
grasslandNPPavg = 5.38 − 0.26 × MATavg + 0.016 × MTPavg0.40p < 0.05
desertNPPavg = 0.03 + 0.001 × MATavg + 0.00014 × MTPavg0.26p < 0.05
IVAHumid north subtropical zoneForestNPPavg = 217.43 + 20.2 × MATavg + 0.16 × MTPavg0.42p = 0.09
grasslandNPPavg = 318.96 + 8.87 × MATavg + 0.19 × MTPavg0.47p = 0.13
desertNPPavg = 295.56 − 16.23 × MATavg + 0.25 × MTPavg0.60p < 0.05
VIASouth subtropical humid zoneForestNPPavg = 1427.45 − 2.12 × MATavg − 0.02 × MTPavg0.10p < 0.01
grasslandNPPavg = 616.84 + 24.07 × MATavg + 0.02 × MTPavg0.30p = 0.43
Table 5. National vegetation NPP classification statistics from 2000 to 2019.
NPP Classification
(gC/m2/a)
Area
(104 km2)
Area Ratio (%)NPP Classification
(gC/m2/a)
Area
(104 km2)
Area Ratio (%)
<2199.6921.68200–500281.7230.59
2–103.900.42500–1000202.9122.03
10–5048.495.271000–150036.163.93
50–200143.2815.56>15004.880.53
Table 6. Statistical table for the significance test of the NPP trend.
Significance TypesArea (104 km2)Area Ratio (%)
Significant decrease6.470.70
Relatively significant decrease16.561.80
No significant change457.2849.65
Relatively significant increase166.0618.03
Significant increase274.6929.82
Table 7. Classification statistics of the climax background NPP in China’s forest, grassland and desert ecosystems.
NPP Classification
(gC/m2/a)
Climax Background NPPNPP Classification
(gC/m2/a)
Climax Background NPP
Area
(104 km2)
Area Ratio (%)Area
(104 km2)
Area Ratio (%)
<24.520.89200–500135.8426.85
2–1024.264.80500–1000169.6033.52
10–5019.533.861000–150062.2512.30
50–20081.9116.19>15008.111.60
Table 8. Classification statistics of the restoration status and restoration potential of NPP in China’s forest, grassland and desert ecosystems.
NPP Classification
(gC/m2/a)
Restoration Status NPPNPP Classification
(gC/m2/a)
Restoration Potential NPP
Area
(104 km2)
Area Ratio (%)Area
(104 km2)
Area Ratio (%)
<250.379.95<13.730.74
2–101.750.351–516.603.28
10–5021.464.245–1031.636.25
50–20089.8517.7610–2047.649.41
200–500138.2727.3320–50110.0521.75
500–1000162.9632.2050–100126.1624.93
1000–150036.987.31100–20096.5719.08
>15004.380.87>20073.6514.56
Publisher’s Note: MDPI stays neutral with regard to jurisdictional claims in published maps and institutional affiliations.

