Article

A Network of X-Band Meteorological Radars to Support the Motorway System (Campania Region Meteorological Radar Network Project)

1
Department of Science and Technology, University of Naples Parthenope, 80143 Napoli, Italy
2
CIMA Research Foundation, 17100 Savona, Italy
*
Author to whom correspondence should be addressed.
Remote Sens. 2022, 14(9), 2221; https://doi.org/10.3390/rs14092221
Submission received: 8 February 2022 / Revised: 22 March 2022 / Accepted: 3 May 2022 / Published: 6 May 2022

Abstract

:
The transport sector and road infrastructures are very sensitive to the issues connected to the atmospheric conditions. The latter constitute a source of relevant risk, especially for roads running in mountainous areas, where a wide spectrum of meteorological phenomena, such as rain showers, snow, hail, wind gusts and ice, threatens drivers’ safety. In such contexts, to face out critical situations it is essential to develop a monitoring system that is able to capillary surveil specific sectors or very small basins, providing real time information that may be crucial to preserve lives and assets. In this work, we present the results of the “Campania Region Meteorological Radar Network”, which is focused on the development of X-band radar-based meteorological products that can support highway traffic management and maintenance. The X-band measurements provided by two single-polarization systems, properly integrated with the observations supplied by disdrometers and conventional automatic weather stations, were involved in the following main tasks: (i) the development of a radar composite product; (ii) the devise of a probability of hail index; (iii) the real time discrimination of precipitation type (rain, mixed and snow); (iv) the development of a snowfall rate estimator. The performance of these products was assessed for two case studies, related to a relevant summer hailstorm (which occurred on 1 August 2020) and to a winter precipitation event (which occurred on 13 February 2021). In both cases, the X-band radar-based tools proved to be useful for the stakeholders involved in the management of highway traffic, providing a reliable characterization of precipitation events and of the fast-changing vertical structure of convective cells.

Graphical Abstract

1. Introduction

In the light of the recent climatic changes, it is essential to pay great attention to the meteorological events and in particular to the severe ones, whose impact on the socio-economic fabric is exacerbated, in many contexts, by the increasing anthropogenic pressure. The roadway and highway transportation systems and infrastructures are very vulnerable to weather events, which frequently cause a reduction in traffic mobility, an increase in weather-related crash risk and many other issues, such as delays in evacuation processes. Several physical effects related to the occurrence of precipitation events, including the reduction in visibility through rain or snow, the spray from other vehicles and the loss of friction between tires and road, impair driving and can cause accidents. Moreover, atmospheric events, such heavy rain or snowfall, may seriously compromise road and highway viability and thereby decrease the link capacity and the travel speed, causing traffic congestion. For these reasons, it is very important to develop methodologies and technologies that can support the transportation handlers in the design of reasonable weather-response plans for traffic management.
It is widely recognized that the minimization of weather hazards effects on transports requires a solid monitoring network, based on weather radars. The latter are a fundamental tool for weather observations, providing three-dimensional atmospheric measurements supplying relevant information about precipitation dynamics and evolution in a timely manner. The pivotal role of weather radar data in road weather services was firstly emphasized and discussed in [1], which proposed several services to road users based upon weather radar (alone or in combination with other meteorological data). Indeed, the usefulness of radar information relies to a great extent on its timeliness, based on near-real-time acquisition, and on its three-dimensional coverage of a large volume of the atmosphere. These advantages can be put to good use in an operational road weather service, for example to provide accurate and timely snowfall information to road clearing authorities in winter [1].
More recently, weather radars have been included in specific models and systems for road weather forecasting, in conjunction with numerical weather models and observations from synoptical or road weather stations. As an example, in [2] a road weather forecasting system—named MeteoTrassa—has been developed, allowing the nowcasting and the forecasting of precipitation in terms of onset and cessation of snowfall, its intensity and amount for separate highway sections near St. Petersburg. More specifically, this system combines different weather data sources, i.e., 25 road weather stations, Doppler weather radar, regional and mesoscale forecasts, to produce an integrated road weather observations and forecasts system for the entire highway that can be useful for winter maintenance [2]. In [3], using weather radar images provided by a network of C-band systems, a novel approach to the analysis of the impact of rainfall on road traffic accidents in two urban areas (Manchester and London) has been proposed. The introduction of weather radar data offered considerable improvements to the accuracy and representativeness of rainfall with respect to punctual rain-gauge measurements. A simulation model, named RoadSurf, allowing definition of the conditions of the road surface taking as input numerical weather forecasts, observations from synoptic meteorological stations and radar-based rainfall measurements has been proposed in [4]. It is important highlighting that such studies focused on new meteorological tools for the management of highway traffic are generally based on conventional C-band weather radar measurements.
The benefits introduced by such specific meteorological services for road and highway managements can be measured not only in terms of driver safety improvements but also from an economical perspective. More specifically, the economic advantages introduced in the road transportation sector by weather forecasting and monitoring services and tools have been investigated in [5]: they estimated, for Switzerland, that the use of meteorology in transport produces a benefit ranging between 65.7 and 79.8 million of Swiss francs.
Nowadays, long-range microwave (S- or C-band) weather radars are considered an integral part of weather service infrastructure. Most of them are equipped with dual-polarization technology, which has considerably improved the sensing capabilities of these systems in the last three decades [6]. However, these radars suffer from some limitations, mainly related to their very high cost and power consumption, as well as to their difficult installation and to their scarce performance in monitoring the lower part of the troposphere, due to the beam blockage and the Earth’s curvature [7]. An appealing alternative that is becoming more and more employed in most of the World Meteorological Organization (WMO) member countries [8] is offered by X-band weather systems. The latter can be considered an emerging technology that conjugates a series of features, such as the high observational skills, the low maintenance costs and power consumption, which are very suitable for several applications. The main strengths and weaknesses of X-band radars, as well as their performance in severe weather monitoring and nowcasting, have been discussed and shown in several previous works (e.g., [9,10,11,12,13]).
A way to partly overcome the limit imposed by the use of X-band, mainly addressing the restricted scanning range and the strong signal attenuation, consists in network densification. In this sense, a relevant number of studies (e.g., [7,14,15,16,17,18,19]) analyzed the performance of an X-band radar network for precipitation estimation and nowcasting applications for flood warnings, especially in urban environments.
This work aims to add a new contribution to this research path, describing the research activities carried out in the framework of the project “Campania Region Meteorological Radar Network” (hereafter, CARMEN). The latter is the outcome of a synergy between the Department of Science and Technology of the University of Naples “Parthenope” and the “Autostrada per l’Italia” (hereafter, ASPI) company, which holds the Italian motorway sections under concession and manages the related maintenance activities. The CARMEN project started in December 2018 and ended in February 2021.
The main aim of the CARMEN project is the development of X-band radar-based meteorological products to support highway network management, especially in the winter season. The target area is the Campania region, a very high-density populated area of Southern Italy. Campania is crossed by several highways and presents a relevant topographic heterogeneity, which reflects a strong exposure to different severe meteorological events.
To pursue the goal of this work, the University of Naples “Parthenope” and ASPI combined different skills, involving research activities, technical and professional expertise and entrepreneurial activity, in order to implement a network of X-band radars that is able to guarantee a solid and capillary surveillance of the study area. The measurements of this network, in conjunction with other meteorological data sources, contributed to the following main tasks: (i) the development of a radar composite product that allows real-time identification of the location and structure of precipitation systems within the study area; (ii) the design of a probability of hail index, a useful tool for a real time detection of the hail events; (iii) the real time classification of precipitation type (rain, mixed and snow), through a proper matching between X-band radar features and air-temperature observations provided by automatic weather stations; (iv) the adaptation to the study area of literature X-band radar-based snowfall rate estimators.
The novel contributions of our study can be synthetized as follows:
  • We explored, for the first time, the potentiality of a low-cost single-polarization X-band radar network to support highway network management, especially in the winter season. To this purpose, we implemented a network, which consists of two X-band weather radar, the first installed in Naples urban area, the other in the town of Trevico (eastern sector of Campania region). The two sites are the result of a preliminary analysis that aims to improve the coverage, in comparison with the Italian radar network, of the internal area of Campania region, crossed by a strategic road (A16 motorway) that connects Tyrrhenian and Adriatic sectors of Italy, and often affected by snow episodes during the winter season;
  • A further novelty of our study consists in the estimation of snowfall rate through a proper adaptation of existing X-band algorithms to the study area. The accuracy of the radar snowfall rate estimates was assessed using a laser-optical disdrometer as a ground reference, properly installed at Montevergine Observatory for the purposes of the CARMEN project. In this respect, the results of this work contribute to fill a relevant gap, related to the absence, in the study area and, more in general, in the Italian territory, of a reliable real-time quantitative estimation of snowfall rate and amount;
  • From a strictly methodological point of view, as part of the CARMEN project, a new simple procedure was developed to discriminate the precipitation type through proper matching between X-band radar features and air-temperature observations provided by automatic weather stations. The algorithm is able to catch the rapid variation of the zero-degree level caused by the interaction of air mass with the local orographic features and to correctly discriminate the area affected by the snow and mixed or rain precipitation. This activity is crucial to planning the passage of snow ploughs in the sub-region affected by the snow and, therefore, to reduce the probability of traffic congestion caused by the snow accumulation on the road;
  • Finally, a Probability of Hail index, based on a previous work [20], was operationally implemented to provide, in real time, the sectors likely to be affected by the hail, and consequently to warn the drivers of congestions or car accidents ahead, improving road safety.
This paper is structured as follows. Section 2 describes the study area and its meteorological regime; moreover, it presents the X-band radar network and the other available meteorological measurements. Section 3 starts from a description of mosaicking procedures and then offers details about X-band radar-based products for hail detection and snowfall rate estimation, as well as for precipitation type identification. Two different case studies, related to a summer hail event and to a wintertime snowfall event are described and discussed in Section 4. Finally, the conclusions and the future perspectives are provided in Section 5.

2. Study Area and Available Measurements

2.1. Study Area

The target area of this study encompasses a large part of the Campania Region (Southern Italy): the districts of Naples, Caserta and Avellino and a very small portion of Benevento and Salerno districts (Figure 1). The CARMEN project has focused on three highways, the Autostrada A1, which links the most important Italian cities, the Autostrada A16, which connects the Thyrrhenian coast (Naples) to the Adriatic coast (Bari), and the Autostrada A30, which links the cities of Caserta and Salerno. The specific routes of interest are the A1 section from Caianello to Naples (highlighted in yellow in Figure 1), the A16 section from Naples to Candela (marked in green) and the A30 segment from Caserta to Mercato San Severino (highlighted in red).
It is worth pointing out that the A16 highway runs on a territory, coincident with Irpinia, characterized by a complex orography. As pointed out by magenta markers in Figure 1, along the A16 motorway there are three passes located at an altitude greater than 500 m asl, i.e., the Monteforte Irpino pass (619 m asl, marked as a filled-in circle), the Montemiletto pass (502 m asl, highlighted as a filled-in square) and the Scampitella pass (670 m asl, marked as a filled-in diamond).
The meteorological regime of this area is largely conditioned by its proximity to the Tyrrhenian Sea and by Apennines mountains (Matese, Taburno-Camposauro, Partenio and Picentini), which have heights ranging between 1400 and 2050 m asl.
In the cold season (from November to April), different meteorological phenomena may adversely affect the road conditions. More specifically, in coastal areas and in the plain of Caserta, the winter hazards are mainly related to convective phenomena associated with the passage of atmospheric transients developing from the polar front. Such transients are often associated with cold maritime polar or arctic air masses that, crossing the relatively warm surface of the Tyrrhenian Sea, can trigger the development of convective cells that cause hail (or seldom graupel) precipitation. In coastal and plains areas, the snowfall events are quite rare (the last relevant and impactful event occurred on the end of February 2018); however, due to the very high population density of this area (which includes about three million inhabitants), the accumulation of snow on the ground may have dramatic consequences on road traffic.
Conversely, in the cold season (and in particular from December to March) snow events are very frequent in the inland sectors, although with an obvious dependence from the altimetry. A large spectrum of meteorological scenarios, involving a strong baroclinicity and the incoming cold arctic or polar air masses (of both maritime and continental origin), can satisfy the conditions favorable to snowfall. In many circumstances, the areas near the three passes (and in particular the Monteforte Irpino and Scampitella ones) may receive up to 20–30 cm of fresh snow in less than 24 h, sometimes associated with strong winds that act as additional hazards for drivers.
In the warm season (from May to October), the main hazardous conditions are caused by strong convective events that produce intense rainfall, hail, wind gusts and lightning activity. The convection may be promoted by the interactions between synoptic and mesoscale meteorological factors [20]. More specifically, two mechanisms should be taken into account: (i) sea–air interactions, which are able to force the development of severe convective events, especially in the early part of fall season, mainly affecting the coastal areas; (ii) orographic forcing, which can enhance the convection in the hottest months (i.e., from June to August) often in combination with low-level convergence between diurnal sea-breeze and synoptic-scale flow.

2.2. X-Band Radar Network

The X-band radar involved in the CARMEN project is the WR-10X, a single polarization system produced by ELDES s.r.l. company. The WR-10X reconciles a range of features, i.e., low power consumption (less than 300 W on average), very compact size (90 × 130 cm2) and relatively low weight (about 100 kg), which simplifies the installation requirements and facilities. The main technical characteristics of this radar system are synthetized in Table 1.
To adequately surveille the study area, two radars have been deployed (Figure 2). The first one is located in the Naples urban area, at the top of Castel Sant’Elmo (40.8433°N, 14.2385°E, 280 m asl). This radar, installed at the end of 2011, is part of the meteo-oceanographic monitoring network of the University of Naples “Parthenope”. The Naples radar, according to Figure 2, is very useful for detecting and monitoring the precipitation events affecting the A1 highway (plain of Caserta and the northern sector of Naples district) and the western sector of the A16 highway up to the pass of Monteforte Irpino. Unfortunately, the partial or total beam blockage caused by the orography, as well as other range-dependent impairments, limit the visibility of this radar in the east and southeastern directions. The second weather radar has been “ad hoc” installed for the purposes of the CARMEN project by the ASPI SpA and is located in Irpinia, in the town of Trevico (41.052156°N, 15.235667°E, 1050 m slm). This site offers a very good view of most of the Campania region inland sectors and is an ideal observation point for monitoring rainfall and snowfall events affecting the three passes of the A16 highway (Monteforte Irpino, Montemiletto and Scampitella). The Trevico weather radar, being located at a relatively high elevation, ensures a more homogeneous coverage, especially in the longitudinal direction. The electromagnetic beam, in fact, is partially occulted at the lowest antenna elevation angle only in the south direction, due to the presence of Picentini Mountains.
The set-up of the operational configuration of the two radar systems was structured as follows. Both systems perform a complete scan every 10 min, with synchronized start times. For the Naples radar, the atmosphere is scanned with ten elevations (1, 2, 3, 4, 5, 7.5, 10, 12.5, 15 and 20°), with a range resolution of 450 m and an azimuth resolution of 1.0 degree. Within this configuration, according to the limits imposed by the WR-10X system for data transfer from the receiver to the processing unit, the maximum available range is 108 km. For the Trevico radar, a near-identical scan mode was scheduled, except for the 20° elevation that was removed.
The scan configuration described responds to three different requirements: (i) the need for monitoring of the entire highways routes involved in the CARMEN project; (ii) the need to adequately characterize the vertical structure of thunderstorm cells, which is an essential element to estimate their severity; (iii) the necessity to find an optimal set of elevation scans for the tuning of clutter signal filtering.
The available measurements, consisting for both radars of horizontal reflectivity (hereafter, Zh) alone, are routinely subjected to a quality control procedure in order to overcome or mitigate some common systematic and range-dependent errors, such as ground and sea clutter, the beam blocking by mountain reliefs and the beam attenuation along the path. A detailed description of the methods adopted in the framework of the quality control chain is offered in [20,21].
Moreover, it should be mentioned that a large part of the study area is also monitored by a dual polarization X-band weather radar, located at the airport of Naples Capodichino. This radar is part of the Italian operational weather radar network and is managed by the Department of Civil Protection [22].

2.3. Other Meteorological Instruments

The target area is also effectively monitored by several networks of in situ atmospheric observations, managed by the local Institution (the “Centro Funzionale Multirischi’’ of the Campania Region Department of Civil Protection), by research Institutes (the University of Naples “Parthenope”) and by RTF Sistemi s.r.l. (“Campanialive” network). More specifically, for the purpose of this project, we used the air temperature data collected by several automatic weather stations (AWS) as well as the disdrometric measurements collected at the Montevergine observatory (40.936502°N, 14.72915°E, 1280 m asl). The air-temperature (T) data were measured with a platinum wire thermistor, placed in a passive radiation shield. Such measurements are available in real time with a temporal resolution (10 min) that is consistent with the time that elapses two consecutive radar scans. The available T measurements from AWS are collected at different altitudes, ranging between 35 and 1515 m asl (Table 2).
The disdrometric data are provided by a laser-optical device (manufactured by Thies CLIMA) and consist of 1 min resolution information about precipitation drop spectra (i.e., the speed and the size of hydrometeors). In particular, the Thies CLIMA disdrometer groups particles into 22 and 20 classes of diameter and fall velocity, ranging from 0.125 to 9 mm and from 0 to 12 m∙s−1, respectively [23]. Montevergine’s disdrometric records have been included in research activities related to the development of X-band radar-based snowfall estimator (see Section 3.4) and they are currently not used in an operative framework.

3. Methods and Data Analysis

3.1. Radar Composite

The first task of the CARMEN project is the development of a radar composite product for a real time monitoring of precipitation structure evolution. In this paragraph, we briefly describe the mosaicking process.
The latter starts from the corrected volume scans of horizontal reflectivity collected by Naples (hereafter, NA) and Trevico (hereafter, TRE) weather radars. The NA and TRE reflectivity volumes are originally available in native spherical coordinates: according to the range and azimuth resolution data provided in Table 1, the size of a single Plan Position Indicator (PPI) is 361 × 240 pixels. The first step consists of computing, for both radar volumes, the Vertical Maximum Intensity (VMI), which is a very common product representing the maximum reflectivity value in each quasi-vertical atmospheric column scanned by weather radar. The VMI products were then remapped into a two-dimensional regular Cartesian grid, with a horizontal resolution of 500 × 500 m. More specifically, the original VMI data were interpolated along range and azimuth directions into a rectangular domain, whose extension ranges from 12.9540°E to 16.5202°E in longitude and from 39.8749°N to 42.0211°N in latitude. Afterwards, the remapped VMI values from the two radars at any given grid cell are combined using the criterion of the “maximum value”. In other words, in the grid cells of the Cartesian grid in which both NA and TRE measurements are available, the highest value is selected to produce the final mosaic product. A schematic diagram of X-band radar data processing for composite generation is provided in Figure 3.
It is important to highlight that the approach of the maximum criterion was selected after the evaluation of other several mosaicking criteria, which involve different methods for the selection of reflectivity values in the overlapping area of two or more radars (e.g., [24,25,26,27,28]). The selection of “maximum value” criterion is motivated by its ease of implementation, which matches the operational requirements of the CARMEN project well.
Figure 4 shows an example of the mosaicking procedure. The upper panels (Figure 4a,b) present the VMI product collected by NA and TRE radar, respectively, on 13 February 2021 (03:20 UTC) during a stratiform precipitation event. The bottom panel shows the composite product obtained through the described method. From a simple visual inspection of these radar maps, the benefits introduced by the mosaicking, which allows mitigation of the limits imposed by single-polarization X-band radar, mainly related, in this circumstance, to the wet-radome attenuation and to the attenuation due to the propagation of an electromagnetic beam through precipitation. The composite product offers a more consistent view of the precipitation field in the area of interest and, in this case, along the sectors crossed by the A16 highway, which experienced relevant snowfall events, as will be described in Section 4.3.

3.2. Probability of Hail Index

It is widely recognized that the weather radars play a pivotal role for the real time detection and estimation of hail. The on-ground observational networks, in fact, are typically not equipped to adequately observe this hydrometeor, which constitutes a serious hazard for transports in all seasons.
Although the state of the art of radar-based detection of hail events takes advantage of dual polarization weather radar features (e.g., [29,30,31,32,33,34,35]), the literature offers different examples of techniques relying on the sole Zh measurements. In this respect, a lucid overview can be found in [36], as well as in [37]. The ratio behind these approaches is the research of signatures in Zh measurements, such as the appearance of high reflectivity cores above the melting layer and/or the exceeding of specific threshold in some reflectivity-related products (such as the Vertically Integrated Liquid), which can be used as proxies of the physical processes involved in hailstone growth (e.g., [37,38,39,40,41,42,43]). A summary of the main single-polarization radar-based methods for hail detection, including a brief description of their strengths and points of weaknesses, is offered in Table 3.
The Probability of Hail (hereafter, POH) product developed in the framework of the CARMEN project is based on the Vertically Integrated Liquid Density (VLD) parameter. The latter was introduced in [44] and is defined as the ratio between the Vertically Integrated Liquid (VIL) and the EchoTOP. More specifically, the VIL product, usually expressed in kg∙m−2, can be simply computed through a vertical integral of Zh collected at different antenna elevation angles and gives information about the equivalent liquid water content within an atmospheric column. The VIL is a function of reflectivity and, therefore, increases exponentially with increasing Zh, so high VIL values are synonymous with the presence of a large target (hail) aloft. The VIL has been proposed as an indicator of thunderstorm severity by [45] and is frequently used to identify storms that likely produce hail. However, this product has some limitations, as widely discussed in [46,47], mainly related to its strict dependence on air masses and seasons and to its inability to distinguish tall storms with relatively low reflectivity from short storms with high reflectivity. The VLD method was conceived to overcome some limits of the VIL product. From a formal perspective, the VLD is computed as:
V L D = 1000 ( V I L E c h o T O P ) = 1000 ( a E c h o T O P ) 0 E c h o T O P   [ Z h ( h ) ] b d h ,
where h (expressed in m) is the vertical coordinate of each column within the observed radar volume, a = 3.44 × 10⁻⁶ and b = 4/7 are coefficients provided by [45] and EchoTOP (in m) is the altitude of the highest echo detected by radar. The factor 1000 is used to express the VLD in g∙m−3. According to Equation (1), the VLD normalizes the VIL with respect to the depth of the thunderstorm; therefore, it is useful for the detection of convective cells with high reflectivity relative to their vertical extension.
The VLD method was extensively tested and trained for the study area, using the Zh measurements collected by NA radar, in [20]. More specifically, in this study, a dataset consisting of 53 thunderstorm events that occurred in Campania Region between April 2012 and June 2015 was considered to examine the VLD performance. In summary, the VLD method was adapted at the X-band and at the target area by a systematic comparison between its outcomes and the on-ground observations of thunderstorm and hail events, mainly provided by weather amateurs. Using a well-known statistical approach, a warning threshold, i.e., a VLD value that separates the occurrence and the non-occurrence of hail, was identified.
Figure 5 shows a scatter diagram of VIL values versus EchoTOP for the entire dataset analyzed in [20]. Three different VLD thresholds, labeled 2.0, 2.4 and 3.0 g∙m−3, are shown as black straight lines. The thunderstorm events are categorized as hail-producing (blue filled-in circles) and non-hail producing (red filled-in circles). It is worth noting that the VLD line labeled as 2.4 g∙m−3, which is the warning threshold found in [20], is very reasonable, identifying almost all (33 of 34) hail cases that occurred in the study area. At the same time, the 2.4 g∙m−3 falsely detects 11 of 19 convective events characterized only by heavy rainfall as hail-producing.
The outcomes of VLD technique were simply converted into a POH index using a heuristic approach (a detailed description is provided in [20]). The POH index, expressed in percentage and varying between 0 and 100%, is used in an operative context to provide a real-time warning for hail events. When the POH value exceeds 79%, which corresponds to VLD = 2.4 g∙m−3, hail is very likely to occur.

3.3. Precipitation Type Identification

In this paragraph, we describe the precipitation type product, which is propaedeutic to the real-time estimation of snowfall rate, one of the main tasks of the CARMEN project.
Generally, a determined radar-based technique for hydrometeor classification aims at partitioning a radar volume in terms of a certain number of precipitation types, including rain, hail, graupel/small hail, snow, ice crystals, drizzle and wet hail/rain [32]. Some common polarimetric radar variables, such as the differential reflectivity (Zdr), the specific differential phase shift (Kdp) and copular correlation (ρhv), as well as Zh, are usually employed in the design of these techniques. The fuzzy-logic-based approach developed in [48], in [49] and in [33], as well as the Bayesian decision rule proposed in [50], are two relevant and robust examples of dual polarization-based methods for hydrometeor classification.
In scenarios where polarimetric variables are not available, such as the one of the CARMEN project, the Zh measurements alone are not sufficient for the identification of precipitation type and they should be integrated with meteorological data from other sources. It is important to highlight that our primary goal is to devise an algorithm that is able to discriminate between snow and rain on the ground from the precipitation field observed by the X-band radar composite. Therefore, we focused on algorithms that incorporate information about temperature vertical profiles, which is essential to capture the fast temperature variations that regulate the variability of the rain/snow limit. It is useful to bear in mind that the identification of the snow limit is an arduous task, because the temperature vertical profile evolution depends on thermo-hygrometric conditions in the low troposphere; the latter is modulated by deep moist convection, horizontal and vertical advection, mixing/surface fluxes, atmospheric radiation and several processes related to latent heating releasing and absorbing (e.g., [51]).
In most of previous works (e.g., [52,53]), the thermo-hygrometric conditions are synthetized by wet-bulb temperature (Twb) parameter, which is a key-factor for the identification of precipitation type [54]. The Twb data are generally retrieved from the limited area model (LAM) numerical weather simulations, through a combination of specific humidity and dry temperature parameters.
In this study, we developed an algorithm for a real time identification of precipitation type based on the data provided by the 20 AWS operating in the study area. This choice is motivated by the fact that the fast temperature changes typically observed during a severe winter atmospheric event may be not aligned in time and space with the LAM forecasts, especially in a context characterized by a complex orography. However, the use of AWS data has a relevant drawback, due to the unavailability, for most stations, of Twb data. For this reason, T data were used instead of Twb.
More specifically, our algorithm starts from a partition of the study area into four different sub-regions, sketched in Figure 6 and labeled A, B, C and D. The sub-region A includes the plain of Caserta and the northern and eastern sides of Naples districts, which are crossed by the A1 highway and by a small portion of A30 and A16 motorways. Subregion B has a very small extension, because it includes a territory characterized by relevant orographic features (Partenio mountains); this area is crossed by a segment of A16 highway with a highly variable altimetry ranging from about 150 to 619 m asl. The sub-region C embraces a large part of Irpinia territory, including the Montemiletto and Scampitella passes, and presents a variable altimetry as well, although its meteorological regime is not conditioned by relevant foothills. Finally, region D includes a part of the A30 motorway (which has an altimetry varying between 15 and 200 m asl) and has a meteorological regime influenced by Sarno mountains and, as regards as the area of Mercato San Severino (which bounds the eastern limit of A30 highway), by the western side of the Picentini mountains.
Using the T measurements from available AWS listed in Table 2, we were able to be reconstructed in real time the vertical temperature profile in the lowest portion of the troposphere with a temporal resolution of 10 min.
From vertical temperature profiles, the altitude (in m) of three different isotherms, i.e., 0 °C, 1 °C and 2 °C, hereafter named H0°C, H1°C and H2°C, respectively, was routinely extracted in each sub-region through a simple linear interpolation. When a determined radar composite grid cell (with coordinates x, y and H, where H = height asl expressed in m) is affected by precipitation according to the VMI composite product, it is assigned to a determined precipitation type category (rain, mixed and snow) depending on the criteria shown in Table 4.
Such criteria were defined after proper tuning, based on several winter precipitation events that occurred in the study area. The strategy for precipitation type product generation is shown in Figure 7. It is important to highlight that our algorithm is structured to also provide reliable H0°C, H1°C and H2°C estimates in some specific situations, such as low-level thermal inversion, that may potentially lead to strong inaccuracies. Nevertheless, this procedure has proven to be very affordable for a real-time discrimination between rain and snow in stratiform precipitation events. In circumstances when the precipitation is the fruit of deep and strong convection, it may fall on the ground in the form of snow pellets even at T greater than 1 °C and, therefore, it may be wrongly classified as mixed or rain.

3.4. Snowfall Rate Estimation

The radar-based estimation of snowfall rate is a challenging task. The dynamics of snowflake growth, in fact, is very complex and results in a large variability of several factors, such as the snow particle size distribution, the particle’s density, orientation, habits and shape, which have a relevant impact on snowfall rate estimation [55].
The advent of polarimetry has partly mitigated the issues in snow retrievals, by introducing new variables, such as Zdr and Kdp, which often exhibit signatures that are very well correlated with the abundance and/or growth of ice crystals [56,57]. For this reason, some recent works have proposed the use of Kdp alone or in combination with Zh for radar-based snowfall estimation (e.g., [55,58,59]). Very recently, in [60] an interesting approach for snowfall rate estimation, based on colocated Parsivel disdrometer and K-band micro rain radar measurements collected in Antarctica during two austral summer seasons, has been proposed. More specifically, the authors of this study proposed a continue adaptation (on 10 min basis) of the equivalent reflectivity factor to snowfall rate relationship depending on six different snow categories, in order to account for the extreme variability of snow microphysical features.
The reference work for the CARMEN project study area is [55], which developed a new X-band estimator for snowfall rate based on the use of Zh and Kdp. To meet this goal, the dual-polarization radar measurements collected by Naples Capodichino system and the disdrometric data measured in Montevergine observatory (considered as ground reference) during the 2018/19 winter season were taken into account. According to the results of this study, the use of Kdp alone greatly improves the performance of snowfall rate estimation. This achievement may be ascribed to some detrimental effects affecting the Zh measurements, related to the beam attenuation along the path and to the partial beam blocking.
The two X-band single polarization systems involved in the CARMEN project constrained our research activities to the adaptation to the study area of literature snowfall rate (hereafter, SR) estimators based solely on Zh measurements. To pursue this aim, we performed a comparison between the estimated SR by X-band composite (hereafter, SRRAD) and the measured SR from the Montevergine laser disdrometer (hereafter, SRM) for the snowfall events which occurred on 29 January 2019 (from 05:00 to 22:00 UTC), on January 30, 2019 (from 14:00 to 23:50 UTC), and on 6 May 2019 (from 01:00 to 18:00 UTC). The SRRAD was determined using nine different estimation algorithms available for X-band ([61,62,63,64]). More precisely, the SRRAD (mm∙h−1) was computed via the following equation:
S R R A D = a j Z h b j
where the index j identifies one of the tested radar algorithms and Zh is expressed in mm6∙m−3. The coefficients aj and bj are listed in Table 5 for each estimator.
The SRM was determined from disdrometric measurements using Equation (1) in [55]. In implementing this equation, we used the measured particle’s terminal fall velocity according to the disdrometer and the relationship suggested by [65,66] for snow density estimation. In this respect, different values of the riming fraction, varying from 1 (unrimed) to 5 (heavily rimed particles) were used to compute the snow density.
The results of this comparison (Figure 8) are presented in the form of 10 min time series for the three selected snow events. The nine SRRAD estimators are highlighted by different colors, and they were obtained by selecting the highest SRRAD value among the composite grid cells that are within 1 km from the Montevergine site. The SRM from disdrometers is marked as a grey bar, whose width represents the variability due to the riming fraction (unrimed: low side of the bar; heavily rimed: upper side of the bar).
It is worth noting that most of the tested estimators follow relatively closely the SRM bar for the 29 January 2019 snowfall event, as well as for the 30 January 2019 event (except between 20:00 and 22:00 UTC). The results achieved for the 6 May 2019 event show instead a very poor agreement between measured and estimated SR. In order to evaluate the performance of the nine algorithms listed in Table 5, we performed a statistical analysis based on some familiar scores: the Pearson correlation coefficient (CC), the average ( E A V G = < E > ) and standard deviation ( E S T D = < ( E E A V G ) 2 > ) of the error difference ( E = S R R A D S R M ), the Root Mean Square Error ( R M S E = i = 1 n ( S R R A D i S R M i ) 2 n ) and the normalized standard error ( N S E = ( E A V G 2 + E S T D 2 ) 0.5 / < S R M > ), where the symbol “< >” indicates the average operator over time, n is the number of available samples (178). According to Table 6, which presents the results of this analysis, the MATR2-09 performs best in terms of CC (on a par with B&W1-85 and B&W2-85), ESTD and RMSE scores. The FALC(LR)-18 and the B&W2-85 are the best in terms of EAVG and NSE, respectively.
According to this evidence, we used the MATR2-09 a6 and b6 coefficients to produce a preliminary real-time SR estimator. However, it is important to highlight that, from an operational standpoint, the fixing of a single relationship that estimates the SR from Zh seems to be quite useless over the large variability of snow signals. A workaround for the operational framework of the CARMEN project could be a real-time calibration of Equation (2) using in situ ground reference measurements. However, this solution is not feasible in our context, due to the absence, in the Campania region, of a network of in situ devices (such as disdrometers, heated rain gauges or nivometers) that is able to provide affordable real-time measurements of SR. The only ground reference is the Montevergine disdrometer, but it is localized in a mountainous area (1280 m asl) and, due to the often critical environmental conditions (e.g., strong winds, ice accretion), it can be used only for research purposes after careful event selection.
We are conscious that the method used for the real time estimation of SR is not the most accurate and reliable solution, but, at this stage, it represents the best compromise according to the available radar measurements and ground references in the study area.

4. Results and Application to Case Studies

4.1. Real-Time System Architecture and Dataflow

In the framework of CARMEN project, we developed an “ad hoc” operative chain for the real-time management and processing of reflectivity volumes collected by the X-band radar network. The dataflow architecture is shown in Figure 9. The raw reflectivity measurements collected by the two systems (NA and TRE) are transferred via STCP protocol to a server physically located in the Department of Science and Technology of the University of Naples “Parthenope”. Using a Python script based on NumPy library, a quality control was applied to both NA and TRE data, in order to remove some impairments listed in the Section 2.2. Subsequently, from corrected reflectivity measurements, the VMI and the POH are computed from both radar volumes in the native polar coordinate system. Using the mosaicking methodology described in the Section 3.1, as well as ancillary in situ temperature data provided by the available AWS network, four different composite products are then generated: the VMI, the Hail product, the precipitation type and the SR estimation. Finally, such products are transferred via ftp protocol to the project website (https://www.radarmeteo.uniparthenope.it/project.html, accessed on 1 February 2020) for end-user visualization.

4.2. Hailstorm Event on 1 August 2020

This paragraph presents an example of the application of the X-band radar-based POH product developed in this work, related to the hailstorm event that occurred in Irpinia (in the inland sector of Campania region) on 1 August 2020. We introduce the discussion of this case study by illustrating the synoptic and mesoscale scenarios. Figure 10a shows the 300 hPa geopotential height field (hereafter, Z300) and the height of 1.5 Potential Vorticity (hereafter, PV) at 12:00 UTC. From the analysis of Z300 topography, it is easy to recognize an upper low level in southern Italy, which bounds the eastern limits of a ridge affecting the Central Mediterranean area. This cyclonic area is clearly marked by a negative anomaly of the height of 1.5 PV, which results in a positive upper-level PV anomaly. It is widely accepted that a maximum of PV in the upper level of the troposphere leads to a deformation in the vertical distribution of vorticity and potential temperature and to the production of vertical motion. A further incentive to the convection was given by the diurnal sea breeze, which advected moist and warm air masses in the inland sectors of Campania Region, causing the genesis of a low-level wind convergence line (Figure 10b). In light of this analysis, the synoptic and mesoscale environments were very favorable to the development of severe convective cells.
Figure 11 presents a sequence of radar-based products (the VMI in the left panels and the Hail Product in the right ones), showing the evolution of the thunderstorm event responsible for hail precipitation in Irpinia. The convective cell left the first signature on the radar composite of the CARMEN project at 12:40 UTC. The cell developed very close to the Trevico radar site (i.e., in the eastern sector of Irpinia territory) and then moved westward. In the next 60 min, it grew both in the horizontal and vertical directions and it widened its range of action. At 13:40 UTC, it affected a small segment of the A16 highway (between the Montemiletto and Scampitella passes), as revealed by Figure 11a. At this stage, the convective system presented a relevant hail core, being characterized by VMI values greater than 50 dBZ and by EchoTOP values up to 9 km. In Figure 11b, the areas where hail is expected on the ground (i.e., where the POH index is above the warning threshold, which is 79%) are highlighted in magenta, while areas where hail is not expected are marked in green. Subsequently (14:00 UTC), the cell continued to move in the western/northwestern direction, showing two different and very strong hail cores (Figure 11c,d): one is located on the A16 highway, near to Montemiletto pass, the other one a few kilometers to the southeast. The EchoTOP, at this stage, was about 8 km, whereas the POH was between 90% and 100%. At 14:20 UTC, the thunderstorm affected the Montemiletto pass (Figure 11e,f) and exhibited only one distinct hail core, with POH values again up to 100%. In the hail core, VMI values greater than 60 dBZ were detected, whereas the EchoTOP was quite stable around 9 km. Twenty minutes later (Figure 11g,h), the hail precipitation still affected a small section of A16 (a few kilometers south-western of Monte- miletto pass). Subsequently, the most severe portion of hail core turned away from the A16 highway; the convective cell, in fact, moved further westward, affecting the Partenio mountains.
By a simple analysis of the radar products sketched in Figure 11, it appears that the X-band composite developed in the framework of the CARMEN project was able to track the thunderstorm movement and to reliably identify its potential in terms of hailfall production. After being properly handled and interpreted by weather forecasters’ staff, the real-time information about POH was used by ASPI to release an issue for hail precipitation through variable message signs along the A16 segment between Montemiletto and Scampitella.
According to the news provided by local newspapers and photographic reports collected by volunteers, the hailstorm caused relevant damages to plants, crops, buildings and roads [68]. Due to the great losses experienced in the agricultural industry, the municipality of Montemiletto declared a state of natural disaster on 2 August 2020 [69].

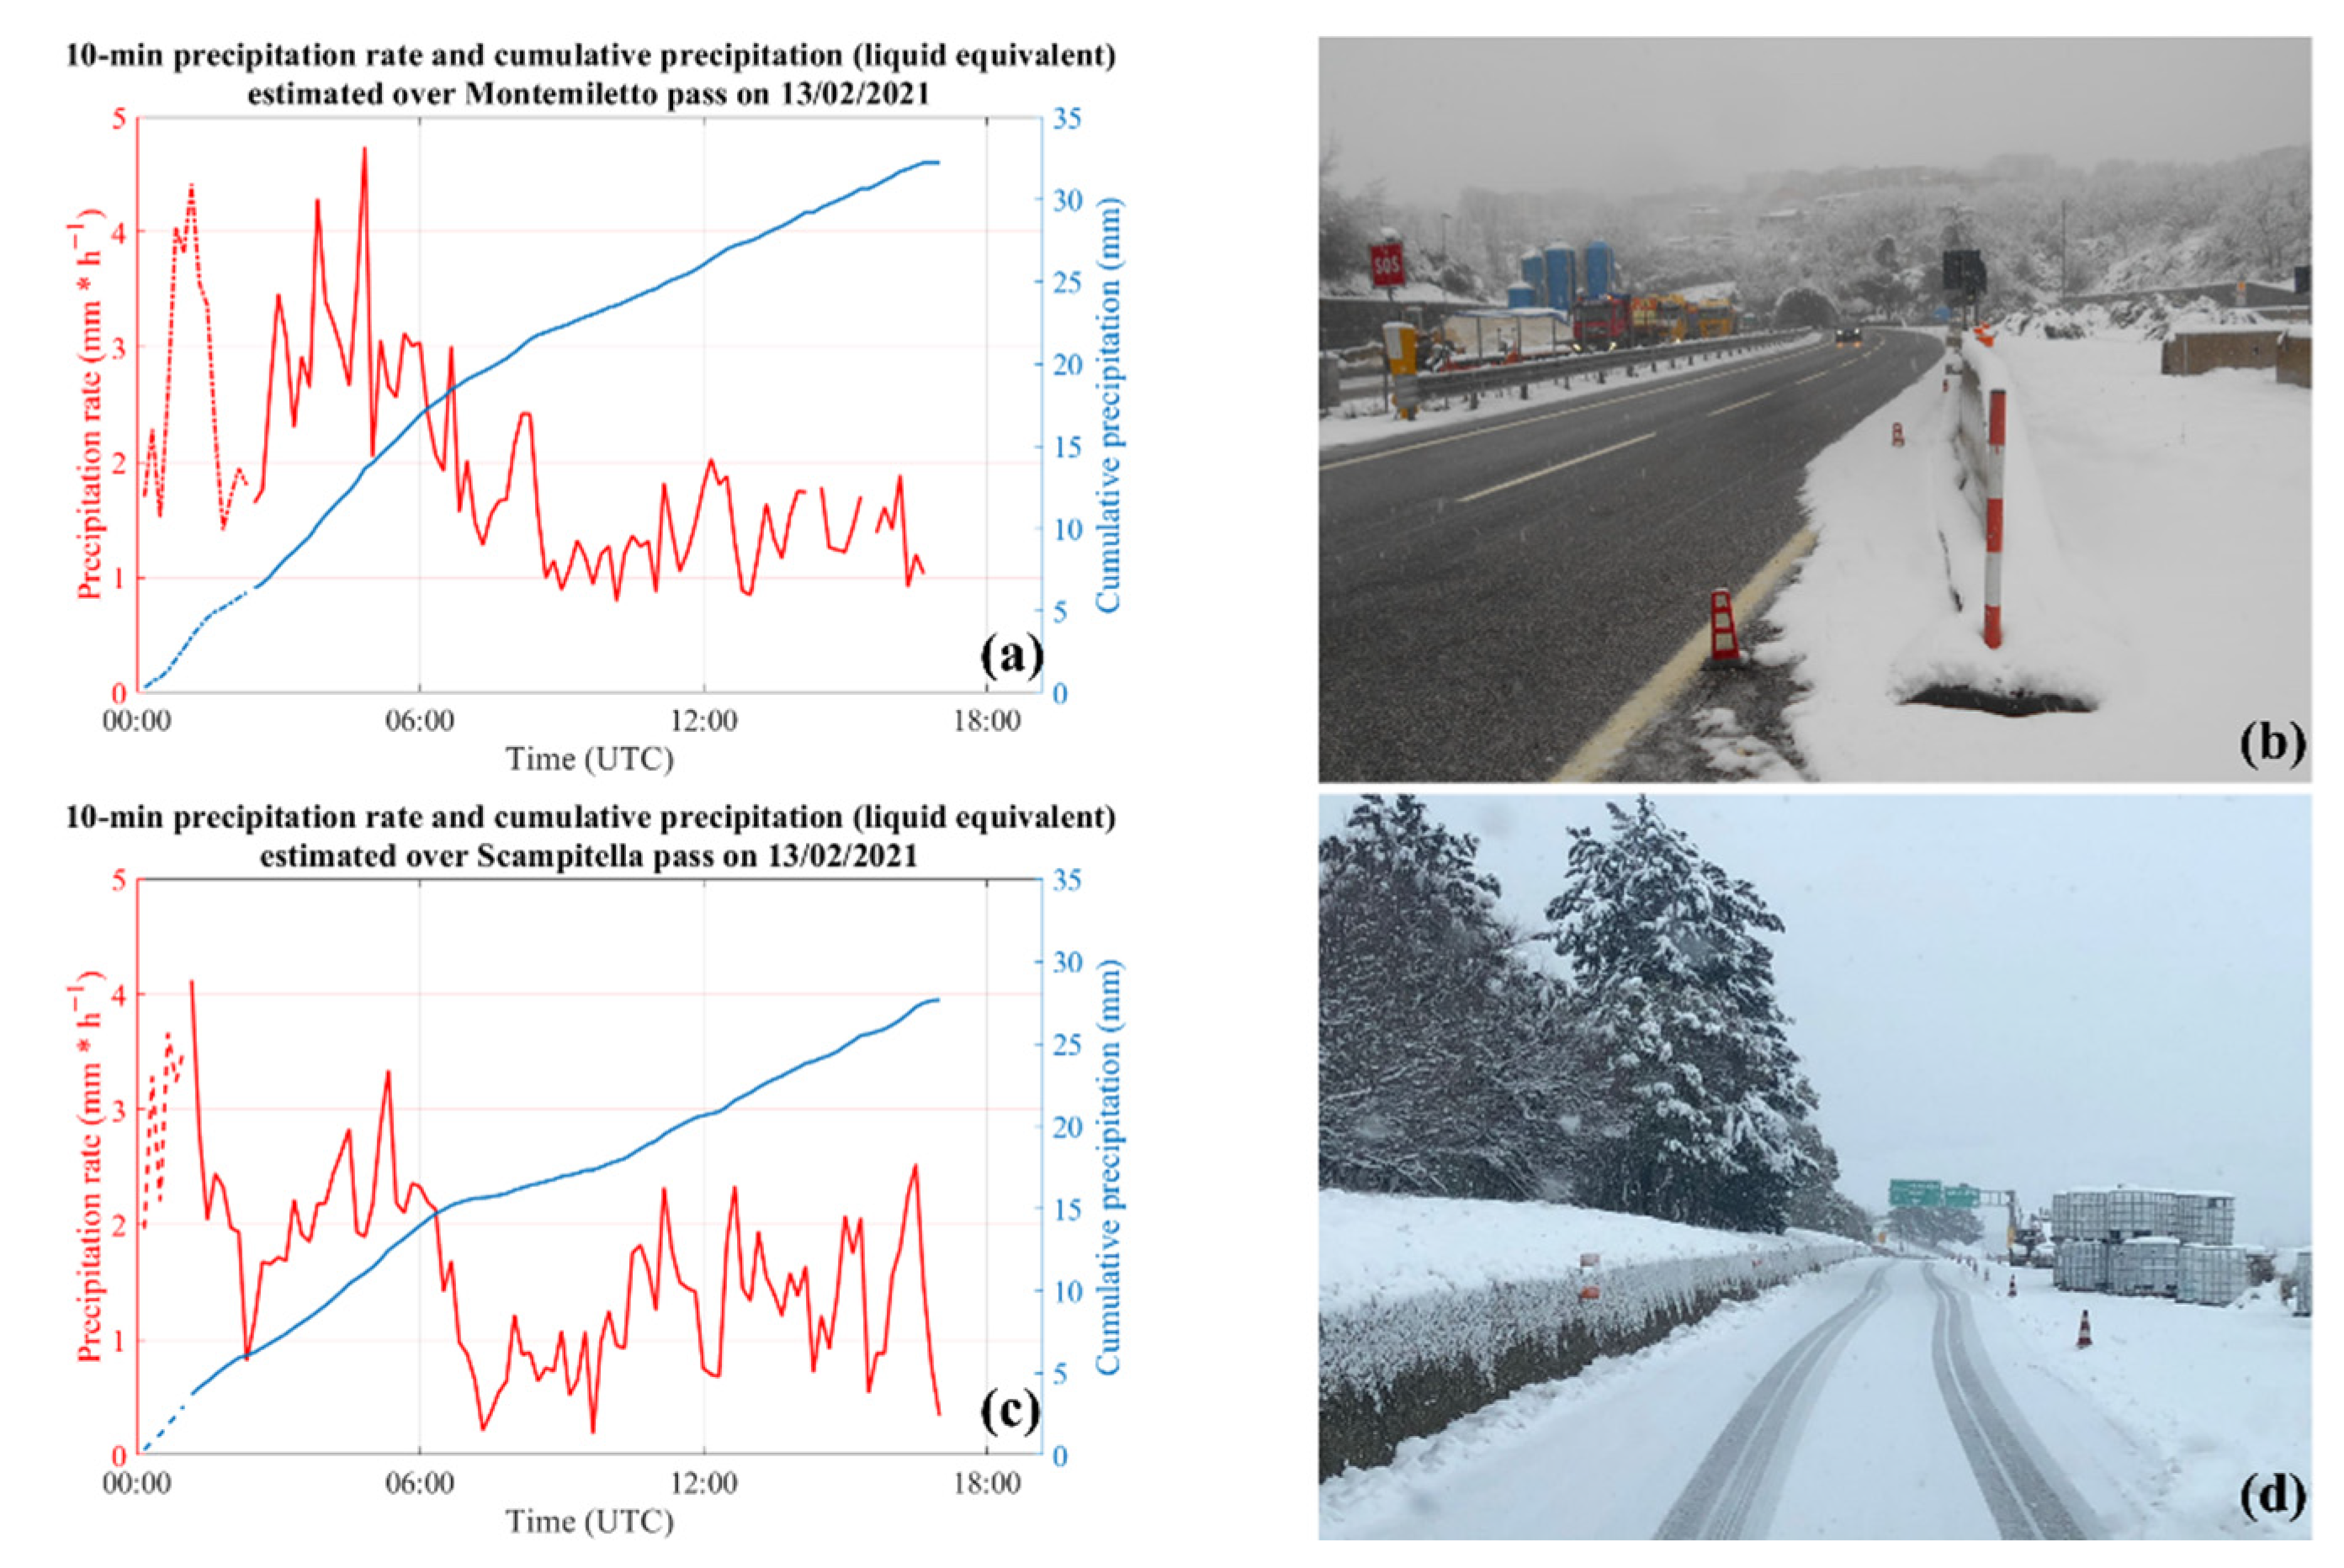
4.3. Snowfall Event on 13 February 2021

In this subsection, we offer an example of application of precipitation type and radar-based snowfall estimation products, related to the winter weather event that occurred in the Campania region on 13 February 2021.
The synoptic scenario that triggered this event can be considered one of the main large-scale types associated with snow occurrence in the inland sector of the study area [17]. As clearly highlighted by Figure 12a, the Central Mediterranean basins were affected by a low-pressure area, embedded in a wide trough located over central and eastern Europe. This cyclonic area, well-structured over the entire tropospheric column, was responsible for a strong baroclinicity, resulting in a veering wind and in a warm air advection in the middle troposphere. More specifically, from surface up to 850 hPa isobaric level, north-eastern winds were observed, associated with cold air (850 hPa temperature were between −2 and −4 °C, according to Figure 12a). At lower pressure levels, a relatively warm southwestern flow advected very moist air masses coming from the Tyrrhenian Sea, as revealed by Figure 12b, which shows the 700 hPa winds (as green vectors) and temperature advection (blue and red contours). This scenario results in the passage over the study area of a warm front, which caused a precipitation event that lasted about 18 h (from early night to late afternoon).
The baroclinic conditions created a very favorable environment for snowfall in Irpinia territory: at the end of the event, snow amounts ranging between 20 and 30 cm were recorded at the passes of the A16 highway (Scampitella, Montemiletto and Monteforte Irpino). According to local reports and AWS data, snow was also observed at lower altitudes (up to 150 m asl in the early morning). During this event, the CARMEN project products supported the maintenance actions of ASPI, consisting in snow plowing and salt spreading operations over an A16 highway segment of about 90 km, in order to prevent traffic congestion and car accidents.
Figure 13 shows the 10 min time series of H0°C, H1°C and H2°C estimated through the real time T data provided by the AWS in the four sub-regions (A, B, C and D) introduced in Section 3.3. A simple qualitative inspection of the four panels of Figure 13 allows detection of some relevant differences among the sub-regions, reflecting the prominent role exerted by local orography in modeling the low troposphere vertical temperature profile, depending on the synoptic scenario as well as on low-level winds. In the early night hours, the middle-tropospheric warm advection also affected the top of the planetary boundary layer and, therefore, the H0°C was relatively high (especially in sector B and D). Subsequently, the change in wind direction determined a drop in temperature and the start of the snow event. More specifically, in sector B a sudden decrease in H0°C occurred after 02:30 UTC and the snow limit ranged between 350 and 450 m asl, depending on precipitation rate, until the late afternoon. In the sector D, the impact of cold air advection in the low troposphere was mitigated by local orographic features, (i.e., this area is in a leeward location relative to north-eastern winds), and it became remarkable only after 14:00 UTC, when the H0°C declined to about 600 m asl. However, the snow limit remained well above the altitude of the A30 highway. In the northern sectors of the study region (A and C), the impact of nocturnal warm air advection was less relevant. In these areas, the H0°C drops below 600 m asl from 03:00 UTC (sub-region C) and from 05:00 UTC (sub-region A), respectively. In sector C, a further decrease in H0°C up to about 200 m asl was observed in the early morning, due to the combining effect of the low troposphere cold advection and of the formation of a cold pool near the surface (where relatively stable atmospheric conditions were observed during the night). In both sub-regions, the H0°C remained below 600 m asl until the end of precipitation event, although in sector B a warming of near-surface atmospheric levels occurred from 09:00 UTC.
Figure 14 presents the precipitation type product estimated in different temporal moments of the 13 February 2021 event. Following the criteria explained in Section 3.3, each radar composite grid was categorized as rain (in green), mixed (in yellow) and snow (in red). The snowfall precipitation started around 01:10 UTC and, initially, it was confined to the eastern sector of the A16 highway (Figure 14a), in the proximity of Scampitella pass (which is marked as a filled-in black diamond). In the next two hours, as a result of the lowering of H0°C in both B and C sub-regions, the snowfall also affected the area of Montemiletto and Monteforte Irpino passes (highlighted as filled-in black squares and circles, respectively), as revealed by Figure 14b. The most critical conditions occurred between 05:00 and 07:00 UTC, when snowfall was detected and observed over a large part of the A16 highway between Monteforte Irpino and Candela (see Figure 14c, which refers to 05:20 UTC). During the morning hours, thanks to a slight warming of near-surface atmospheric layers occurred in the sub-region C, there was a relaxation of snow-related challenges, which were restricted to the neighborhood of the three passes and to the A16 segment between Scampitella pass and Candela (see Figure 14d). A new temporary worsening of conditions was observed during the afternoon, due to a further decrease in H0°C. It is very easy to note that no snowfall precipitation was detected (and truly observed) in the other two motorways of interest (A1 and A30).
Using the information about the hydrometeor type, for each radar composite grid cell a real time estimation of precipitation rate was performed. More specifically, considering a determinate grid cell of coordinates (x, y, H), the VMI product observed at a certain time t was converted into SR using the coefficient a6 = 0 0.0412 and b6 = 0.6452 [63] discussed in Section 3.4. Otherwise, when “rain” or “mixed” precipitation is estimated, we used a power-law relationship identical to Equation (2). More specifically, in “rain” conditions we set the coefficient ar = 128.2 and br = 1.67 [21], whereas for “mixed” precipitation the power-law coefficients were linearly interpolated between the values used for “snow” and “rain” [70].
Figure 15 shows two examples of precipitation rate estimates, related to Montemiletto (a) and Scampitella (c) passes. In particular, the precipitation rate estimates are shown in the form of a 10 min time series covering the period from 00:10 to 17:00 UTC of 13 February 2021. We use a different line style to indicate the precipitation type, i.e., a solid line for snow, dashed line for mixed and a dashed and dotted line for rain. To generate the precipitation rate estimates sketched in Figure 15, we selected the radar composite grid cells that are within 1 km from the site of interest; among these grid cells, we selected the one with the highest precipitation rate value.
Moreover, the radar-based precipitation estimates are also presented in terms of cumulative data over the considered time interval (blue lines in Figure 15a,c). Different line styles were also used in this case to highlight the observed precipitation type. A close inspection of the two series reveals that they have a similar behavior. The transition from rain (or mixed precipitation) to snow occurred at around 01:10 UTC in Scampitella and around 02:50 UTC in Montemiletto pass. The highest precipitation rate value (up to 4.5 mm∙h−1) was observed during the night; subsequently, the SR decreases and ranges between 1.0 and 2.0 mm∙h−1 up to the late afternoon. The total liquid equivalent precipitation amounts were 32.2 and 27.6 mm for Montemiletto and Scampitella sites, respectively. These data are qualitatively in agreement with the recorded amount of new snow, which, at the end of precipitation event, ranged between 25 and 30 at both passes according to the information provided by ASPI (Figure 15b,d). Unfortunately, due to the unavailability of in situ high time resolution nivometric data and/or affordable snowfall rate measurements, we were not able to perform a systematic and quantitative evaluation of radar-based estimates.

5. Conclusions

In this work, we described the research activities that were carried out in the framework of the CARMEN project, in order to support the motorway system. Using the horizontal reflectivity measurements provided by two X-band single-polarization systems, as well as conventional meteorological observations, developed different tools for monitoring precipitation events mainly focused on the detection and estimates of hail and snow events. The design and the test of these meteorological products were supported by a cross validation with ground observations and weather reports ([18,47]). The discussion of two case studies, related to a summer hailstorm and to a winter precipitation event, demonstrated the usefulness of X-band radars and their ability to provide new and updated information about precipitation type and intensity that give a relevant support to the highway maintenance operations.
In the light of the experiences and the results of the CARMEN project, the development of a network of X-band radars produces relevant benefits to the diagnosis of weather conditions, especially in contexts characterized by a complex orography, which may be not adequately surveilled by more conventional weather radars belonging to national institutional network. From the stakeholders’ perspective, the new meteorological tools implemented in the CARMEN project allow improvement of the road-maintenance operations and infrastructure. During winter precipitation events, they played a relevant role in tactical decision-making and guided the action of conservative maintenance operations that anticipate the incoming snowfall. For example, at the onset of a snowstorm, the CARMEN products supported the maintenance managers and supervisors in deciding when to start sanding and plowing, what specific routes and sequences to follow and, eventually, how much chemical agent to apply. In most conventional approaches, these maintenance decision problems are highly empirical and they are not adequately sustained by high space and time resolution monitoring of weather conditions and, in particular, of solid precipitation events (hail and snow). The main advantages for stakeholders are not limited to the optimization of maintenance operations but they also involve the enhancement of traffic, incident and emergency management. These benefits result in resource and personnel cost savings and, more importantly, in improving safety on highways and preserving human lives. However, it is important to highlight that the stakeholder involved in our project, i.e., the ASPI company, gave us only qualitative feedback about the impact of the CARMEN project outcomes on their activities. A solid quantitative evaluation of this aspect is left for a future work.
Moreover, it is worth highlighting that the added-value introduced by the results of the CARMEN project also lies in the improvement of solid precipitation events estimation. In Campania Region and, more generally, in the Italian territory, the operational monitoring network of precipitation is not adequately equipped to provide reliable quantitative real-time information about snowfall rate and amount. This serious lack has relevant adverse repercussions on many fields, from the climatological to the hydrological ones; it poses, in fact, an important obstacle to studies targeted to analyze the past variability of snowfall events and their relationship with climate changes as well as to a solid evaluation of the hydrological cycle, especially in mountainous area. In this respect, the introduction of new snowfall estimators, based on X-band radar measurements, may bring a relevant contribution to fill this gap.
It should be pointed out that the methodologies used in this work can be easily exported in other contexts. We refer, to be more specific, to the approaches for the training and validation of algorithms for hail detection and snowfall rate estimation, which relies on the use of in situ data collected in the specific area of interest that can be used as ground truth. The results of our study cannot be aseptically used in other contexts, instead. For example, the VLD threshold (2.4 g∙m−3) found in our study may be not valid in other areas, for both climatic and geographical reasons and, therefore, it should be properly tuned with an “ad hoc” research activity.
We hope that our work may act as stimulus for other similar research activities in the Italian territory, whose complex orography imposes a regionalization of the radar warning system for a solid precipitation monitoring and warning.
Future work should be primarily devoted to improving the performance of the developed meteorological products. In this respect, our main aims can be synthetized in the following key-points: (i) the design of a hail detection tool that incorporates additional information, such as the appearance of high reflectivity core above the melting layer; (ii) the test of a precipitation type product relying on thermo-hygrometric conditions observed within the planetary boundary layer, in order to strengthen its affordability in discriminating between liquid and solid precipitation; (iii) the enhancement of radar-based real time snowfall rate estimates through a real time calibration involving disdrometric measurements, following the strategy proposed by [60]. The achievement of this goal presupposes the establishment, in the study areas, of a laser-disdrometer network, as well as the deployment of ultrasonic snow depth sensors in strategic sites (such as the A16 highway passes).
Some additional efforts will be dedicated to the investigation of alternative and more robust radar composite methodology, in order to better resolve the precipitation dynamics at local scales. In this respect, in our future works we will consider the possibility to apply some recent methods to increase the spatial resolution of X-band measurements involved in the CARMEN project, based on the deep learning approach. As an example, in [71] a very innovative nonlocal residual network on the basis of a convolutional neural network for increased weather radar image resolution has been proposed.

Author Contributions

Conceptualization, V.C., V.M. and G.B.; methodology, V.C. and V.M.; software, A.G. and V.M.; validation, V.C., V.M. and C.A.; formal analysis, V.C. and V.M.; investigation, V.C. and V.M.; resources, G.B.; data curation, V.C.; writing—original draft preparation, V.C.; writing—review and editing, V.M., C.D.V., C.A., G.F. and G.B.; supervision, G.B. and G.F.; project administration, G.B. and G.F.; funding acquisition, G.B. and G.F. All authors have read and agreed to the published version of the manuscript.

Funding

This research was funded by AUTOSTRADE PER L’ITALIA (S.p.A.), Contract SAP n.81004904, technical and scientific consulting contract with “Autostrade s.p.a.” focused on the “Optimization of nowcasting methods based on X-band weather radar” and to the “Provision of a service of weather forecasting to support the management of highway traffic on the A1 section from Caianello to Naples, on the A30 from Caserta to Salerno and on the A16 section from Naples to Candela”.

Data Availability Statement

The meteorological products developed in the framework of CARMEN project are publicly available in real time via the following website: https://www.radarmeteo.uniparthenope.it/index.html, accessed on 1 February 2022. The data that support the findings of this study are available from the corresponding author, upon reasonable request.

Acknowledgments

The authors of this paper are thankful to Gennaro Bianco, Arturo De Alteriis, Massimo De Stefano and Giovanni Zambardino for the valuable technical support.

Conflicts of Interest

The authors declare no conflict of interest. The funders had no role in the design of the study; in the collection, analyses, or interpretation of data; in the writing of the manuscript, or in the decision to publish the results.

References

  1. Nysten, E.; King, R.H. The Use of Weather Radar Data in Road Weather Services: Present and Future Needs. In Weather Radar Networking; Collier, C.G., Chapuis, M., Eds.; Springer: Dordrecht, The Netherlands, 1990. [Google Scholar]
  2. Bazlova, T.; Bocharnikov, N.; Vinogradov, M.; Solonin, A.; Iakimainen, N. Road Weather Forecasting. In Proceedings of the Poster Presentation of 7th European Conference on Severe Storms, Scandic Marina Congress Center, Helsinki, Finland, 3–7 June 2013. [Google Scholar]
  3. Jaroszweski, D.; McNamara, T. The influence of rainfall on road accidents in urban areas: A weather radar approach. Travel Behav. Soc. 2014, 1, 15–21. [Google Scholar] [CrossRef] [Green Version]
  4. Kangas, M.; Heikinheimo, M.; Hippi, M. RoadSurf: A modelling system for predicting road weather and road surface conditions. Meteorol. Appl. 2015, 22, 544–553. [Google Scholar] [CrossRef]
  5. Frei, T.; Von Grünigen, S.; Willemse, S. Economic benefit of meteorology in the Swiss road transportation sector. Meteorol. Appl. 2014, 21, 294–300. [Google Scholar] [CrossRef]
  6. Bringi, V.N.; Chandrasekar, V. Polarimetric Doppler Weather Radar: Principles and Applications; Cambridge University Press: Cambridge, UK, 2001; p. 662. [Google Scholar]
  7. Chandrasekar, V.; Chen, H.; Philips, B. Principles of high-resolution radar network for hazard mitigation and disaster management in an urban environment. J. Meteorol. Soc. Jpn. Ser. II 2018, 96, 119–139. [Google Scholar] [CrossRef] [Green Version]
  8. WMO. Assess the Current and Potential Capabilities of Weather Radars for the Use in WMO Integrated Global Observing System (WIGOS). In Proceedings of the Joint Meeting of the CIMO Expert Team on Remote Sensing Upper-Air Technology and Techniques and CBS Expert Team on Surface Based Remote Sensing, Geneva, Switzerland, 23–27 November 2009. [Google Scholar]
  9. Van de Beek, C.Z.; Leijnse, H.; Stricker, J.N.M.; Uijlenhoet, R.; Russchenberg, H.W.J. Performance of high-resolution X-band radar for rainfall measurement in The Netherlands. Hydrol. Earth Syst. Sci. 2010, 14, 205–221. [Google Scholar] [CrossRef] [Green Version]
  10. Shah, S.; Notarpietro, R.; Branca, M. Storm Identification, Tracking and Forecasting Using High-Resolution Images of Short-Range X-Band Radar. Atmosphere 2015, 6, 579–606. [Google Scholar] [CrossRef] [Green Version]
  11. Capozzi, V.; Montopoli, M.; Mazzarella, V.; Marra, A.C.; Roberto, N.; Panegrossi, G.; Dietrich, S.; Budillon, G. Multi-Variable Classification Approach for the Detection of Lightning Activity Using a Low-Cost and Portable X Band Radar. Remote Sens. 2018, 10, 1797. [Google Scholar] [CrossRef] [Green Version]
  12. Chen, H.; Lim, S.; Chandrasekar, V.; Jang, B.J. Urban hydrological applications of dual-polarization X-band radar: Case study in Korea. J. Hydrol. Eng. 2017, 22, E5016001. [Google Scholar] [CrossRef]
  13. Yoon, S.S.; Lim, S.H. Analyzing the Application of X-Band Radar for Improving Rainfall Observation and Flood Forecasting in Yeongdong, South Korea. Remote Sens. 2021, 14, 43. [Google Scholar] [CrossRef]
  14. Allegretti, M.; Bertoldo, S.; Prato, A.; Lucianaz, C.; Rorato, O.; Notarpietro, R.; Gabella, M. X-band mini radar for observing and monitoring rainfall events. Atmos. Clim. Sci. 2012, 2, 290–297. [Google Scholar] [CrossRef]
  15. Bendix, J.; Fries, A.; Zarate, J.; Trachte, K.; Rollenbeck, R.; Pucha-Cofrep, F.; Paladines, R.; Palacios, I.; Orellana, J.; Onate-Valdivieso, F.; et al. RadarNetSur first weather radar network in tropical high mountains. Bull. Amer. Meteor. Soc. 2016, 98, 1235–1254. [Google Scholar] [CrossRef]
  16. Antonini, A.; Melani, S.; Corongiu, M.; Romanelli, S.; Mazza, A.; Ortolani, A.; Gozzini, B. On the implementation of a regional X-band weather radar network. Atmosphere 2017, 8, 25. [Google Scholar] [CrossRef] [Green Version]
  17. Cifelli, R.; Chandrasekar, V.; Chen, H.; Johnson, L.E. High resolution radar quantitative precipitation estimation in the San Francisco Bay Area: Rainfall monitoring for the urban environment. J. Meteorol. Soc. Jpn. 2018, 96, 141–155. [Google Scholar] [CrossRef] [Green Version]
  18. Shakti, P.C.; Nakatani, T.; Misumi, R. The Role of the Spatial Distribution of Radar Rainfall on Hydrological Modeling for an Urbanized River Basin in Japan. Water 2019, 11, 1703. [Google Scholar]
  19. Bruno, G.; Pignone, F.; Silvestro, F.; Gabellani, S.; Schiavi, F.; Rebora, N.; Falzacappa, M. Performing hydrological monitoring at a national scale by exploiting rain-gauge and radar networks: The Italian case. Atmosphere 2021, 12, 771. [Google Scholar] [CrossRef]
  20. Capozzi, V.; Picciotti, E.; Mazzarella, V.; Marzano, F.S.; Budillon, G. Fuzzy-logic detection and probability of hail exploiting short-range X-band weather radar. Atmos. Res. 2018, 201, 17–33. [Google Scholar] [CrossRef]
  21. Capozzi, V.; Picciotti, E.; Budillon, G.; Marzano, F.S. X-Band Weather Radar Monitoring of Precipitation Fields in Naples Urban Areas: Data Quality, Comparison and Analysis. In Proceedings of the ERAD 2014-8th European Conference on Radar in Meteorology and Hydrology, Garmisch-Partenkirchen, Germany, 1–5 September 2014. [Google Scholar]
  22. Vulpiani, G.; Montopoli, M.; Passeri, L.; Gioia, A.; Giordano, P.; Marzano, F. On the Use of Dual-Polarized C-Band Radar for Operational Rainfall Retrieval in Mountainous Areas. J. Appl. Meteorol. Climatol. 2012, 51, 405–425. [Google Scholar] [CrossRef]
  23. Capozzi, V.; Annella, C.; Montopoli, M.; Adirosi, E.; Fusco, G.; Budillon, G. Influence of Wind-Induced Effects on Laser Disdrometer Measurements: Analysis and Compensation Strategies. Remote Sens. 2021, 13, 3028. [Google Scholar] [CrossRef]
  24. Shepard, D. A Two-Dimensional Interpolation Function for Irregularly-Spaced Data. In Proceedings of the 1968 23rd ACM National Conference, 1 January 1968; pp. 517–524. [Google Scholar]
  25. Zhang, J.; Howard, K.; Xia, W.; Langston, C.; Wang, S.; Qin, Y. Three-Dimensional Highresolution National Radar Mosaic. In Proceedings of the 11th Conference on Aviation, Range, and Aerospace, Meteorology, Hyannis, MA, USA, 4–8 October 2004. [Google Scholar]
  26. Fornasiero, A.; Alberoni, P.P.; Amorati, R.; Marsigli, C. Improving the Radar Data Mosaicking Procedure by Means of a Quality Descriptor. In Proceedings of the 4th European Conference on Radar in Meteorology and Hydrology, Barcelona, Spain, 18–22 September 2006; pp. 378–381. [Google Scholar]
  27. Einfalt, T.; Lobbrecht, A.; Leung, K.; Lempio, G. Preparation and evaluation of a Dutch-German radar composite to enhance precipitation information in border areas. J. Hydrol. Eng. 2013, 18, 279–284. [Google Scholar] [CrossRef] [Green Version]
  28. Barbieri, S.; Di Fabio, S.; Lidori, R.; Rossi, F.L.; Marzano, F.S.; Picciotti, E. Mosaicking Weather Radar Retrievals from an Operational Heterogeneous Network at C and X Band for Precipitation Monitoring in Italian Central Apennines. Remote Sens. 2022, 14, 248. [Google Scholar] [CrossRef]
  29. Aydin, K.; Seliga, T.A.; Balaji, V. Remote sensing of hail with a dual-linear polarization radar. J. Clim. Appl. Meteor. 1986, 25, 1475–1484. [Google Scholar] [CrossRef] [Green Version]
  30. Straka, J.M.; Zrnić, D.S.; Ryzhkov, A.V. Bulk hydrometeor classification and quantification using polarimetric radar data: Synthesis of relations. J. Appl. Meteorol. 2000, 39, 1341–1372. [Google Scholar] [CrossRef]
  31. Marzano, F.S.; Scaranari, D.; Vulpiani, G. Supervised fuzzy-logic classification of hydrometeors using C-band weather radars. IEEE Trans. Geosci. Remote Sens. 2007, 45, 3784–3799. [Google Scholar] [CrossRef]
  32. Picciotti, E.; Marzano, F.S.; Anagnostou, E.N.; Kalogiros, J.; Fessas, Y.; Volpi, A.; Stella, J. Coupling X-band dual-polarized mini-radars and hydro-meteorological forecast models: The HYDRORAD project. Nat. Hazards Earth Syst. Sci. 2013, 13, 1229–1241. [Google Scholar] [CrossRef] [Green Version]
  33. Chandrasekar, V.; Keränen, R.; Lim, S.; Moisseev, D. Recent advances in classification of observations from dual polarization weather radars. Atmos. Res. 2013, 119, 97–111. [Google Scholar] [CrossRef]
  34. Bechini, R.; Chandrasekar, V. A semisupervised robust hydrometeor classification method for dual-polarization radar applications. J. Atmos. Ocean. Technol. 2015, 32, 22–47. [Google Scholar] [CrossRef]
  35. Vulpiani, G.; Baldini, L.; Roberto, N. Characterization of Mediterranean hail-bearing storms using an operational polarimetric X-band radar. Atmos. Meas. Tech. 2015, 8, 4681–4698. [Google Scholar] [CrossRef] [Green Version]
  36. Holleman, I. Hail Detection Using Single-Polarization Radar. Ministerie van Verkeer en Waterstaat, Koninklijk Nederlands Meteorologisch Instituut. 2001. Available online: https://www.knmi.nl/kennis-en-datacentrum/publicatie/hail-detection-using-single-polarization-radar (accessed on 15 January 2022).
  37. Skripniková, K.; Řezáčová, D. Radar-based hail detection. Atmos. Res. 2014, 144, 175–185. [Google Scholar] [CrossRef]
  38. Geotis, S.G. Some radar measurements of hailstorms. J. Appl. Meteorol. 1963, 2, 270–275. [Google Scholar] [CrossRef] [Green Version]
  39. Waldvogel, A.; Federer, B.; Grimm, P. Criteria for the detection of hail cells. J. Appl. Meteorol. Climatol. 1979, 18, 1521–1525. [Google Scholar] [CrossRef] [Green Version]
  40. Auer, A.H. Hail recognition through the combined use of radar reflectivity and cloud-top temperatures. Mon. Weather Rev. 1994, 122, 2218–2221. [Google Scholar] [CrossRef] [Green Version]
  41. Witt, A.; Eilts, M.D.; Stumpf, G.J.; Johnson, J.T.; Mitchell, E.D.; Thomas, K.W. An enhanced hail detection algorithm for the WSR-88D. Weather Forecast 1998, 13, 286–303. [Google Scholar] [CrossRef] [Green Version]
  42. Kunz, M.; Kugel, P.I. Detection of hail signatures from single-polarization C-band radar reflectivity. Atmos. Res. 2015, 153, 565–577. [Google Scholar] [CrossRef]
  43. Puskeiler, M.; Kunz, M.; Schmidberger, M. Hail statistics for Germany derived from single-polarization radar data. Atmos. Res. 2016, 178, 459–470. [Google Scholar] [CrossRef]
  44. Amburn, S.A.; Wolf, P.L. VIL density as a hail indicator. Weather Forecast. 1997, 12, 473–478. [Google Scholar] [CrossRef] [Green Version]
  45. Greene, D.R.; Clark, R.A. Vertically Integrated Liquid Water—A New Analysis Tool. Mon. Weather Rev. 1972, 100, 548–552. [Google Scholar] [CrossRef] [Green Version]
  46. Brimelow, J.C.; Reuter, G.W.; Bellon, A.; Hudak, D. A radar-based methodology for preparing a severe thunderstorm climatology in central Alberta. Atmos. Ocean 2004, 42, 13–22. [Google Scholar] [CrossRef] [Green Version]
  47. Delobbe, L.; Holleman, I. Uncertainties in radar echo top heights used for hail detection. Meterol. Appl. 2006, 13, 361–374. [Google Scholar] [CrossRef]
  48. Liu, H.; Chandrasekar, V. Classification of hydrometeors based on polarimetric radar measurements: Development of fuzzy logic and neuro-fuzzy systems, and in situ verification. J. Atmos. Ocean. Technol. 2000, 17, 140–164. [Google Scholar] [CrossRef]
  49. Lim, S.; Chandrasekar, V.; Bringi, V.N. Hydrometeor classification system using dual-polarization radar measurements: Model improvements and in situ verification. IEEE Trans. Geosci. Remote Sens. 2005, 43, 792–801. [Google Scholar] [CrossRef]
  50. Marzano, F.; Scaranari, D.; Montopoli, M.; Vulpiani, G. Supervised classification and estimation of hydrometeors from C-band dual-polarized radars: A Bayesian approach. IEEE Trans. Geosci. Remote Sens. 2008, 46, 85–98. [Google Scholar] [CrossRef]
  51. Olsen, A. Snow or Rain?—A Matter of Wet-Bulb Temperature. Master’s Thesis, Uppsala University, Uppsala, Sweden, 2003. [Google Scholar]
  52. Cazzuli, O.; Cremonini, R.; Grimaldelli, R.; Craveri, L. Monitoring Snowfall Events in Lombardia, Italy, by Specialized Observers Network and Advanced Remote Sensing Systems. In Proceedings of the International Snow Science Workshop Grenoble, Chamonix Mont-Blanc, France, 7–11 October 2013. [Google Scholar]
  53. Cremonini, R.; Bechini, R.; Campana, V.; Tomassone, L. Combined Use of Weather Radar and Limited Area Model for Wintertime Precipitation Type Discrimination. In Precipitation: Advances in Measurement, Estimation and Prediction; Michaelides, S., Ed.; Springer: Berlin/Heidelberg, Germany, 2008. [Google Scholar] [CrossRef]
  54. Baumgardt, D. Wintertime Cloud Microphysics Review; NWS Central Region: La Crosse, WI, USA, 1999. [Google Scholar]
  55. Capozzi, V.; Montopoli, M.; Bracci, A.; Adirosi, E.; Baldini, L.; Vulpiani, G.; Budillon, G. Retrieval of snow precipitation rate from polarimetric X-band radar measurements in Southern Italy Apennine mountains. Atmos. Res. 2020, 236, 104796. [Google Scholar] [CrossRef]
  56. Ryzhkov, A.V.; Zrnic, D.S. Polarimetric method for ice water content determination. J. Appl. Meteor. 1998, 37, 125–134. [Google Scholar] [CrossRef]
  57. Bechini, R.; Baldini, L.; Chandrasekar, V. Polarimetric radar observations in the ice region of precipitating clouds at C-band and X-band radar frequencies. J. Appl. Meteor. Climatol. 2013, 52, 1147–1169. [Google Scholar] [CrossRef]
  58. Bukovčić, P.; Ryzhkov, A.; Zrnić, D.; Zhang, G. Polarimetric radar relations for quantification of snow based on disdrometer data. J. Appl. Meteor. Climatol. 2018, 57, 103–120. [Google Scholar] [CrossRef]
  59. Allabakash, S.; Lim, S.; Jang, B.J. Melting layer detection and characterization based on range height indicator-quasi vertical profiles. Remote Sens. 2019, 11, 2848. [Google Scholar] [CrossRef] [Green Version]
  60. Bracci, A.; Baldini, L.; Roberto, N.; Adirosi, E.; Montopoli, M.; Scarchilli, C.; Grigioni, P.; Ciardini, V.; Levizzani, V.; Porcù, F. Quantitative Precipitation Estimation over Antarctica Using Different Ze-SR Relationships Based on Snowfall Classification Combining Ground Observations. Remote Sens. 2022, 14, 82. [Google Scholar] [CrossRef]
  61. Boucher, R.J.; Wieler, J.G. Radar determination of snowfall rate and accumulation. J. Clim. Appl. Meteor. 1985, 24, 68–73. [Google Scholar] [CrossRef] [Green Version]
  62. Fujiyoshi, Y.; Endoh, T.; Yamada, T.; Tsuboki, K.; Tachibana, Y.; Wakahama, G. Determination of a Z–R relationship for snowfall using a radar and sensitive snow gauges. J. Appl. Meteor. 1990, 29, 147–152. [Google Scholar] [CrossRef] [Green Version]
  63. Matrosov, S.Y.; Campbell, C.; Kingsmill, D.; Sukovich, E. Assessing snowfall rates from X-band Radar reflectivity measurements. J. Atmos. Ocean. Technol. 2009, 26, 2324–2339. [Google Scholar] [CrossRef] [Green Version]
  64. Falconi, M.T.; von Lerber, A.; Ori, D.; Marzano, F.S.; Moisseev, D. Snowfall retrieval at X, Ka and W bands: Consistency of backscattering and microphysical properties using BAECC ground-based measurements. Atmos. Meas. Tech. 2018, 11, 3059–3079. [Google Scholar] [CrossRef] [Green Version]
  65. Zawadzki, I.; Szyrmer, W.; Bell, C.; Fabry, F. Modeling of the melting layer. part III: The density effect. J. Atmos. Sci. 2005, 62, 3705–3723. [Google Scholar] [CrossRef]
  66. Brandes, E.A.; Ikeda, K.; Zhang, G.; Schönhuber, M.; Rasmussen, R.M. A statistical and physical description of hydrometeor distributions in Colorado snowstorms using a video disdrometer. J. Appl. Meteorol. Climatol. 2007, 46, 634–650. [Google Scholar] [CrossRef]
  67. Eumetrain. Available online: http://eumetrain.org/eport.html (accessed on 22 January 2022).
  68. Prima Tivvù. Available online: http://www.primativvu.it/chicchi-di-grandine-come-palle-da-ping-pong-si-contano-i-danni-nelle-campagne-tra-irpinia-e-sannio/ (accessed on 10 January 2022).
  69. Irpina News. Available online: https://www.irpinianews.it/grandinate-e-maltempo-anche-montemiletto-chiede-lo-stato-di-calamita-naturale/ (accessed on 10 January 2022).
  70. Koistinen, J.; Michelson, D.B.; Hohti, H.; Peura, M. Operational Measurement of Precipitation in Cold Climates. In Weather Radar. Physics of Earth and Space Environments; Meischner, P., Ed.; Springer: Berlin/Heidelberg, Germany, 2004. [Google Scholar]
  71. Yuan, H.; Zeng, Q.; He, J. Weather Radar Image Superresolution Using a Nonlocal Residual Network. J. Math. 2021, 2021, 4483907. [Google Scholar] [CrossRef]
Figure 1. Map of study area, including the motorways of interest for the CARMEN project, i.e., the A1 highway (from Caianello to Naples), the A16 highway (from Naples to Candela) and the A30 highway (from Caserta to Mercato San Severino). The three road sections are shown as yellow, green and red lines, respectively. The magenta markers indicate the three passes located along the A16 highway, i.e., Monteforte Irpino (619 m asl, filled-in circle), Montemiletto (502 m asl, filled-in square) and Scampitella (670 m asl, filled-in diamond). The black arrows indicate the main orographic features of the study area (Matese, Taburno-Camposauro, Partenio and Picentini). The highways not involved in the CARMEN project are marked as blue lines.
Remotesensing 14 02221 g001
Figure 2. X-band radar network operating in the Campania Region in the framework of the CARMEN project. The filled-in red circles indicate the position of the Naples and Trevico radars. A photo of the installation facilities of the two systems, both named WR-10X, is provided by the small pictures on the right side of the figure. The coverage of both radars is highlighted by the transparent circles. Image credits: © Google Earth, Data Sio, NOAA, U.S. Navy, NGA, GEBCO.
Remotesensing 14 02221 g002
Figure 3. Schematic diagram of X-band weather radar processing for mosaicking generation. The process starts with the computing, for both the Naples and Trevico radar, of the Vertical Maximum Intensity product (upper panel). Subsequently, the VMI products, originally available in the native polar coordinate system, are remapped onto a cartesian grid, with a resolution of 500 × 500 m (middle panel). Finally, the composite product is obtained using the “maximum value” criterion (bottom panel).
Remotesensing 14 02221 g003
Figure 4. Reflectivity field, expressed in terms of Vertical Maximum Intensity (VMI) observed by the Naples (a) and Trevico weather radars (b) on 13 February 2021 (03:20 UTC). In panel (c), the composite product, obtained after a remapping of the VMI field on a regular cartesian grid, is shown. The reflectivity is expressed in dBZ and is color-coded according to the vertical bar.
Remotesensing 14 02221 g004
Figure 5. Scatter diagram of VIL (kg∙m−2) versus EchoTOP (m) for the 53 thunderstorm events analyzed in [20]. The hail-producing and the non-hail-producing convective events are marked as filled-in blue and red circles, respectively. Values of VLD (g∙m−3) are shown as black solid lines, labeled 2.0, 2.4 and 3.0.
Remotesensing 14 02221 g005
Figure 6. Map of the study area, including the four sub-regions (labeled as A, B, C and D) introduced in the design of the precipitation type algorithm. The limits of the sub-regions are bordered as a black line. The motorways of interest for the CARMEN project, i.e., A1, A16 and A30, are shown as yellow, green and red lines, respectively. The highways not involved in the CARMEN project are marked in blue, instead.
Remotesensing 14 02221 g006
Figure 7. Schematic diagram of precipitation type product generation. The process starts from the composite precipitation field (expressed in terms of vertical maximum intensity). If a determined grid cell is affected by precipitation, it is assigned to a precipitation type category (rain, mixed precipitation and snow) according to the vertical temperature profile estimated from in situ automatic weather station measurements for the four different sub-regions sketched in Figure 6.
Remotesensing 14 02221 g007
Figure 8. Comparison between measured (from Montevergine disdrometer) and estimated (from X-band radar composite) snowfall rate (in mm∙h−1) for three different events: (a) 29 January 2019 (from 05:00 to 22:00 UTC), (b) 30 January 2019 (from 14:00 to 23:50 UTC) and (c) 6 May 2019 (from 01:00 to 18:00 UTC). The nine radar-based algorithms tested in this study are marked by different colors according to the legends shown on each panel, whereas the measured snowfall rate is highlighted by a grey bar. The latter shows the variability of snowfall rate depending on the riming factor (unrimed: low side of the bar; heavily rimed: upper side of the bar).
Remotesensing 14 02221 g008
Figure 9. Real-time dataflow architecture of the CARMEN project X-band radar network.
Remotesensing 14 02221 g009
Figure 10. In the upper panel (a), the 300 hPa geopotential height (Z300) and the height of 1.5 Potential Vorticity (PV) fields on 1 August 2020, 12:00 UTC are presented. The Z300 (in dam) is shown as a cyan contour with an interval of 5 dam, whereas the height of 1.5 PV (in hPa) is sketched as a magenta contour every 100 hPa. In the bottom panel (b), for the same event, the surface winds, shown as green arrows, are shown. All fields are numerical model outputs and they have been retrieved from the European Centre for Medium Range Weather Forecast (ECMWF) archive, available through the EUMeTrain ePort Pro website [67].
Remotesensing 14 02221 g010
Figure 11. Sequence of images from the CARMEN project X-band radar composite showing the evolution of hailstorms that occurred in Irpinia on 1 August 2020. In the left panels (a,c,e,g), the Vertically Maximum Intensity (VMI) product obtained at 13:40 UTC (a), 14:00 UTC (c), 14:20 UTC (e) and 14:40 (g) is shown. In the right panels (b,d,f,h), the Hail Product determined from the Vertically Integrated Liquid Density (VLD) method is presented for the same times. The VMI is expressed in dBZ and is color coded according to the vertical bar. In the right panels, the areas where hail is likely to occur (i.e., where the POH index is above the warning threshold) are indicated in magenta, while the areas where hail is not expected (i.e., where the POH index is below the warning threshold) in green. The hailstorm affected a small sector of the A16 highway, including the Montemiletto pass (whose position is marked as a black filled-in square). The highways are marked as grey lines, whereas the black circles represent the maximum radar range for Naples and Trevico systems.
Remotesensing 14 02221 g011aRemotesensing 14 02221 g011b
Figure 12. In the upper panel (a), the 850 hPa temperature (in °C) and the sea level pressure (in hPa) fields on 13 February 2021, 12:00 UTC are presented. The 850 hPa temperature is shown as blue (negative values), red (positive values) and magenta (0 °C isotherm) contour with an interval of 2 °C, whereas the sea level pressure is sketched as a black contour with an interval of 2 hPa. In the bottom panel (b), for the same event, the 700 hPa winds, shown as green arrows, and the temperature advection (in °C) are shown. The temperature advection is expressed as blue (negative values) and red (positive values) contours with an interval of 2 °C. All fields are numerical model outputs and they were retrieved from the European Centre for Medium Range Weather Forecast (ECMWF) archive, available through the EUMeTrain ePort Pro website [67].
Remotesensing 14 02221 g012
Figure 13. Behavior in time of the altitude of 0 °C, 1 °C and 2 °C isotherms (H0°C, H1°C and H2°C, respectively) on 13 February 2021. The four panels (ad) show the H0°C (red line), H1°C (blue line) and H2°C (black line) estimates for the sub-regions A, B, C and D, respectively, introduced in Section 3.3. The information about H0°C, H1°C and H2°C have been retrieved in real time from AWS temperature data, which are available with a temporal resolution of 10 min. The time in x-axis is expressed as UTC.
Remotesensing 14 02221 g013
Figure 14. Precipitation type product estimated on 13 February 2021 at 02:00 UTC (a), 04:00 UTC (b), 05:20 UTC (c) and 10:40 UTC (d). Each radar composite grid cell is assigned to the rain (in green), mixed (in yellow) or snow (in red) precipitation categories according to the criteria illustrated in Section 3.3. The black markers indicate the three passes located along the A16 highway, i.e., Monteforte Irpino (619 m asl, filled-in circle), Montemiletto (502 m asl, filled-in square) and Scampitella (670 m asl, filled-in diamond). The highways are marked as grey lines, whereas the black circles represent the maximum radar range for the Naples and Trevico radar systems.
Remotesensing 14 02221 g014
Figure 15. The left panels show the 10 min time series of the radar-based precipitation rate (in mm ∙h−1, red line) and cumulative precipitation (in mm, blue line) estimated on 13 February 2021 (from 00:00 to 17:00 UTC) over the A16 highway Montemiletto (a) and Scampitella (c) passes. For both precipitation rate and cumulative precipitation, the line style indicates the precipitation type, i.e., the solid line corresponds to snow, the dashed line to mixed and the dashed and the dotted line to rain. In the right panels, photographic evidence of Montemiletto (b) and Scampitella (d) passes during the snowfall event is sketched. Both pictures are courtesy of Autostrade per l’Italia S.p.A.
Remotesensing 14 02221 g015
Table 1. Technical specifications of the WR-10X radar.
ParameterValue
Operating frequency9.4 GHz
Peak power10 kW
Pulse repetition frequency800 Hz
Sensitivity10 dBZ @25 km
Antenna typePencil beam (diameter 70 cm)
Antenna gain35/40 dB
Antenna speed20°/s
Maximum available range108 km
Azimut resolution
Range resolution450 m
Table 2. List of Automatic Weather Stations (AWS) adopted in the framework of the CARMEN project. For each station, the latitude (in degrees), the longitude (in degrees) and the height above sea level (in m) are shown. The AWS belong to institutional and local meteorological networks and provide temperature measurements with a time resolution of 10 min.
Station NameLatitudeLongitudeHeight asl
Pagani40.743426°N14.615167°E35
Battipaglia40.600588°N14.946136°E36
Salerno40.675131°N14.794200°E37
Nola40.924629°N14.529256°E42
Benevento41.131285°N14.774721°E153
Mercato San Severino40.786924°N14.761146°E154
Teano41.250783°N14.069845°E165
Campagna40.666176°N15.106880°E285
Avellino40.913988°N14.783368°E375
Fontanarosa41.010709°N15.020945°E508
Mercogliano40.919561°N14.737605°E512
Monteforte Irpino40.898491°N14.709000°E577
Casalbore41.233134°N15.006235°E590
Roccamonfina41.276972°N13.968222°E590
Ottati40.465745°N15.311179°E660
San Marco dei Cavoti41.309098°N14.879130°E685
Frassineto40.760859°N14.833564°E686
Ospedaletto d’Alpinolo40.939655°N14.745607°E700
Letino 41.453916°N14.253027°E1050
Montevergine40.936502°N14.729150°E1280
Monte Partenio40.938833°N14.725243°E1515
Table 3. Hail detection methods from single-polarization radar measurements proposed in previous studies. For each methodology, the advantages and the disadvantages are briefly described.
MethodProsCons
CAPPI method
(Geotis, 1963)
This method is very simple to implement and it is successful in cases of severe hailstorms.It is not able to distinguish between heavy rain precipitation and relatively light hail precipitation.
Maximum-reflectivity method
(Holleman, 2001)
It detects high reflectivity values present at higher levels than the CAPPI level.No improvement with respect to the straightforward CAPPI method.
Method of Auer
(Auer, 1994)
The cloud top temperature provides additional information on the vertical extension of the thunderstorm cells.It requires more external data which complicate the operational implementation.
Difference of height method (DOH)
(Waldvogel et al., 1979)
It has a very simple implementation although useful information about the vertical temperature profile is added.It is more suitable for the identification of summer hail events than winter ones due to its seasonality dependence. Radar beam size and the finite number of elevation scans
may determine errors in the height assigned to the measured
reflectivity values.
Severe Hail Index method (SHI)
(Witt et al., 1998)
It detects large hail (diameter > 13 mm) very well.It requires more
external data.
Vertically Integrated Liquid water (VIL)
(Greene and Clark, 1972)
It is useful for both severe storm and hydrological applications.It is strictly dependent on air masses and it is unable to distinguish tall storms with relatively low reflectivity from short storms with high reflectivity.
Vertically Integrated Liquid water density (VLD)
(Amburn and Wolf, 1997)
It normalizes the VIL using the height/depth (echo top) of a thunderstorm and it eliminates the air mass dependency of the VIL. Moreover, it is less sensitive than the DOH method to the thunderstorm vertical extension.It only indicates hail aloft and it may cause inconsistencies between radar estimates and ground truth.
Hail fuzzy-logic oriented detection (HFOD)
(Capozzi et al., 2018)
It is an optimal combination of DOH and VLD techniques, based on the powerful and flexible framework of fuzzy logicIt requires external temperature data and, therefore, its use in an operative framework may be not straightforward.
Table 4. Criteria adopted for precipitation type categorization. If a determined grid cell is affected by precipitation, it is assigned to rain if H < H2°C, to mixed precipitation type if H2°CHH1°C and to snow if HH0°C − 100, where H is the altitude (expressed in m asl) of a determined composite grid cell and H0°C, H1°C and H2°C are the altitudes of 0 °C, 1 °C and 2 °C isotherms.
Precipitation Type CategoryCriterion
RainH < H2°C
MixedH2°CHH1°C
SnowHH0°C − 100
Table 5. List of X-band radar-based estimation algorithms for snow retrievals. For each estimator, the coefficients aj and bj used in Equation (2) to estimate the snowfall rate (SR) in mm∙h−1 from the horizontal reflectivity Zh in mm6∙m−3 are shown. The algorithms developed in [64] refer to different riming conditions, i.e., low riming (FALC(LR)-18), moderate riming (FALC(MR)-18) and heavily riming (FALC(HR)-18). Adapted from [55].
Radar Estimatorj-IndexLabelajbj
Boucher and Wieler (1985)1B&W1-850.04800.6061
2B&W2-850.03800.6061
Fujiyoshi et al. (1990)3FUJI1-900.00390.9174
4FUJI2-907.6274 × 10−41.1364
Matrosov et al. (2009)5MATR1-090.07310.7692
6MATR2-090.04120.6452
Falconi et al. (2018)7FALC(LR)-180.04130.7752
8FALC(MR)-180.02051.0417
9FALC(HR)-180.00781.2500
Table 6. Error scores for the various radar algorithms listed in Table 5. CC, EAVG, ESTD, RMSE and NSE stand for the correlation coefficient, the average error (mm∙h−1), the error standard deviation (mm∙h−1), the root mean square error (RMSE) and the normalized standard error (NSE), respectively. The scores were computed on a dataset consisting of three different snowfall events for a total of 178 sample pairs, considering the disdrometer as a reference value. The optimal values are marked in bold.
B&W1-85B&W2-85FUJI1-90FUJI2-90MATR1-09MATR2-09FALC
(LR)-18
FALC
(MR)-18
FALC(HR)-18
CC0.680.680.660.630.670.680.670.640.62
EAVG−3.01−3.50−3.63−3.625.74−2.721.1817.3437.09
ESTD5.485.535.545.607.105.455.6424.2460.68
RMSE6.806.897.007.129.316.766.8429.7870.79
NSE2.101.942.162.397.002.244.2819.5243.72
Publisher’s Note: MDPI stays neutral with regard to jurisdictional claims in published maps and institutional affiliations.

