Article

Combined Assimilation of Doppler Wind Lidar and Tail Doppler Radar Data over a Hurricane Inner Core for Improved Hurricane Prediction with the NCEP Regional HWRF System

1
Department of Atmospheric Sciences, University of Utah, Salt Lake City, UT 84112, USA
2
Cooperative Institute for Marine and Atmospheric Studies, University of Miami, Miami, FL 33149, USA
3
Hurricane Research Division, NOAA Atlantic Oceanographic and Meteorological Laboratory, Miami, FL 33149, USA
4
Simpson Weather Associates, Inc., Charlottesville, VA 22902, USA
*
Author to whom correspondence should be addressed.
Remote Sens. 2022, 14(10), 2367; https://doi.org/10.3390/rs14102367
Submission received: 7 March 2022 / Revised: 1 May 2022 / Accepted: 11 May 2022 / Published: 13 May 2022

Abstract

:
Accurate specification of hurricane inner-core structure is critical to predicting the evolution of a hurricane. However, observations over hurricane inner cores are generally lacking. Previous studies have emphasized Tail Doppler radar (TDR) data assimilation to improve hurricane inner-core representation. Recently, Doppler wind lidar (DWL) has been used as an observing system to sample hurricane inner-core and environmental conditions. The NOAA P3 Hurricane Hunter aircraft has DWL installed and can obtain wind data over a hurricane’s inner core when the aircraft passes through the hurricane. In this study, we examine the impact of assimilating DWL winds and TDR radial winds on the prediction of Hurricane Earl (2016) with the NCEP operational Hurricane Weather Research and Forecasting (HWRF) system. A series of data assimilation experiments are conducted with the Gridpoint Statistical Interpolation (GSI)-based ensemble-3DVAR hybrid system to identify the best way to assimilate TDR and DWL data into the HWRF forecast system. The results show a positive impact of DWL data on hurricane analysis and prediction. Compared with the assimilation of u and v components, assimilation of DWL wind speed provides better hurricane track and intensity forecasts. Proper choices of data thinning distances (e.g., 5 km horizontal thinning and 70 hPa vertical thinning for DWL) can help achieve better analysis in terms of hurricane vortex representation and forecasts. In the analysis and forecast cycles, the combined TDR and DWL assimilation (DWL wind speed and TDR radial wind, along with other conventional data, e.g., NCEP Automated Data Processing (ADP) data) offsets the downgrade analysis from the absence of DWL observations in an analysis cycle and outperforms assimilation of a single type of data (either TDR or DWL) and leads to improved forecasts of hurricane track, intensity, and structure. Overall, assimilation of DWL observations has been beneficial for analysis and forecasts in most cases. The outcomes from this study demonstrate the great potential of including DWL wind profiles in the operational HWRF system for hurricane forecast improvement.

Graphical Abstract

1. Introduction

Along with rapid coastal development and population growth, the United States has become more vulnerable to the impact of hurricanes than at any time in the recent past [1,2]. Extreme examples in recent years are Hurricanes Katrina (2005), Sandy (2012), Harvey (2017), and Ida (2021), which caused tremendous damage to society. Owing to the great social and economic impact of hurricanes, accurate forecasting of hurricane track, intensity, and structure changes near and after landfall is of great importance for effectively warning the public and reducing economic damage and loss of life.
Over the last decade, following the lead of the NOAA Hurricane Forecast and Improvement Project (HFIP), significant progress has been made toward improved operational hurricane track and intensity forecasts [3,4,5,6,7,8]. Fundamentally, the complexity of predicting hurricane landfalls is due mainly to inaccurate initial conditions and uncertainties in representing sub-grid scale processes in numerical weather prediction (NWP) models. Many previous studies have shown that data assimilation, such as the assimilation of satellite, Doppler radar, and surface observations, can have positive impacts on the prediction and simulation of landfalling hurricanes [9,10,11,12,13,14].
Since observations are usually sparse over the ocean, the NOAA Hurricane Research Division (HRD) has conducted aircraft missions to collect observational data to help with operational analyses and forecasts. Over many years, the airborne NOAA P3 Hurricane Hunter aircraft has measured hurricane inner-core structures using Tail Doppler radar (TDR). Studies have shown that TDR data can significantly improve hurricane forecasts [15,16].
In addition to TDR, new observations such as wind profiles from Doppler wind lidar (DWL) have been tested for operational purposes on the NOAA P3 Hurricane Hunter aircraft since 2014. These DWL-measured wind data complement the existing P3 TDR in that the DWL wind data are collected in rain-free and low-rain regions where TDR is limited for wind observations [17]. The DWL wind data also complement dropsonde measurements by significantly enlarging the sample size and spatial coverage of the boundary layer winds. Moreover, they enable forecasters to determine real-time hurricane intensity because of the measurement of near-surface winds. Recent studies [17,18,19,20,21] have demonstrated that the assimilation of DWL wind profiles leads to improved forecasts of tropical cyclones and mesoscale convective systems using research models. However, NOAA’s P3 DWL has not yet been assimilated into operational hurricane forecast models such as HWRF until now.
In light of the hurricane forecast problems and available DWL observations addressed above, this study examines the impact of assimilating DWL-observed hurricane inner-core winds on the prediction of Hurricane Earl (2016) near its landfall with the NCEP operational Hurricane Weather Research and Forecasting (HWRF) system (version 2020, referred to as H220 hereafter). A series of data assimilation experiments are conducted with the Gridpoint Statistical Interpolation (GSI)-based ensemble-3DVAR hybrid (3DEnVar) system. Different data thinning configurations for the assimilation of wind speed, direction, and components are compared. Additionally, numerical experiments that assimilate DWL and TDR are also explored to combine these two data types in the data assimilation system for optimal hurricane analyses and forecasts.
The model, data assimilation system, and observations are described in Section 2. Section 3 and Section 4 provide the data assimilation experiment results and discussions, respectively. A conclusion is given in Section 4.

2. Materials and Methods

2.1. HWRF Model and Data Assimilation System

HWRF is the current NCEP/NOAA operational regional hurricane model. In this study. we use HWRF version H220, which is equivalent to the operational version updated in late 2020. The HWRF model is composed of the WRF (Weather Research and Forecasting) non-hydrostatic mesoscale model on an E-grid dynamic core [22], the Message Passing Interface Princeton Ocean Model for Tropical Cyclones (MPIPOM-TC) [23], the NCEP coupler, and the GSI assimilation platform [24]. The H220 version of the HWRF model domains is configured with a parent domain (resolution of ~13.5 km) and two storm-following moving nested domains (resolutions of ~4.5 and ~1.5 km). The Ferrier–Aligo microphysics scheme [25,26], the simplified Arakawa–Schubert (SAS) deep convection scheme [27,28], the Geophysical Fluid Dynamics Laboratory (GFDL) longwave and shortwave radiation schemes [29,30], the GFDL surface layer scheme [31,32], the Noah land surface model [33], and the hybrid NCEP GFS PBL parameterization scheme [34,35,36,37] are employed in the atmospheric model in the HWRF system for TC applications.
The GSI-based ensemble-3DVAR (3DEnVar), namely, a 3-dimensional ensemble-variational hybrid system, is used as the data assimilation system for HWRF forecasts. In this study, we use the GSI 3DEnVAR system to assimilate DWL and TDR data along with all the conventional data (e.g., NCEP ADP) that are assimilated in the operational HWRF system. Following the operational HWRF initialization procedure, a vortex relocation and intensity correction were used before the data assimilation. The background error covariance of hybrid 3DEnVar is composed of a combination of flow-dependent background error covariances from the NCEP global forecast system (GFS), 80 ensemble members within the global ensemble Kalman filter data assimilation system, and a static background error covariance is obtained using the National Meteorological Center (NMC) method. The current weight applied to the static background error covariance and the ensemble covariance is 0.2 and 0.8, respectively, which offers more weight to the flow-dependent background error covariance (See [38] for details).

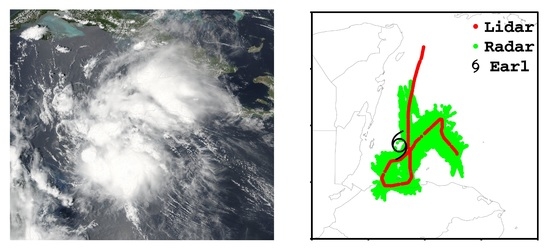
2.2. DWL and TDR Observation Data

As an experimental instrument, the DWL aboard the NOAA P3 aircraft is a coherent system that depends on atmospheric aerosols for its return signal. The DWL measurements can be used to derive the wind profiles associated with TCs from the flight level down to the ocean surface. The DWL-retrieved wind profiles have a horizontal resolution of about 20 m [17]. Besides DWL wind profiles, TDR has also been aboard the NOAA P3 aircraft since 1993 and measures radial wind when the aircraft crosses TCs.
Before Hurricane Earl’s landfall, there were intense observing periods to sample the wind fields in Earl’s inner-core region with both DWL and TDR. Figure 1 shows the horizontal (Figure 1a–g) and vertical (Figure 1h) distributions of DWL and TDR data for Hurricane Earl from 1200 UTC 2 to 00 UTC 4 August 2016. The data are divided according to the assimilation time, with a time window of ±3 h. Despite the omission of observations aligning at the flight level, there are DWL samples of the wind profile from a height of approximately 7 km down to the surface. In comparison, TDR can observe radial wind as high as 14 km. Both TDR and DWL measure hurricane wind information in the hurricane’s inner-core region. While TDR is capable of measuring radial winds over cloud and precipitation regions, DWL can sample wind profiles only in clear-sky regions. Considering the lack of TC inner-core wind observations, these DWL and TDR wind data could benefit TC analysis and forecasts. Specifically, we can assimilate the DWL and TDR wind data into the numerical weather prediction model.

3. Results

3.1. Configurations of Data Assimilation Experiments

With TDR and DWL data available simultaneously for Hurricane Earl (2016), we examine the respective and combined impacts of assimilating DWL and TDR on forecasts of Earl. Conventional observations (e.g., ADP data) available for NCEP operational analyses and forecasts were assimilated into HWRF analysis and forecast cycles for all experiments. We first conducted a 24 h spin-up of the HWRF analysis and forecast cycles with the assimilation of ADP data from 12 UTC 1 to 12 UTC 2 August 2016. Then, the DWL and/or TDR data, when available, were assimilated along with the ADP data into the HWRF model analysis and forecast cycles from 12 UTC 2 to 00 UTC 4 August 2016. The Control experiment assimilates only NCEP ADP data. To examine the relative impact of different wind information from DWL and to explore the best way to assimilate DWL data, the impacts of assimilating DWL wind speed and wind components on the analysis and forecasts are compared.
Meanwhile, previous studies with high-density information from observations have indicated that the assimilation of these data into numerical forecast models can lead to a degraded analysis [39,40,41]. Therefore, we also evaluate different data thinning distances to identify the best configuration for the assimilation of DWL and TDR data. The horizontal thinning distances for DWL data varied from 2 (which is close to the finest model domain grid spacing) to 10 km (which only keeps the minimum amount of data for data assimilation in the GSI system). Similarly, the vertical thinning distances for DWL data varied from 10 to 100 hPa. There is a default horizontal thinning distance (9 km) for TDR data in the GSI for the HWRF model. In this study, we also test the horizontal thinning distance for TDR data varying from 5 to 50 km. Moreover, the gross error parameter, which is the ratio of O-B (observations minus background) and observation errors and reflects the threshold of data rejection in the GSI system, is tested in the multiple-data-type assimilation experiments with the best single data type assimilation configurations. The gross error varies from 2, the default value, to 0.5, which keeps a minimum number of observations for data assimilation. The configurations of the data assimilation experiments are shown in Table 1.

3.2. Impacts of DWL on Hurricane Analysis and Forecast

3.2.1. Wind Speed vs. Wind Components

Figure 2 shows the forecast track from the DWL wind speed and wind component assimilation experiments at 12 UTC 2 (Figure 2a), 18 UTC 2 (Figure 2b), and 00 UTC 3 August 2016 (Figure 2c). Table 2 shows the mean 36 h forecast errors from the experiments. With different data thinning strategies in the assimilation of u and v components of DWL data, LUV, LUVH2V10, and LUVH5V70 (see details about the names of experiments in Table 1) resulting in a track forecast with a significant departure from the best track, with mean 36 h track errors of 76.0 km for LUV, 81.1 km for LUVH2V10, and 72.4 km for LUVH5V70. In contrast, the Control has a 36 h track error of 45.1 km. LSH5V70 produces a slightly better track forecast with a 36 h track error of 40.6 km. The poor TC track from LUV, LUVH2V10, and LUVH5V70 indicate poor storm simulation with DWL wind component assimilation.
To compare the hurricane analyses and forecasts in the experiments with the assimilation of DWL u and v components and the assimilation of the wind speed, Figure 3 shows the wind analysis after data assimilation at 12 UTC 2 August 2016. All of the simulations that assimilate lidar u and v components enhance the northwest part of Hurricane Earl, destroying the vortex structure and resulting in a poor simulation. In contrast, the simulation that assimilates only lidar wind speed generates wind structure and maintains the organized vortex, similar to Control. These results indicated that the assimilation of DWL u and v components induces significant disturbances to the inner-core wind structure, thus negatively influencing the inner-core vortex structure, which harms hurricane forecast.
The forecast maximum surface wind (MSW) and minimum sea-level pressure (SLP) from the DWL wind speed and wind component data assimilation experiments against Control and best track are shown in Figure 4. Similar to the track forecast, the assimilation of DWL wind components (LUV, LUVH2V10, and LUVH5V70) provide a poor intensity forecast, especially at 12 UTC 2 with MSW of less than 40 kt and SLP greater than 1000 hPa. The results imply a degraded simulation of Hurricane Earl with DWL wind component assimilation. Even when data thinning is applied in LUVH2V10 and LUVH5V70, the strong negative impact (shown in Table 2) from the assimilation of u and v components is evident. Assimilation of only DWL wind speed, i.e., LSH5V70, often positively impacts the TC simulation, improving the track and intensity forecast against Control, while the DWL u and v component assimilation usually provides a poor TC simulation. Considering the ±3 h time window for DWL data assimilation, the observed data are usually not measured at the same time as the data are assimilated (Figure 1h). Therefore, the wind direction information from the u and v components, even with a large data thinning distance, often contradicts the initial TC vortex in the HWRF model and finally leads to a poor TC simulation (Figure 3b–d). Assimilating only wind speed information can remove the time window impact and add the wind profile information to the model to improve the TC simulation. The complicated influences from vector winds and wind speeds imply the complex interactions between HWRF vortex initialization and data assimilation [16].

3.2.2. The Impact of Data Thinning

To further examine the best configuration of DWL wind speed assimilation, Figure 5 compares the forecast tracks of Hurricane Earl from different data thinning experiments and Control at 12 UTC 2 August 2016. Table 3 shows the mean 36 h forecast errors of these experiments. All experiments indicate a similar track forecast that slightly diverges from the best track. Compared to Control, which has a 36 h track error of 34.8 km, the DWL data thinning experiments almost all have a track error reduction of ±5 km. LSH5V70 gives a slightly better track forecast, with a 36 h error of 29.8 km. This result implies the positive impact of assimilating DWL wind speed with horizontal thinning of 5 km and vertical thinning of 70 hPa on the track forecast of Hurricane Earl. Data thinning reduces the data density to be consistent with the background and results in better analysis.
For the hurricane SLP and MSW forecasts, Figure 6 shows the different data thinning experiments and Control against the best track at 12 UTC 2 August 2016. Compared to Control, all the DWL data thinning experiments show improved SLP and MSW forecasts, with a 36 h error reduction of 0.5–3.6 hPa and 0.3–3.0 kt. Meanwhile, compared to other data thinning experiments, LSH5V70 generates an MSW maximum of 73 kt and an SLP minimum of 980 hPa, which is close to the best-track record. Horizontal thinning of 5 km and vertical thinning of 70 hPa in DWL wind speed assimilation can reduce track and intensity forecast errors and provide the best maximum hurricane intensity simulation, which is important for a hurricane forecast. Therefore, this set of data thinning is used to assimilate DWL wind speed in the following combined data assimilation experiments.

3.3. TDR Radial Wind Assimilation: Impact of Data Thinning

Since the TDR radial wind data have already been assimilated into the current operational HWRF model, there is a default horizontal data thinning of 9 km in the system. To optimize TDR data assimilation, in this study, we used data from Hurricane Earl to conduct different TDR data thinning experiments to find the best configuration for TDR data assimilation. Figure 7 shows the track forecast from these experiments and Control against the best track at 18 UTC 2 August 2016. Experiments RH5, RH9, and RH20 use horizontal thinning distances of 5, 9, and 20 km, respectively. The 36 h forecast errors from these data thinning experiments, shown in Table 4, indicate similar track forecasts, with a 36 h track error reduction of 7–10 km relative to Control. Only RH50 slightly increases the track error, with a 36 h error of 46.3 km against the 42.7 km of Control. Figure 8 shows the MSW and SLP forecasts from the four TDR data thinning experiments and Control against the best track at 18 UTC 2 August 2016. RH9 and RH20 obviously provide a better intensity forecast, with respective 36 h MSW errors of −9.6 and −9.5 kt and respective 36 h SLP errors of 6.8 and 7.1 hPa, while Control has a 36 h MSW error of −13.9 kt and SLP error of 9.4 hPa. The forecast results indicate a similar improvement for the hurricane track and intensity forecast with TDR assimilation of 9 and 20 km horizontal thinning. These experiments demonstrate that the default thinning for TDR data assimilation is optimal in the current operational HWRF system.

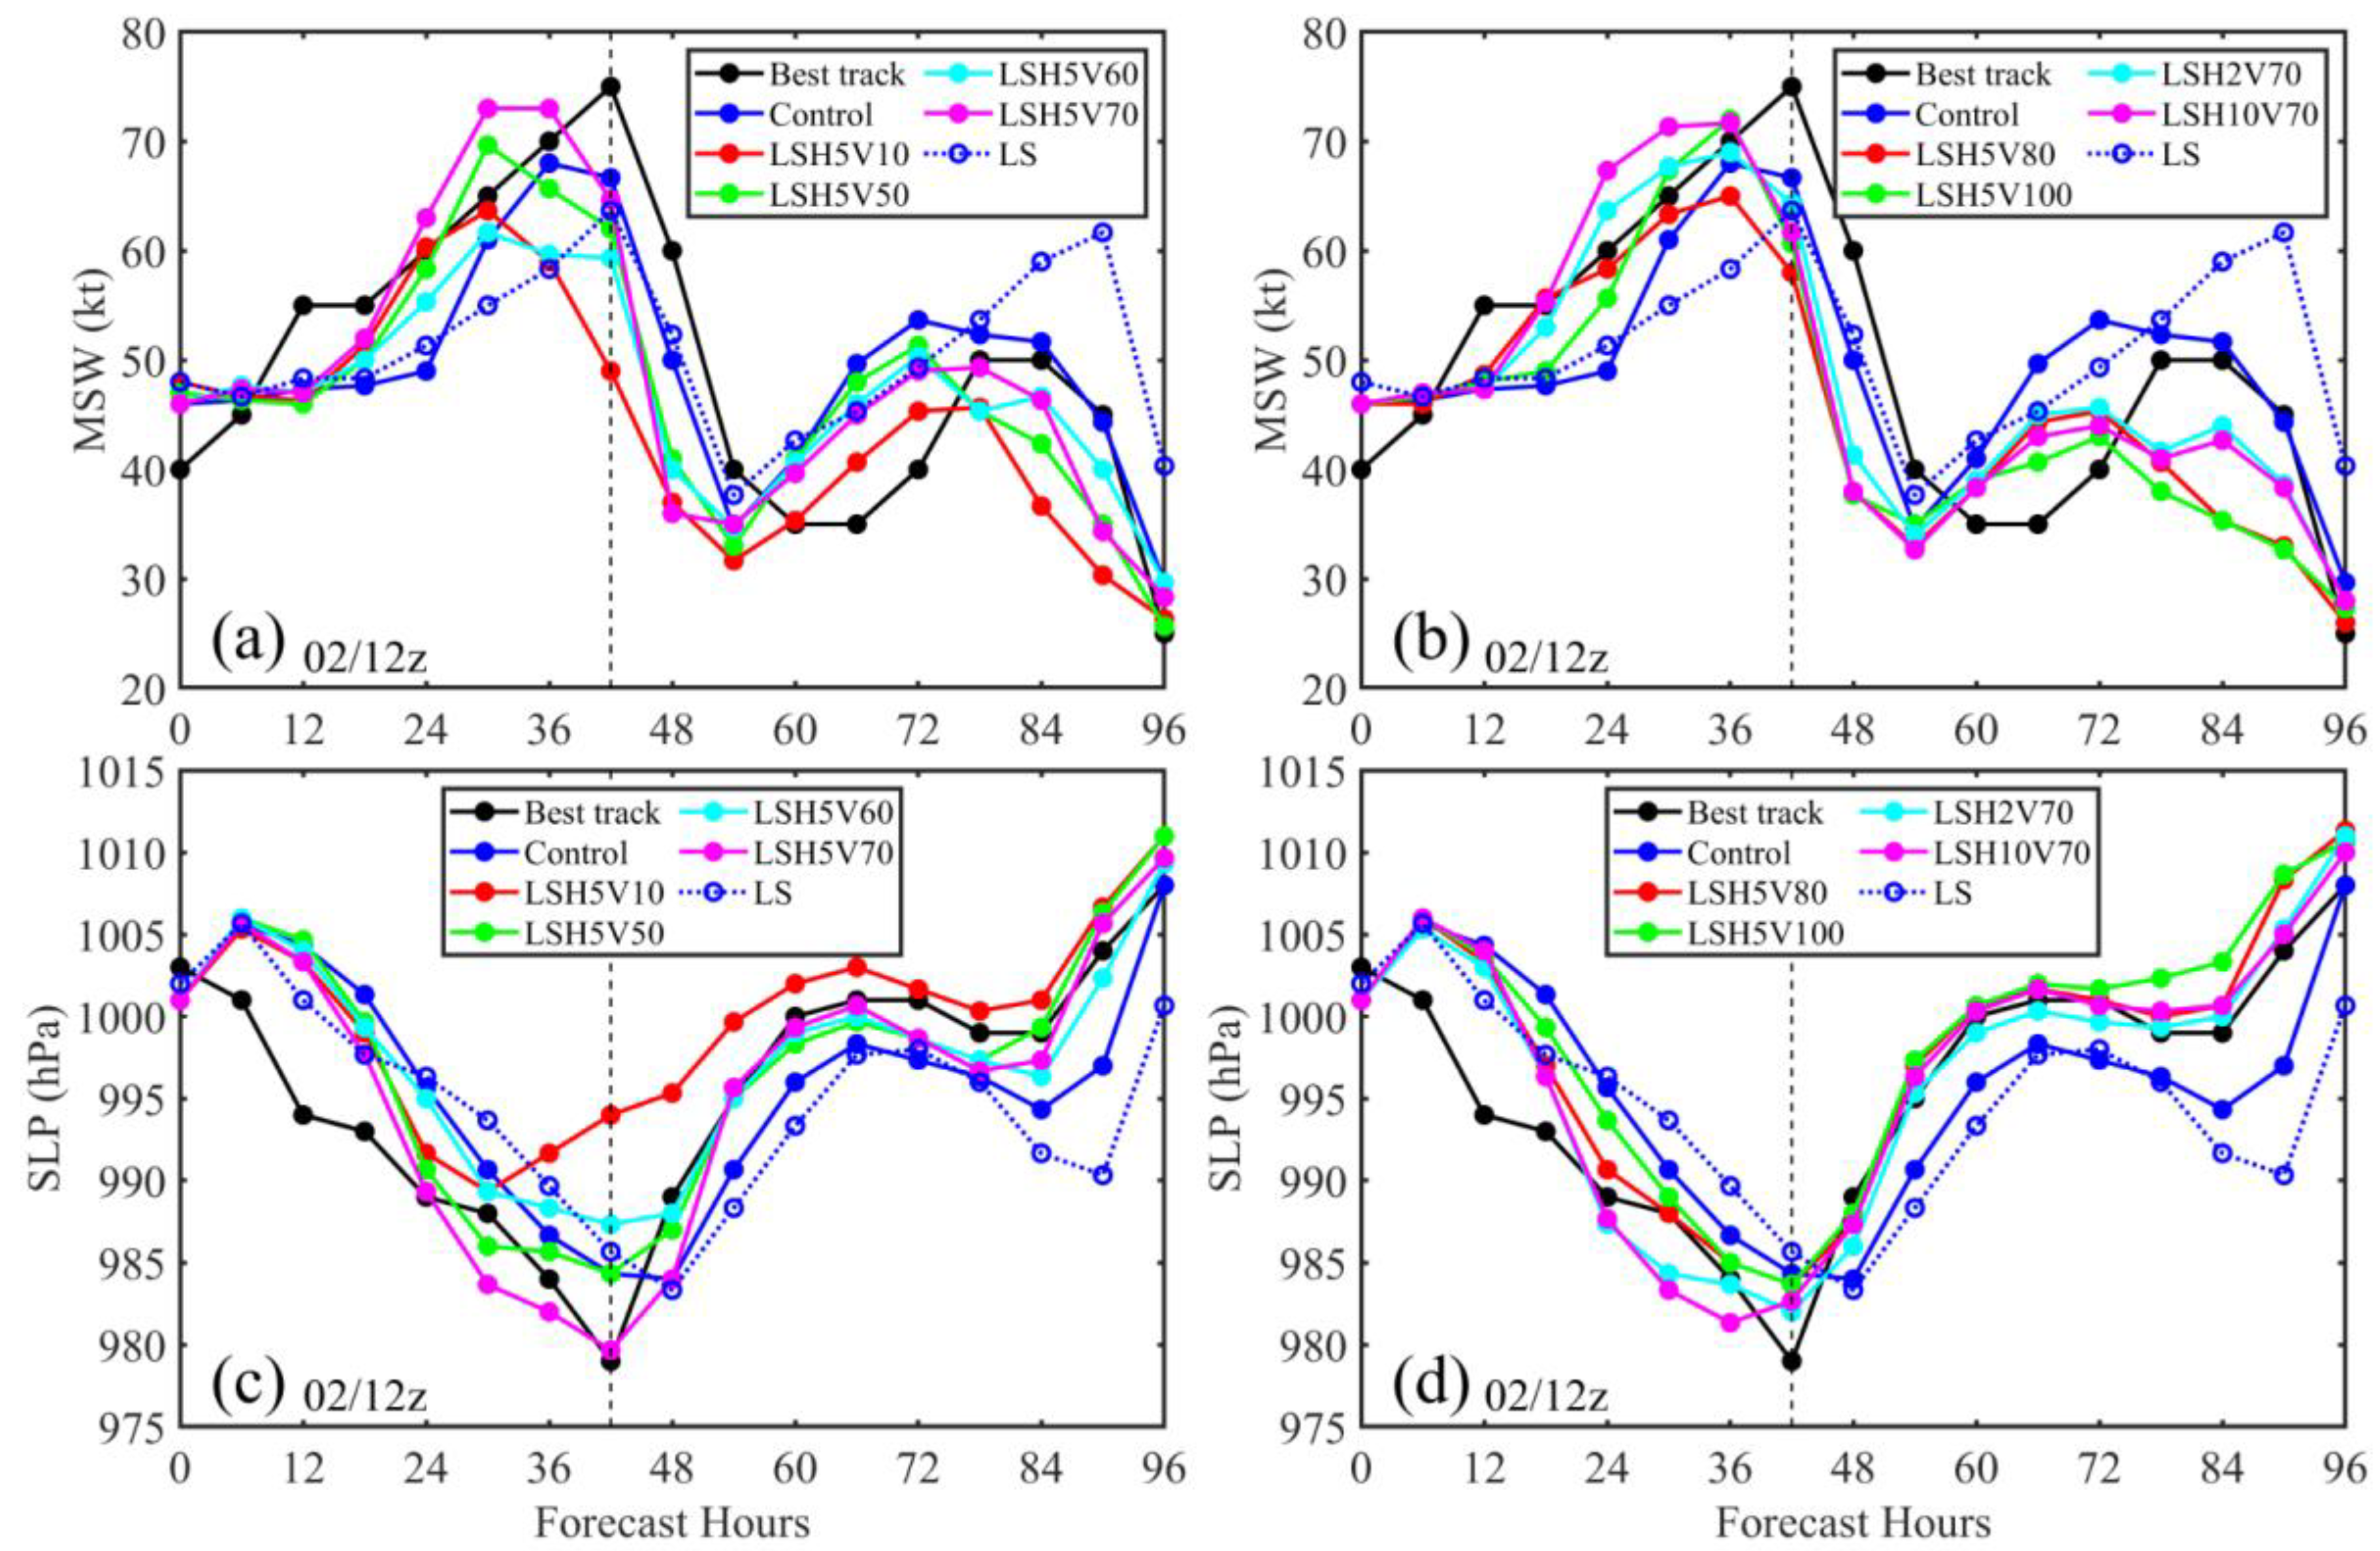
3.4. Combined Assimilation of DWL Wind Speed and TDR Radial Wind

Following the best configuration for DWL and TDR assimilation, combined TDR and DWL data assimilation were conducted to evaluate the impact on hurricane forecasts.

3.4.1. Initial Data Impact Evaluation

Figure 9 shows forecast tracks of Hurricane Earl from Control, LSH5V70, RH9, and LSH5V70 + RH9 at 18 UTC 2 (Figure 9a), 00 UTC 3 (Figure 9b), 06 UTC 3 (Figure 9c), 12 UTC 3 (Figure 9d), 18 UTC 3 (Figure 9e), and 00 UTC 4 August 2016 (Figure 9f). Table 5 shows the mean 36 h forecast errors from these experiments. The simulated storm in all experiments moves straight toward land. All experiments with data assimilation provide better track forecasts against the Control with reduced track errors (Table 5). TDR data assimilation shows a larger positive impact on the track forecast compared to DWL assimilation; thus, the combined assimilation of TDR and DWL also leads to great improvement in the track forecast. However, the corresponding MSW forecast from these experiments, shown in Figure 10, indicates that RH9 underestimates the MSW of Hurricane Earl at certain times, especially at 06–12 UTC 3 August. LSH5V70 provides the best MSW forecast that always captures the MSW maximum, with a mean 36 h MSW error of −4.2 kt against −9.1 kt from Control. Due to the lack of DWL data at 12 UTC 3, the continuous assimilation gap makes LSH5V70 produce a slightly poor MSW at 18 UTC 03. LSH5V70 + RH9 usually provides a better MSW forecast compared to Control, with a mean 36 h MSW error of −7.1 kt. At 06–12 UTC 3 August, the negative impact from the TDR radial wind caused LSH5V70 + RH9 to produce a poor MSW forecast compared to Control.
Figure 11 shows the SLP forecast from these experiments. Similar to the MSW forecast, LSH5V70 provides the best SLP forecast and often captures the SLP minimum of Hurricane Earl, with a mean 36 h error of −1.1 hPa against −3.3 hPa from Control. Further, due to the DWL data gap at 12 UTC 3, the SLP forecast is slightly poor at 18 UTC 3 for LSH5V70. For TDR radial wind assimilation, RH9 overestimates SLP at 00–12 UTC 3 August, thus causing LSH5V70 + RH9 to produce a poor SLP forecast. These results indicate that DWL wind speed data assimilation can usually provide the best hurricane intensity forecast, while TDR data assimilation can correct some of the negative impacts of DWL data and create a better hurricane simulation, as shown in Figure 10e,f and Figure 11e,f. However, RH9 often negatively impacts the forecast and worsens the combined data assimilation. Therefore, factors other than the data thinning method (e.g., data quality control) should be modified for TDR radial data in the combined data assimilation.

3.4.2. Influence of TDR Data Quality Control

Besides the data thinning method, data quantity control is another way to control the data input in the GSI system, as the TDR background error and observation error have already been tested in the system. Specifically, more TDR data rejections were applied to the current data assimilation system, which should account for the poor forecast from TDR data assimilation. Thus, a lower gross error, which reflects the threshold ratio of O-B and observation errors, should be set in the GSI system. Therefore, data assimilation experiments were conducted with TDR gross errors of 1.0, 0.8, and 0.5, compared with the assimilation experiment using the default gross error of 2.0. Figure 12 shows the number profile of accepted TDR data in the data assimilation cycle with different gross errors at 18 UTC 2 August 2016. The decreased gross error reduces the number of accepted TDR data at 200–1000 hPa. Any TDR data with a ratio of O-B and maximum observation error larger than the gross error is rejected in the GSI system.
Figure 13 shows the forecast tracks of Hurricane Earl from Control, LSH5V70 + RH9, LSH5V70 + RH9G10, LSH5V70 + RH9G08, and LSH5V70 + RH9G05 at 18 UTC 2 (Figure 13a), 00 UTC 3 (Figure 13b), 06 UTC 3 (Figure 13c), 12 UTC 3 (Figure 13d), 18 UTC 3 (Figure 13e), and 00 UTC 4 August 2016 (Figure 13f). The different gross errors for TDR data slightly modify the simulated storm, with a mean 36 h track error of 49.9 km for LSH5V70 + RH9G10, 48.9 km for LSH5V70 + RH9G08, and 59.8 km for LSH5V70 + RH9G05. The simulation with a TDR gross error of 0.8 leads to a better track forecast with the combined data assimilation against LSH5V70 + RH9, which has a mean 36 h track error of 52.8 km.
Figure 14 shows the corresponding MSW forecast from these experiments. After adjusting the gross error, the mean 36 h MSW error is −7.4 kt for LSH5V70 + RH9G10, −5.7 kt for LSH5V70 + RH9G08, and −5.8 kt for LSH5V70 + RH9G05. Compared to LSH5V70 + RH9, LSH5V70 + RH9G08 and LSH5V70 + RH9G05 also provide a better MSW maximum forecast except at 18 UTC 3, when LSH5V70 + RH9G05 underestimates the MSW maximum and is too close to the LSH5V70 result. The gross error range of 0.5–0.8 strongly reduces the negative impact of TDR data. However, a gross error of 0.5 rejects too much TDR data, so the combined assimilation cannot correct the negative impact of the DWL data in the combined assimilation. Therefore, for the combined data assimilation, a TDR gross error of 0.8 is more suitable for operational forecasts, as it usually does not have a continuous DWL data series. A TDR gross error of 0.8 does not reject much TDR data and can correct the negative impact of unavailable DWL data in the combined data assimilation.
Figure 15 shows the SLP forecast from these experiments. Similar to the MSW forecast, LSH5V70 + RH9G08 and LSH5V70 + RH9G05 provide the best SLP forecast and often capture the minimum SLP of Hurricane Earl, with a mean 36 h error of 0.1 and 0.2 hPa against 2.3 hPa from LSH5V70 + RH9. The stable positive impact with a TDR gross error of 0.8 indicates the best configuration for hurricane intensity and track simulation with combined DWL wind speed and TDR radial wind data assimilation.

4. Discussions

4.1. Distribution of O-B and O-A

To reveal the influence of data assimilation on initial analysis, Figure 16 shows the distribution of O-B (observation minus background) and O-A (observation minus analysis) for DWL wind speed assimilation (Figure 16a) and TDR radial wind assimilation (Figure 16b) from experiments LSH5V70, RH9, LSH5V70 + RH9, and LSH5V70 + RH9G08 at 18 UTC 2 August 2016. Compared to the DWL wind speed observations, the model background fields have lower winds; thus, O-B in Figure 16a largely distributes around 8 m·s−1. After assimilation of the DWL wind data, the wind speeds in the analysis are enhanced, while O-A is closer (relative to O-B) to the zero line than in experiments LSH5V70, LSH5V70 + RH9, and LSH5V70 + RH9G08. The decreased O-A relative to O-B is associated with better hurricane forecasts in these experiments. For the TDR radial wind assimilation, there is a slight change between O-B and O-A. In the combined data assimilation with LSH5V70 + RH9G08, the reduced TDR gross error made the O-A for radial wind slightly more concentrated to the 0 m·s−1, and the O-A for DWL wind speed is also slightly closer to 0 m·s−1. Therefore, the smaller O-A against DWL wind speeds and TDR radial winds in LSH5V70 + RH9G08 indicate smaller analysis errors. The improved analyses then lead to better hurricane forecasts, as shown in Figure 13, Figure 14 and Figure 15.

4.2. Impact on Hurricane Inner-Core Structure

Because TDR and DWL are assimilated in the hurricane inner-core region, in this section, we examine the effects of DWL wind speed and TDR radial wind assimilation on hurricane inner-core wind structure simulation. NOAA P3 Doppler radar observations are used here to compare with the results from the data assimilation experiments.

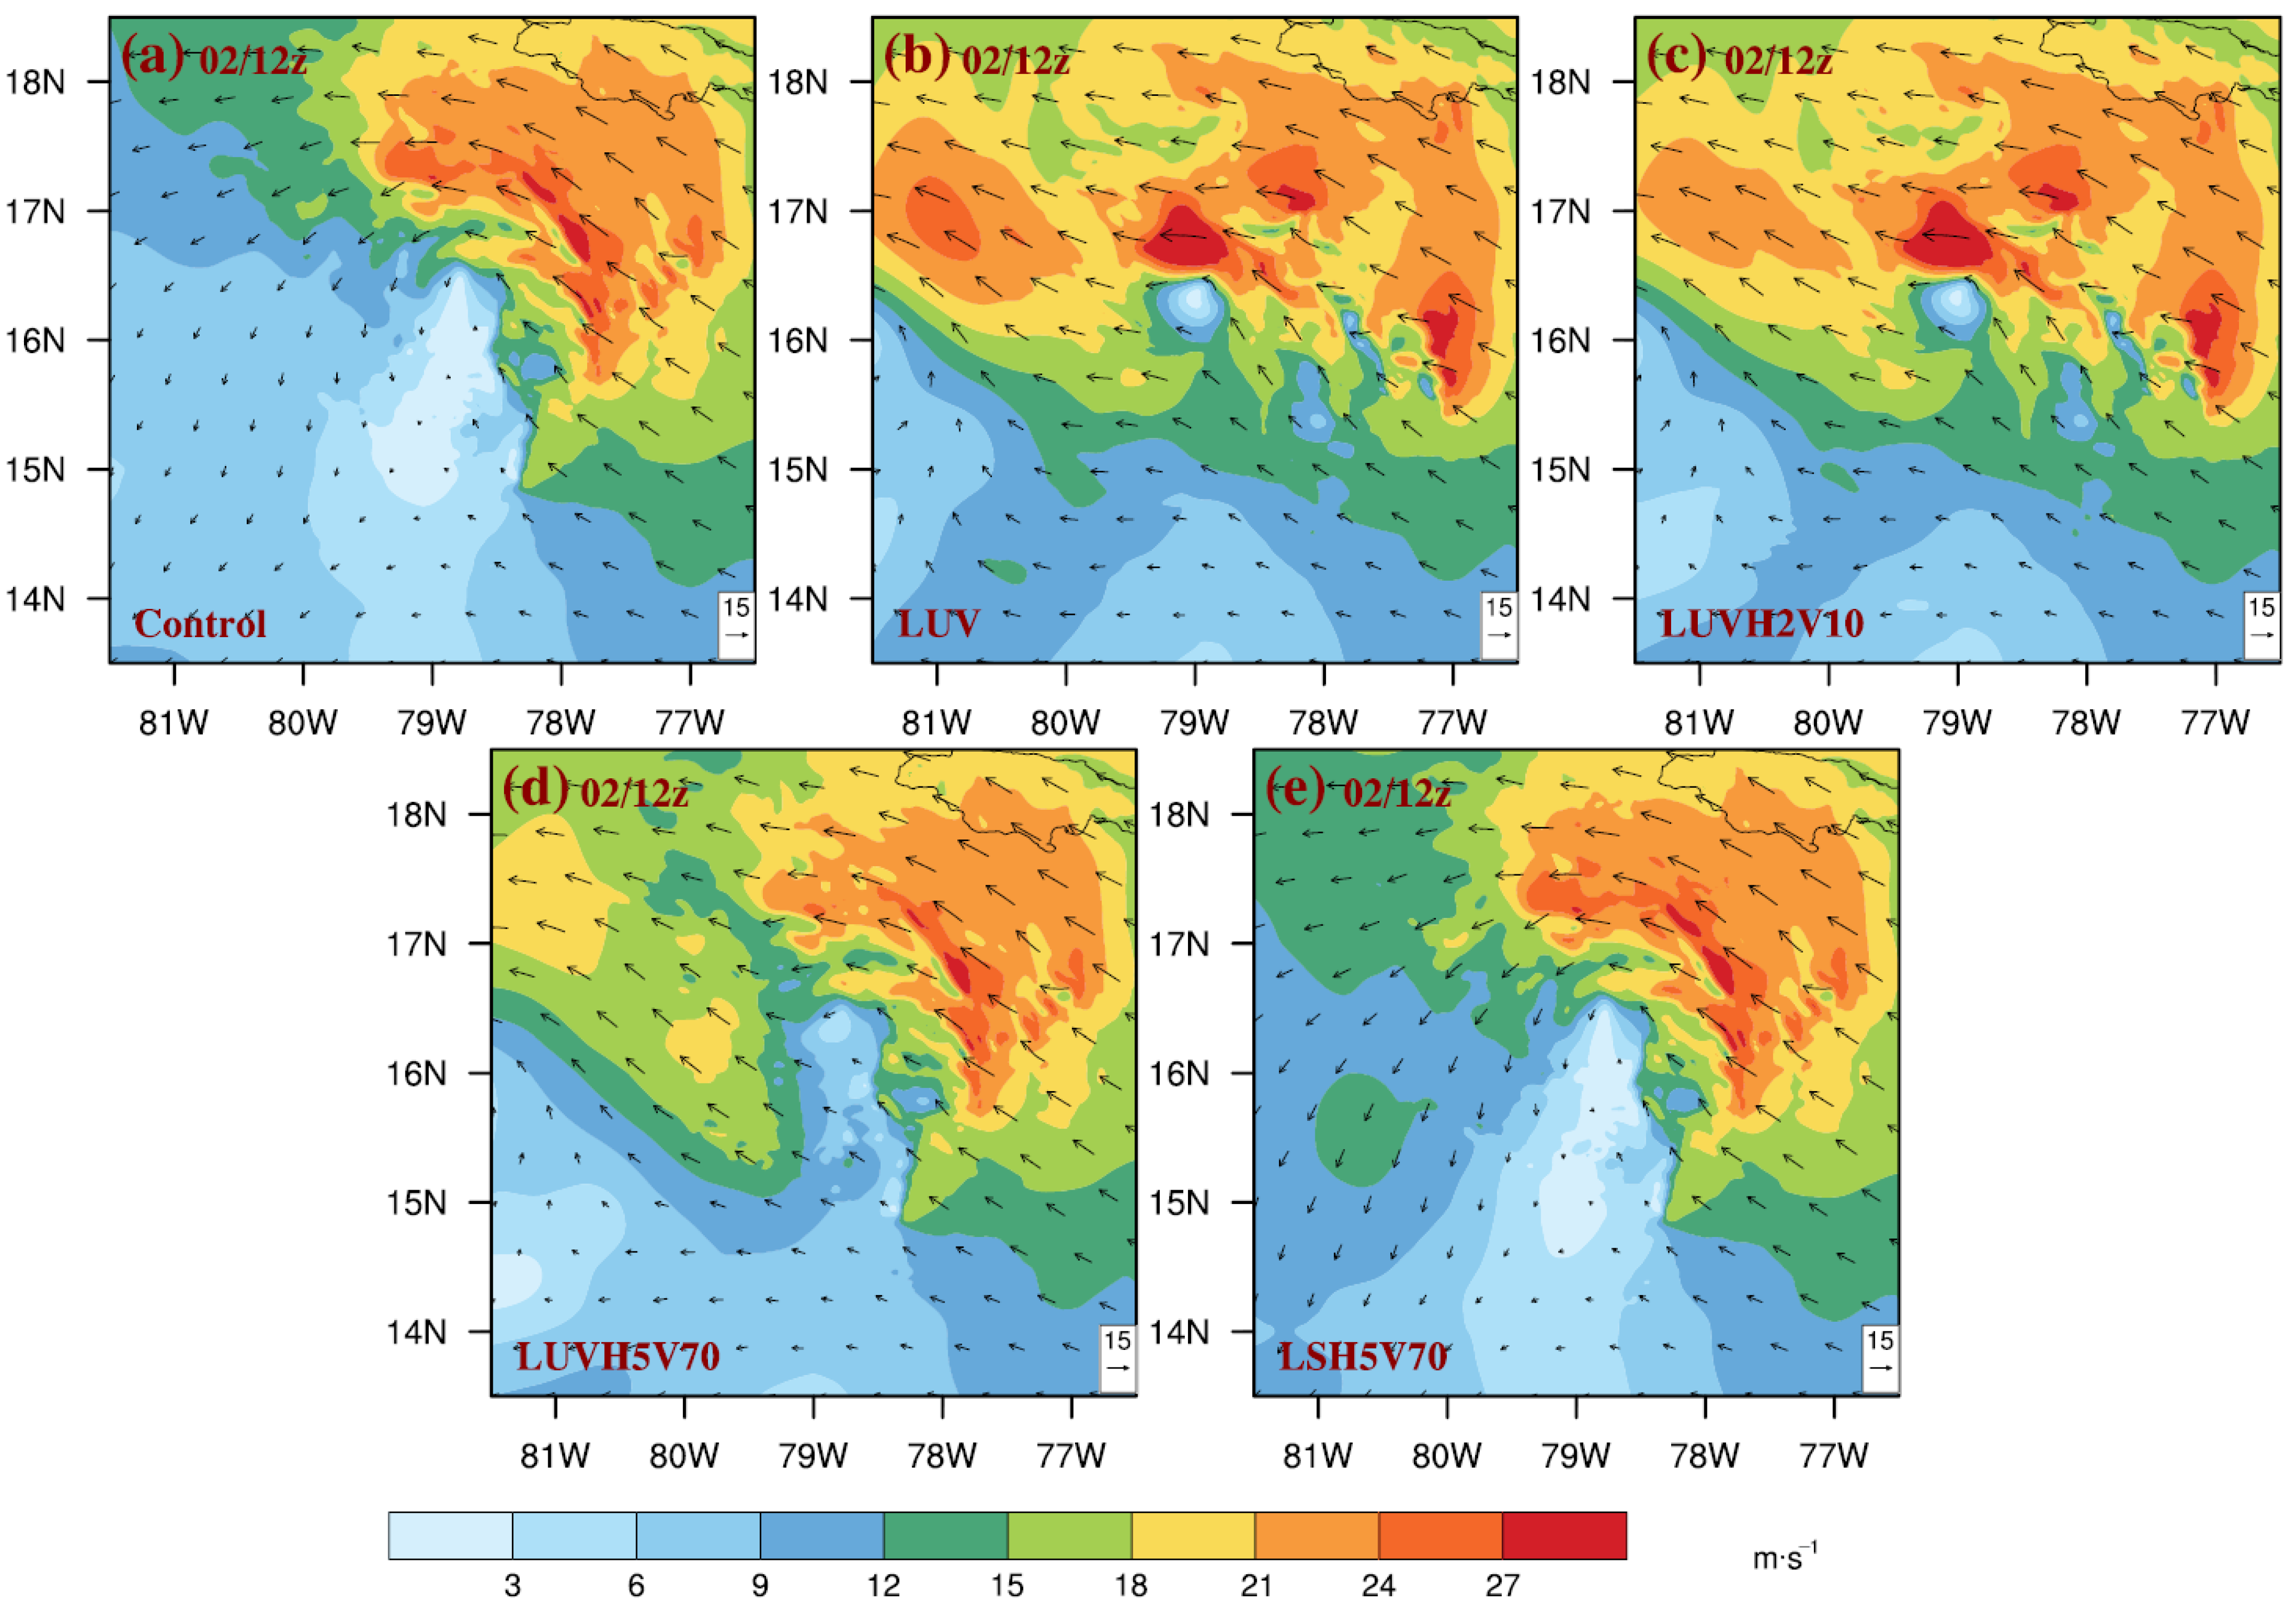
4.2.1. Horizontal Wind Field

Figure 17 shows the horizontal winds at 1500 m from Control, LSH5V70, RH9, LSH5V70 + RH9, and LSH5V70 + RH9G08, which initialize at 18 UTC 03 August 2016, and NOAA radar for Hurricane Earl at 21 UTC 03 August 2016 during landfall. All simulated storms are stronger than radar observations. Compared to Control, LSH5V70 provides a smaller high-wind (28 m·s−1) area and a tiny eye that is close to observations. RH9 provides a weak and excursive vortex and finally causes the storm structure in LSH5V70 + RH9 to depart significantly from the observations. After the TDR gross error is reduced to 0.8, the negative impact from the TDR data is removed, leading to an asymmetrical pattern similar to the radar observations.

4.2.2. Vertical Wind Profile

Wind profiles at 21 UTC 03 August 2016 for Earl from NOAA P3 Doppler radar from the southern part of the hurricane to the northern part are used to evaluate the wind simulation from the data assimilation experiments, initialized at 18 UTC 03 August 2016, shown in Figure 18. In the southern part of Earl, only LSH5V70 + RH9G08 shows a wind profile similar to the radar observations, while the wind from LSH5V70, RH9, and LSH5V70 + RH9 is either too strong or too weak. In the northern part of Earl, DWL wind speed assimilation can reduce the overestimated wind in Control and lead to better wind vertical structure in LSH5V70, LSH5V70 + RH9, and LSH5V70 + RH9G08. However, TDR radial wind assimilation provides a too-weak hurricane in RH9 and adjusts the horizontal extension that causes the high wind (>36 m·s−1) in LSH5V70 + RH9 to extend too far from the storm center. Reducing the TDR gross error to 0.8 corrects the high winds in LSH5V70 + RH9 and generates a better wind structure against Control. For the hurricane track, intensity, and wind structure analysis, the combined data assimilation with DWL wind speed and selected TDR radial wind can provide better hurricane simulations than assimilating only ADP or ADP and TDR data.

5. Conclusions

In this study, the impacts of the respective assimilation of NOAA Doppler wind lidar data and Tail Doppler radar data onboard the P3 aircraft and the combined assimilation of these two data types are tested through the NCEP operational HWRF model. Compared to the DWL u and v component assimilation, the simulation with DWL wind speed data assimilation provides a better hurricane track and intensity forecast. The DWL wind direction information from the u and v components often disturbs the inner core of the TC vortex, producing a poor TC forecast. Assimilating only DWL wind speed positively impacts TC structure generation, resulting in a better TC forecast. The sensitivity assimilation experiments for data thinning indicate the best configuration for DWL wind speed data assimilation, with horizontal thinning of 5 km and vertical thinning of 70 hPa. The default horizontal thinning of 9 km in the operational HWRF model for TDR radial wind assimilation is good enough in the case of Hurricane Earl. However, downgraded analysis could occur in the cycled analysis and forecast procedure with DWL data assimilation when the DWL observations are absent in some analysis cycles. Assimilating DWL wind speed, TDR radial wind, and ADP data can offset the downgraded analysis from the absence of DWL data and lead to a better hurricane forecast compared to assimilating a single type of data. Usually, larger errors in TDR data can make a downgraded analysis that results in a poor hurricane forecast. With a gross error of 0.8 for TDR data, the assimilation of combined DWL and TDR data can reproduce a better storm than either the Control simulation with ADP data assimilation or the operational simulation with ADP and TDR data assimilation. Stricter selection of TDR data in the quality control could retain its positive impact and adjust the negative influence of unavailable DWL data during the forecast cycle of the operational model.
In summary, we evaluated the impacts of assimilating DWL data on the prediction of a landfalling hurricane. Since the initial conditions are critical for the subsequent forecast [42,43], the assimilation of new observations into the numerical model is a promising way for forecast improvement. Moreover, due to a lack of observations over the hurricane’s inner core region, assimilation of inner-core data could significantly improve hurricane intensity forecasting [16,44]. The positive impacts of DWL data on numerical prediction of hurricanes from this current work are consistent with the previous studies [18,19,20,45], in which the lidar-based wind measurements are found to be useful for forecast improvements.
Overall, the results in this study indicate the great potential of including DWL wind speed profiles in operational systems for hurricane forecast improvement. With the increasing application of DWL observations, more studies and cases could further explore the operational assimilation of these data for improved hurricane prediction with the HWRF model and other numerical models, such as coupled atmosphere-ocean-wave numerical models (e.g., [46,47,48]), in the future.

Author Contributions

Conceptualization, Z.P. and X.L.; methodology, X.L. and Z.P.; writing—original draft preparation, X.L. and Z.P.; writing—review and editing, Z.P., J.A.Z. and G.D.E.; supervision, Z.P.; resources, Z.P., J.A.Z. and G.D.E. All authors have read and agreed to the published version of the manuscript.

Funding

This study is supported by NOAA Award # NA19OAR4590239 and NSF Award #OAC 2004658.

Data Availability Statement

The hurricane best track was obtained from the NOAA National Hurricane Center (http://www.nhc.noaa.gov, accessed on 1 August 2021). The radar data were obtained from the NOAA Hurricane Research Division (HRD) (https://www.aoml.noaa.gov/hrd/Storm_pages/sondeformat.html, accessed on 1 August 2021). The DWL data were processed and provided by Simpson Weather Associates, Charlottesville, Virginia. (https://www.aoml.noaa.gov/hrd/Storm_pages/sondeformat.html, accessed on 1 August 2021).

Acknowledgments

Computational resources and support from the Center for High-Performance Computing at the University of Utah and the UCAR CISL supercomputing system are appreciated.

Conflicts of Interest

The authors declare no conflict of interest.

References

  1. Pielke, R.A., Jr.; Landsea, C.W. Normalized hurricane damages in the United States: 1925–95. Weather Forecast 1998, 13, 621–631. [Google Scholar] [CrossRef]
  2. Klotzbach, P.J.; Bowen, S.G.; Pielke, R.; Bell, M. Continental US hurricane landfall frequency and associated damage: Observations and future risks. Bull. Am. Meteorol. Soc. 2018, 99, 1359–1376. [Google Scholar] [CrossRef]
  3. Atlas, R.; Tallapragada, V.; Gopalakrishnan, S.P. Advances in tropical cyclone intensity forecasts. Mar. Technol. Soc. J. 2015, 49, 149–160. [Google Scholar] [CrossRef]
  4. Tallapragada, V.; Bernardet, L.; Biswas, M.K.; Gopalakrishnan, S.; Kwon, Y.; Liu, Q.; Marchok, T.; Sheinin, D.; Tong, M.; Trahan, S.; et al. Hurricane Weather Research and Forecasting (HWRF) Model: 2013 Scientific Documentation; HWRF Development Testbed Center Tech. Report; Developmental Testbed Center: Boulder, CO, USA, 2014; 99p. [Google Scholar]
  5. Tallapragada, V.; Kieu, C.; Trahan, S.; Liu, Q.; Wang, W.; Zhang, Z.; Tong, M.; Zhang, B.; Zhu, L.; Strahl, B. Forecasting tropical cyclones in the western North Pacific basin using the NCEP operational HWRF Model: Model upgrades and evaluation of real-time performance in 2013. Weather Forecast 2016, 31, 877–894. [Google Scholar] [CrossRef]
  6. Gopalakrishnan, S.G.; Goldenberg, S.; Quirino, T.; Zhang, X.; Marks, F., Jr.; Yeh, K.S.; Atlas, R.; Tallapragada, V. Toward improving high-resolution numerical hurricane forecasting: Influence of model horizontal grid resolution, initialization, and physics. Weather Forecast 2012, 27, 647–666. [Google Scholar] [CrossRef]
  7. Gall, R.; Franklin, J.; Marks, F.; Rappaport, E.N.; Toepfer, F. The hurricane forecast improvement project. Bull. Am. Meteorol. Soc. 2013, 94, 329–343. [Google Scholar] [CrossRef]
  8. Toepfer, F.; Tolman, H.; Schneider, T.L.; Stajner, I.; Warren, S. The Next Generation Global Prediction System (NGGPS) program update. In Proceedings of the 8th Conference on Transition of Research to Operations, Austin, TX, USA, 7 January 2019. [Google Scholar]
  9. Liu, Z.; Schwartz, C.S.; Snyder, C.; Ha, S.Y. Impact of assimilating AMSU-A radiances on forecasts of 2008 Atlantic tropical cyclones initialized with a limited-area ensemble Kalman filter. Mon. Weather Rev. 2012, 140, 4017–4034. [Google Scholar] [CrossRef] [Green Version]
  10. Zou, X.; Weng, F.; Zhang, B.; Lin, L.; Qin, Z.; Tallapragada, V. Impacts of assimilation of ATMS data in HWRF on track and intensity forecasts of 2012 four landfall hurricanes. J. Geophys. Res. Atmos. 2013, 118, 11558–11576. [Google Scholar] [CrossRef]
  11. Yang, C.; Liu, Z.; Bresch, J.; Rizvi, S.R.H.; Huang, X.Y.; Min, J. AMSR2 all-sky radiance assimilation and its impact on the analysis and forecast of Hurricane Sandy with a limited-area data assimilation system. Tellus 2016, 68, 30917. [Google Scholar] [CrossRef] [Green Version]
  12. Xu, D.; Min, J.; Shen, F.; Ban, J.; Chen, P. Assimilation of MWHS radiance data from the FY-3B satellite with the WRF Hybrid-3DVAR system for the forecasting of binary typhoons. J. Adv. Model. Earth Syst. 2016, 8, 1014–1028. [Google Scholar] [CrossRef] [Green Version]
  13. Pu, Z.; Li, X.; Sun, J. Impact of airborne Doppler radar data assimilation on the numerical simulation of intensity changes of Hurricane Dennis near a landfall. J. Atmos. Sci. 2009, 66, 3351–3365. [Google Scholar] [CrossRef] [Green Version]
  14. Wang, Y.; Pu, Z. Assimilation of Radial Velocity from Coastal NEXRAD into HWRF for Improved Forecasts of Landfalling Hurricanes. Weather Forecast. 2021, 36, 587–599. [Google Scholar] [CrossRef]
  15. Zhang, F.; Weng, Y.; Gamache, J.F.; Marks, F.D. Performance of convection-permitting hurricane initialization and prediction during 2008–2010 with ensemble data assimilation of inner-core airborne Doppler radar observations. Geophys. Res. Lett. 2011, 38, L15810. [Google Scholar] [CrossRef] [Green Version]
  16. Pu, Z.; Zhang, S.; Tong, M.; Tallapragada, V. Influence of the self-consistent regional ensemble background error covariance on hurricane inner-core data assimilation with the GSI-based hybrid system for HWRF. J. Atmos. Sci. 2016, 73, 4911–4925. [Google Scholar] [CrossRef]
  17. Zhang, J.A.; Atlas, R.; Emmitt, G.D.; Bucci, L.; Ryan, K. Airborne Doppler wind lidar observations of the tropical cyclone boundary layer. Remote Sens. 2018, 10, 825. [Google Scholar] [CrossRef] [Green Version]
  18. Pu, Z.; Zhang, L.; Emmitt, G.D. Impact of airborne Doppler wind lidar profiles on numerical simulations of a tropical cyclone. Geophys. Res. Lett. 2010, 37, L05801. [Google Scholar] [CrossRef]
  19. Zhang, L.; Pu, Z. Four-dimensional Assimilation of Multi-time Wind Profiles Over a Single Station and Numerical Simulation of a Mesoscale Convective System Observed During IHOP_2002. Mon. Weather Rev. 2011, 139, 3369–3388. [Google Scholar] [CrossRef] [Green Version]
  20. Pu, Z.; Zhang, L.; Zhang, S.; Gentry, B.; Emmitt, D.; Demoz, B.; Atlas, R. The impact of Doppler wind lidar measurements on high-impact weather forecasting: Regional OSSE and data assimilation studies. In Data Assimilation for Atmospheric, Oceanic and Hydrologic Applications (Vol. III); Park, S.K., Xu, L., Eds.; Springer: Cham, Switzerland, 2017; pp. 259–283. [Google Scholar]
  21. Bucci, L.R.; O’Handley, C.; Emmitt, G.D.; Zhang, J.A.; Ryan, K.; Atlas, R. Validation of an airborne Doppler wind lidar in tropical cyclones. Sensors 2018, 18, 4288. [Google Scholar] [CrossRef] [Green Version]
  22. Janjic, Z.; Gall, R.; Pyle, M.E. Scientific Documentation for the NMM Solver (No. NCAR/TN-477+STR); National Center for Atmospheric Research University Corporation for Atmospheric Research: Boulder, CO, USA, 2010. [Google Scholar]
  23. Yablonsky, R.M.; Ginis, I.; Thomas, B.; Tallapragada, V.; Sheinin, D.; Bernardet, L. Description and analysis of the ocean component of NOAA’s operational Hurricane Weather Research and Forecasting Model (HWRF). J. Atmos. Ocean. Technol. 2015, 32, 144–163. [Google Scholar] [CrossRef] [Green Version]
  24. Kleist, D.T.; Parrish, D.F.; Derber, J.C.; Treadon, R.; Wu, W.S.; Lord, S. Introduction of the GSI into the NCEP global data assimilation system. Weather Forecast. 2009, 24, 1691–1705. [Google Scholar] [CrossRef] [Green Version]
  25. Ferrier, B.S.; Jin, Y.; Lin, Y.; Black, T.; Rogers, E.; DiMego, G. Implementation of a new grid-scale cloud and precipitation scheme in the NCEP Eta model. In Proceedings of the 19th Conference on Weather Analysis and Forecasting/15th Conference on Numerical Weather Prediction, San Antonio, TX, USA, 11–16 August 2002; Volume 19, pp. 280–283. [Google Scholar]
  26. Aligo, E.; Ferrier, B.; Carley, J.R. Modified NAM microphysics for forecasts of deep convective storms. Mon. Weather Rev. 2018, 146, 4115–4153. [Google Scholar] [CrossRef]
  27. Pan, H.L.; Wu, W.S. Implementing a Mass Flux Convection Parameterization Package for the NMC Medium-Range Forecast Model; Office Note 409; National Centers for Environmental Prediction (U.S.): College Park, MD, USA, 1995. [Google Scholar]
  28. Hong, S.Y.; Pan, H.L. Nonlocal boundary layer vertical diffusion in a medium-range forecast model. Mon. Weather Rev. 1996, 124, 2322–2339. [Google Scholar] [CrossRef] [Green Version]
  29. Schwarzkopf, M.D.; Fels, S.B. The simplified exchange method revisited: An accurate, rapid method for computation of infrared cooling rates and fluxes. J. Geophys. Res. Atmos. 1991, 96, 9075–9096. [Google Scholar] [CrossRef]
  30. Lacis, A.A.; Hansen, J. A parameterization for the absorption of solar radiation in the earth’s atmosphere. J. Atmos. Sci. 1974, 31, 118–133. [Google Scholar] [CrossRef]
  31. Sirutis, J.; Miyakoda, K. Subgrid scale physics in 1-month forecasts. Part I: Experiment with four parameterization packages. Mon. Weather Rev. 1990, 118, 1043–1064. [Google Scholar] [CrossRef] [Green Version]
  32. Kurihara, Y.; Tuleya, R.E. Structure of a tropical cyclone developed in a three-dimensional numerical simulation model. J. Atmos. Sci. 1974, 31, 893–919. [Google Scholar] [CrossRef] [Green Version]
  33. Ek, M.B.; Mitchell, K.E.; Lin, Y.; Rogers, E.; Grunmann, P.; Koren, V.; Gayno, G.; Tarpley, J.D. Implementation of Noah land surface model advancements in the National Centers for Environmental Prediction operational mesoscale Eta model. J. Geophys. Res. 2003, 108, 8851. [Google Scholar]
  34. Gopalakrishnan, S.G.; Marks, F., Jr.; Zhang, J.A.; Zhang, X.; Bao, J.W.; Tallapragada, V. A study of the impacts of vertical diffusion on the structure and intensity of the tropical cyclones using the high-resolution HWRF system. J. Atmos. Sci. 2013, 70, 524–541. [Google Scholar] [CrossRef]
  35. Wang, W.; Sippel, J.A.; Abarca, S.; Zhu, L.; Liu, B.; Zhang, Z.; Mehra, A.; Tallapragada, V. Improving NCEP HWRF simulations of surface wind and inflow angle in the eyewall area. Weather Forecast 2018, 33, 887–898. [Google Scholar] [CrossRef]
  36. Zhang, J.A.; Kalina, E.A.; Biswas, M.K.; Rogers, R.F.; Zhu, P.; Marks, F.D. A Review and Evaluation of Planetary Boundary Layer Parameterizations in Hurricane Weather Research and Forecasting Model Using Idealized Simulations and Observations. Atmosphere 2020, 11, 1091. [Google Scholar] [CrossRef]
  37. Kalina, E.A.; Biswas, M.K.; Zhang, J.A.; Newman, K.M. Sensitivity of an Idealized Tropical Cyclone to the Configuration of the Global Forecast System–Eddy Diffusivity Mass Flux Planetary Boundary Layer Scheme. Atmosphere 2021, 12, 284. [Google Scholar] [CrossRef]
  38. Biswas, M.K.; Abarca, S.; Bernardet, L.; Ginis, I.; Grell, E.; Iacono, M.; Kalina, E.; Liu, B.; Liu, Q.; Marchok, T.; et al. Hurricane Weather Research and Forecasting (HWRF) Model: 2018 Scientific Documentation; HWRF Developmental Testbed Center: Boulder, CO, USA, 2014. [Google Scholar]
  39. Dando, M.L.; Thorpe, A.J.; Eyre, J.R. The optimal density of atmospheric sounder observations in the Met Office NWP system. Q. J. R. Meteorol. Soc. 2007, 133, 1933–1943. [Google Scholar] [CrossRef]
  40. Reale, O.; McGrath-Spangler, E.L.; McCarty, W.; Holdaway, D.; Gelaro, R. Impact of Adaptively Thinned AIRS Cloud-Cleared Radiances on Tropical Cyclone Representation in a Global Data Assimilation and Forecast System. Weather Forecast 2018, 33, 909–931. [Google Scholar] [CrossRef] [PubMed]
  41. Hoffman, R.N. The Effect of Thinning and Superobservations in a Simple One-Dimensional Data Analysis with Mischaracterized Error. Mon. Weather Rev. 2018, 146, 1181–1195. [Google Scholar] [CrossRef]
  42. Pu, Z.X.; Kalnay, E.; Sela, J.; Szunyogh, I. Sensitivity of forecast errors to initial conditions with a quasi-inverse linear method. Mon. Weather Rev. 1997, 125, 2479–2503. [Google Scholar] [CrossRef]
  43. Rabier, F.; Klinker, E.; Courtier, P.; Hollingsworth, A. Sensitivity of forecast errors to initial conditions. Q. J. R. Meteorol. Soc. 1996, 122, 121–150. [Google Scholar] [CrossRef]
  44. Zhang, S.; Pu, Z. Numerical simulation of rapid weakening of Hurricane Joaquin with assimilation of high-definition sounding system dropsondes during the tropical cyclone intensity experiment: Comparison of 3DEnVar and 4DEnVar. Weather Forecast 2019, 34, 521–538. [Google Scholar] [CrossRef]
  45. Cui, Z.; Pu, Z.; Tallapragada, V.; Atlas, R.; Ruf, C. A Preliminary Impact Study of CYGNSS Ocean Surface Wind Speeds on Numerical Simulations of Hurricanes. Geophys. Res. Lett. 2019, 46, 2984–2992. [Google Scholar] [CrossRef] [Green Version]
  46. Kumar, N.; Voulgaris, G.; Warner, J.C.; Olabarrieta, M. Implementation of the vortex force formalism in the coupled ocean-atmosphere-wave-sediment transport (COAWST) modeling system for inner shelf and surf zone applications. Ocean Model. 2012, 47, 65–95. [Google Scholar] [CrossRef]
  47. Zambon, J.B.; He, R.; Warner, J.C. Investigation of hurricane Ivan using the coupled ocean–atmosphere–wave–sediment transport (COAWST) model. Ocean Dynam. 2014, 64, 1535–1554. [Google Scholar] [CrossRef]
  48. Ricchi, A.; Miglietta, M.M.; Bonaldo, D.; Cioni, G.; Rizza, U.; Carniel, S. Multi-physics ensemble versus atmosphere–ocean coupled model simulations for a tropical-like cyclone in the Mediterranean Sea. Atmosphere 2019, 10, 202. [Google Scholar] [CrossRef] [Green Version]
Figure 1. The (ag) horizontal and (h) vertical distributions of DWL and TDR data for Hurricane Earl at (a) 12 UTC 2, (b) 18 UTC 2, (c) 00 UTC 3, (d) 06 UTC 3, (e) 12 UTC 3, (f) 18 UTC 3, and (g) 00 UTC 4 August 2016.
Remotesensing 14 02367 g001
Figure 2. Comparison of forecast track for Hurricane Earl from the DWL wind speed and wind component assimilation experiments against Control and best track at (a) 12 UTC 2, (b) 18 UTC 2, and (c) 00 UTC 3 August 2016.
Remotesensing 14 02367 g002
Figure 3. The 850 hPa wind analysis after data assimilation from (a) Control, (b) LUV, (c) LUVH2V10, (d) LUVH5V70, and (e) LSH5V70 for Hurricane Earl during landfall at 12 UTC 2 August 2016. Black arrows denote wind vectors (unit m·s−1).
Remotesensing 14 02367 g003
Figure 4. Comparison of the forecast (a,c,e) MSW and (b,d,f) SLP for Hurricane Earl for different DWL wind speed thinning experiments against Control and best track at (a,b) 12 UTC, (c,d) 18 UTC 2, and (e,f) 00 UTC 3 August 2016.
Remotesensing 14 02367 g004
Figure 5. Comparison of the forecast track for Hurricane Earl for different DWL wind speed (a) vertical thinning and (b) horizontal and vertical thinning experiments against Control and best track at 12 UTC 2 August 2016.
Remotesensing 14 02367 g005
Figure 6. Comparison of the forecast (a,b) MSW and (c,d) SLP for Hurricane Earl for different DWL wind speed thinning experiments against Control and best track at 12 UTC 2 August 2016.
Remotesensing 14 02367 g006
Figure 7. Comparison of the forecast track for Hurricane Earl from different TDR data thinning experiments against Control and best track at 18 UTC 2 August 2016.
Remotesensing 14 02367 g007
Figure 8. Comparison of the forecast (a) MSW and (b) SLP for Hurricane Earl for different TDR data thinning experiments against Control and best track at 18 UTC 2 August 2016.
Remotesensing 14 02367 g008
Figure 9. Comparison of the forecast track for Hurricane Earl from Control, LSH5V70, RH9, and LSH5V70 + RH9 at (a) 18 UTC 2, (b) 00 UTC 3, (c) 06 UTC 3, (d) 12 UTC 3, (e) 18 UTC 3, and (f) 00 UTC 4 August 2016.
Remotesensing 14 02367 g009
Figure 10. Comparison of the forecast MSW for Hurricane Earl from Control, LSH5V70, RH9, and LSH5V70 + RH9 at (a) 18 UTC 2, (b) 00 UTC 3, (c) 06 UTC 3, (d) 12 UTC 3, (e) 18 UTC 3, and (f) 00 UTC 4 August 2016.
Remotesensing 14 02367 g010
Figure 11. Comparison of the forecast SLP for Hurricane Earl from Control, LSH5V70, RH9, and LSH5V70 + RH9 at (a) 18 UTC 2, (b) 00 UTC 3, (c) 06 UTC 3, (d) 12 UTC 3, (e) 18 UTC 3, and (f) 00 UTC 4 August 2016.
Remotesensing 14 02367 g011
Figure 12. Number of accepted TDR data at different heights with different gross errors at 18 UTC 2 August 2016.
Remotesensing 14 02367 g012
Figure 13. Comparison of the forecast track for Hurricane Earl for Control, LSH5V70 + RH9, LSH5V70 + RH9G10, LSH5V70 + RH9G08, and LSH5V70 + RH9G05 at (a) 18 UTC 2, (b) 00 UTC 3, (c) 06 UTC 3, (d) 12 UTC 3, (e) 18 UTC 3, and (f) 00 UTC 4 August 2016.
Remotesensing 14 02367 g013
Figure 14. Comparison of the forecast MSW for Hurricane Earl from Control, LSH5V70 + RH9, LSH5V70 + RH9G10, LSH5V70 + RH9G08, and LSH5V70 + RH9G05 at (a) 18 UTC 2, (b) 00 UTC 3, (c) 06 UTC 3, (d) 12 UTC 3, (e) 18 UTC 3, and (f) 00 UTC 4 August 2016.
Remotesensing 14 02367 g014
Figure 15. Comparison of the forecast SLP for Hurricane Earl from Control, LSH5V70 + RH9, LSH5V70 + RH9G10, LSH5V70 + RH9G08, and LSH5V70 + RH9G05 at (a) 18 UTC 2, (b) 00 UTC 3, (c) 06 UTC 3, (d) 12 UTC 3, (e) 18 UTC 3, and (f) 00 UTC 4 August 2016.
Remotesensing 14 02367 g015
Figure 16. The distribution of O-B (observation minus background) and O-A (observation minus analysis) against (a) DWL wind speeds and (b) TDR radial winds for experiments LSH5V70, RH9, LSH5V70 + RH9, and LSH5V70 + RH9G08 at 18 UTC 2 August 2016. The details of the black box in (b) have been enlarged.
Remotesensing 14 02367 g016
Figure 17. The 1500 m wind from (a) NOAA Doppler radar, (b) Control, (c) LSH5V70, (d) RH9, (e) LSH5V70 + RH9, and (f) LSH5V70 + RH9G08 for Hurricane Earl during landfall at 21 UTC 3 August 2016. The white contour line represents winds over 28 m·s−1 for observations and simulations.
Remotesensing 14 02367 g017
Figure 18. Wind field of a vertical cross-section of Earl at 2100 UTC 3 August 2016 from (a) NOAA Doppler radar, (b) Control, (c) LSH5V70, (d) RH9, (e) LSH5V70 + RH9, and (f) LSH5V70 + RH9G08.
Remotesensing 14 02367 g018
Table 1. Configurations for all assimilation experiments. “ADP” represents ADP conventional data. DWL observed wind speed u and v components is represented by “u” and “v” in the table. The data assimilated in the experiment is marked with “X” in the table.
Experiments DWL ADP TDR
uvWind
Speed
Horizontal Thinning
Distance
Vertical Thinning
Distance
Radial WindHorizontal ThinningGross Error
Control X
LUVXX X
LUVH2V10XX 2 km10 hPaX
LUVH5V70XX 5 km70 hPaX
LSH5V10 X5 km10 hPaX
LSH5V50 X5 km50 hPaX
LSH5V60 X5 km60 hPaX
LSH5V70 X5 km70 hPaX
LSH5V80 X5 km80 hPaX
LSH5V100 X5 km100 hPaX
LSH2V70 X2 km70 hPaX
LSH10V70 X10 km70 hPaX
RH5 XX5 km2.0
RH9 XX9 km2.0
RH20 XX20 km2.0
RH50 XX50 km2.0
LSH5V70 + RH9 X5 km70 hPaXX9 km2.0
LSH5V70 + RH9G10 X5 km70 hPaXX9 km1.0
LSH5V70 + RH9G08 X5 km70 hPaXX9 km0.8
LSH5V70 + RH9G05 X5 km70 hPaXX9 km0.5
Table 2. Mean 36 h forecast errors from lidar wind speed and wind component data assimilation experiments.
36 h ErrorsControlLUVLUVH2V10LUVH5V70LSH5V70
Track errors (km)45.176.081.172.440.6
MSW errors (knot)−10.2−11.9−7.9−10.0−1.9
SLP errors (hPa)7.210.46.08.12.2
Table 3. The 36 h forecast errors from data thinning experiments with lidar wind-speed data assimilation at 12 UTC 2 August 2016.
36 h ErrorsControlLSH5V10LSH5V50LSH5V60LSH5V70
Track errors (km)34.844.735.231.629.8
MSW errors (knot)−3.5−2.1−1.0−3.21.6
SLP errors (hPa)4.84.23.14.41.5
LSH5V80LSH5V100LSH2V70LSH10V70LS
Track errors (km)32.728.233.923.540.0
MSW errors (knot)−1.0−0.80.52.3−4.9
SLP errors (hPa)2.73.71.31.14.9
Table 4. The 36 h forecast errors from data thinning experiments with radar radial wind assimilation at 18 UTC 2 August 2016.
36 h ErrorsControlRH5RH9RH20RH50
Track errors (km)42.734.335.632.246.3
MSW errors (knot)−13.9−12.6−9.6−9.5−10.8
SLP errors (hPa)9.48.66.87.18.4
Table 5. The mean 36 h forecast errors from lidar wind speed and/or radar data and combined data assimilation with different gross errors of radar radial wind.
36 h ErrorsControlLSH5V70R9LSH5V70 + R9LSH5V70 + R9G10
Track errors (km)63.361.845.752.849.9
MSW errors (knot)−9.1−4.2−9.3−7.1−7.4
SLP errors (hPa)3.3−1.13.72.31.3
Publisher’s Note: MDPI stays neutral with regard to jurisdictional claims in published maps and institutional affiliations.

