Article

Thermokarst Lake Susceptibility Assessment Induced by Permafrost Degradation in the Qinghai–Tibet Plateau Using Machine Learning Methods

1
Key Laboratory of Environmental Change and Natural Disasters, Ministry of Education, Beijing Normal University, 19 Xinjiekouwai Street, Beijing 100875, China
2
State Key Laboratory of Earth Surface Processes and Resource Ecology (ESPRE), Beijing Normal University, Beijing 100875, China
3
Faculty of Geographical Science, Beijing Normal University, Beijing 100875, China
4
Faculty of Geomatics, Lanzhou Jiaotong University, Lanzhou 730070, China
*
Author to whom correspondence should be addressed.
Remote Sens. 2023, 15(13), 3331; https://doi.org/10.3390/rs15133331
Submission received: 6 May 2023 / Revised: 14 June 2023 / Accepted: 19 June 2023 / Published: 29 June 2023
(This article belongs to the Special Issue Remote Sensing of Dynamic Permafrost Regions Ⅱ)

Abstract

:
The rapidly warming climate on the Qinghai–Tibet Plateau (QTP) leads to permafrost degradation, and the thawing of ice-rich permafrost induces land subsidence to facilitate the development of thermokarst lakes. Thermokarst lakes exacerbate the instability of permafrost, which significantly alters regional geomorphology and hydrology, affecting biogeochemical cycles. However, the spatial distribution and future changes in thermokarst lakes have rarely been assessed at large scales. In this study, we combined various conditioning factors and an inventory of thermokarst lakes to assess the spatial distribution of susceptibility maps using machine-learning algorithms. The results showed that the extremely randomized trees (EXT) performed the best in the susceptibility modeling process, followed by random forest (RF) and logistic regression (LR). According to the assessment based on EXT, the high- and very high-susceptibility area of the present (2000–2016) susceptibility map was 196,222 km2, covering 19.67% of the permafrost region of the QTP. In the future (the 2070s), the area of the susceptibility map was predicted to shrink significantly under various representative concentration pathway scenarios (RCPs). The susceptibility map area would be reduced to 37.06% of the present area in RCP 8.5. This paper also performed correlation and importance analysis on the conditioning factors and thermokarst lakes, which indicated that thermokarst lakes tended to form in areas with flat topography and high soil moisture. The uncertainty of the susceptibility map was further assessed by the coefficient of variation (CV). Our results demonstrate a way to study the spatial distribution of thermokarst lakes at the QTP scale and provide a scientific basis for understanding thermokarst processes in response to climate change.

1. Introduction

The Qinghai–Tibet Plateau (QTP), known as the Third Pole of the Earth, has a wide distribution of permafrost with an estimated area of about 1.06 × 10⁶ km2 [1,2]. As a crucial component of the cryosphere, permafrost is susceptible to disturbances from human activities and climate change [3,4]. The QTP has warmed at a rate (~0.44 °C) twice as fast as the global average from 1979 to 2020 [5], leading to significant degradation of permafrost, as evidenced by the thickening of the active layer and rising ground temperatures [6,7,8]. Many studies have predicted that permafrost will continue to degrade significantly in the 21st century under various climate scenarios [4,9,10]. The degradation of ice-rich permafrost leads to the development of thermokarst landforms [11,12], which pose significant impacts on the local landscape, biogeochemistry, and climate change, as well as the stability of engineering infrastructure [13,14,15,16].
Thermokarst lakes refer to lakes that form from surface subsidence as a result of the thawing of ice-rich permafrost or melting of massive ground ice [17]. After thermokarst lake initiation, the water body is associated with the surrounding terrain by means of thermal and mechanical erosion processes [14], which accelerate the thawing of the surrounding permafrost and promote the formation of the talik [17,18]. In addition, thermokarst lakes affect the stability of nearby infrastructure by transferring heat to permafrost under embankments [19,20]. Thermokarst lakes are abundant in the Arctic lowland permafrost regions, including Siberia, Alaska, northern Canada, and the permafrost regions of the QTP [15,17,21,22]. The total area of thermokarst lakes on the QTP is estimated to be about 2825 km2 [23]. There is distinct spatial heterogeneity in the dynamics of thermokarst lakes, with increases in thermokarst lake area found in the central QTP [24,25], and shrinkages of thermokarst lake area observed in the northeastern QTP [26]. In the future, hazards induced by thermokarst processes along with permafrost degradation are predicted to increase due to climate warming [27]. Because thermokarst lakes are direct indicators of permafrost disturbance, it is necessary to assess ongoing and future changes in thermokarst lakes for better estimation of climate change impacts.
Thermokarst lake susceptibility maps (TLSMs) are important for determining the most prone regions where thermokarst lakes are most likely to occur [28]. Compared with the dynamic changes of thermokarst lakes, TLSM represents its spatial distribution probability, considering the importance of conditioning factors relative to thermokarst lakes, and multiple studies have carried out thermokarst lake susceptibility assessments [28,29,30,31]. Thermokarst lake susceptibility assessment in the circum-Arctic region has been implemented [15], while studies about susceptibility modeling in the QTP are limited to small regions such as the Qinghai–Tibet Engineering Corridor (QTEC) [28,31]. Besides, the permafrost on the QTP will degrade significantly under Representative Concentration Pathway scenarios (RCPs) in the 2070s, and the maximum shrinkage area will account for about 60% of the present permafrost extent [9]. Therefore, it is worth studying the spatial distribution of thermokarst lake susceptibility in future scenarios. However, uncertainties in the susceptibility map can lead to unsatisfactory social costs [32], and the spatial distribution of uncertainty during susceptibility modeling has rarely been evaluated. It is imperative to quantify the uncertainty in susceptibility maps so that susceptibility maps provide reliable spatial information that can support potential susceptibility regions [32,33]. To overcome the aforementioned limitations, we performed a thermokarst lake susceptibility assessment for present and future scenarios, and the spatial distribution of uncertainty was evaluated to ensure the reliability of the susceptibility maps.
In recent years, satellite-based observation techniques and machine-learning methods have been applied to thermokarst lake dynamics [34,35]. For thermokarst lake susceptibility assessment, the combination of thermokarst lake inventory and conditioning factors is used for machine-learning modeling, the contribution of each factor to thermokarst lake occurrence is obtained, and then the prediction of thermokarst lake spatial probability is more feasible [28]. In this paper, firstly, the relationship between thermokarst lakes and conditioning factors was analyzed using frequency ratio and machine-learning methods. Subsequently, we performed thermokarst lake susceptibility assessments based on three machine-learning techniques and analyzed their uncertainties. Next, we assessed the susceptibility distribution of thermokarst lakes under multiple future scenarios (i.e., RCP 2.6, RCP 4.5, RCP 8.5). Finally, we analyzed the potential risk of the Qinghai–Tibet Highway (QTH) in the QTEC. The obtained results can provide support for decision-makers to formulate appropriate future management.

2. Materials and Methods
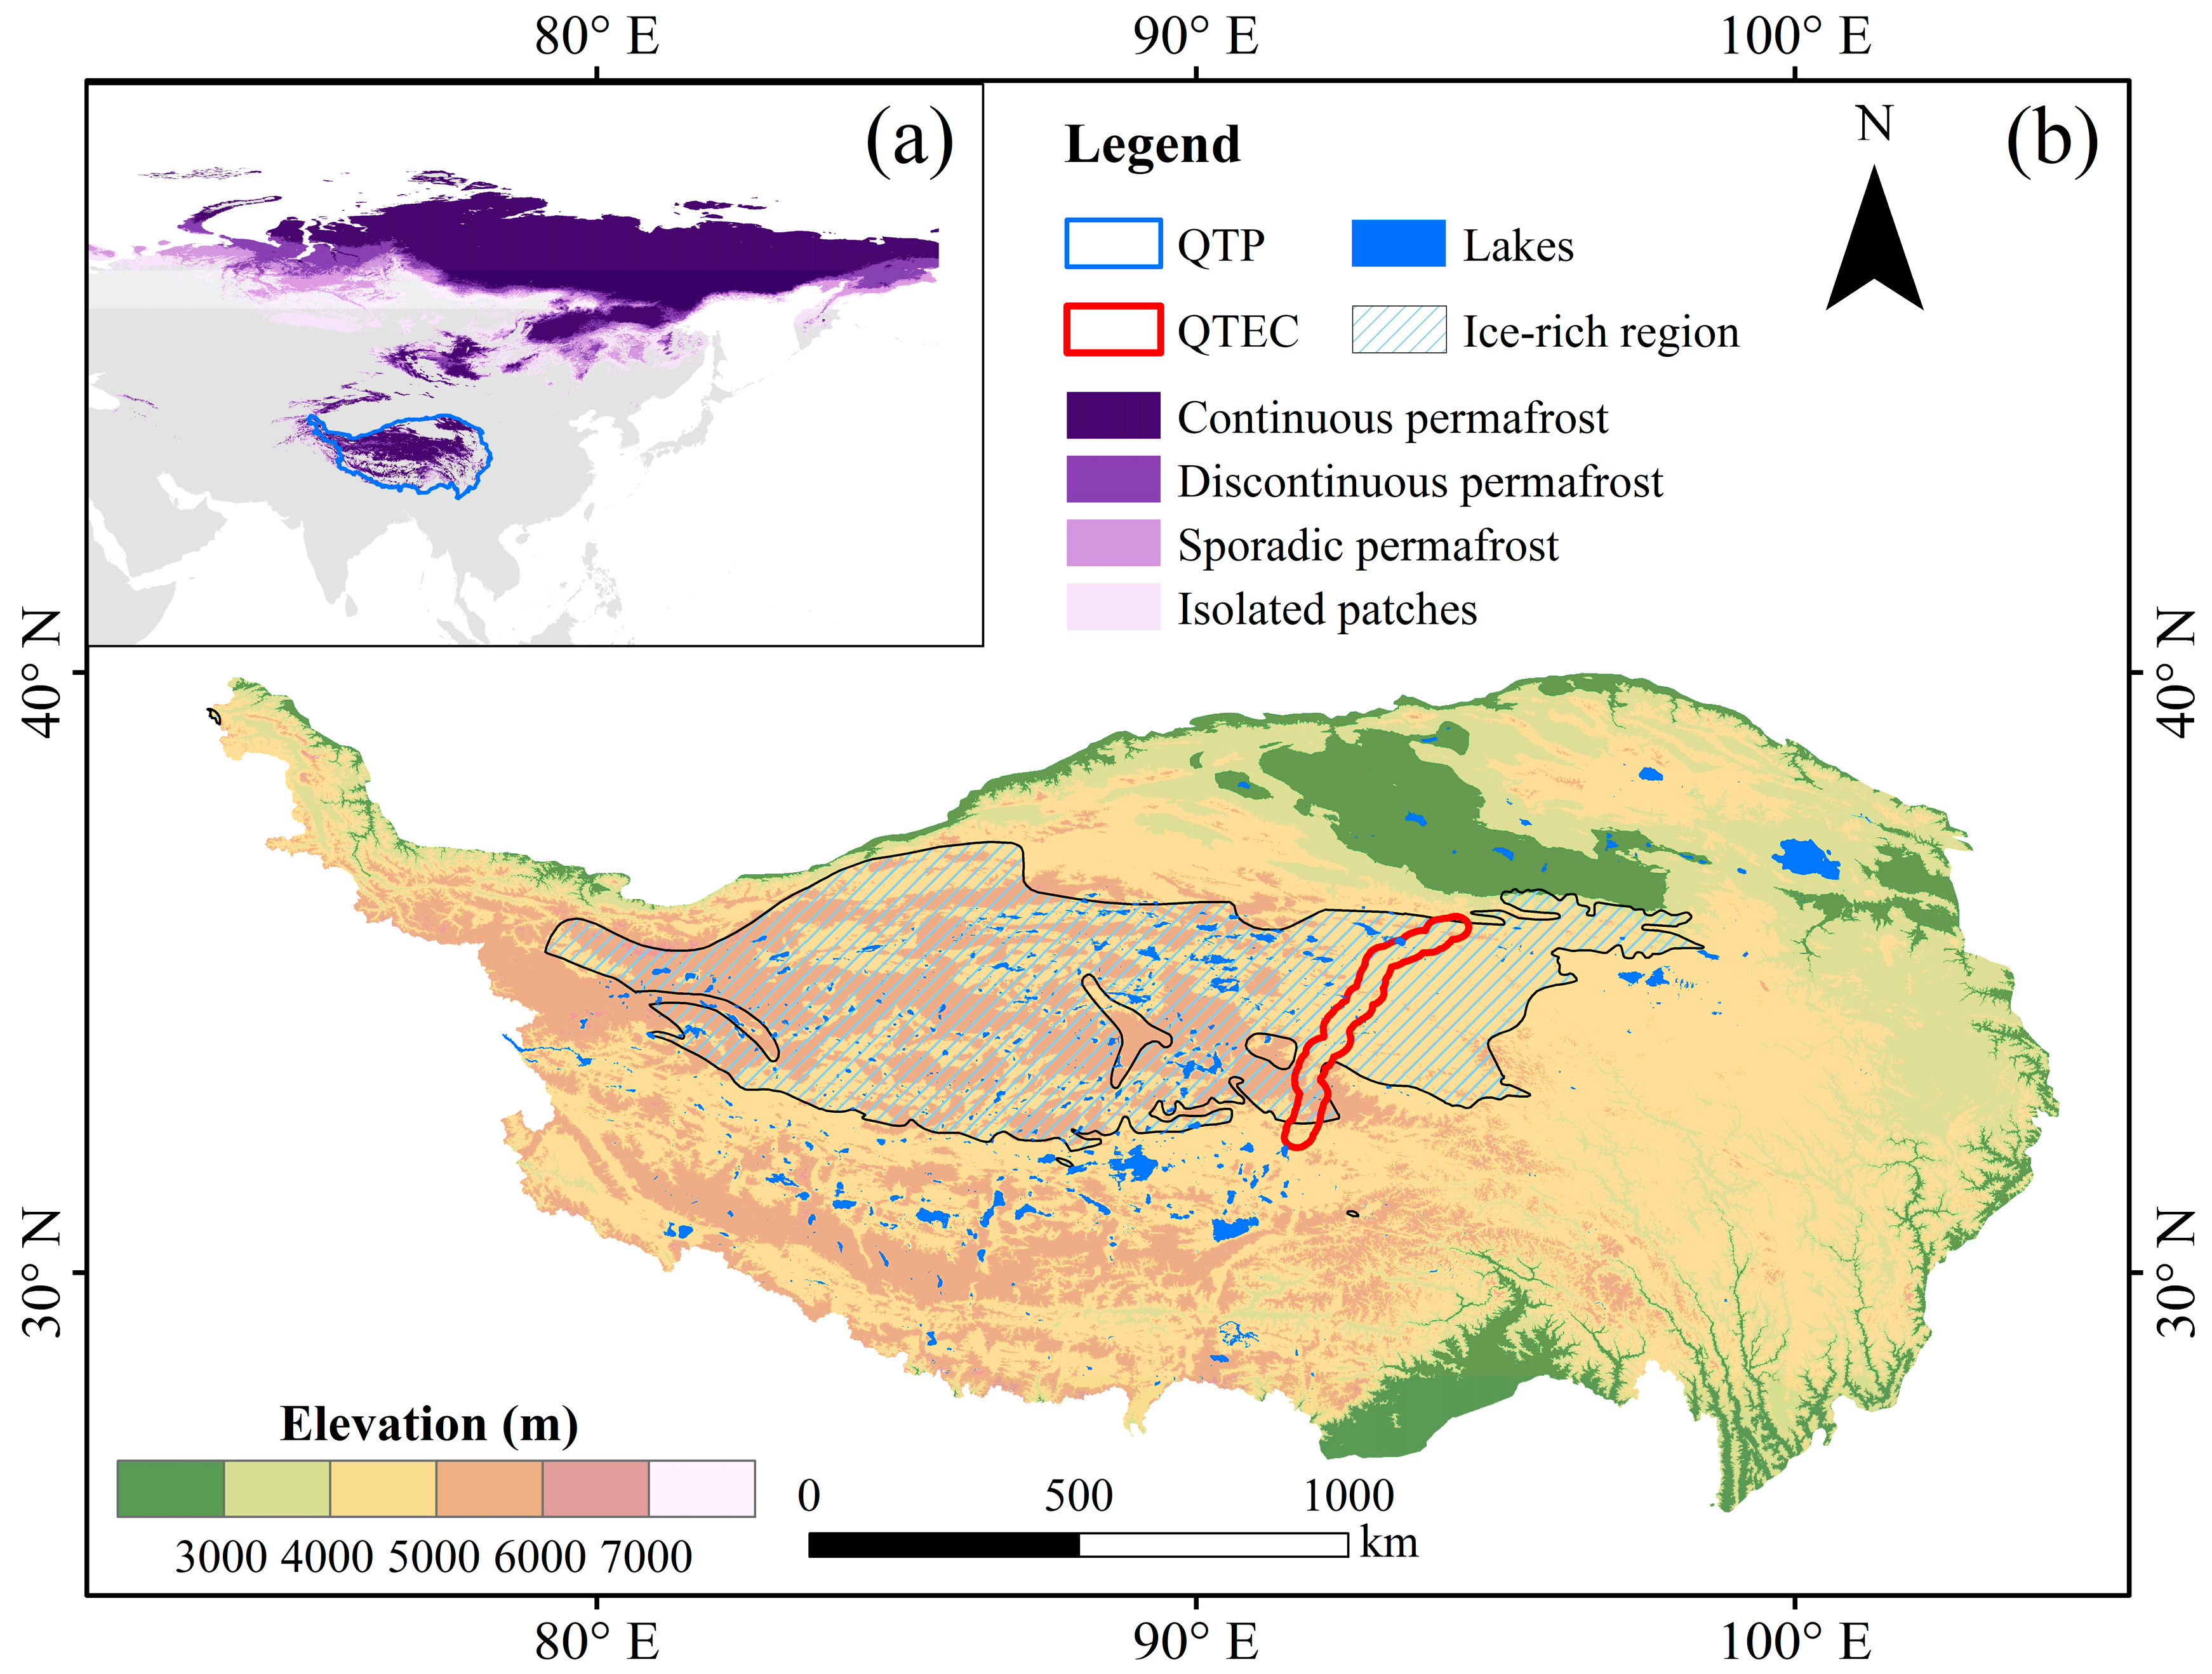
2.1. Study Area

The QTP covers an area of about 2.60 × 10⁶ km2, with a longitude of 73–104°E and a latitude of 26–40°N (Figure 1). The QTP is the highest plateau on the Earth, with an average altitude of about 4000 m, and is known as “the Roof of the World”. The QTP is also referred to as “the Water Tower of Asia” because it is the birthplace of many major Asian rivers [5]. In addition, the area of lakes larger than 1 km2 on the QTP is about 46,000 km2, accounting for about half of the lake area in China [36]. The annual average temperature on the QTP is 4.1 °C, and the annual average precipitation is 482 mm between 1980 and 2018 [37]. The QTP is rich in permafrost and ground ice [38,39], the average mean annual ground temperature (MAGT) is about 1.56 °C, and the regional average active layer thickness (ALT) is 2.32 m [3]. The permafrost on the QTP is at risk of disappearing, which is predicted to be reduced to 42% of the present area under the RCP 8.5 [9].

2.2. Data Sources and Processing

2.2.1. Thermokarst Lake Inventory

The thermokarst lake inventory presented the spatial distribution information of lakes and was obtained from existing datasets established by Wei et al. (2021). The Sentinel-2 satellite imagery was used to map water bodies with a spatial resolution of 10 m. At present, there are no uniform selection criteria for thermokarst lakes [40]. In general, studies consider small lakes located within permafrost-affected regions as thermokarst lakes [25,41,42]. Based on the previous research on the thermokarst lake susceptibility assessment [28], we refined the thermokarst lake dataset by limiting the area to within 1 km2. Meanwhile, thermokarst lakes larger than 1 km2 contributed only 0.22% of the total number in the dataset in the QTP. After removing the invalid value of the sample, a total of 136,187 thermokarst lakes were selected within the study area for subsequent analysis.
We randomly selected 10,000 thermokarst lake points from the total sample for machine-learning modeling. In addition, the unbalanced positive and negative sample sizes are responsible for the poor performance of susceptibility models [43]. For this reason, we randomly generated the same number of non-thermokarst lake points as thermokarst lake points in areas without thermokarst lakes to guarantee the reliability of the susceptibility assessment. The entire sample dataset, including the positive and negative samples (i.e., thermokarst lakes and non-thermokarst lakes), was split into training data and testing data for subsequent machine-learning modeling.

2.2.2. Conditioning Factors

Conditioning factors are critical for susceptibility modeling and mapping. Based on the development and data availability of thermokarst lakes and referring to information from existing studies [14,15,28,30], we selected eight conditioning factors for susceptibility modeling, representing topography, permafrost, hydrology, vegetation, climate, and soil (Figure 2).
Topography is an essential modifying factor determining how permafrost thaw manifests itself in landscapes [44]. Topographic parameters, including slope and aspect, were calculated from the digital elevation model. Permafrost-related data, such as MAGT and ALT, which are important indicators of permafrost thermal state and affect the occurrence of thermokarst lakes, were obtained from public datasets with a period of 2000–2016 [3]. The topographic wetness index (TWI) quantifies topographic control of hydrological processes [45]. Areas of high TWI have abundant soil moisture to facilitate ground ice formation [46]. Vegetation can reduce solar radiation and thus maintain the thermal stability of permafrost [47]. Here, the Normalized Difference Vegetation Index (NDVI) was considered as a conditioning factor by calculating the average of the annual mean values from 2000 to 2016 based on Google Earth Engine (GEE) [48]. Climate factors, such as rainfall, alter the thermal regime of permafrost and accelerate permafrost thawing while also affecting the dynamics of thermokarst lakes [44,49,50]. The rainfall was calculated as the average of rainfall between 2000 and 2016. Fine soil content (FSC), including clay and silt, helps to accommodate excess ice [28,51], which facilitates the formation of thermokarst lakes. In addition, conditioning factors under three future scenarios (i.e., RCP 2.6, RCP 4.5, RCP 8.5) were obtained for the thermokarst lake susceptibility assessment (Figure S1). These conditioning factors, including rainfall on the basis of the MIROC5 model, MAGT, and ALT in the 2070s, were downloaded from publicly available datasets [9,52]. Detailed information on conditioning factors can be found in Table S1. Finally, all the thematic layer data were clipped to the study area and resampled to a spatial resolution of 1000 m.

2.2.3. Multicollinearity Test

Multicollinearity occurs when the conditioning factors are highly correlated. Multicollinearity check is an indispensable step before susceptibility modeling because multicollinearity may lead to some errors in prediction results [53,54]. The statistical method, namely variance inflation factor (VIF) and tolerance (TOL), is commonly used to detect multicollinearity problems among conditioning factors [28,30]. VIF > 10 or TOL < 0.1 means that there is a multicollinearity problem among the conditioning factors, and the corresponding factors need to be eliminated [55]. According to the results presented in Table 1, the conditioning factors selected in this paper were suitable.

2.3. Modelling Methods

2.3.1. Frequency Ratio

The frequency ratio (FR) model is an effective tool for exploring the relationship between sample points and their condition factors [29,53]. The FR value refers to the ratio of thermokarst lakes under a specific class to the whole, relative to the ratio of the area of this category to the conditioning factor. The FR value can be calculated according to the following formula (Equation (1)). If FR < 1, it means that the specific class of conditioning factor is unfavorable for the occurrence of thermokarst lakes, on the contrary, it indicates that it is conducive to the occurrence of thermokarst lakes.
FR = C / C S / S
where C is the number of thermokarst lakes under a specific class, C is the total number of thermokarst lakes, S is the area of a specific class, and S is the total area of the conditioning factor.
We reclassified the conditioning factors to perform the FR correlation analysis, and the classes of the above factors were listed in Table 2.

2.3.2. Machine Learning Model

Three machine-learning methods, namely logistic regression (LR), random forest (RF), and extremely randomized trees (EXT) [56,57,58], were implemented for the thermokarst lake susceptibility assessment in this paper. The flowchart used for thermokarst lake modeling is depicted in Figure 3. First, we constructed an inventory of thermokarst lakes and conditioning factors in the present (2000–2016), as well as conditioning factors in future scenarios (the 2070s). We used VIF and TOL to detect multicollinearity problems in the dataset and performed the FR correlation analysis on samples that passed the multicollinearity check. Second, we used the dataset containing positive and negative samples for the construction of the three models. The sample dataset was randomly divided into training data (70%) and testing data (30%) proportionally based on Python 3.9.12. The three models were trained 30 times using different sample data combinations, and for each time modeling, the samples were randomly divided into training data and testing data according to the above ratio. After each training, model assessments and comparisons were obtained using Accuracy, Precision, Recall, F1-score, and the area under the ROC curve (AUC). Third, TLSMs based on three models were compared, and the uncertainties of the results were assessed. Then, the best-performing model was selected to predict the spatial distribution of susceptibility in future scenarios. Moreover, the relative importance of each conditioning factor was acquired based on the RF and EXT models, and the road risk of the QTEC was analyzed and discussed.

2.3.3. Model Performance

Thermokarst lake susceptibility assessment is a classification task in machine learning; therefore, we selected indicators such as Accuracy, Precision, Recall, and F1-score to evaluate the performance of machine-learning models based on similar studies [28,29,59]. These formulas are shown in Equations (2)–(5). In addition, the area under the ROC curve (AUC) can quantitatively reflect the model performance as follows: excellent (0.9–1), very good (0.8–0.9), good (0.7–0.8), moderate (0.6–0.7), and poor (0.5–0.6) [60]; therefore, it was also chosen to evaluate the model performance. In each modeling process, the testing data was used to evaluate the model’s capability based on the above indicators.
Accuracy = TP + TN TP + FP + TN + FN
Precision = TP TP + FP
Recall = TP TP + FN
F 1 score = 2 × Precision × Recall Precision + Recall
where TP (true positive) and TN (true negative) indicate the number of correctly classified positive and negative samples, respectively, while FP (false positive) and FN (false negative) denote their opposite numbers, respectively.

2.3.4. Uncertainty Assessment

The coefficient of variation (CV) was chosen to quantify the spatial distribution of the uncertainty of TLSMs. The CV value was calculated as the ratio of the standard deviation to the mean. For each model, we calculated the mean and standard deviation of each pixel of the 30 TLSMs. Finally, the uncertainty of the TLSM produced by each model was analyzed.

3. Results

3.1. Relationship between Thermokarst Lakes and Conditioning Factors

The FR values and the number of thermokarst lakes under different classes were presented in Figure 4. From the perspective of the slope, the maximum FR value and the corresponding number of thermokarst lakes in Class 1 (<2.94°) were 2.39 and 128,695, respectively, which were favorable for the formation of thermokarst lakes. As for the aspect, the FR values were close to 1.10 in the north, northeast, and south, and the numbers of thermokarst lakes were 23,248, 21,059, and 19,856, respectively. The results of MAGT showed that the FR value and the number of thermokarst lakes presented the same distribution, while the FR value and the number of thermokarst lakes of Class 4, Class 5, and Class 6 were all higher, indicating that higher MAGT was favorable for the occurrence of thermokarst lakes. In terms of ALT, the FR values of ALT in Classes 1, 2, 5, and 6 were all greater than 1. Considering the number of thermokarst lakes, ALT of Class 2 (122.46–173.55 cm) and Class 5 (275.71–326.80 cm) were conducive to the formation of thermokarst lakes. High TWI values indicate high soil moisture content. The analysis results displayed that higher TWI values had relatively higher FR values and the number of thermokarst lakes. The TWI values of Class 5 (0.58–1.84) and Class 6 (>1.84) were both over 2.50, and the corresponding numbers of thermokarst lakes were 47,297 and 20,537, respectively. High vegetation coverage can protect permafrost degradation [31], which is consistent with the number distribution of thermokarst lakes presented in Figure 4f. For NDVI, Class 5 (0.16–0.26) was favorable for the occurrence of thermokarst lakes, and the FR value and number of thermokarst lakes were 3.69 and 28,847, respectively. Rainfall is an important factor in maintaining the water storage of thermokarst lakes [17]. For rainfall, Class 4 (300–400 mm) had the highest FR value (1.54), and the corresponding number of thermokarst lakes was 30,923. Soil particle size is usually associated with water migration, and field investigations have shown that thermokarst processes occur in fine soil regions [30]. As for FSC, Class 3 (50–60%) was favorable for the occurrence of thermokarst lakes (FR = 1.44), corresponding to the number of thermokarst lakes was 73,241.

3.2. Performance of Model Prediction

We performed susceptibility modeling 30 times for each machine-learning method, each time, the same training data and testing data were used for the modeling and accuracy evaluation of the three models. The mean value of the accuracy evaluation results of 30 modeling processes was listed in Table 3. Overall, EXT had the best performance in the thermokarst lake susceptibility assessment, followed by RF and LR. EXT had the highest AUC, Accuracy, and F1-score (AUC = 0.900, Accuracy = 0.823, and F1-score = 0.829), which are indicators that reflect the overall capabilities of the model. RF also had a relatively good performance and was close to the EXT model, with an AUC value of 0.898, an Accuracy value of 0.821, and an F1-score value of 0.825. Compared with EXT and RF, LR had the lowest accuracy values in the susceptibility modeling process. In summary, the AUC values of EXT and RF were close to 0.9, indicating that both models performed well in the thermokarst lake susceptibility assessment.

3.3. Relative Importance of Conditioning Factors

The relative importance results of conditioning factors for thermokarst lake susceptibility modeling were obtained based on RF and EXT (Figure 5). Overall, the relative importance order results of each conditioning factor produced by the two machine-learning models were similar. Both results revealed that slope and TWI were the two most powerful conditioning factors to predict the occurrence probability of thermokarst lakes, while aspect seemed to be the least important factor in the thermokarst lake susceptibility assessment.

3.4. Generation of TLSMs

Three machine-learning techniques were implemented to generate TLSMs (Figure 6). According to previous studies [28], we divided the susceptibility results into five classes, i.e., very low, low, moderate, high, and very high, corresponding to probability values of 0.2, 0.4, 0.6, 0.8, and 1.0.
Overall, the three TLSMs can well represent the spatial distribution of thermokarst lakes. The proportion of high-susceptibility areas based on the LR model was larger, while the high-susceptibility areas based on the RF and EXT models were more concentrated. In general, the model is accurate when the density of positive samples increases from the low susceptibility class to the high susceptibility class and the area of the high susceptibility class occupies a small proportion [60]. To further demonstrate the results, a total of 136,187 thermokarst lakes were analyzed for the susceptibility map characteristics. The characteristics of different classes of susceptibility maps were listed in Table 4, Table 5 and Table 6. The results showed that all three models exhibited good accuracy, with thermokarst lake densities exceeding 95 in the very high susceptibility class. The best-performing model was EXT, with areas of high and very high susceptibility of 125,323 and 70,899 km2, accounting for 12.56% and 7.11%, respectively, with a density of about 130 in the very high susceptibility class.

3.5. Uncertainty Analysis of TLSMs

The CV is often used to assess the uncertainty of hazard susceptibility maps [32,33]. In this work, the CV was used to evaluate the susceptibility maps produced by three machine learning models, and the CV values were divided into five classes using the Natural Breaks method. As shown in Figure 7, most regions exhibited low uncertainty in these TLSMs. Basically, areas of high uncertainty were located where the susceptibility level was low. In the TLSMs produced by the three machine learning models, most of the thermokarst lake points (more than 95%) fell in the very low uncertainty region (Table 7, Table 8 and Table 9). Furthermore, for the RF and EXT models, none of the thermokarst lake points fell in the high and very high uncertainty regions, and the reliability of TLSM based on the EXT model was the best, with the low and very low areas accounting for nearly 90%. Overall, the uncertainty maps provided strong support for the reliability of these TLSMs.

3.6. TLSMs under the Future Scenarios

We used the EXT model to predict the spatial distribution of TLSM in future scenarios (the 2070s). Likewise, the TLSMs were divided into five classes, including very low, low, moderate, high, and very high. As shown in Figure 8, the total area of TLSMs showed a significant decrease due to permafrost degradation. The comparison of the areas under the present and RCPs scenarios was depicted in Table 10. In general, the total area of future TLSMs was reduced by 281,226, 481,157, and 627,803 km2 under the RCP 2.6, RCP 4.5, and RCP 8.5 scenarios, thus accounting for 28.20%, 48.24%, and 62.94% of the present TLSM. Most of the area reductions were in the very low susceptibility classes. Compared with the present TLSM, the relatively high susceptibility areas of TLSM (i.e., probability > 0.6) under the RCP 2.6, RCP 4.5, and RCP 8.5 scenarios were 192,744, 142,607, and 93,491 km2, accounting for 98.23%, 72.68%, and 47.65% of the corresponding area of the present TLSM, respectively. Although the degradation of permafrost will lead to a decrease in the area of relatively high-susceptibility areas, the interaction and impact of thermokarst lakes and permafrost cannot be ignored.

3.7. Potential Risk Analysis of the QTEC

The QTEC is an important traffic channel connecting the QTP and the inland cities of China, traversing about 550 km of permafrost regions [28,29]. Due to climate warming on the QTP, the thermokarst process induced by permafrost degradation has influenced the operation of the Qinghai–Tibet Railway (QTR) and Qinghai–Tibet Highway (QTH) [30,61]. The ecological environment of the QTEC is fragile [62], and at the same time, the permafrost of the QTEC is facing the risk of disappearing, threatening the infrastructure [9,10]. Therefore, it is necessary to evaluate these potential risks along the QTEC. The QTEC is defined as the 40 km wide transect of the QTH from Xidatan to Anduo [28]. The thermokarst lake susceptibility maps and potential risk analysis along the QTEC were shown in Figure 9. Overall, the total area of the susceptibility region was significantly reduced, from 19,157 km2 to 5302 km2 in the extreme scenario (RCP 8.5), accounting for 72.32% (Table 11). The very high-susceptibility areas were mainly distributed in the north of the QTEC. The length of the QTH in the high and very high susceptibility areas was 301.17 km, accounting for 48.78% of its entire length in the QTEC, and the potential high-risk region was located near Wudaoliang (Figure 9e). On the whole, the high-risk region is closely related to the undulation of the terrain, which may be because the relatively flat terrain is conducive to the formation of thermokarst lakes. The proportion of the very high susceptibility class in the QTEC was 25.38%, much higher than the corresponding area of the entire QTP (7.11%). In addition, in the 2070s, the entire susceptibility area in the QTEC was expected to decrease by about 70% of the present area. This will cause enormous economic losses and seriously threaten the infrastructure of the QTEC. Based on these findings, we call for enhanced infrastructure maintenance and urgent action to address climate warming.

4. Discussion

4.1. Comparison with Existing Studies

Thermokarst lake susceptibility assessment indicates the distribution of spatial occurrence probabilities. By integrating multiple conditioning factors and sample datasets into the models, the weight of each factor is determined by expert knowledge or statistical methods, and finally, the spatial distribution probability of thermokarst lakes in the region is obtained [15,28,30,31]. Previous studies mainly analyze the reliability of the results using training samples. In this paper, we acquired an additional dataset of thermokarst hazards (including thermokarst lake locations) in the QTEC not involved in model training to test the results from the Tibetan Plateau Data Center (TPDC) [63]. Accuracy evaluation with additional data can not only evaluate the generalization ability of the machine learning model to solve nonlinear problems but also enhance the reliability of the susceptibility results. As shown in Figure 10, most of the thermokarst lakes fell into the relatively high-susceptibility zone (i.e., probability > 0.6), which indicated the high accuracy of the TLSM. Statistics for different susceptibility classes of training data used in this paper and additional data from Niu and Luo (2022) were shown in Table 12. More than 90% of the thermokarst lake points were located in high and very high susceptible areas in both datasets, implying the good reliability of the results. The high accuracy from the additional data means that the susceptibility model has a good generalization ability, which can be applied to other regions. Li et al. (2022) assessed that 8.21% of the permafrost areas in the QTP were very highly susceptible class, covering 83.68% of the machine learning training data, and our results were that very high-susceptibility areas accounted for 7.11% of permafrost areas (Table 6), covering training 93.74% of the training data (Table 12), which indicated that our results were more accurate because the smaller susceptibility area covered a larger proportion of thermokarst lakes, but there were differences in other classes. It could be that the data used in our study were from 2000 to 2016, while in his study, they were mainly from 2018. In addition, Yin et al. (2021) evaluated the thermokarst lake susceptibility in the QTEC (total area of 22,448 km2) and reported that 20.79% of the QTEC (4668 km2) was classified as very highly susceptible, with a corresponding value of 21.66% (4862 km2) in this paper. Overall, comparisons with additional data and similar studies indicate good reliability in our results. In addition, uncertainty in susceptibility maps can lead to social costs [32]. Previous studies have not involved uncertainty analysis, whereas we assessed the uncertainty of the results using the CV. In this study, we also used machine-learning models to predict the distribution of thermokarst lakes in future scenarios, which provides a reference for related research.

4.2. Environmental Control Factors of Thermokarst Lakes

Conditions affecting permafrost degradation are often heterogeneous, leading to a diversity of thermokarst lake formation processes [64]. As for susceptibility evaluation, there are no fixed screening criteria for conditioning factors. Based on the mechanism of thermokarst lakes and existing research [14,15,28,30], we selected eight conditioning factors for machine-learning modeling. The multicollinearity test was performed on the conditioning factors, and the FR model was used to analyze the relationship between the conditioning factors and the occurrence of thermokarst lakes.
Permafrost degradation is an important reason for the formation of thermokarst lakes [17]. Permafrost areas are affected by multiple factors, such as surface thermal conditions, underground ice, topography, and hydrology [21], which lead to the formation of thermokarst lakes as a result of the combined effects of many factors. Based on similar studies [14,15,28,30], conditioning factors used in this paper involve six aspects, namely topography, permafrost, hydrology, vegetation, climate, and soil. Machine-learning models can assess the relative importance of conditioning factors in the modeling process [28,34]. However, the machine-learning models can only assess the importance of factors qualitatively. By combining the FR analysis, the relationship between thermokarst lakes and condition factors can be better explored. In this paper, two machine-learning models, namely RF and EXT, both considered slope and TWI as the most important factors determining the formation of thermokarst lakes. The results based on the FR model showed that slope (<2.94°) and TWI (0.58–1.84) were favorable for the formation of thermokarst lakes, and the corresponding quantities were 128,695 and 47,297, respectively. In addition, the central region of the QTP is rich in ice content (Figure 1), which facilitates the formation of thermokarst lakes [17]. Therefore, we concluded that areas that were flat and had high soil moisture were prone to thermokarst lake formation when ice-rich permafrost degraded.

4.3. Uncertainties and Future Works

Low-accuracy susceptibility maps lead to economic losses, while conditioning factors and models are responsible for accurate susceptibility maps [30,65]. Basically, thermokarst lakes develop from the top-down thawing process of ice-rich permafrost [14], which means that accurate permafrost data layers are beneficial for susceptibility assessment. MAGT and ALT reflect the thermal state of permafrost, but the ALT simulation results are uncertain [9,66], which may affect the process of machine-learning modeling. In this paper, we collected permafrost and precipitation under future scenarios to predict the spatial distribution of thermokarst lakes; however, the vegetation remained unchanged during the prediction due to the lack of datasets under future scenarios. In order to measure whether it leads to result errors, we trained an EXT model without the NDVI factor. The model performance was shown in Table S2. The results proved that NDVI had negligible impact on the results, which showed that the future susceptibility results were reliable. In addition, the initial data layer has a rough spatial resolution (70–400 km) in future scenarios, which cannot meet the mapping requirements, and accurate downscaling data will be beneficial. As for the models, we compared the performance of the LR, RF, and EXT models, and the results proved that the RF and EXT models had relatively high accuracy. In landslide susceptibility studies, convolutional neural networks and deep residual networks have been shown to outperform traditional machine-learning methods [59,67]. Furthermore, the uncertainty of susceptibility maps can be reduced by ensemble models [33]. Therefore, in future work, it is worth trying to introduce the hybrid ensemble deep learning framework into the thermokarst lake susceptibility assessment in order to further improve the accuracy and reliability of the results.

5. Conclusions

In this study, we used the FR model to analyze the relationship between thermokarst lakes and their condition factors and implemented machine-learning models to obtain the spatial distribution of thermokarst lake susceptibility across the QTP at present and in the future (the 2070s). The result based on the best-performing model (EXT) showed that 19.67% of the QTP permafrost regions were located in high- and very high-susceptibility areas, covering 89.62% of the number of thermokarst lakes. In addition, the CV map showed low uncertainty in most regions, indicating the reliability of the susceptibility map. In the future, the area of high to very high susceptibility was reduced to 47.65% of the corresponding class of the present susceptibility map under the RCP 8.5 scenario. In addition, we found that slope and TWI were the two most important factors for susceptibility modeling, and the FR model results showed that slope (<2.94°) and TWI (0.58–1.84) were the main distribution areas of thermokarst lakes. The results will provide a scientific basis for thermokarst lake dynamics and engineering design.

Supplementary Materials

The following supporting information can be downloaded at: https://www.mdpi.com/article/10.3390/rs15133331/s1, Table S1: Conditioning factors used in machine learning modeling; Table S2: The influence of NDVI on modeling; Figure S1: MAGT, ALT, and Rainfall for RCP 2.6, RCP 4.5, and RCP 8.5 scenarios [3,9,52,68,69,70,71].

Author Contributions

Conceptualization, R.W. and L.G.; methodology, R.W. and Y.Y.; validation, R.W. and Y.Y.; formal analysis, R.W.; investigation, H.Z. and H.J.; resources, L.L.; data curation, R.W. and B.D.; writing—original draft preparation, R.W.; writing—review and editing, R.W., J.L. and L.G.; visualization, R.W.; supervision, J.L. and L.G.; funding acquisition, L.L. All authors have read and agreed to the published version of the manuscript.

Funding

This research was funded by the Second Tibetan Plateau Scientific Expedition and Research Program (STEP), grant number 2019QZKK0906.

Acknowledgments

We would like to thank the editor and reviewers for their comments. We also thank the National Tibetan Plateau Data Center for providing the additional dataset.

Conflicts of Interest

The authors declare no conflict of interest.

References

  1. Qiu, J. China: The Third Pole. Nature 2008, 454, 393–396. [Google Scholar] [CrossRef] [Green Version]
  2. Zou, D.; Zhao, L.; Sheng, Y.; Chen, J.; Hu, G.; Wu, T.; Wu, J.; Xie, C.; Wu, X.; Pang, Q.; et al. A New Map of Permafrost Distribution on the Tibetan Plateau. Cryosphere 2017, 11, 2527–2542. [Google Scholar] [CrossRef] [Green Version]
  3. Ran, Y.; Li, X.; Cheng, G.; Che, J.; Aalto, J.; Karjalainen, O.; Hjort, J.; Luoto, M.; Jin, H.; Obu, J.; et al. New High-Resolution Estimates of the Permafrost Thermal State and Hydrothermal Conditions over the Northern Hemisphere. Earth Syst. Sci. Data 2022, 14, 865–884. [Google Scholar] [CrossRef]
  4. Wang, X.; Ran, Y.; Pang, G.; Chen, D.; Su, B.; Chen, R.; Li, X.; Chen, H.W.; Yang, M.; Gou, X.; et al. Contrasting Characteristics, Changes, and Linkages of Permafrost between the Arctic and the Third Pole. Earth-Sci. Rev. 2022, 230, 104042. [Google Scholar] [CrossRef]
  5. Yao, T.; Bolch, T.; Chen, D.; Gao, J.; Immerzeel, W.; Piao, S.; Su, F.; Thompson, L.; Wada, Y.; Wang, L.; et al. The Imbalance of the Asian Water Tower. Nat. Rev. Earth Environ. 2022, 3, 618–632. [Google Scholar] [CrossRef]
  6. Luo, D.; Wu, Q.; Jin, H.; Marchenko, S.S.; Lü, L.; Gao, S. Recent Changes in the Active Layer Thickness across the Northern Hemisphere. Environ. Earth Sci. 2016, 75, 555. [Google Scholar] [CrossRef]
  7. Ran, Y.; Li, X.; Cheng, G. Climate Warming over the Past Half Century Has Led to Thermal Degradation of Permafrost on the Qinghai–Tibet Plateau. Cryosphere 2018, 12, 595–608. [Google Scholar] [CrossRef] [Green Version]
  8. Wu, Q.; Zhang, T. Recent Permafrost Warming on the Qinghai-Tibetan Plateau. J. Geophys. Res. Atmos. 2008, 113, D13108. [Google Scholar] [CrossRef]
  9. Ni, J.; Wu, T.; Zhu, X.; Hu, G.; Zou, D.; Wu, X.; Li, R.; Xie, C.; Qiao, Y.; Pang, Q.; et al. Simulation of the Present and Future Projection of Permafrost on the Qinghai-Tibet Plateau with Statistical and Machine Learning Models. J. Geophys. Res. Atmos. 2021, 126, e2020JD033402. [Google Scholar] [CrossRef]
  10. Zhang, G.; Nan, Z.; Hu, N.; Yin, Z.; Zhao, L.; Cheng, G.; Mu, C. Qinghai-Tibet Plateau Permafrost at Risk in the Late 21st Century. Earths Future 2022, 10, e2022EF002652. [Google Scholar] [CrossRef]
  11. Farquharson, L.M.; Mann, D.H.; Grosse, G.; Jones, B.M.; Romanovsky, V.E. Spatial Distribution of Thermokarst Terrain in Arctic Alaska. Geomorphology 2016, 273, 116–133. [Google Scholar] [CrossRef] [Green Version]
  12. Xu, Z.; Jiang, L.; Guo, R.; Huang, R.; Zhou, Z.; Niu, F.; Jiao, Z. Interaction of Permafrost Degradation and Thermokarst Lakes in the Qinghai–Tibet Plateau. Geomorphology 2023, 425, 108582. [Google Scholar] [CrossRef]
  13. Hjort, J.; Streletskiy, D.; Doré, G.; Wu, Q.; Bjella, K.; Luoto, M. Impacts of Permafrost Degradation on Infrastructure. Nat. Rev. Earth Environ. 2022, 3, 24–38. [Google Scholar] [CrossRef]
  14. Jones, B.M.; Grosse, G.; Farquharson, L.M.; Roy-Léveillée, P.; Veremeeva, A.; Kanevskiy, M.Z.; Gaglioti, B.V.; Breen, A.L.; Parsekian, A.D.; Ulrich, M.; et al. Lake and Drained Lake Basin Systems in Lowland Permafrost Regions. Nat. Rev. Earth Environ. 2022, 3, 85–98. [Google Scholar] [CrossRef]
  15. Olefeldt, D.; Goswami, S.; Grosse, G.; Hayes, D.; Hugelius, G.; Kuhry, P.; McGuire, A.D.; Romanovsky, V.E.; Sannel, A.B.K.; Schuur, E.A.G.; et al. Circumpolar Distribution and Carbon Storage of Thermokarst Landscapes. Nat. Commun. 2016, 7, 13043. [Google Scholar] [CrossRef] [Green Version]
  16. Walter, K.M.; Zimov, S.A.; Chanton, J.P.; Verbyla, D.; Chapin, F.S. Methane Bubbling from Siberian Thaw Lakes as a Positive Feedback to Climate Warming. Nature 2006, 443, 71–75. [Google Scholar] [CrossRef] [PubMed]
  17. Grosse, G.; Jones, B.M.; Arp, C.D. Thermokarst Lakes, Drainage, and Drained Basins. In Treatise on Geomorphology; Shroder, J.F., Ed.; Elsevier: Amsterdam, The Netherlands, 2013; Volume 8, pp. 325–353. [Google Scholar]
  18. Lin, Z.; Luo, J.; Niu, F. Development of a Thermokarst Lake and Its Thermal Effects on Permafrost over Nearly 10 Yr in the Beiluhe Basin, Qinghai-Tibet Plateau. Geosphere 2016, 12, 632–643. [Google Scholar] [CrossRef] [Green Version]
  19. Lin, Z.J.; Niu, F.J.; Fang, J.H.; Luo, J.; Yin, G.A. Interannual Variations in the Hydrothermal Regime around a Thermokarst Lake in Beiluhe, Qinghai-Tibet Plateau. Geomorphology 2017, 276, 16–26. [Google Scholar] [CrossRef]
  20. Peng, E.-X.; Sheng, Y.; Hu, X.-Y.; Wu, J.-C.; Cao, W. Thermal Effect of Thermokarst Lake on the Permafrost under Embankment. Adv. Clim. Chang. Res. 2021, 12, 76–82. [Google Scholar] [CrossRef]
  21. Nitze, I.; Grosse, G.; Jones, B.M.; Romanovsky, V.E.; Boike, J. Remote Sensing Quantifies Widespread Abundance of Permafrost Region Disturbances across the Arctic and Subarctic. Nat. Commun. 2018, 9, 5423. [Google Scholar] [CrossRef] [PubMed] [Green Version]
  22. Niu, F.; Lin, Z.; Liu, H.; Lu, J. Characteristics of Thermokarst Lakes and Their Influence on Permafrost in Qinghai–Tibet Plateau. Geomorphology 2011, 132, 222–233. [Google Scholar] [CrossRef]
  23. Wei, Z.; Du, Z.; Wang, L.; Lin, J.; Feng, Y.; Xu, Q.; Xiao, C. Sentinel-Based Inventory of Thermokarst Lakes and Ponds Across Permafrost Landscapes on the Qinghai-Tibet Plateau. Earth Space Sci. 2021, 8, e2021EA001950. [Google Scholar] [CrossRef]
  24. Luo, J.; Niu, F.; Lin, Z.; Liu, M.; Yin, G.; Gao, Z. Abrupt Increase in Thermokarst Lakes on the Central Tibetan Plateau over the Last 50 Years. CATENA 2022, 217, 106497. [Google Scholar] [CrossRef]
  25. Luo, J.; Niu, F.; Lin, Z.; Liu, M.; Yin, G. Thermokarst Lake Changes between 1969 and 2010 in the Beilu River Basin, Qinghai–Tibet Plateau, China. Sci. Bull. 2015, 60, 556–564. [Google Scholar] [CrossRef] [Green Version]
  26. Șerban, R.-D.; Jin, H.; Șerban, M.; Luo, D. Shrinking Thermokarst Lakes and Ponds on the Northeastern Qinghai-Tibet Plateau over the Past Three Decades. Permafr. Periglac. Process. 2021, 32, 601–617. [Google Scholar] [CrossRef]
  27. Ding, Y.; Mu, C.; Wu, T.; Hu, G.; Zou, D.; Wang, D.; Li, W.; Wu, X. Increasing Cryospheric Hazards in a Warming Climate. Earth-Sci. Rev. 2021, 213, 103500. [Google Scholar] [CrossRef]
  28. Yin, G.; Luo, J.; Niu, F.; Zhou, F.; Meng, X.; Lin, Z.; Liu, M. Spatial Analyses and Susceptibility Modeling of Thermokarst Lakes in Permafrost Landscapes along the Qinghai–Tibet Engineering Corridor. Remote Sens. 2021, 13, 1974. [Google Scholar] [CrossRef]
  29. Li, R.; Zhang, M.; Pei, W.; Melnikov, A.; Zhang, Z.; Li, G. Risk Evaluation of Thaw Settlement Using Machine Learning Models for the Wudaoliang-Tuotuohe Region, Qinghai-Tibet Plateau. CATENA 2023, 220, 106700. [Google Scholar] [CrossRef]
  30. Li, R.; Zhang, M.; Konstantinov, P.; Pei, W.; Tregubov, O.; Li, G. Permafrost Degradation Induced Thaw Settlement Susceptibility Research and Potential Risk Analysis in the Qinghai-Tibet Plateau. CATENA 2022, 214, 106239. [Google Scholar] [CrossRef]
  31. Niu, F.; Lin, Z.; Lu, J.; Luo, J.; Wang, H. Assessment of Terrain Susceptibility to Thermokarst Lake Development along the Qinghai–Tibet Engineering Corridor, China. Environ. Earth Sci. 2015, 73, 5631–5642. [Google Scholar] [CrossRef]
  32. Kim, H.G.; Lee, D.K.; Park, C.; Ahn, Y.; Kil, S.-H.; Sung, S.; Biging, G.S. Estimating Landslide Susceptibility Areas Considering the Uncertainty Inherent in Modeling Methods. Stoch. Environ. Res. Risk Assess. 2018, 32, 2987–3019. [Google Scholar] [CrossRef]
  33. Di Napoli, M.; Carotenuto, F.; Cevasco, A.; Confuorto, P.; Di Martire, D.; Firpo, M.; Pepe, G.; Raso, E.; Calcaterra, D. Machine Learning Ensemble Modelling as a Tool to Improve Landslide Susceptibility Mapping Reliability. Landslides 2020, 17, 1897–1914. [Google Scholar] [CrossRef]
  34. Lara, M.J.; Chen, Y.; Jones, B.M. Recent Warming Reverses Forty-Year Decline in Catastrophic Lake Drainage and Hastens Gradual Lake Drainage across Northern Alaska. Environ. Res. Lett. 2021, 16, 124019. [Google Scholar] [CrossRef]
  35. Nitze, I.; Grosse, G.; Jones, B.; Arp, C.; Ulrich, M.; Fedorov, A.; Veremeeva, A. Landsat-Based Trend Analysis of Lake Dynamics across Northern Permafrost Regions. Remote Sens. 2017, 9, 640. [Google Scholar] [CrossRef] [Green Version]
  36. Zhang, G.; Ran, Y.; Wan, W.; Luo, W.; Chen, W.; Xu, F. 100 Years of Lake Evolution over the Qinghai-Tibet Plateau. Earth Syst. Sci. Data 2021, 13, 3951–3966. [Google Scholar] [CrossRef]
  37. Zhang, G.; Yao, T.; Xie, H.; Yang, K.; Zhu, L.; Shum, C.K.; Bolch, T.; Yi, S.; Allen, S.; Jiang, L.; et al. Response of Tibetan Plateau’s Lakes to Climate Change: Trends, Patterns, and Mechanisms. Earth-Sci. Rev. 2020, 208, 103269. [Google Scholar] [CrossRef]
  38. Brown, J.; Ferrians, O.J., Jr.; Heginbottom, J.A.; Melnikov, E.S. Circum-Arctic Map of Permafrost and Ground-Ice Conditions; Circum-Pacific Map. 1997. Available online: http://pubs.er.usgs.gov/publication/cp45 (accessed on 18 June 2023).
  39. Obu, J.; Westermann, S.; Bartsch, A.; Berdnikov, N.; Christiansen, H.H.; Dashtseren, A.; Delaloye, R.; Elberling, B.; Etzelmüller, B.; Kholodov, A.; et al. Northern Hemisphere Permafrost Map Based on TTOP Modelling for 2000–2016 at 1 Km2 Scale. Earth-Sci. Rev. 2019, 193, 299–316. [Google Scholar] [CrossRef]
  40. Mu, C.; Abbott, B.W.; Norris, A.J.; Mu, M.; Fan, C.; Chen, X.; Jia, L.; Yang, R.; Zhang, T.; Wang, K.; et al. The Status and Stability of Permafrost Carbon on the Tibetan Plateau. Earth-Sci. Rev. 2020, 211, 103433. [Google Scholar] [CrossRef]
  41. Polishchuk, Y.M.; Bogdanov, A.N.; Muratov, I.N.; Polishchuk, V.Y.; Lim, A.; Manasypov, R.M.; Shirokova, L.S.; Pokrovsky, O.S. Minor Contribution of Small Thaw Ponds to the Pools of Carbon and Methane in the Inland Waters of the Permafrost-Affected Part of the Western Siberian Lowland. Environ. Res. Lett. 2018, 13, 045002. [Google Scholar] [CrossRef] [Green Version]
  42. Șerban, R.-D.; Jin, H.; Șerban, M.; Luo, D.; Wang, Q.; Jin, X.; Ma, Q. Mapping Thermokarst Lakes and Ponds across Permafrost Landscapes in the Headwater Area of Yellow River on Northeastern Qinghai-Tibet Plateau. Int. J. Remote Sens. 2020, 41, 7042–7067. [Google Scholar] [CrossRef]
  43. Huang, Y.; Zhao, L. Review on Landslide Susceptibility Mapping Using Support Vector Machines. CATENA 2018, 165, 520–529. [Google Scholar] [CrossRef]
  44. Vonk, J.E.; Tank, S.E.; Bowden, W.B.; Laurion, I.; Vincent, W.F.; Alekseychik, P.; Amyot, M.; Billet, M.F.; Canário, J.; Cory, R.M.; et al. Reviews and Syntheses: Effects of Permafrost Thaw on Arctic Aquatic Ecosystems. Biogeosciences 2015, 12, 7129–7167. [Google Scholar] [CrossRef] [Green Version]
  45. Sørensen, R.; Zinko, U.; Seibert, J. On the Calculation of the Topographic Wetness Index: Evaluation of Different Methods Based on Field Observations. Hydrol. Earth Syst. Sci. 2006, 10, 101–112. [Google Scholar] [CrossRef] [Green Version]
  46. Lei, S.; Chen, H.; Bian, Z.; Liu, Z. Evaluation of Integrating Topographic Wetness Index with Backscattering Coefficient of TerraSAR-X Image for Soil Moisture Estimation in a Mountainous Region. Ecol. Indic. 2016, 61, 624–633. [Google Scholar] [CrossRef]
  47. Wang, P.; de Jager, J.; Nauta, A.; van Huissteden, J.; Trofim, M.C.; Limpens, J. Exploring Near-Surface Ground Ice Distribution in Patterned-Ground Tundra: Correlations with Topography, Soil and Vegetation. Plant Soil 2019, 444, 251–265. [Google Scholar] [CrossRef]
  48. Gorelick, N.; Hancher, M.; Dixon, M.; Ilyushchenko, S.; Thau, D.; Moore, R. Google Earth Engine: Planetary-Scale Geospatial Analysis for Everyone. Remote Sens. Environ. 2017, 202, 18–27. [Google Scholar] [CrossRef]
  49. Karjalainen, O.; Luoto, M.; Aalto, J.; Hjort, J. New Insights into the Environmental Factors Controlling the Ground Thermal Regime across the Northern Hemisphere: A Comparison between Permafrost and Non-Permafrost Areas. Cryosphere 2019, 13, 693–707. [Google Scholar] [CrossRef] [Green Version]
  50. Wen, Z.; Niu, F.; Yu, Q.; Wang, D.; Feng, W.; Zheng, J. The Role of Rainfall in the Thermal-Moisture Dynamics of the Active Layer at Beiluhe of Qinghai-Tibetan Plateau. Environ. Earth Sci. 2014, 71, 1195–1204. [Google Scholar] [CrossRef]
  51. Guodong, C. The Mechanism of Repeated-Segregation for the Formation of Thick Layered Ground Ice. Cold Reg. Sci. Technol. 1983, 8, 57–66. [Google Scholar] [CrossRef]
  52. Navarro-Racines, C.; Tarapues, J.; Thornton, P.; Jarvis, A.; Ramirez-Villegas, J. High-Resolution and Bias-Corrected CMIP5 Projections for Climate Change Impact Assessments. Sci. Data 2020, 7, 7. [Google Scholar] [CrossRef] [Green Version]
  53. Chen, X.; Chen, W. GIS-Based Landslide Susceptibility Assessment Using Optimized Hybrid Machine Learning Methods. CATENA 2021, 196, 104833. [Google Scholar] [CrossRef]
  54. Pourghasemi, H.R.; Sadhasivam, N.; Kariminejad, N.; Collins, A.L. Gully Erosion Spatial Modelling: Role of Machine Learning Algorithms in Selection of the Best Controlling Factors and Modelling Process. Geosci. Front. 2020, 11, 2207–2219. [Google Scholar] [CrossRef]
  55. Fan, X.; Yunus, A.P.; Scaringi, G.; Catani, F.; Siva Subramanian, S.; Xu, Q.; Huang, R. Rapidly Evolving Controls of Landslides After a Strong Earthquake and Implications for Hazard Assessments. Geophys. Res. Lett. 2021, 48, e2020GL090509. [Google Scholar] [CrossRef]
  56. Breiman, L. Random Forests. Mach. Learn. 2001, 45, 5–32. [Google Scholar] [CrossRef] [Green Version]
  57. Geurts, P.; Ernst, D.; Wehenkel, L. Extremely Randomized Trees. Mach. Learn. 2006, 63, 3–42. [Google Scholar] [CrossRef] [Green Version]
  58. LaValley, M.P. Logistic Regression. Circulation 2008, 117, 2395–2399. [Google Scholar] [CrossRef] [Green Version]
  59. Lv, L.; Chen, T.; Dou, J.; Plaza, A. A Hybrid Ensemble-Based Deep-Learning Framework for Landslide Susceptibility Mapping. Int. J. Appl. Earth Obs. Geoinf. 2022, 108, 102713. [Google Scholar] [CrossRef]
  60. Merghadi, A.; Yunus, A.P.; Dou, J.; Whiteley, J.; ThaiPham, B.; Bui, D.T.; Avtar, R.; Abderrahmane, B. Machine Learning Methods for Landslide Susceptibility Studies: A Comparative Overview of Algorithm Performance. Earth-Sci. Rev. 2020, 207, 103225. [Google Scholar] [CrossRef]
  61. Xu, X.-M.; Wu, Q.-B. Impact of Climate Change on Allowable Bearing Capacity on the Qinghai-Tibetan Plateau. Adv. Clim. Chang. Res. 2019, 10, 99–108. [Google Scholar] [CrossRef]
  62. Niu, F.; Yin, G.; Luo, J.; Lin, Z.; Liu, M. Permafrost Distribution along the Qinghai-Tibet Engineering Corridor, China Using High-Resolution Statistical Mapping and Modeling Integrated with Remote Sensing and GIS. Remote Sens. 2018, 10, 215. [Google Scholar] [CrossRef] [Green Version]
  63. Niu, F.; Luo, J. Distribution Data of Freezing-Thawing Hazards in Qinghai Tibet Engineering Corridor (2019–2020); A Big Earth Data Platform for Three Poles. 2022. Available online: https://poles.tpdc.ac.cn/en/data/8df419f2-b88c-4a39-a13b-3c7a82e8d367/?q=Distribution%20Data%20of%20Freezing-thawing%20Hazards%20in%20Qinghai%20Tibet%20Engineering%20Corridor%20(2019-2020) (accessed on 18 June 2023).
  64. Bouchard, F.; MacDonald, L.A.; Turner, K.W.; Thienpont, J.R.; Medeiros, A.S.; Biskaborn, B.K.; Korosi, J.; Hall, R.I.; Pienitz, R.; Wolfe, B.B. Paleolimnology of Thermokarst Lakes: A Window into Permafrost Landscape Evolution. Arct. Sci. 2017, 3, 91–117. [Google Scholar] [CrossRef] [Green Version]
  65. Thi Ngo, P.T.; Panahi, M.; Khosravi, K.; Ghorbanzadeh, O.; Kariminejad, N.; Cerda, A.; Lee, S. Evaluation of Deep Learning Algorithms for National Scale Landslide Susceptibility Mapping of Iran. Geosci. Front. 2021, 12, 505–519. [Google Scholar] [CrossRef]
  66. Aalto, J.; Karjalainen, O.; Hjort, J.; Luoto, M. Statistical Forecasting of Current and Future Circum-Arctic Ground Temperatures and Active Layer Thickness. Geophys. Res. Lett. 2018, 45, 4889–4898. [Google Scholar] [CrossRef] [Green Version]
  67. Liu, R.; Yang, X.; Xu, C.; Wei, L.; Zeng, X. Comparative Study of Convolutional Neural Network and Conventional Machine Learning Methods for Landslide Susceptibility Mapping. Remote Sens. 2022, 14, 321. [Google Scholar] [CrossRef]
  68. Yamazaki, D.; Ikeshima, D.; Tawatari, R.; Yamaguchi, T.; O’Loughlin, F.; Neal, J.C.; Sampson, C.C.; Kanae, S.; Bates, P.D. A High-Accuracy Map of Global Terrain Elevations. Geophys. Res. Lett. 2017, 44, 5844–5853. [Google Scholar] [CrossRef] [Green Version]
  69. Amatulli, G.; McInerney, D.; Sethi, T.; Strobl, P.; Domisch, S. Geomorpho90m, Empirical Evaluation and Accuracy Assessment of Global High-Resolution Geomorphometric Layers. Sci. Data 2020, 7, 162. [Google Scholar] [CrossRef]
  70. Poggio, L.; de Sousa, L.M.; Batjes, N.H.; Heuvelink, G.B.M.; Kempen, B.; Ribeiro, E.; Rossiter, D. SoilGrids 2.0: Producing Soil Information for the Globe with Quantified Spatial Uncertainty. SOIL 2021, 7, 217–240. [Google Scholar] [CrossRef]
  71. Abatzoglou, J.T.; Dobrowski, S.Z.; Parks, S.A.; Hegewisch, K.C. TerraClimate, a High-Resolution Global Dataset of Monthly Climate and Climatic Water Balance from 1958–2015. Sci. Data 2018, 5, 170191. [Google Scholar] [CrossRef] [Green Version]
Figure 1. Spatial distribution of the study area. (a) Location of the QTP across permafrost regions in the Northern Hemisphere [39]; (b) Geomorphological characteristics of the study area. Ground ice and lake are downloaded from publicly available datasets [36,38]. The terrain data is based on Google Earth Engine.
Remotesensing 15 03331 g001
Figure 2. Conditioning factors for thermokarst lake susceptibility modeling: (a) slope, (b) aspect, (c) MAGT, (d) ALT, (e) TWI, (f) NDVI, (g) rainfall, and (h) FSC.
Remotesensing 15 03331 g002
Figure 3. Flowchart of the thermokarst lake susceptibility assessment in this work.
Remotesensing 15 03331 g003
Figure 4. Relationship between thermokarst lakes and conditioning factors: (a) slope, (b) aspect, (c) MAGT, (d) ALT, (e) TWI, (f) NDVI, (g) rainfall, and (h) FSC.
Remotesensing 15 03331 g004aRemotesensing 15 03331 g004b
Figure 5. The relative importance analysis of conditioning factors: (a) RF model and (b) EXT model.
Remotesensing 15 03331 g005
Figure 6. Thermokarst lake susceptibility maps: (a) LR model, (b) RF model, and (c) EXT model.
Remotesensing 15 03331 g006
Figure 7. Uncertainty of thermokarst lake susceptibility maps: (a) LR model, (b) RF model, and (c) EXT model.
Remotesensing 15 03331 g007
Figure 8. Thermokarst lake susceptibility maps for different scenarios based on the EXT model: (a) RCP 2.6 scenario, (b) RCP 4.5 scenario, and (c) RCP 8.5 scenario.
Remotesensing 15 03331 g008
Figure 9. Thermokarst lake susceptibility assessment and potential risk analysis of the QTEC based on EXT model: (a) Present, (b) RCP 2.6 scenario, (c) RCP 4.5 scenario, (d) RCP 8.5 scenario, and (e) distribution of present susceptibility classes along the QTEC. (VH: very high, H: high, M: moderate, L: low, VL: very low, and NP: non-permafrost).
Remotesensing 15 03331 g009
Figure 10. Comparison between the TLSM and thermokarst lake distribution: (a) the TLSM based on the EXT model and (b) the distribution of thermokarst lakes.
Remotesensing 15 03331 g010
Table 1. Conditioning factors and the results of multicollinearity analysis.
Conditioning FactorsCollinearity Statistics
ToleranceVIF
Slope0.5341.874
Aspect0.9981.002
MAGT0.4442.254
ALT0.4242.359
TWI0.5491.823
NDVI0.6591.518
Rainfall0.3972.519
FSC0.5391.855
Table 2. Conditioning factors for thermokarst lakes and their classes.
Conditioning FactorsClasses
Slope (°)<2.94; 2.94–6.46; 6.46–10.76; 10.76–15.85; 15.85–22.50; >22.50
Aspect (°)N(0–22.5 and 337.5–360); NE (22.5–67.5); E (67.5–112.5); SE (112.5–157.5); S (157.5–202.5); SW (202.5–247.5); W (247.5–292.5); NW (292.5–337.5)
MAGT (°C)<(−2.5); (−2.5)–(−2); (−2)–(−1.5); (−1.5)–(−1); (−1)–(−0.5); >(−0.5)
ALT (cm)<122.46; 122.46–173.55; 173.55–224.63; 224.63–275.71; 275.71–326.80; >326.80
TWI<(−2.59); (−2.59)–(−1.55); (−1.55)–(−0.51); (−0.51)–0.58; 0.58–1.84; >1.84
NDVI<(−0.12); (−0.12)–(−0.02); (−0.02)–0.07; 0.07–0.16; 0.16–0.26; >0.26
Rainfall (mm)<100; 100–200; 200–300; 300–400; 400–500; >500
FSC (%)<40; 40–50; 50–60; 60–70; 70–80; >80
Table 3. The prediction capability of machine learning models.
ModelsAUCAccuracyRecallPrecisionF1-Score
LR0.8600.7870.8790.7430.805
RF0.8980.8210.8460.8050.825
EXT0.9000.8230.8620.7990.829
Table 4. Characteristics of different susceptibility classes based on the LR model.
ClassesArea Covered
(%)
Thermokarst Lake Covered (%)Thermokarst Lake Density (/100 km2)
Very Low45.741.720.51
Low13.372.542.59
Moderate14.538.257.75
High20.0043.1529.46
Very High6.3644.3495.20
Table 5. Characteristics of different susceptibility classes based on the RF model.
ClassesArea Covered
(%)
Thermokarst Lake Covered (%)Thermokarst Lake Density (/100 km2)
Very Low52.311.350.35
Low17.253.342.65
Moderate11.186.998.54
High11.0519.8124.47
Very High8.2165.50113.95
Table 6. Characteristics of different susceptibility classes based on the EXT model.
ClassesArea Covered
(%)
Thermokarst Lake Covered (%)Thermokarst Lake Density (/100 km2)
Very Low49.070.940.26
Low18.242.812.10
Moderate13.026.636.96
High12.5621.4523.31
Very High7.1168.17130.94
Table 7. Characteristics of different uncertainty classes based on the LR model.
ClassesArea Covered (%)Thermokarst Lake Covered (%)
Very Low46.3996.78
Low23.022.39
Medium16.650.65
High10.010.17
Very High3.930.01
Table 8. Characteristics of different uncertainty classes based on the RF model.
ClassesArea Covered (%)Thermokarst Lake Covered (%)
Very Low57.1798.50
Low30.341.46
Medium9.790.04
High2.200
Very High0.500
Table 9. Characteristics of different uncertainty classes based on the EXT model.
ClassesArea Covered (%)Thermokarst Lake Covered (%)
Very Low65.4198.92
Low24.521.07
Medium7.020.01
High2.440
Very High0.610
Table 10. Susceptibility map areas of the QTP under different RCPs.
ClassesPresent (km2)RCP 2.6 (km2)RCP 4.5 (km2)RCP 8.5 (km2)
Very Low489,440272,570183,549129,502
Low181,918133,723101,38580,859
Moderate129,834117,15188,71665,759
High125,323123,76793,20468,741
Very High70,89968,97749,40324,750
Table 11. Susceptibility map areas of the QTEC under different RCPs.
ClassesPresent (km2)RCP 2.6 (km2)RCP 4.5 (km2)RCP 8.5 (km2)
Very Low4965366219851287
Low292027231584891
Moderate264624541496848
High3764381129391429
Very High486237812562847
Table 12. Susceptibility map accuracy assessment based on training data and additional data.
ClassesNumber of
Training Data
Training Data Covered (%)Number of Additional DataAdditional Data Covered (%)
Very Low002821
Low006972.46
Moderate90.0916805.94
High6176.17606021.42
Very High937493.7419,57669.19
Disclaimer/Publisher’s Note: The statements, opinions and data contained in all publications are solely those of the individual author(s) and contributor(s) and not of MDPI and/or the editor(s). MDPI and/or the editor(s) disclaim responsibility for any injury to people or property resulting from any ideas, methods, instructions or products referred to in the content.

