
Insuring Alpine Grasslands against Drought-Related Yield Losses Using Sentinel-2 Satellite Data
 , , , ,
Abstract
:
1. Introduction
2. Study Area and Ground Data Collection
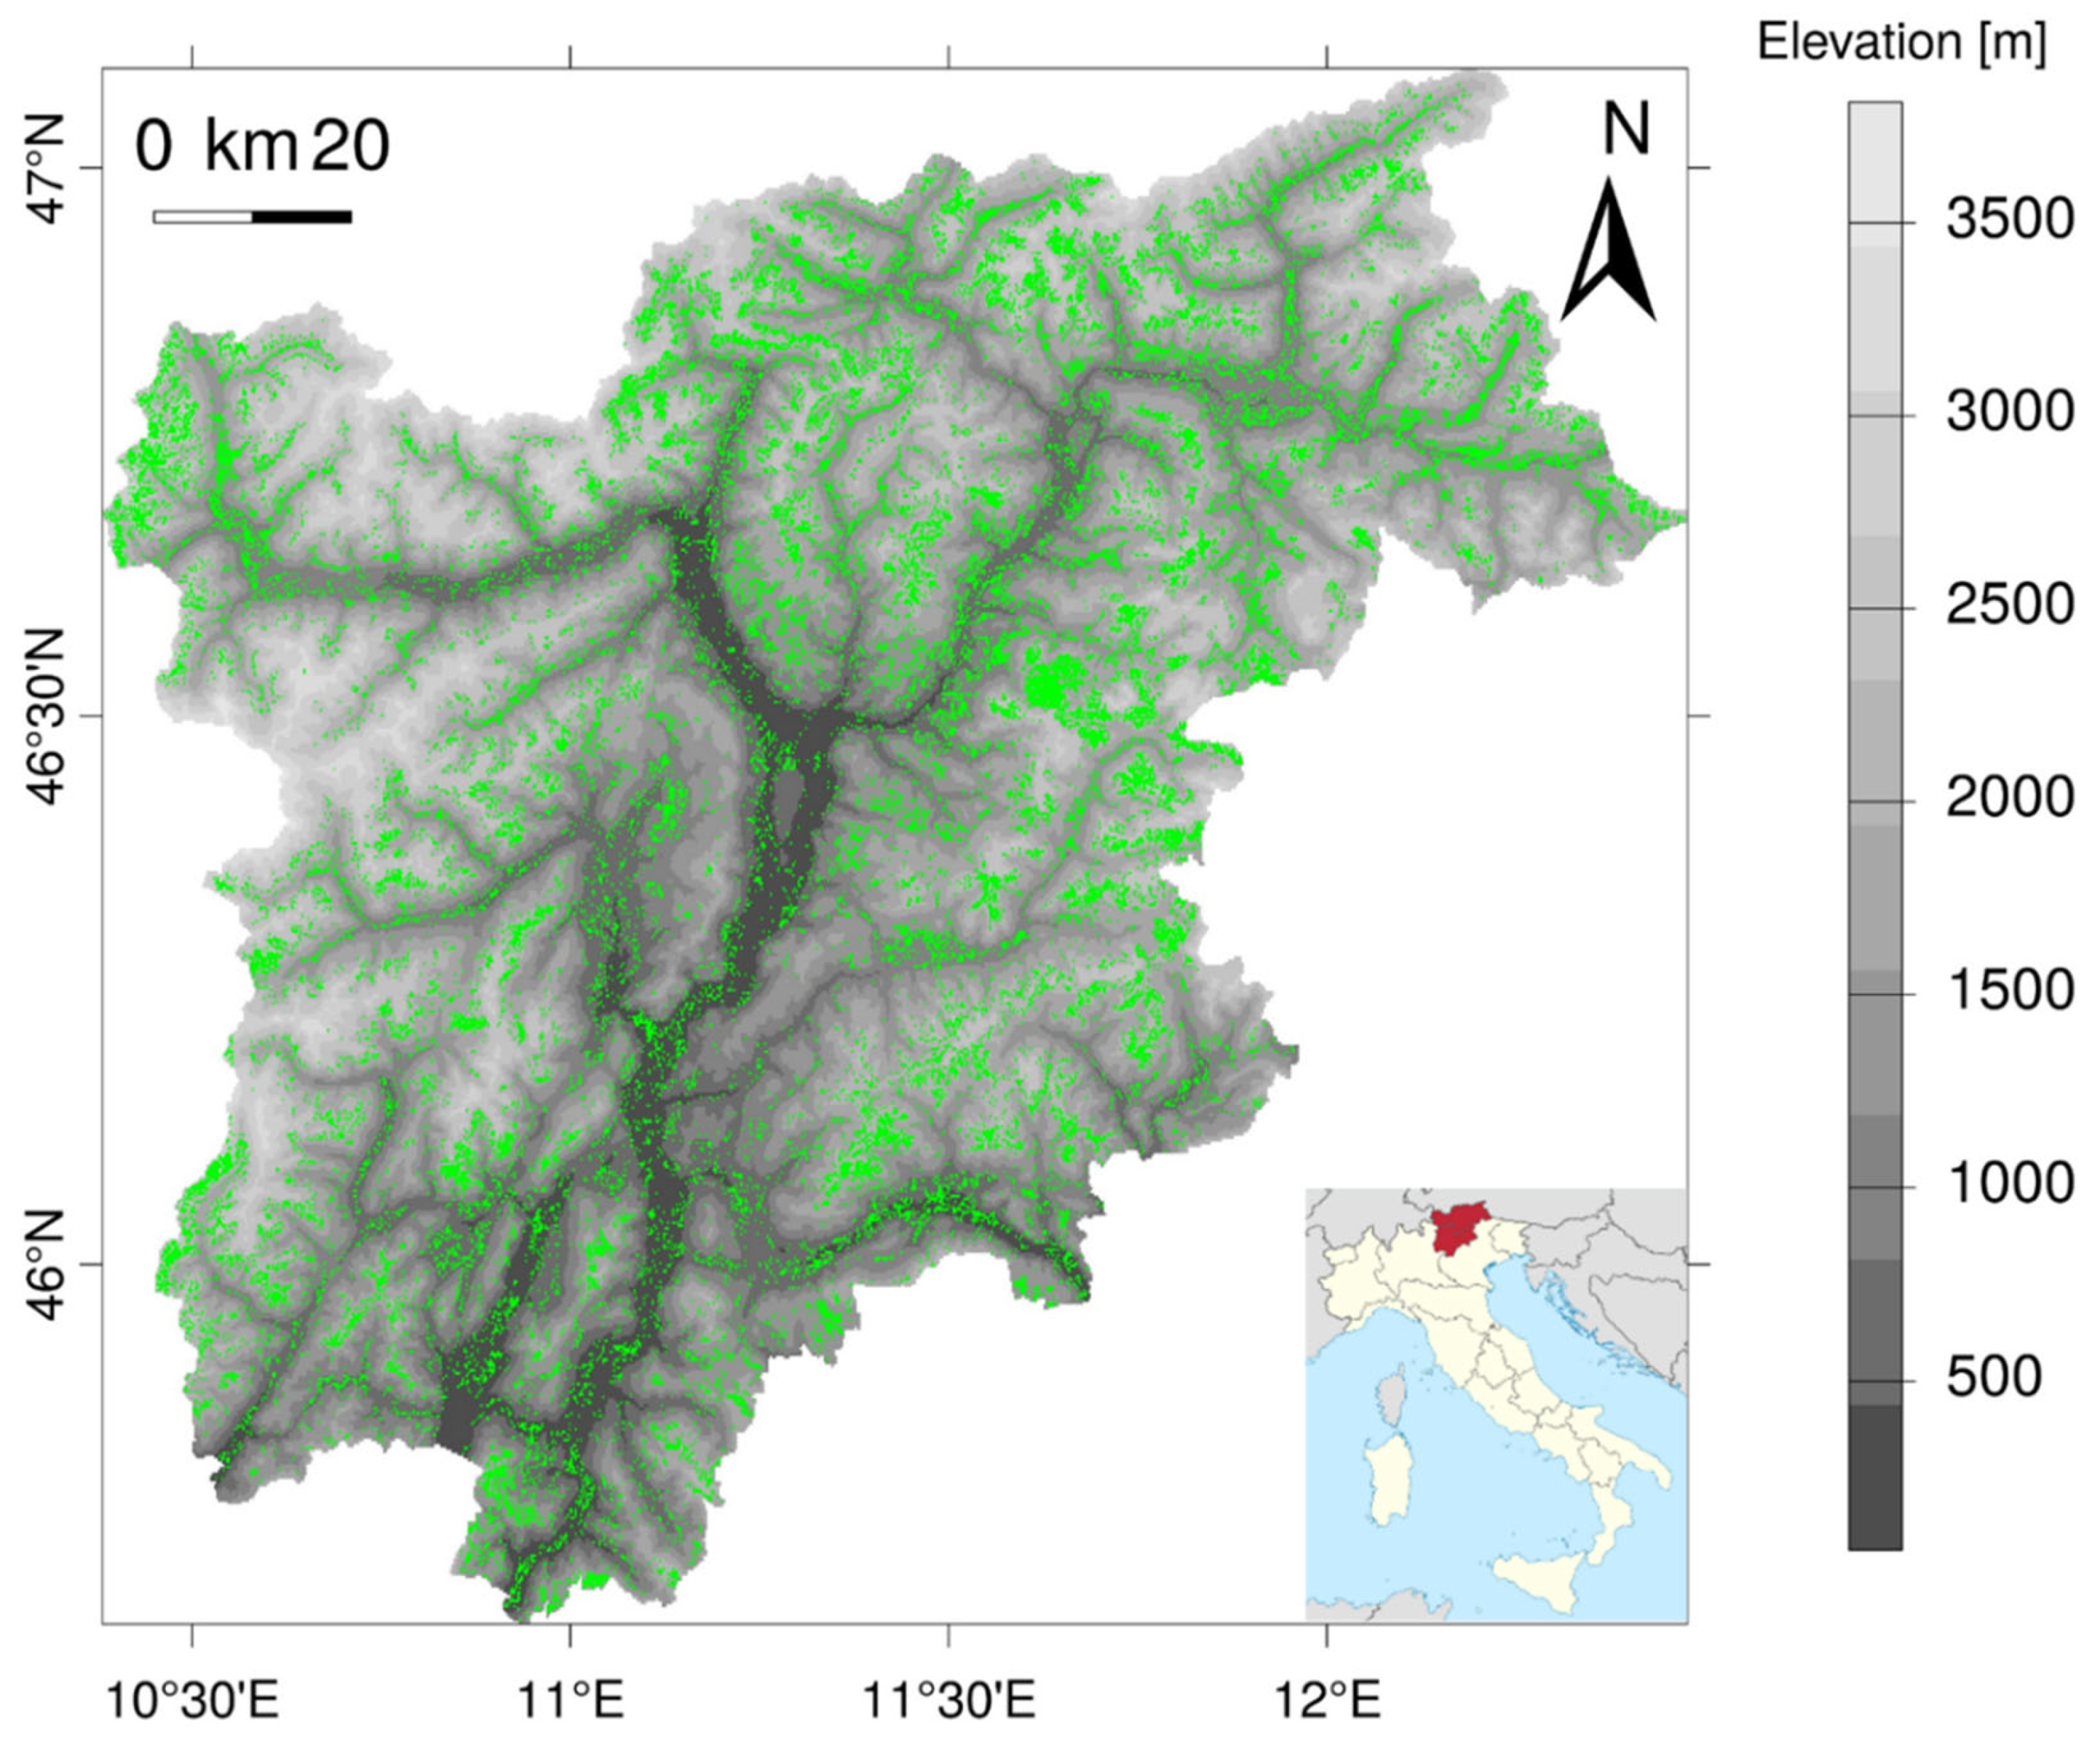
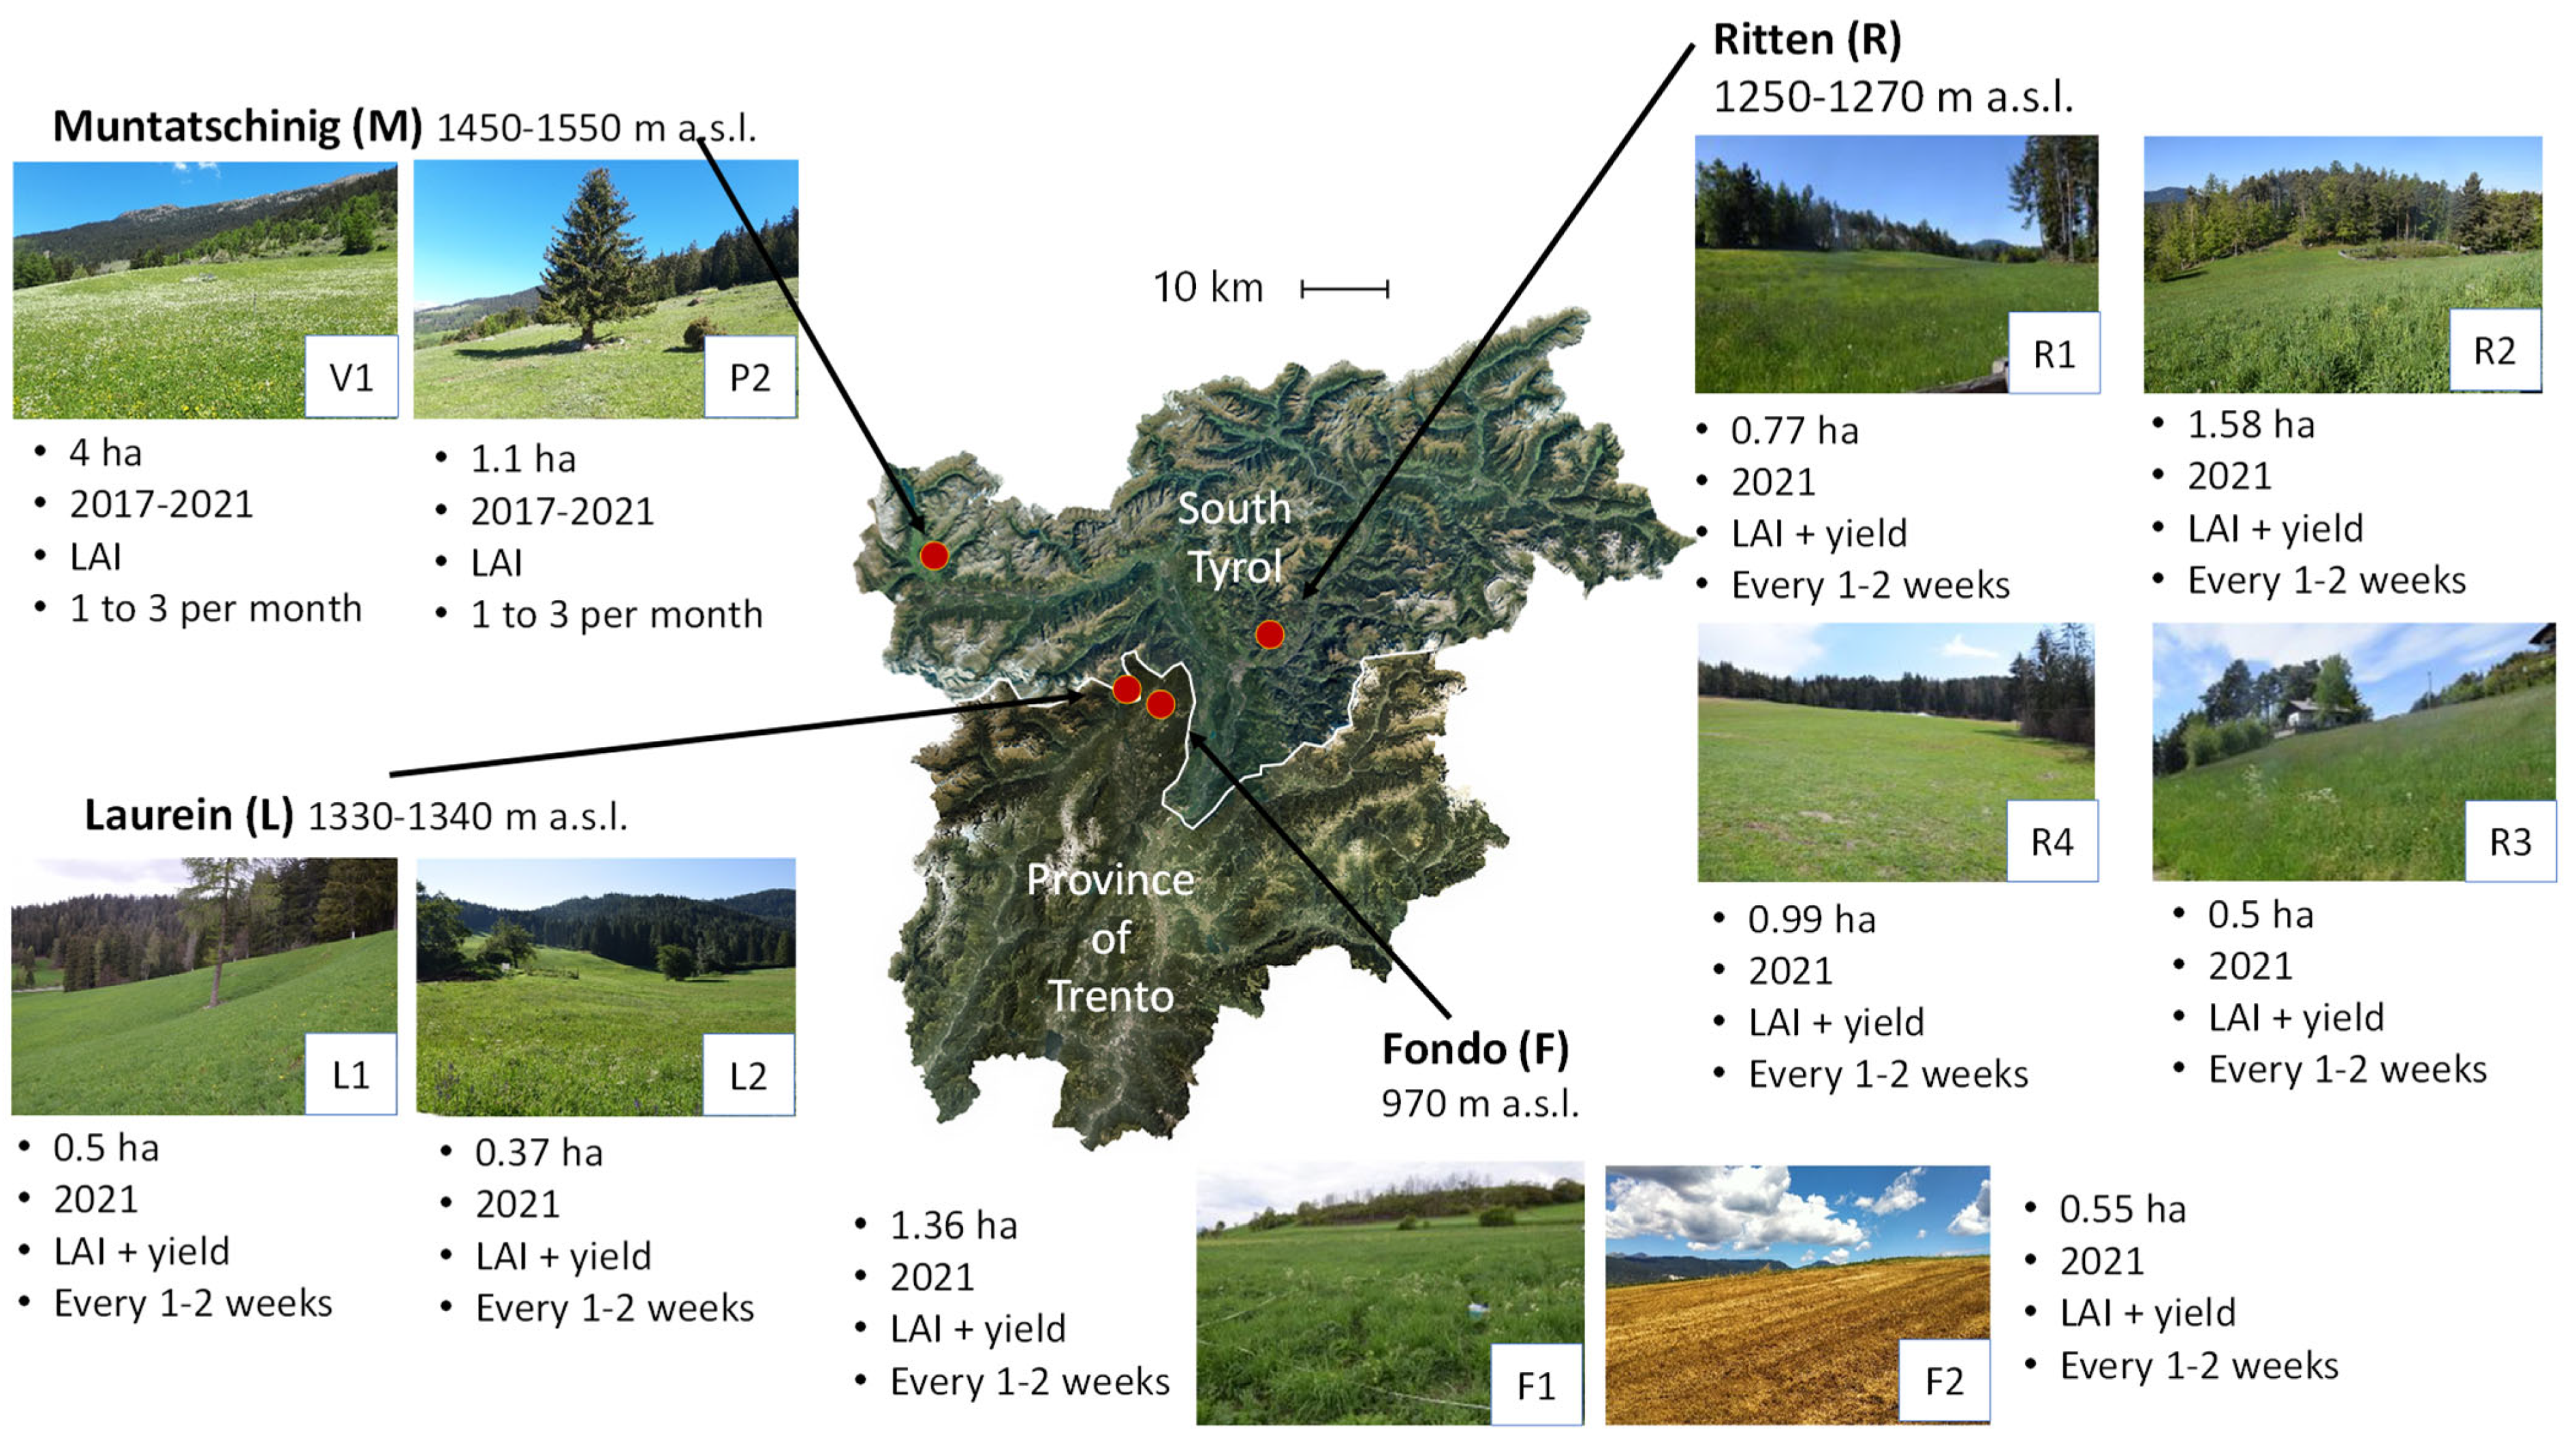
2.1. Study Area
2.2. Ground Data Collection
3. Methods
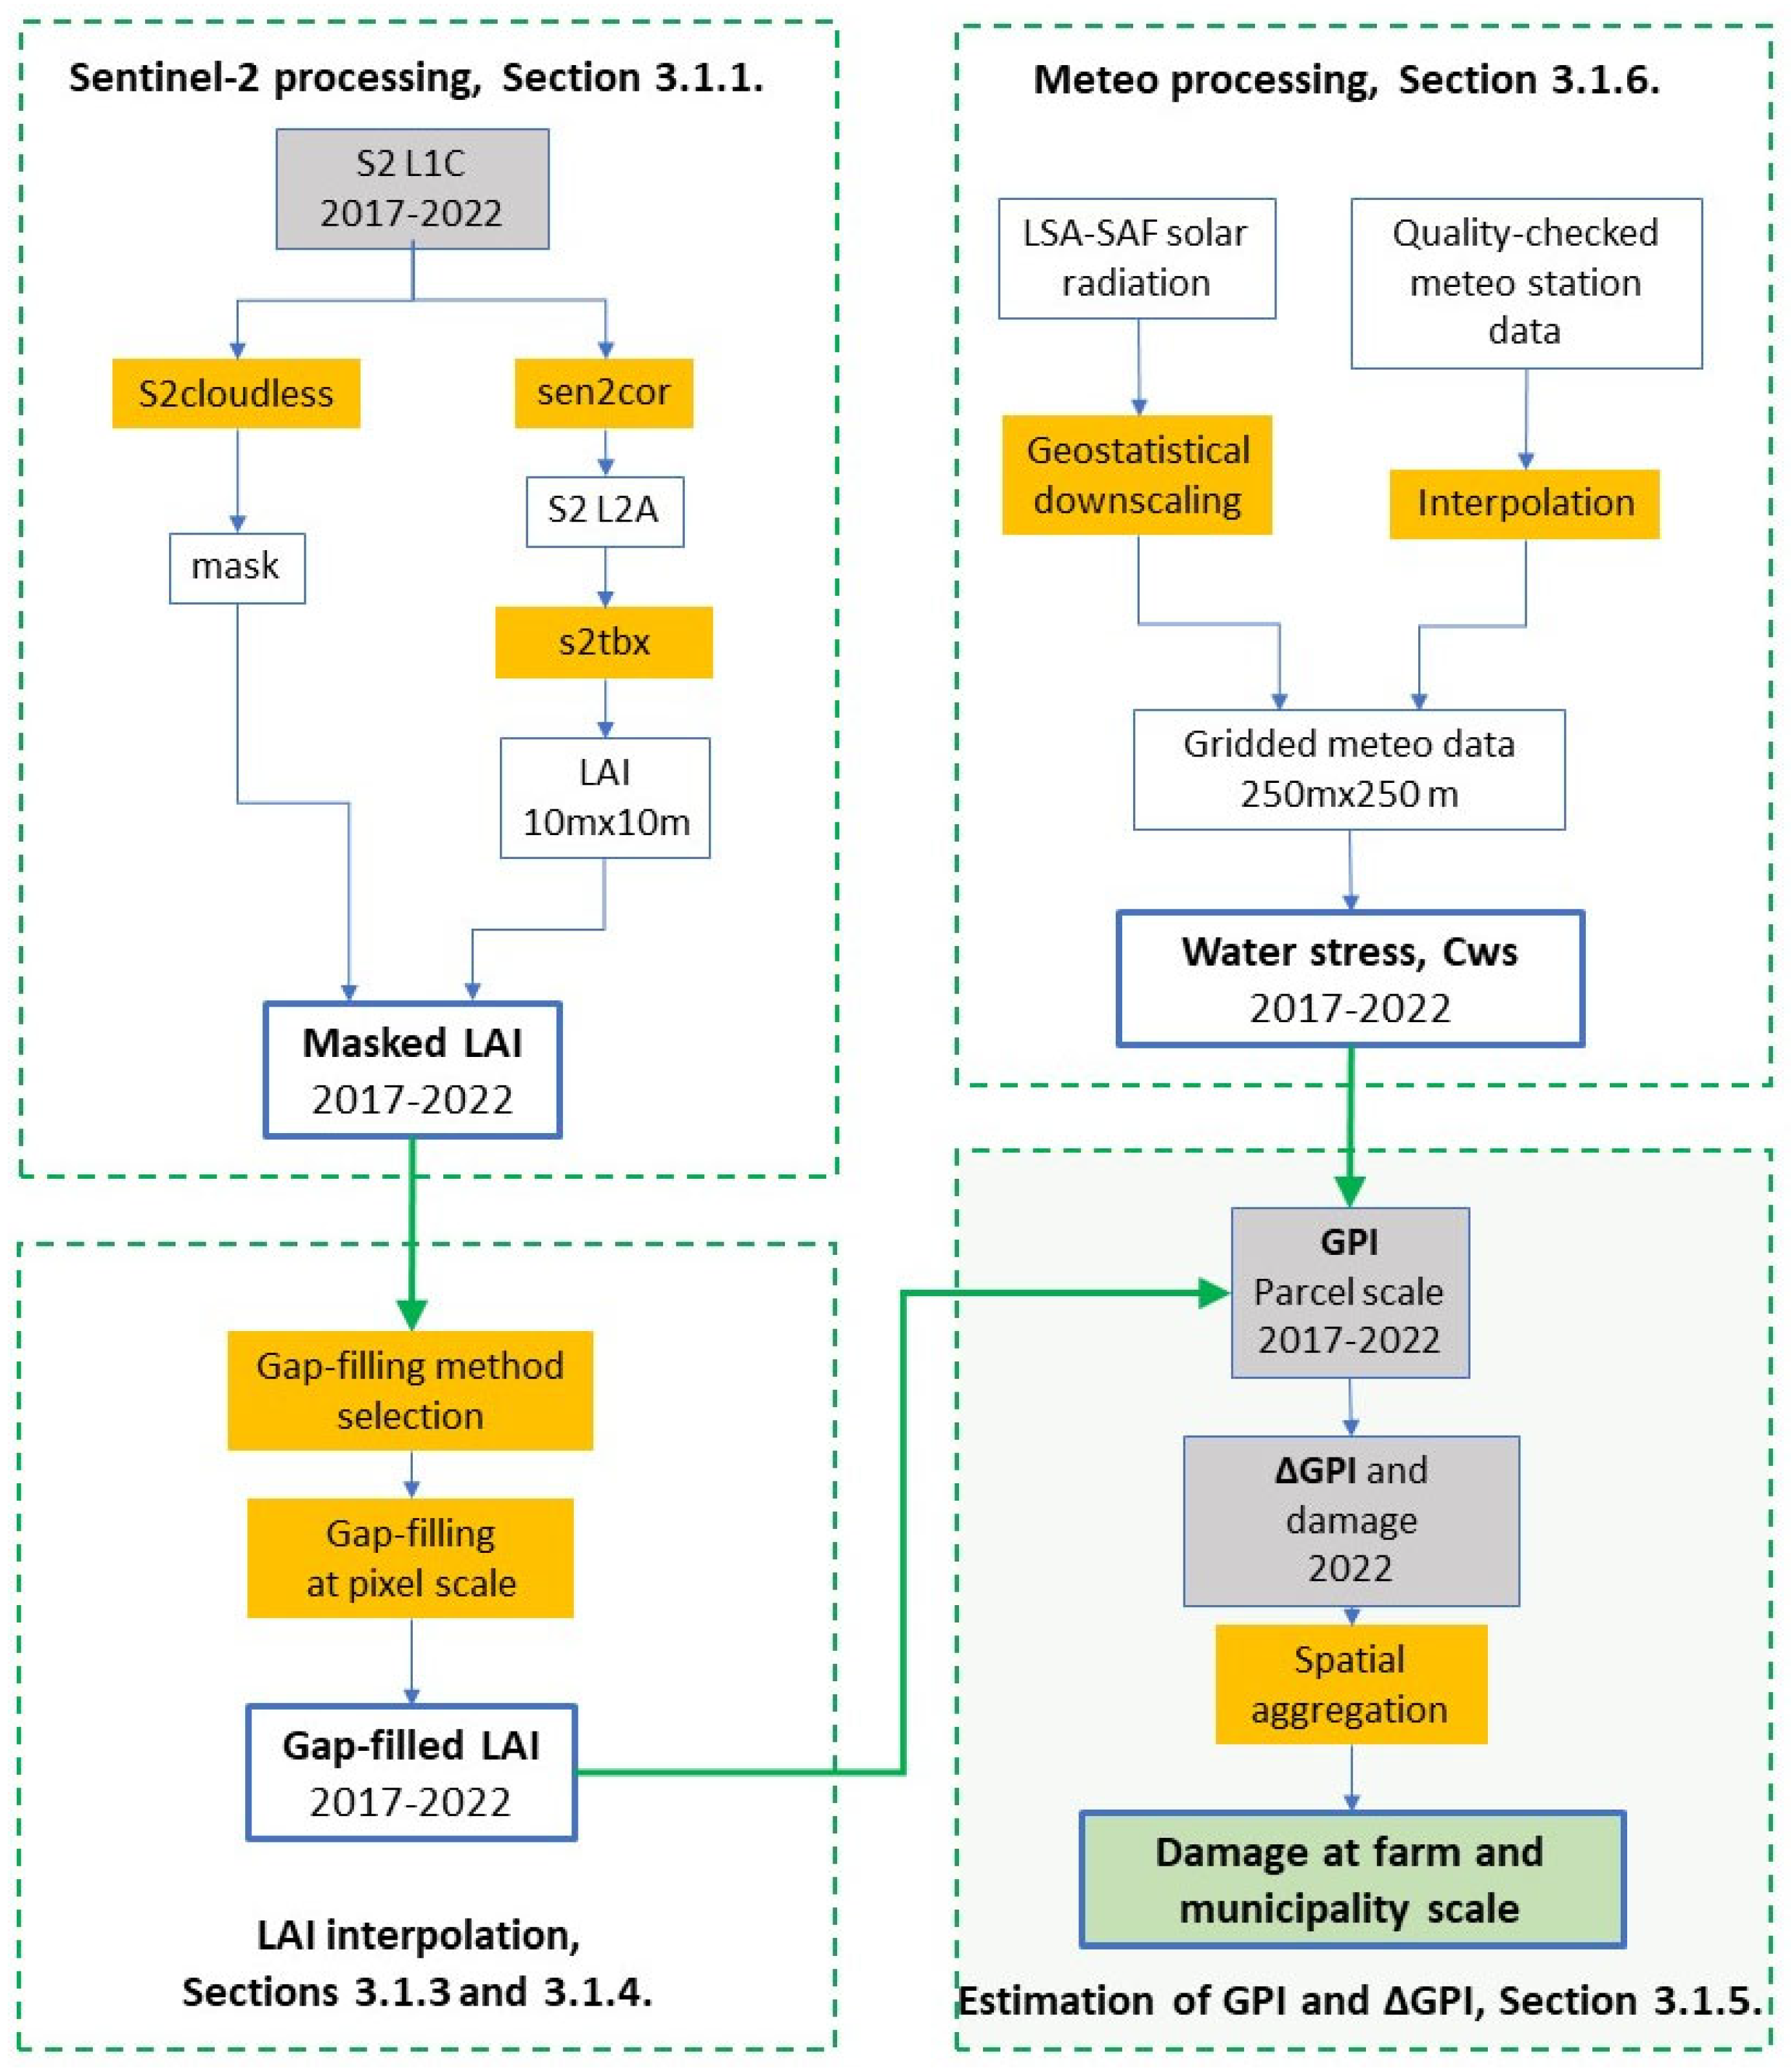
3.1. Estimation of Yield Losses for the Year 2022
3.1.1. Estimation of the LAI from S2
- S2 L2 reflectance in the 10 m bands B3 and B4 and in the 20 m bands B5, B6, B7, B8a, B11, and B12 were used after resampling 20 m imagery to a 10 m spatial resolution to fully exploit the highest spatial resolution available from the MSI sensor and maintain (at the same time) the full spectral information required by the LAI biophysical processor to perform robust estimates. A preliminary comparison with ground measurements motivated this choice, as it showed that using only the 10 m bands, as in [50], performs worse over our study area;
- An additional cloud mask layer was generated by sen2cloudless [51] and was integrated, together with LAI biophysical processor quality flags, in the LAI maps masking process to minimize the occurrence of bad quality LAI values and their impact on the final drought index calculation.
3.1.2. Gaussian Process Regression (GPR) Models
3.1.3. Interpolation of the S2 LAI at Pixel and Parcel Level
- Parcel-based linear interpolation consists of extrapolating the mean values from the good-quality pixels within a given parcel followed by a linear interpolation between two subsequent dates. The interpolated LAI values can, thus, be easily computed from the parcel-specific linear functions at the desired temporal sampling interval. This approach is appealing due to its simplicity and fast interpretability. At the same time, it could be affected by noisy data or large temporal gaps between the available input LAI maps. The average LAI for a parcel p at the time ti, when there is no observation available, is estimated aswhere and are the average values of the LAI over the parcel at time t1 and t2, before and after ti;
- Nonparametric, nonlinear interpolation is based on the use of GPR models to infer the most suitable continuous function from the available time series data. In this case, the output model is not constrained to a given set of points, as is the case of the linear method; thus, this possibly limits the effect of noisy data. According to this method, the mean and variance of the function estimating the LAI for a parcel at the time , when there is no S2 imagery available, are estimated aswhere is the array of the similarities of the test point with the training points, is the covariance matrix with the similarities between the training points, is the LAI time series derived from S2, and is the variance of the time series additive noise. The covariance matrix is calculated by the Matérn 3/2 kernel function [52,56]:where is the length scale along the time dimension, is the time series signal variance, T is the vector of sample dates, and and are the and unit matrices introduced for the dimensional equality of the expression.
3.1.4. Filling in the Missing LAI Values at the Beginning and End of the Growing Season
3.1.5. Estimation of the GPI and of Its Anomalies
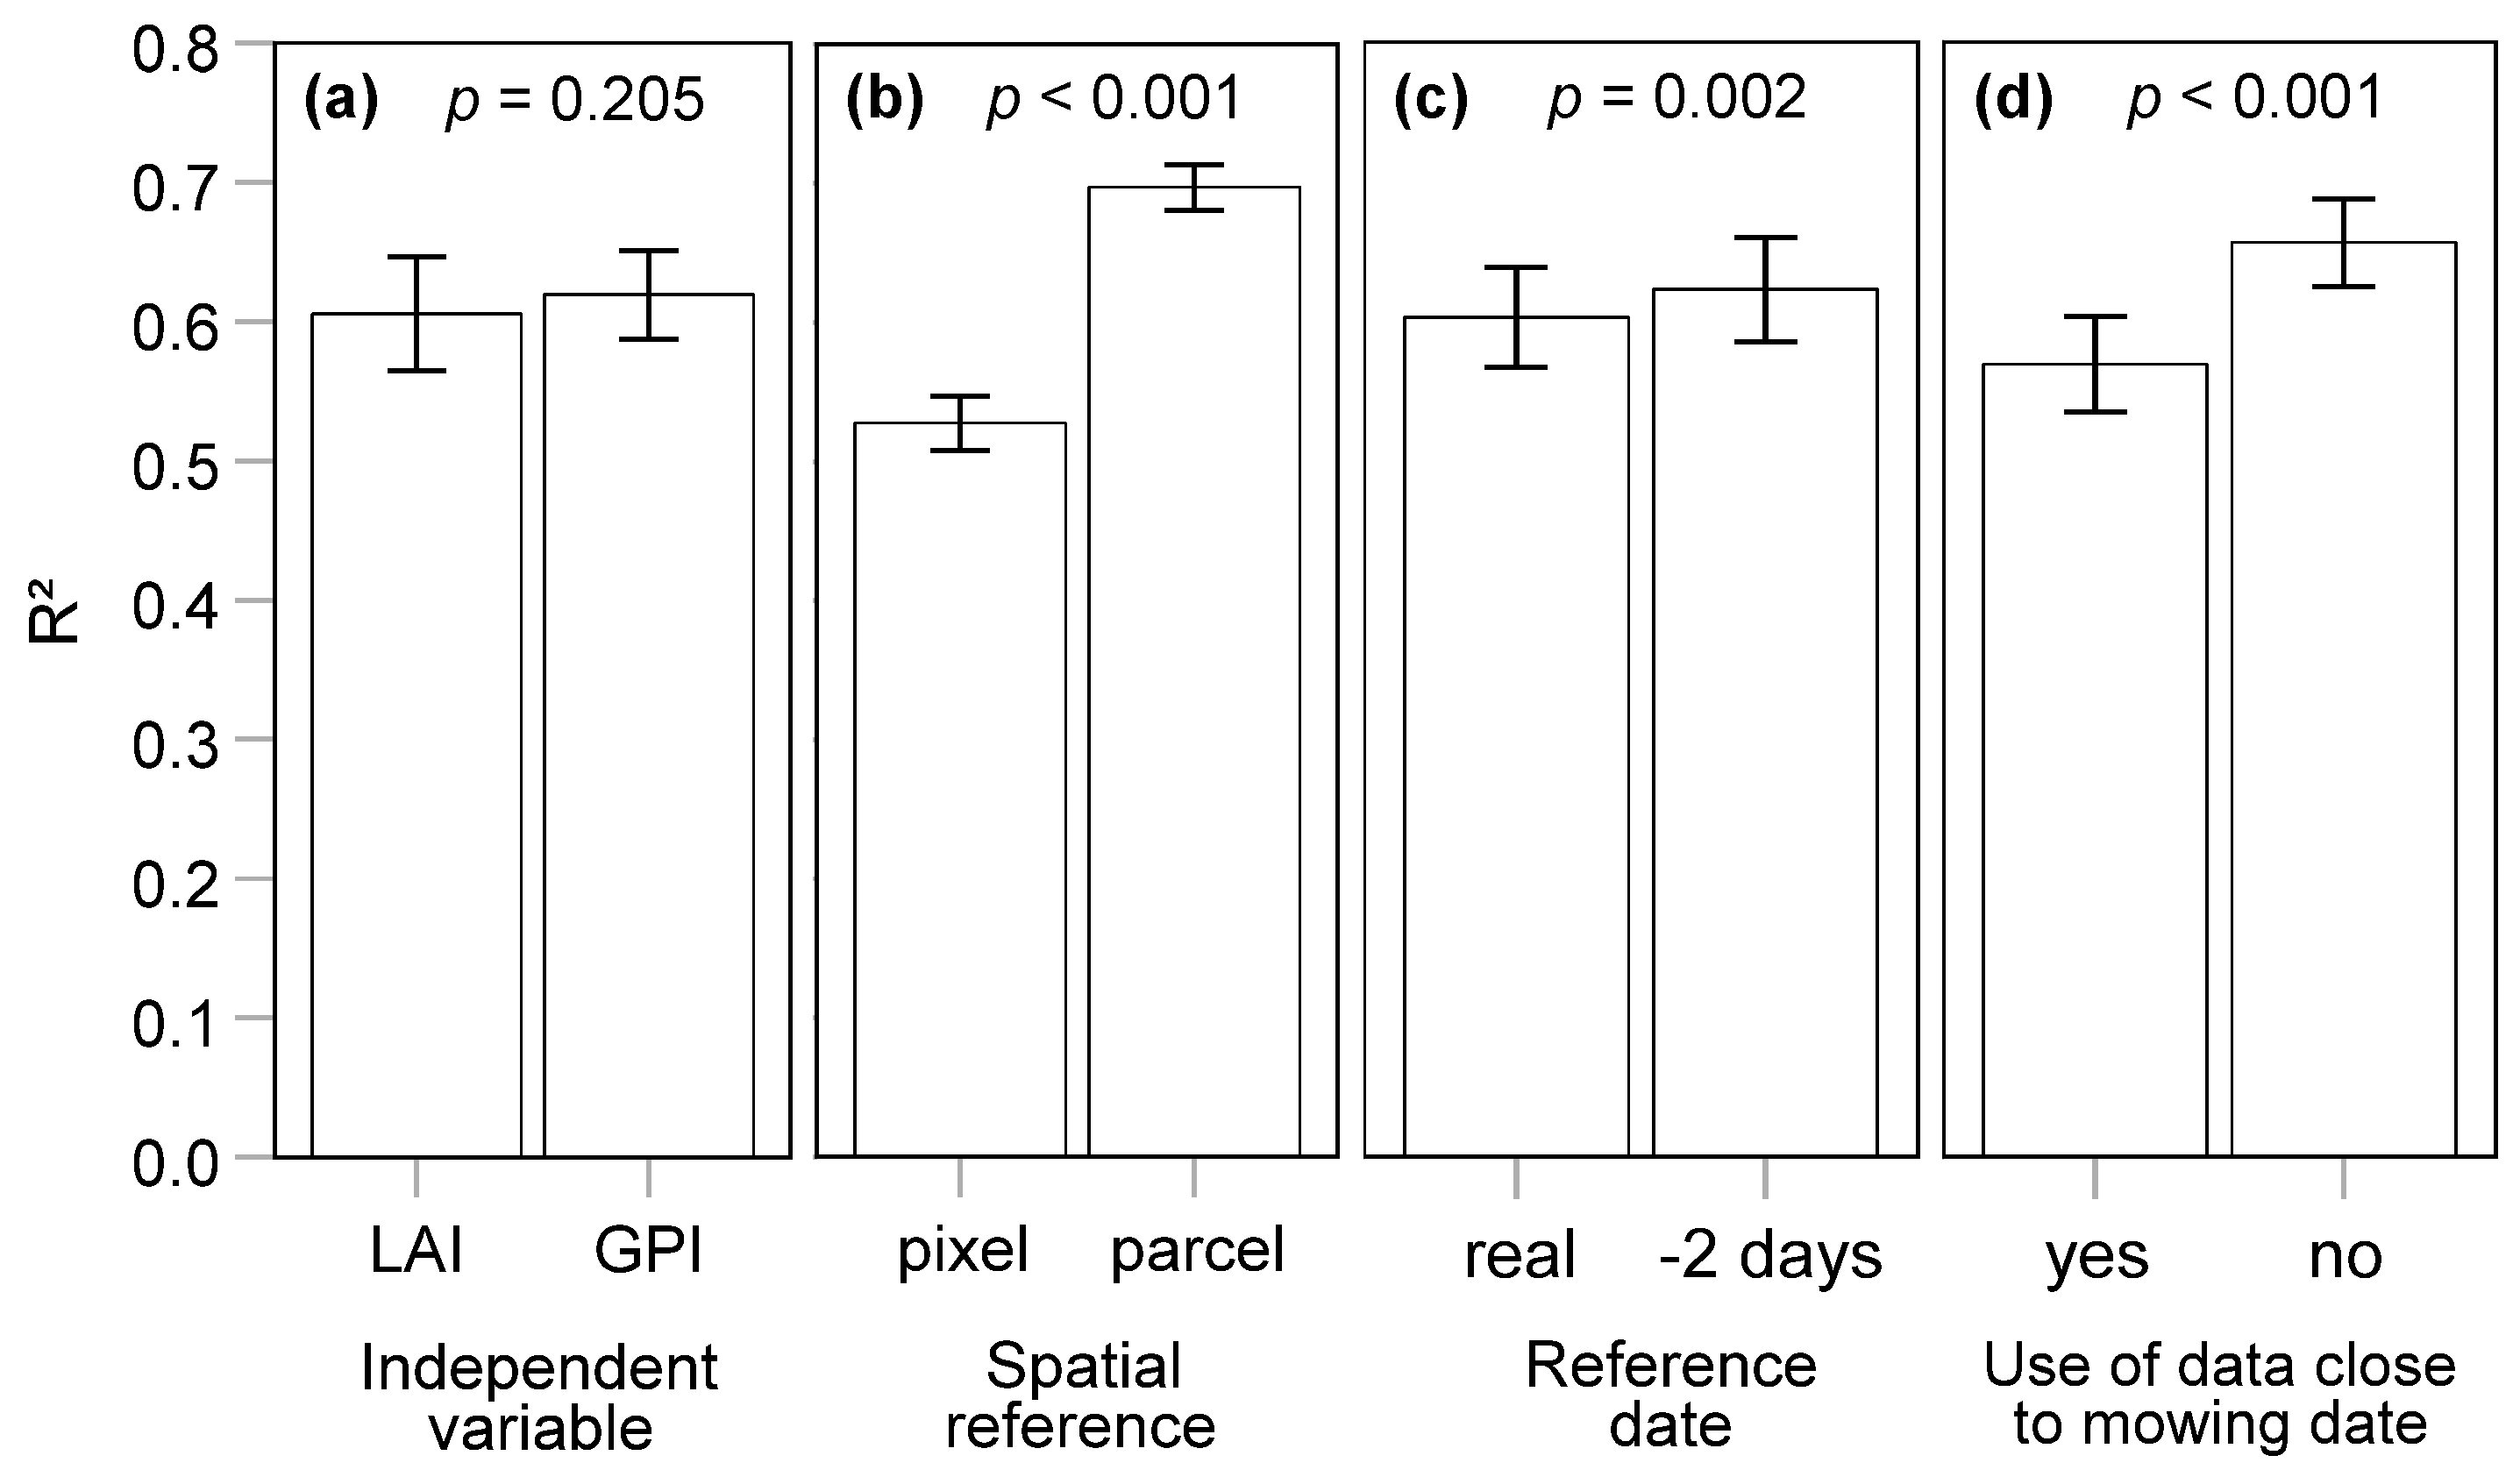
3.2. Evaluation of the LAI and GPI as Proxies for Forage Yield
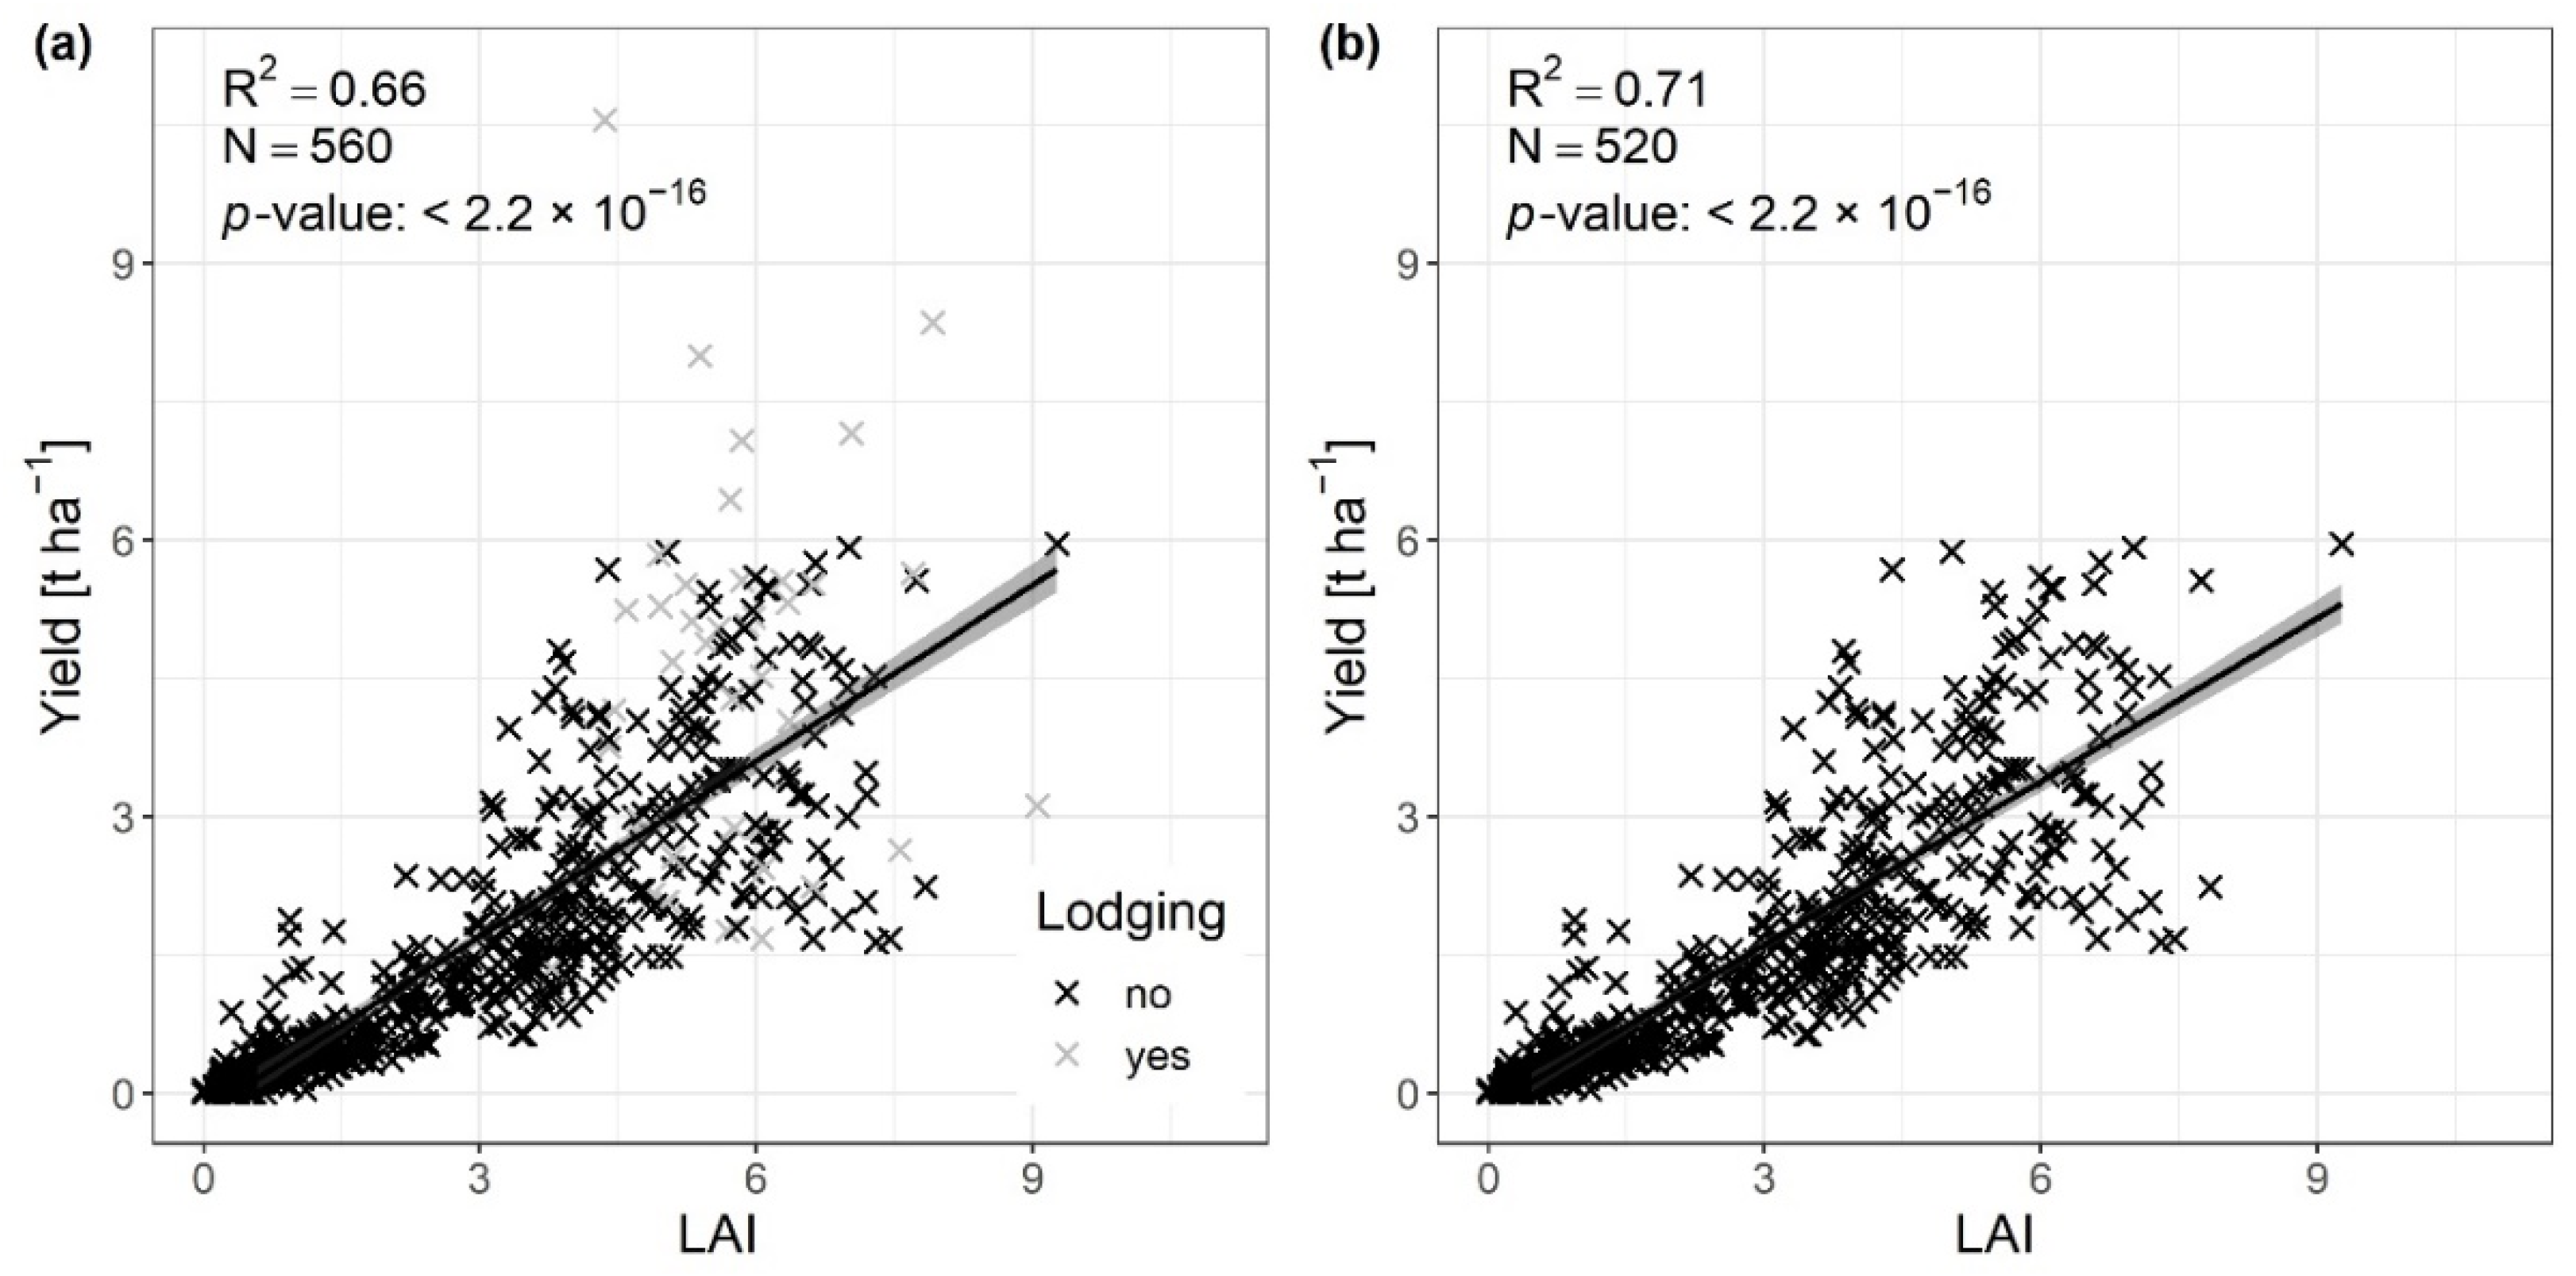
- In order to verify whether the LAI is a good proxy for grassland yield in our study area, we compared the ground measurements of the LAI and yield by regression analysis, also considering the effect of lodging;
- In order to evaluate the accuracy of the S2 LAI, we validated it against ground measurements of the LAI;
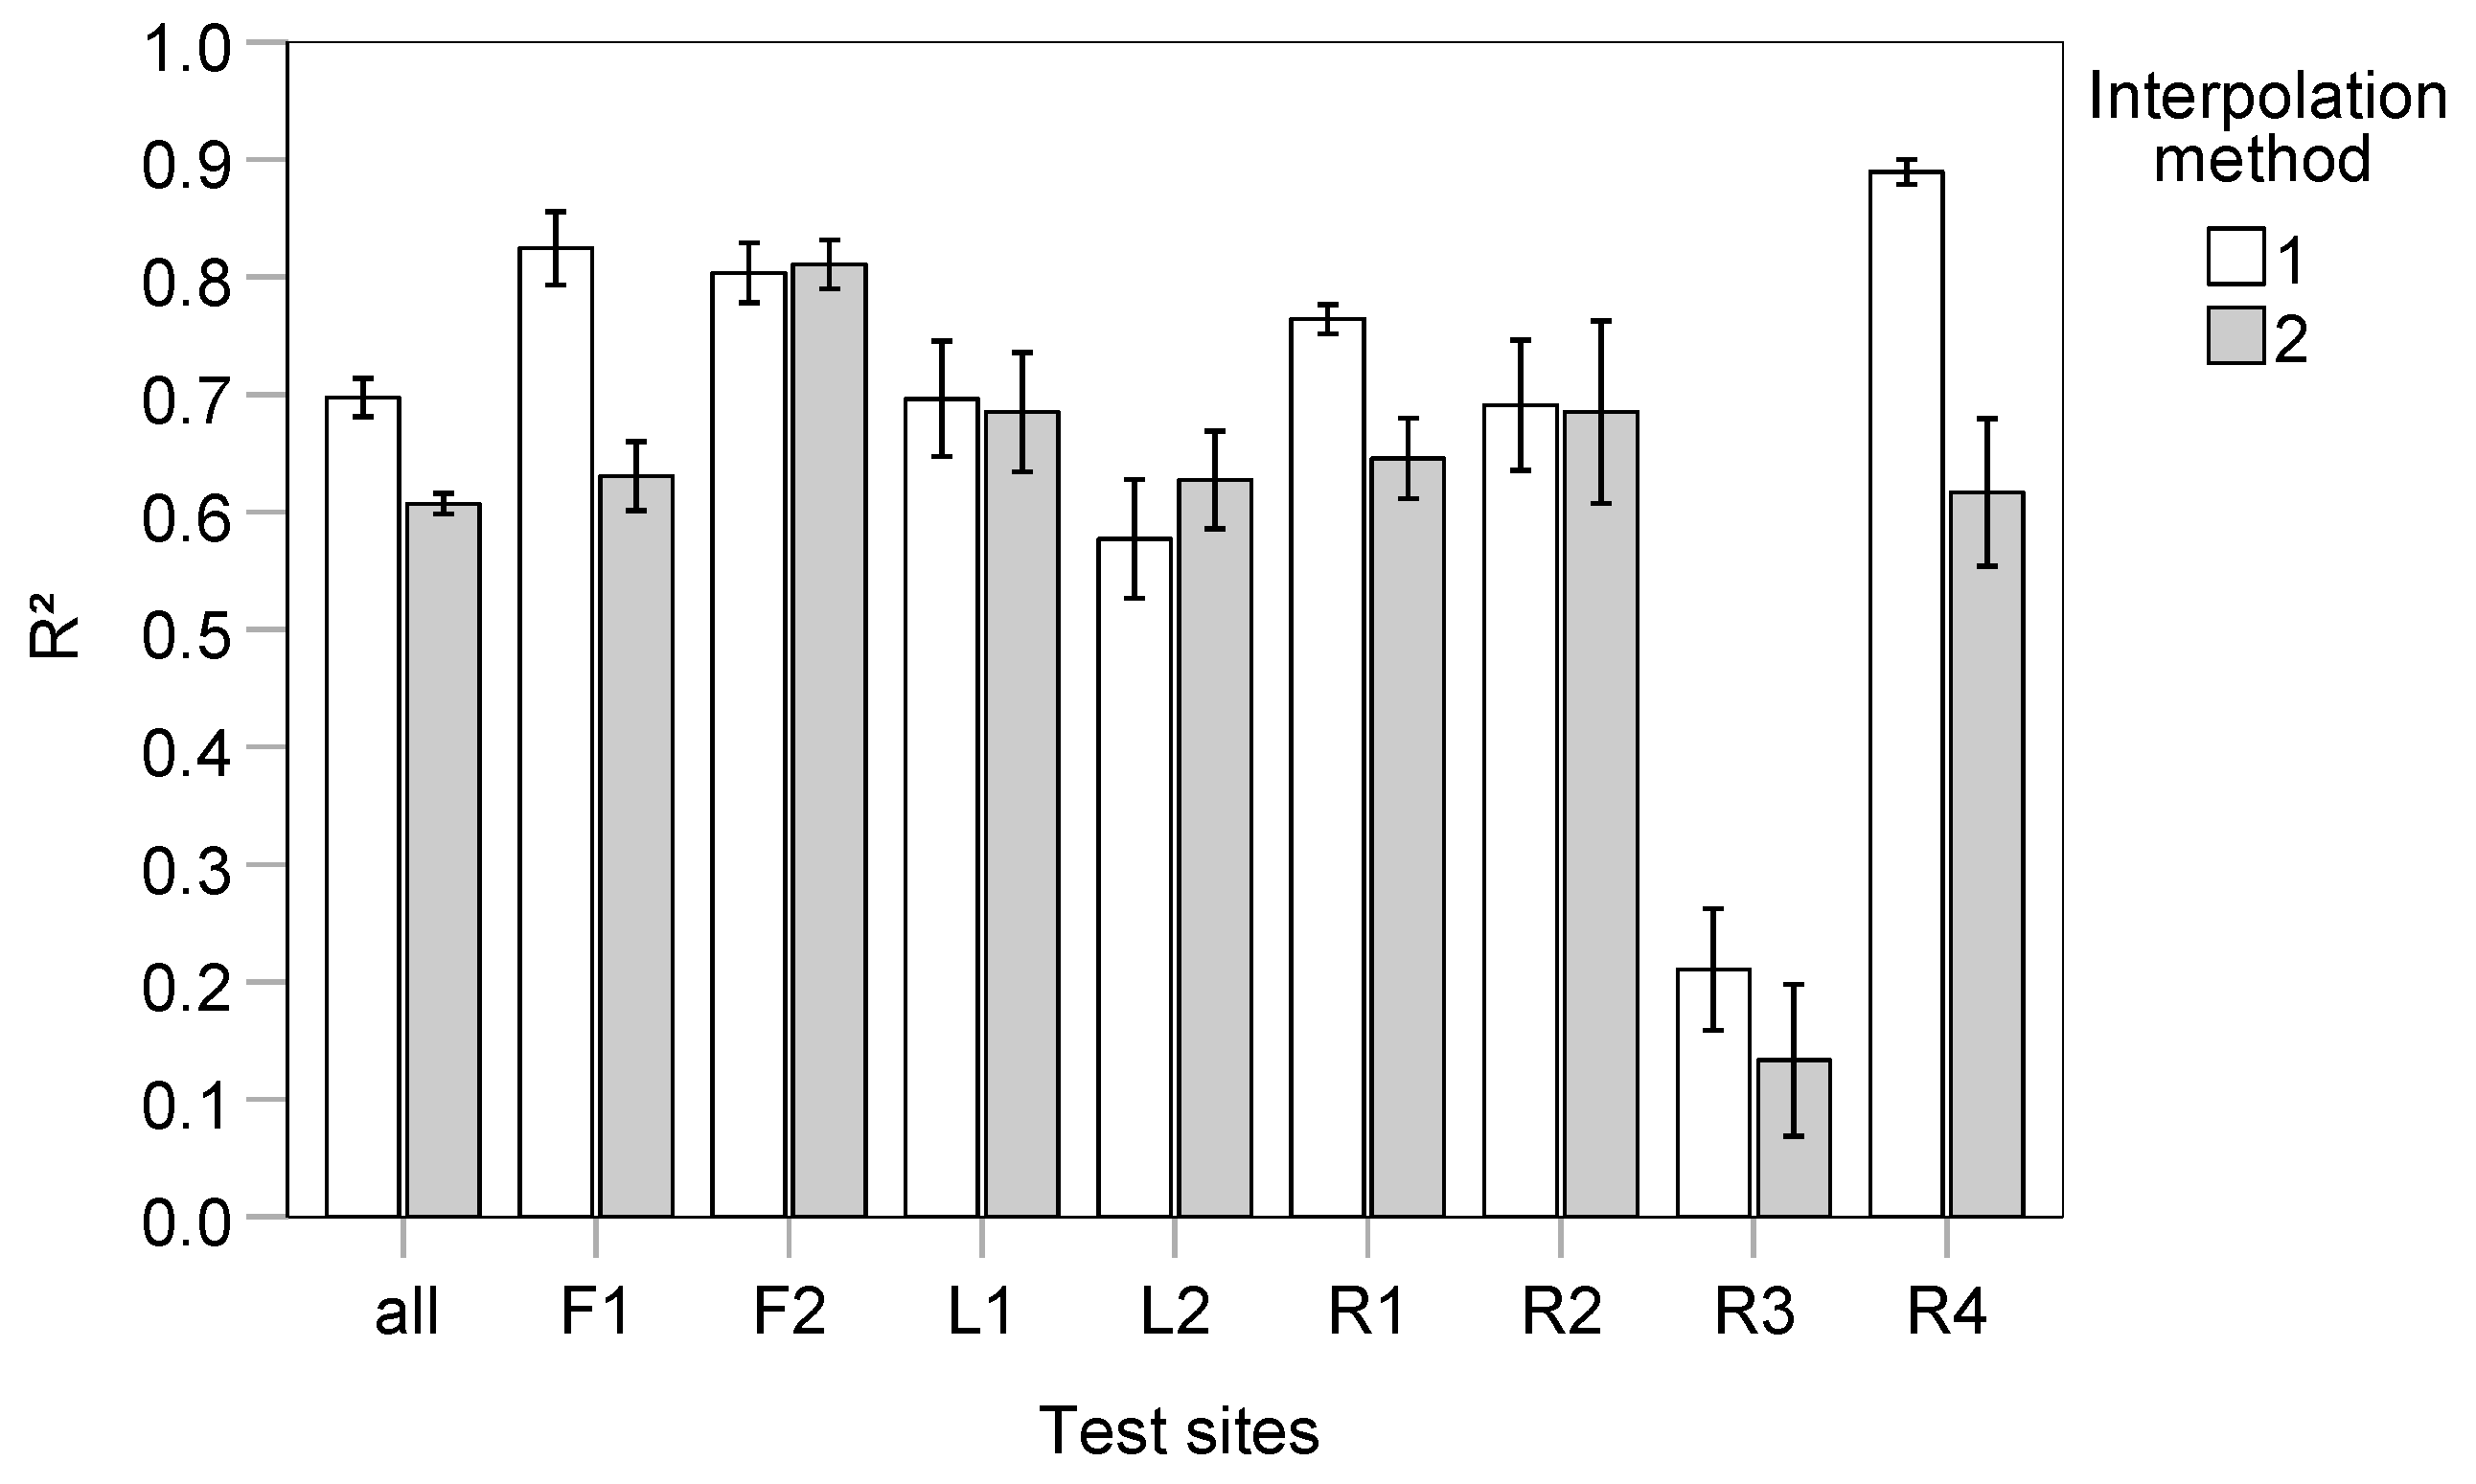
- We compared the performances of different interpolation methods against parcel-scale LAI measurements;
- We evaluated the GPI against yield measurements.
3.2.1. S2 LAI Validation
3.2.2. Relationship between the Daily S2 LAI and GPI and the Physical Yield Measurements
3.3. Pilot Experiment of S2 LAI Time Series Enrichment by S1 SAR Data
3.3.1. S1 Data Preprocessing
3.3.2. S1 and S2 Data Fusion by GPR
- VV and VH polarization bands from the S1 dual polarization StrimMap product;
- Soil moisture content maps (SM), produced by Eurac Research from S1 imagery [70], with the aim of providing information on the soil water content status to the regression algorithm to help disentangle the intrinsic ambiguity of SAR data;
- Day of year (DOY).
4. Results
4.1. Comparison between the Ground Measurements of the LAI and Yield
4.2. Validation of the LAI Derived from S2
4.3. Assessment of Three LAI Interpolation Methods
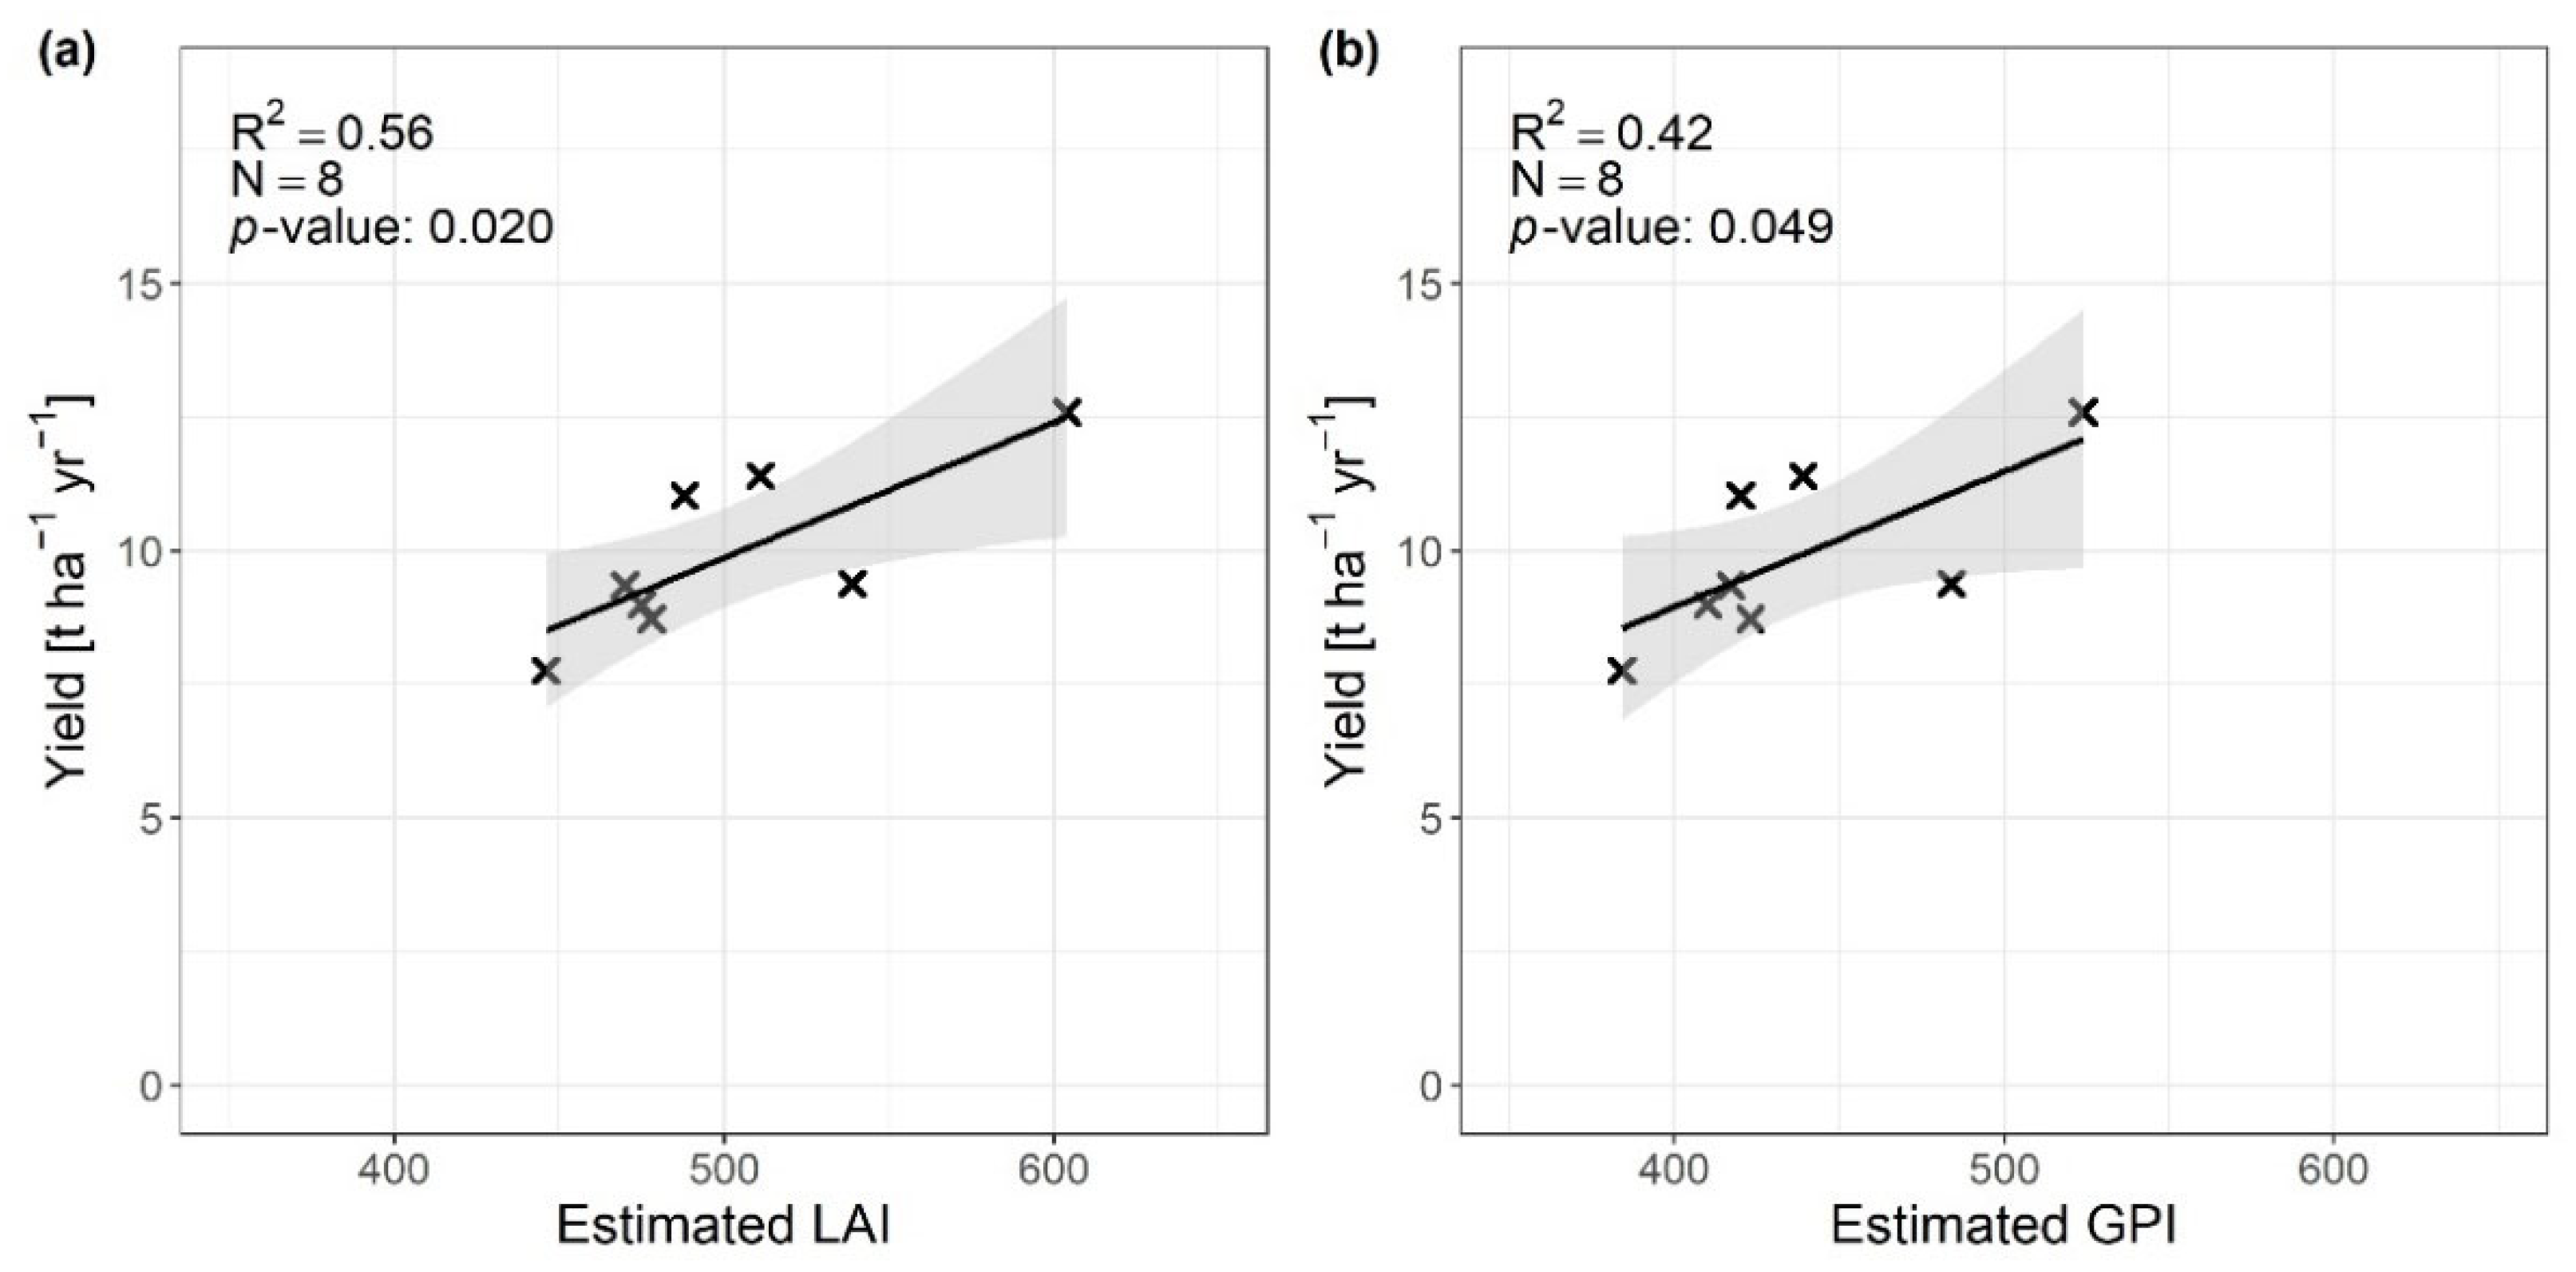
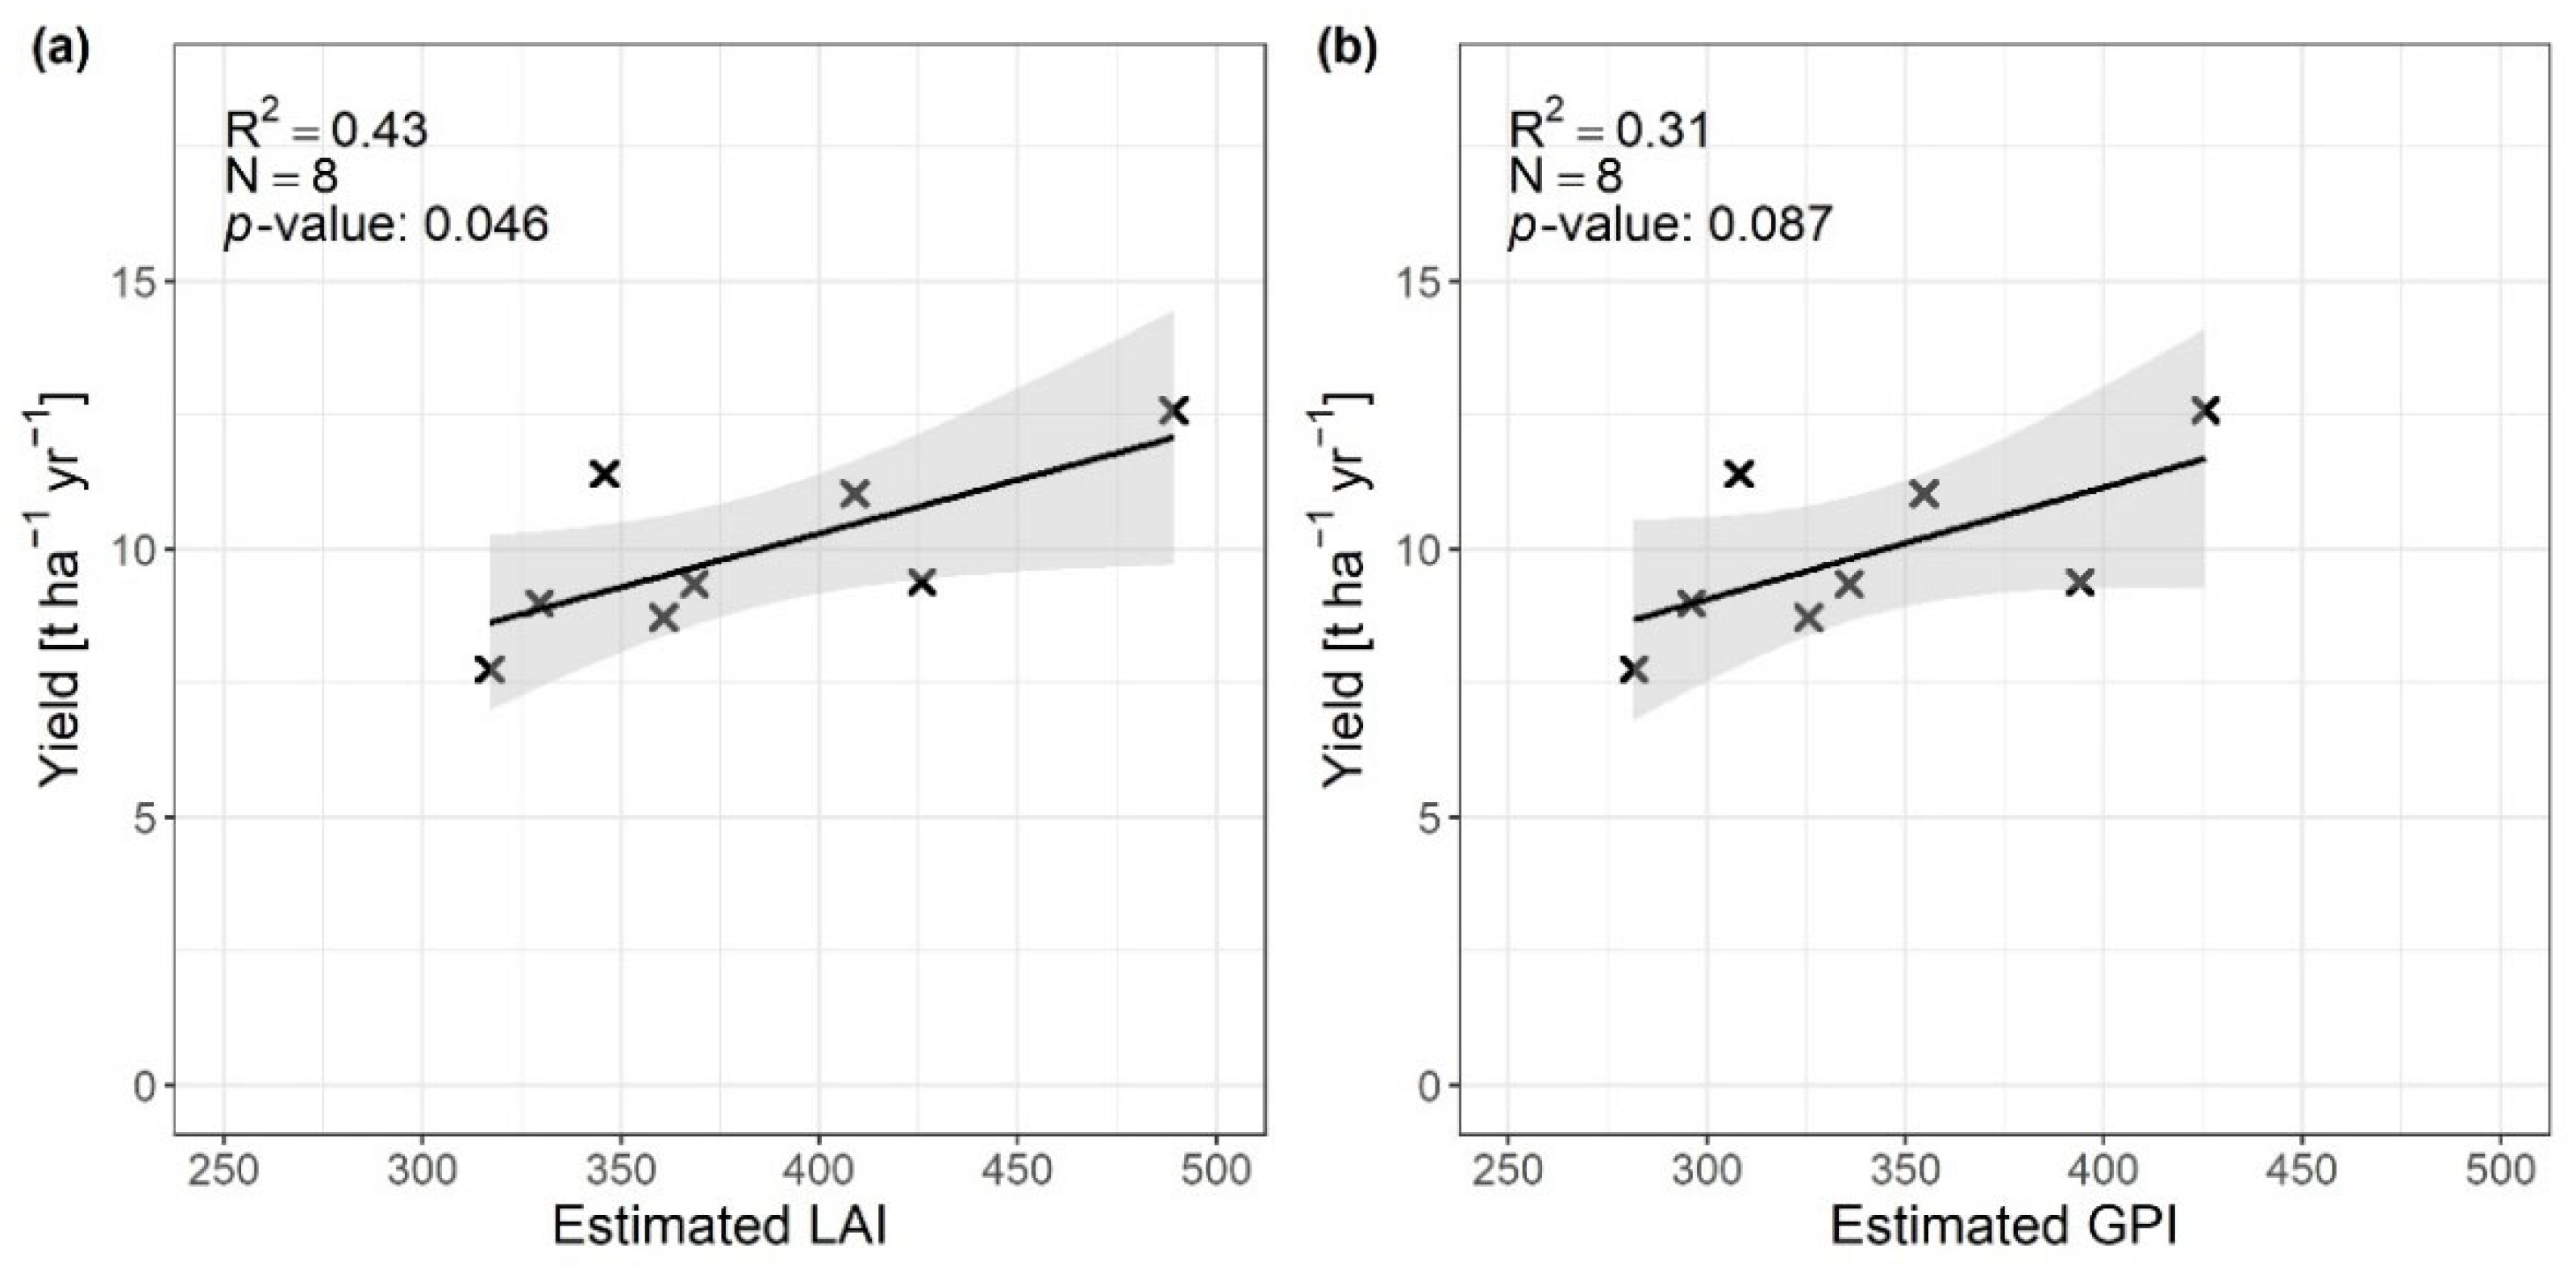
4.4. Comparison between the LAI/GPI from the Remote Sensing and Ground Yield Measurements
4.5. Estimated Yield Losses for the Year 2022
4.6. Evaluation of the GPR Model’s Potential to Enrich the S2 LAI Time Series by Using S1 SAR Data
4.6.1. Feature Selection
4.6.2. Temporal and Spatial Gap-Filling Experiments
5. Discussion
5.1. Design of the GPI
- Design risk, as derived from the possibility that the index does not correctly describe the variable of interest, i.e., yield, was minimized by studying the correlation between the LAI and yield, verifying the accuracy of the LAI derived from satellite data, and assessing the ability of the GPI to explain yield variability;
- Temporal basis risk, emerging from the mismatch between the temporal aggregation of the index and the temporal scale of interest for grassland growth, was reduced by estimating the GPI as the growing season cumulate of the daily values of the LAI;
- Spatial risk, as the distance between the insured farm and the point where the index is estimated, is partially solved thanks to the high spatial resolution of S2 data, which allows for an estimation of the GPI by aggregating the pixels within the parcels belonging to the insured farms. However, when the parcels are aggregated by municipality, as foreseen by the Italian regulations [71], the variability from one parcel to another is lost, and the farmers are not rewarded for the parcels where high losses are estimated. Yet, through aggregation, it is possible to exclude (from the calculation of the damage) the parcels that lack the requirements for the calculation of ΔGPI, i.e., dense tree cover, recent changes in land use, and extremely small parcel size.
5.2. Ground Measurements of the LAI and Yield
5.3. S2 LAI Validation and Its Relationship with Yield
5.4. Enrichment of the S2 LAI with SAR Data
6. Conclusions and Outlook
Supplementary Materials
Author Contributions
Funding
Data Availability Statement
Conflicts of Interest
References
- Flury, C.; Huber, R.; Tasser, E. Future of Mountain Agriculture in the Alps. In The Future of Mountain Agriculture; Springer Geography: Berlin/Heidelberg, Germany, 2013; pp. 105–126. [Google Scholar] [CrossRef]
- Jäger, H.; Peratoner, G.; Tappeiner, U.; Tasser, E. Grassland Biomass Balance in the European Alps: Current and Future Ecosystem Service Perspectives. Ecosyst. Serv. 2020, 45, 101163. [Google Scholar] [CrossRef]
- Sala, O.E.; Yahdjian, L.; Havstad, K.; Aguiar, M.R. Rangeland Ecosystem Services: Nature’s Supply and Humans’ Demand. In Rangeland Systems: Processes, Management and Challenges; Springer: New York, NY, USA, 2017; pp. 467–489. [Google Scholar]
- Zimmermann, P.; Tasser, E.; Leitinger, G.; Tappeiner, U. Effects of Land-Use and Land-Cover Pattern on Landscape-Scale Biodiversity in the European Alps. Agric. Ecosyst. Environ. 2010, 139, 13–22. [Google Scholar] [CrossRef]
- Zhao, Y.; Liu, Z.; Wu, Á.J. Grassland ecosystem services: A systematic review of research advances and future directions. Landsc. Ecol. 2020, 35, 793–814. [Google Scholar] [CrossRef]
- Schirpke, U.; Wang, G.; Padoa-Schioppa, E. Editorial: Mountain Landscapes: Protected Areas, Ecosystem Services, and Future Challenges. Ecosyst. Serv. 2021, 49, 101302. [Google Scholar] [CrossRef]
- Bahn, M.; Rodeghiero, M.; Anderson-Dunn, M.; Dore, S.; Gimeno, C.; Drösler, M.; Williams, M.; Ammann, C.; Berninger, F.; Flechard, C.; et al. Soil Respiration in European Grasslands in Relation to Climate and Assimilate Supply. Ecosystems 2008, 11, 1352–1367. [Google Scholar] [CrossRef] [Green Version]
- Neuwirth, C.; Hofer, B. Spatial Sensitivity of Grassland Yields to Weather Variations in Austria and Its Implications for the Future. Appl. Geogr. 2013, 45, 332–341. [Google Scholar] [CrossRef] [PubMed]
- Baronetti, A.; Provenzale, A.; Fratianni, S. Future Droughts in Northern Italy: High Resolution Projections Using EURO-CORDEX and MED-CORDEX Ensembles. Clim. Chang. 2022, 172, 22. [Google Scholar] [CrossRef]
- Stephan, R.; Erfurt, M.; Terzi, S.; Zun, M.; Kristan, B.; Haslinger, K.; Stahl, K. An Inventory of Alpine Drought Impact Reports to Explore Past Droughts in a Mountain Region. Nat. Hazards Earth Syst. Sci. 2021, 21, 2485–2501. [Google Scholar] [CrossRef]
- Spinoni, J.; Vogt, J.V.; Naumann, G.; Barbosa, P.; Dosio, A. Will Drought Events Become More Frequent and Severe in Europe? Int. J. Climatol. 2018, 38, 1718–1736. [Google Scholar] [CrossRef] [Green Version]
- Böhnisch, A.; Mittermeier, M.; Leduc, M.; Ludwig, R. Hot Spots and Climate Trends of Meteorological Droughts in Europe–Assessing the Percent of Normal Index in a Single-Model Initial-Condition Large Ensemble. Front. Water 2021, 3, 107. [Google Scholar] [CrossRef]
- Dibari, C.; Pulina, A.; Argenti, G.; Aglietti, C.; Bindi, M.; Moriondo, M.; Mula, L.; Pasqui, M.; Seddaiu, G.; Roggero, P.P. Climate Change Impacts on the Alpine, Continental and Mediterranean Grassland Systems of Italy: A Review. Ital. J. Agron. 2021, 16. [Google Scholar] [CrossRef]
- Begert, M.; Frei, C. Long-Term Area-Mean Temperature Series for Switzerland—Combining Homogenized Station Data and High Resolution Grid Data. Int. J. Climatol. 2018, 38, 2792–2807. [Google Scholar] [CrossRef] [Green Version]
- Kotlarski, S.; Gobiet, A.; Morin, S.; Olefs, M.; Rajczak, J.; Samacoïts, R. 21st Century Alpine Climate Change. Clim. Dyn. 2023, 60, 65–86. [Google Scholar] [CrossRef]
- ENSEMBLES. Climate Change and Its Impacts: Summary of Research and Results from the ENSEMBLES Project; Van der Linden, P., Mitchell, J.F.B., Eds.; Met Office Hadley Centre: Exeter, UK, 2009; p. 160. Available online: http://ensembles-eu.metoffice.com/docs/Ensembles_final_report_Nov09.pdf (accessed on 20 March 2023).
- Dibari, C.; Costafreda-Aumedes, S.; Argenti, G.; Bindi, M.; Carotenuto, F.; Moriondo, M.; Padovan, G.; Pardini, A.; Staglianò, N.; Vagnoli, C.; et al. Expected Changes to Alpine Pastures in Extent and Composition under Future Climate Conditions. Agronomy 2020, 10, 926. [Google Scholar] [CrossRef]
- Schirpke, U.; Kohler, M.; Leitinger, G.; Fontana, V.; Tasser, E.; Tappeiner, U. Future Impacts of Changing Land-Use and Climate on Ecosystem Services of Mountain Grassland and Their Resilience. Ecosyst. Serv. 2017, 26, 79–94. [Google Scholar] [CrossRef]
- Herzog, F.; Seidl, I. Swiss alpine summer farming: Current status and future development under climate change. Rangel. J. 2018, 40, 501–511. [Google Scholar] [CrossRef] [Green Version]
- De Boeck, H.J.; Bassin, S.; Verlinden, M.; Zeiter, M.; Hiltbrunner, E. Simulated Heat Waves Affected Alpine Grassland Only in Combination with Drought. New Phytol. 2016, 209, 531–541. [Google Scholar] [CrossRef]
- Smets, B.; Cai, Z.; Eklundh, L.; Tian, F.; Bonte, K.; Van Hoost, R.; De Roo, B.; Jacobs, T.; Camacho, F.; Sánchez-Zapero, J.; et al. High Resolution Vegetation Phenology and Productivity (HR-VPP), Seasonal Trajectories and VPP Parameters; Copernicus Land. Monitoring Service. 2022. Available online: https://land.copernicus.eu/user-corner/technical-library/product-user-manual-of-seasonal-trajectories (accessed on 10 July 2023).
- Clement, K.Y.; Botzen, W.J.W.; Brouwer, R.; Aerts, J.C.J.H. A Global Review of the Impact of Basis Risk on the Functioning of and Demand for Index Insurance. Int. J. Disaster Risk Reduct. 2018, 28, 845–853. [Google Scholar] [CrossRef]
- Keller, J.B.; Saitone, T.L. Basis Risk in the Pasture, Rangeland, and Forage Insurance Program: Evidence from California. Am. J. Agric. Econ. 2022, 104, 1203–1223. [Google Scholar] [CrossRef]
- Martín-Sotoca, J.J.; Saa-Requejo, A.; Moratiel, R.; Dalezios, N.; Faraslis, I.; Tarquis, A.M. Statistical Analysis for Satellite-Index-Based Insurance to Define Damaged Pasture Thresholds. Nat. Hazards Earth Syst. Sci. 2019, 19, 1685–1702. [Google Scholar] [CrossRef] [Green Version]
- Shen, X.; An, R.; Feng, L.; Ye, N.; Zhu, L.; Li, M. Vegetation Changes in the Three-River Headwaters Region of the Tibetan Plateau of China. Ecol. Indic. 2018, 93, 804–812. [Google Scholar] [CrossRef]
- Goodrich, B.; Yu, J.; Vandeveer, M. Participation Patterns of the Rainfall Index Insurance for Pasture, Rangeland and Forage Programme. Geneva Pap. Risk Insur. Issues Pract. 2020, 45, 29–51. [Google Scholar] [CrossRef]
- Williams, T.M.; Travis, W.R. Evaluating Alternative Drought Indicators in a Weather Index Insurance Instrument. Weather. Clim. Soc. 2019, 11, 629–649. [Google Scholar] [CrossRef]
- Reddersen, B.; Fricke, T.; Wachendorf, M. A Multi-Sensor Approach for Predicting Biomass of Extensively Managed Grassland. Comput. Electron. Agric. 2014, 109, 247–260. [Google Scholar] [CrossRef]
- Roumiguié, A.; Jacquin, A.; Sigel, G.; Poilvé, H.; Lepoivre, B.; Hagolle, O. Development of an Index-Based Insurance Product: Validation of a Forage Production Index Derived from Medium Spatial Resolution FCover Time Series. GISci. Remote Sens. 2015, 52, 94–113. [Google Scholar] [CrossRef]
- Roumiguié, A.; Jacquin, A.; Sigel, G.; Poilvé, H.; Hagolle, O.; Daydé, J. Validation of a Forage Production Index (FPI) Derived from MODIS FCover Time-Series Using High-Resolution Satellite Imagery: Methodology, Results and Opportunities. Remote Sens. 2015, 7, 11525–11550. [Google Scholar] [CrossRef] [Green Version]
- Roumiguié, A.; Sigel, G.; Poilvé, H.; Bouchard, B.; Vrieling, A.; Jacquin, A. Insuring Forage through Satellites: Testing Alternative Indices against Grassland Production Estimates for France. Int. J. Remote Sens. 2016, 38, 1912–1939. [Google Scholar] [CrossRef]
- Sawyer, G.; Oligschläger, C.; Khabarov, N. A Case Study Growing Potatoes in Belgium. ESA, Sentinels Benefits Study (SeBS). 2019. Available online: https://earsc.org/sebs/wp-content/uploads/2019/08/1_full-report-Growing-Potatoes-in-Belgium.pdf (accessed on 5 May 2023).
- Echeverría, A.; Urmeneta, A.; González-Audícana, M.; González, E.M. Monitoring Rainfed Alfalfa Growth in Semiarid Agrosystems Using Sentinel-2 Imagery. Remote Sens. 2021, 13, 4719. [Google Scholar] [CrossRef]
- Vajsová, B.; Fasbender, D.; Wirnhardt, C.; Lemajic, S.; Devos, W. Assessing Spatial Limits of Sentinel-2 Data on Arable Crops in the Context of Checks by Monitoring. Remote Sens. 2020, 12, 2195. [Google Scholar] [CrossRef]
- Defourny, P.; Bontemps, S.; Bellemans, N.; Cara, C.; Dedieu, G.; Guzzonato, E.; Hagolle, O.; Inglada, J.; Nicola, L.; Rabaute, T.; et al. Near Real-Time Agriculture Monitoring at National Scale at Parcel Resolution: Performance Assessment of the Sen2-Agri Automated System in Various Cropping Systems around the World. Remote Sens. Environ. 2019, 221, 551–568. [Google Scholar] [CrossRef]
- Holtgrave, A.K.; Röder, N.; Ackermann, A.; Erasmi, S.; Kleinschmit, B. Comparing Sentinel-1 and -2 Data and Indices for Agricultural Land Use Monitoring. Remote Sens. 2020, 12, 2919. [Google Scholar] [CrossRef]
- Kandasamy, S.; Baret, F.; Verger, A.; Neveux, P.; Weiss, M. A Comparison of Methods for Smoothing and Gap Filling Time Series of Remote Sensing Observations—Application to MODIS LAI Products. Biogeosciences 2013, 10, 4055–4071. [Google Scholar] [CrossRef] [Green Version]
- Adler, S.; Chimani, B.; Drechsel, S.; Haslinger, K.; Hiebl, J.; Meyer, V.; Resch, G.; Rudolph, J.; Vergeiner, J.Z.; Marigo, G.C.; et al. Das Klima von Tirol-Südtirol-Belluno. 2015. Available online: http://www.alpenklima.eu/images/Das_Klima_von_Tirol-Suedtirol-Belluno.pdf (accessed on 5 May 2023).
- CORINE Land Cover. Copernicus Land Monitoring Service. Available online: https://land.copernicus.eu/pan-european/corine-land-cover (accessed on 17 March 2023).
- Grassland. Copernicus Land Monitoring Service. Available online: https://land.copernicus.eu/pan-european/high-resolution-layers/grassland (accessed on 17 March 2023).
- Kasal, A.; Zelli, E.; Cassar, A.; Mair, V.; Dallagiacoma, E. Futterertrag Auf Naturwiesen in Südtirol. Laimburg J. 2004, 1, 86–94. [Google Scholar]
- Scotton, M.; Sicher, L.; Kasal, A. Semi-Natural Grasslands of the Non Valley (Eastern Italian Alps): Agronomic and Environmental Value of Traditional and New Alpine Hay-Meadow Types. Agric. Ecosyst. Environ. 2014, 197, 243–254. [Google Scholar] [CrossRef]
- Peratoner, G.; Pötsch, E.M. Methods to Describe the Botanical Composition of Vegetation in Grassland Research. Bodenkultur 2019, 70, 1–18. [Google Scholar] [CrossRef] [Green Version]
- LI-2200C Plant Canopy Analyzer. Available online: https://www.licor.com/env/products/leaf_area/LAI-2200C/?gclid=CjwKCAjw682TBhATEiwA9crl3-0bom1ZoJNNYbVlVUn9eZyD4-UcfkZVSTNzA2zi95HyiiqwV_hTFRoCzUoQAvD_BwE (accessed on 5 May 2022).
- Rossi, M.; Niedrist, G.; Asam, S.; Tonon, G.; Tomelleri, E.; Zebisch, M. A Comparison of the Signal from Diverse Optical Sensors for Monitoring Alpine Grassland Dynamics. Remote Sens. 2019, 11, 296. [Google Scholar] [CrossRef] [Green Version]
- Chiarito, E.; Cigna, F.; Cuozzo, G.; Fontanelli, G.; Aguilar, A.M.; Paloscia, S.; Rossi, M.; Santi, E.; Tapete, D.; Notarnicola, C. Biomass Retrieval Based on Genetic Algorithm Feature Selection and Support Vector Regression in Alpine Grassland Using Ground-Based Hyperspectral and Sentinel-1 SAR Data. Eur. J. Remote Sens. 2021, 54, 209–225. [Google Scholar] [CrossRef]
- Gascon, F.; Ramoino, F.; Deanos, Y.-L. Sentinel-2 Data Exploitation with ESA’s Sentinel-2 Toolbox. In Proceedings of the 19th EGU General Assembly, EGU2017, Vienna, Austria, 23–28 April 2017; p. 19548. [Google Scholar]
- Bulk Processing with GPT. SNAP Graph Processing Tool. Available online: https://senbox.atlassian.net/wiki/spaces/SNAP/pages/70503475/Bulk+Processing+with+GPT (accessed on 5 July 2023).
- Main-Knorn, M.; Pflug, B.; Louis, J.; Debaecker, V.; Müller-Wilm, U.; Gascon, F. Sen2Cor for Sentinel-2. In Proceedings of the Image and Signal Processing for Remote Sensing XXIII, SPIE Remote Sensing, Warsaw, Poland, 11–14 September 2017; Volume 1042704. [Google Scholar] [CrossRef] [Green Version]
- Vegetation Indices. Copernicus Land Monitoring Service. Available online: https://land.copernicus.eu/pan-european/biophysical-parameters/high-resolution-vegetation-phenology-and-productivity/vegetation-indices (accessed on 6 July 2023).
- GitHub—Sentinel-Hub/Sentinel2-Cloud-Detector: Sentinel Hub Cloud Detector for Sentinel-2 Images in Python. Available online: https://github.com/sentinel-hub/sentinel2-cloud-detector (accessed on 9 February 2022).
- Rasmussen, C.E. Gaussian Processes in Machine Learning. In Lecture Notes in Computer Science; Including Subseries Lecture Notes in Artificial Intelligence and Lecture Notes in Bioinformatics; Springer: Berlin/Heidelberg, Germany, 2004; Volume 3176, pp. 63–71. [Google Scholar] [CrossRef] [Green Version]
- Verrelst, J.; Rivera, J.P.; Moreno, J.; Camps-Valls, G. Gaussian Processes Uncertainty Estimates in Experimental Sentinel-2 LAI and Leaf Chlorophyll Content Retrieval. ISPRS J. Photogramm. Remote Sens. 2013, 86, 157–167. [Google Scholar] [CrossRef]
- Pipia, L.; Amin, E.; Belda, S.; Salinero-Delgado, M.; Verrelst, J. Green LAI Mapping and Cloud Gap-Filling Using Gaussian Process Regression in Google Earth Engine. Remote Sens. 2021, 13, 403. [Google Scholar] [CrossRef]
- Camps-Valls, G.; Verrelst, J.; Munoz-Mari, J.; Laparra, V.; Mateo-Jimenez, F.; Gomez-Dans, J. A Survey on Gaussian Processes for Earth-Observation Data Analysis: A Comprehensive Investigation. IEEE Geosci. Remote Sens. Mag. 2016, 4, 58–78. [Google Scholar] [CrossRef] [Green Version]
- Stein, M.L. Interpolation of Spatial Data; Springer: New York, NY, USA, 1999. [Google Scholar] [CrossRef]
- Python API Reference—Xgboost 1.7.4 Documentation. Available online: https://xgboost.readthedocs.io/en/stable/python/python_api.html (accessed on 21 March 2023).
- GitHub. Fmfn/BayesianOptimization: A Python Implementation of Global Optimization with Gaussian Processes. Available online: https://github.com/fmfn/BayesianOptimization (accessed on 21 March 2023).
- Jensen, M.E.; Haise, H.R. Estimating Evapotranspiration from Solar Radiation. J. Irrig. Drain. Div. 1963, 89, 15–41. [Google Scholar] [CrossRef]
- Crespi, A.; Matiu, M.; Bertoldi, G.; Petitta, M.; Zebisch, M. A high-resolution gridded dataset of daily temperature and precipitation records (1980–2018) for Trentino—South Tyrol (north-eastern Italian Alps). Earth Syst. Sci. Data 2021, 13, 2801–2818. [Google Scholar] [CrossRef]
- Bartkowiak, P.; Castelli, M.; Crespi, A.; Niedrist, G.; Zanotelli, D.; Colombo, R.; Notarnicola, C. Land Surface Temperature Reconstruction Under Long-Term Cloudy-Sky Conditions at 250 m Spatial Resolution: Case Study of Vinschgau/Venosta Valley in the European Alps. IEEE J. Sel. Top. Appl. Earth Obs. Remote Sens. 2022, 15, 2037–2057. [Google Scholar] [CrossRef]
- EUR-Lex—32020R2220—EN—EUR-Lex. Available online: https://eur-lex.europa.eu/legal-content/IT/TXT/?uri=celex%3A32020R2220 (accessed on 8 February 2022).
- Mipaaf. DM n.9402305 Del 29/12/2020—Piano Di Gestione Dei Rischi in Agricoltura. 2021. Available online: https://www.politicheagricole.it/flex/cm/pages/ServeBLOB.php/L/IT/IDPagina/16490 (accessed on 9 February 2023).
- Van Rossum, G.; Drake, F.L. Python 3 Reference Manual; CreateSpace: Scotts Valley, CA, USA, 2009; ISBN 978-1-4414-1269-0. [Google Scholar]
- R Core Team. R: A Language and Environment for Statistical Computing; R Foundation for Statistical Computing: Vienna, Austria, 2023; Available online: https://www.r-project.org/ (accessed on 10 July 2023).
- Pipia, L.; Muñoz-Marí, J.; Amin, E.; Belda, S.; Camps-Valls, G.; Verrelst, J. Fusing Optical and SAR Time Series for LAI Gap Filling with Multioutput Gaussian Processes. Remote Sens. Environ. 2019, 235, 111452. [Google Scholar] [CrossRef]
- Mandal, D.; Kumar, V.; Ratha, D.; Dey, S.; Bhattacharya, A.; Lopez-Sanchez, J.M.; McNairn, H.; Rao, Y.S. Dual Polarimetric Radar Vegetation Index for Crop Growth Monitoring Using Sentinel-1 SAR Data. Remote Sens. Environ. 2020, 247, 111954. [Google Scholar] [CrossRef]
- Nasirzadehdizaji, R.; Sanli, F.B.; Abdikan, S.; Cakir, Z.; Sekertekin, A.; Ustuner, M. Sensitivity analysis of multi-temporal Sentinel-1 SAR parameters to crop height and canopy coverage. Appl. Sci. 2019, 9, 655. [Google Scholar] [CrossRef] [Green Version]
- Veloso, A.; Mermoz, S.; Bouvet, A.; Le Toan, T.; Planells, M.; Dejoux, J.F.; Ceschia, E. Understanding the Temporal Behavior of Crops Using Sentinel-1 and Sentinel-2-like Data for Agricultural Applications. Remote Sens. Environ. 2017, 199, 415–426. [Google Scholar] [CrossRef]
- Greifeneder, F.; Notarnicola, C.; Wagner, W. A Machine Learning-Based Approach for Surface Soil Moisture Estimations with Google Earth Engine. Remote Sens. 2021, 13, 2099. [Google Scholar] [CrossRef]
- Ministero dell’Agricoltura, Della Sovranità Alimentare e Delle Foreste Piano di Gestione dei Rischi in Agricoltura 2022. DM n. 148418 del 31/03/2022—Piano di Gestione dei Rischi in Agricoltura. 2022. Available online: https://www.politicheagricole.it/flex/cm/pages/ServeBLOB.php/L/IT/IDPagina/17999 (accessed on 8 November 2022).
- Vroege, W.; Dalhaus, T.; Finger, R. Index Insurances for Grasslands—A Review for Europe and North-America. Agric. Syst. 2019, 168, 101–111. [Google Scholar] [CrossRef]
- Dalhaus, T.; Finger, R. Can Gridded Precipitation Data and Phenological Observations Reduce Basis Risk of Weather Index-Based Insurance? Weather Clim. Soc. 2016, 8, 409–419. [Google Scholar] [CrossRef]
- De Vroey, M.; Radoux, J.; Defourny, P. Grassland Mowing Detection Using Sentinel-1 Time Series: Potential and Limitations. Remote Sens. 2021, 13, 348. [Google Scholar] [CrossRef]
- Reinermann, S.; Gessner, U.; Asam, S.; Ullmann, T.; Schucknecht, A.; Kuenzer, C. Detection of Grassland Mowing Events for Germany by Combining Sentinel-1 and Sentinel-2 Time Series. Remote Sens. 2022, 14, 1647. [Google Scholar] [CrossRef]
- Earth Observation for Alpine Ecosystems. Alps Regional Initiative. Available online: https://www.eurac.edu/en/institutes-centers/institute-for-earth-observation/projects/eco4alps (accessed on 5 June 2023).
- Liu, S.; Jin, X.; Nie, C.; Wang, S.; Yu, X.; Cheng, M.; Shao, M.; Wang, Z.; Tuohuti, N.; Bai, Y.; et al. Estimating Leaf Area Index Using Unmanned Aerial Vehicle Data: Shallow vs. Deep Machine Learning Algorithms. Plant Physiol. 2021, 187, 1551–1576. [Google Scholar] [CrossRef]
- Andreatta, D.; Gianelle, D.; Scotton, M.; Vescovo, L.; Dalponte, M. Detection of Grassland Mowing Frequency Using Time Series of Vegetation Indices from Sentinel-2 Imagery. GISci. Remote Sens. 2022, 59, 481–500. [Google Scholar] [CrossRef]
- Brown, L.A.; Fernandes, R.; Djamai, N.; Meier, C.; Gobron, N.; Morris, H.; Canisius, F.; Bai, G.; Lerebourg, C.; Lanconelli, C.; et al. Validation of Baseline and Modified Sentinel-2 Level 2 Prototype Processor Leaf Area Index Retrievals over the United States. ISPRS J. Photogramm. Remote Sens. 2021, 175, 71–87. [Google Scholar] [CrossRef]
- Sánchez-Zapero, J.; Camacho, F.; Swinnen, E.; Bonte, K.; Martinez-Sánchez, E. Validation Report. Copernicus Land Monitoring Service. High Resolution Vegetation Phenology and Productivity (HRVPP), Daily Raw Vegetation Indices. Available online: https://land.copernicus.eu/user-corner/technical-library/validation-report-of-vegetation-indices (accessed on 5 July 2023).
- Bériaux, E.; Waldner, F.; Collienne, F.; Bogaert, P.; Defourny, P. Maize Leaf Area Index Retrieval from Synthetic Quad Pol SAR Time Series Using the Water Cloud Model. Remote Sens. 2015, 7, 16204–16225. [Google Scholar] [CrossRef] [Green Version]
- Peratoner, G.; Sicher, G.; Matteazzi, A. Richtwerte des Nährstoffgehalts von Wirtschaftsdüngern in Südtirol. Tabellenwerk 2022. Versuchszentrum Laimburg: Pfatten/Vadena, Italy, 2022. Available online: https://t1p.de/kmm9 (accessed on 10 July 2023).


| Site | Parcels Codes | Elevation [m asl] | Years | Type of Measurement | Frequency of Measurement |
|---|---|---|---|---|---|
| Laurein/Lauregno (BZ) | L1, L2 | 1330–1340 | 2021 | LAI and yield | Every 1–2 weeks |
| Ritten/Renon (BZ) | R1, R2, R3, R4 | 1250–1270 | 2021 | LAI and yield | Every 1–2 weeks |
| Muntatschinig/ Monteschino (BZ) | V1, P2 | 1490, 1549 | 2017–2021 | LAI | 1 to 3 per month |
| Fondo (TN) | F1, F2 | 970 | 2021 | LAI and yield | Every 1–2 weeks |
| Elevation [m asl] | DOY of Start of the Growing Season (SOS) | DOY of End of the Growing Season (EOS) |
|---|---|---|
| <500 | 79 | 273 |
| 500–699 | 84 | 263 |
| 700–899 | 91 | 258 |
| 900–1099 | 100 | 253 |
| 1100–1299 | 105 | 248 |
| 1300–1500 | 121 | 242 |
| Land Use | Number of Parcels | Minimum Parcel Area [m2] | Maximum Parcel Area [m2] |
|---|---|---|---|
| Wooded summer pasture, tare 20% | 21 | 64 | 154,924 |
| Wooded summer pasture, tare 50% | 12 | 397 | 42,743 |
| Summer pasture | 4 | 4602 | 11,346 |
| Pasture | 5 | 958 | 16,428 |
| Wooded pasture, tare 20% | 8 | 507 | 2131 |
| Permanent meadow | 64 | 28 | 72,467 |
| Meadow, special area | 4 | 981 | 4844 |
| Parcel | Years | MAE [m2 m−2] | RMSE [m2 m−2] | MB [m2 m−2] | R2 | n |
|---|---|---|---|---|---|---|
| F1 | 2021 | 0.58 | 0.71 | −0.39 | 0.88 | 21 |
| F2 | 2021 | 0.69 | 0.87 | −0.69 | 0.85 | 8 |
| L1 | 2021 | 0.98 | 1.10 | 0.18 | 0.83 | 11 |
| L2 | 2021 | 0.58 | 0.81 | −0.11 | 0.83 | 11 |
| R1 | 2021 | 0.82 | 1.01 | 0.08 | 0.85 | 25 |
| R2 | 2021 | 0.96 | 1.20 | 0.81 | 0.74 | 19 |
| R3 | 2021 | 0.72 | 0.98 | 0.20 | 0.48 | 25 |
| R4 | 2021 | 0.86 | 0.95 | 0.67 | 0.83 | 20 |
| V1 | 2017–2021 | 0.92 | 1.10 | 0.30 | 0.69 | 60 |
| P2 | 2017–2021 | 0.59 | 0.67 | 0.53 | 0.12 | 89 |
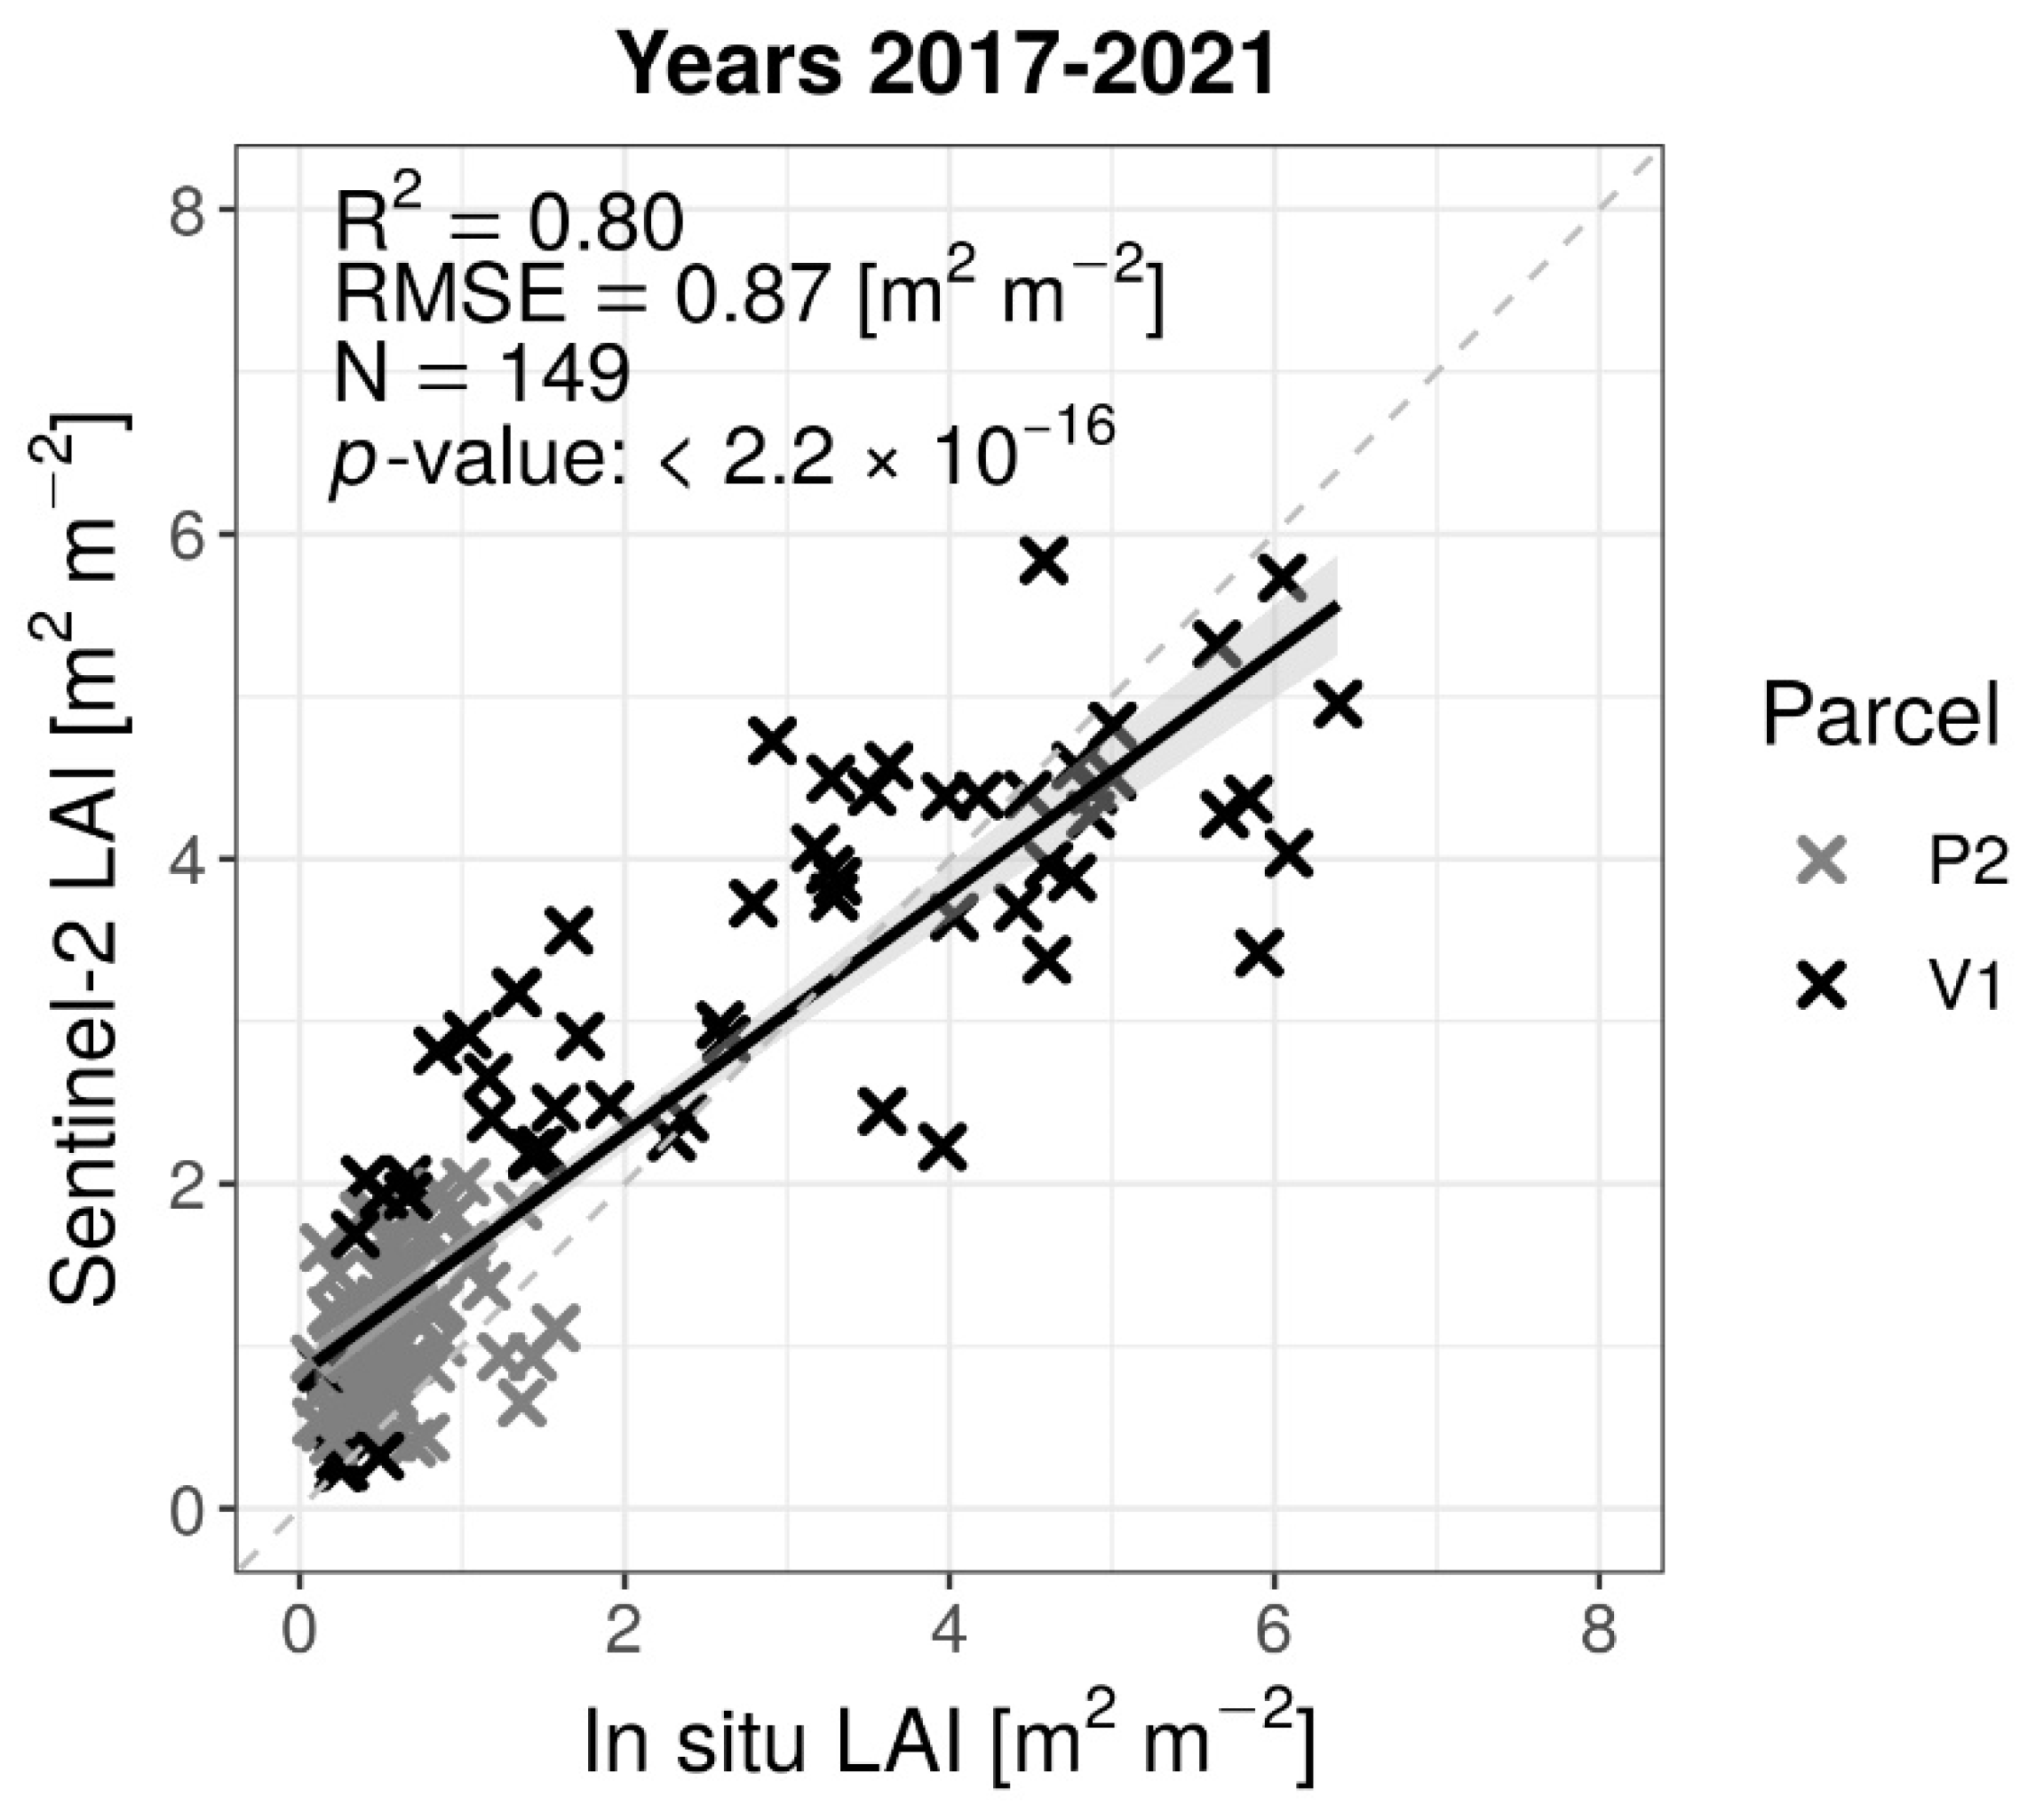
| V1, P2 (Figure 6) | 2017–2021 | 0.72 | 0.87 | 0.44 | 0.80 | 149 |
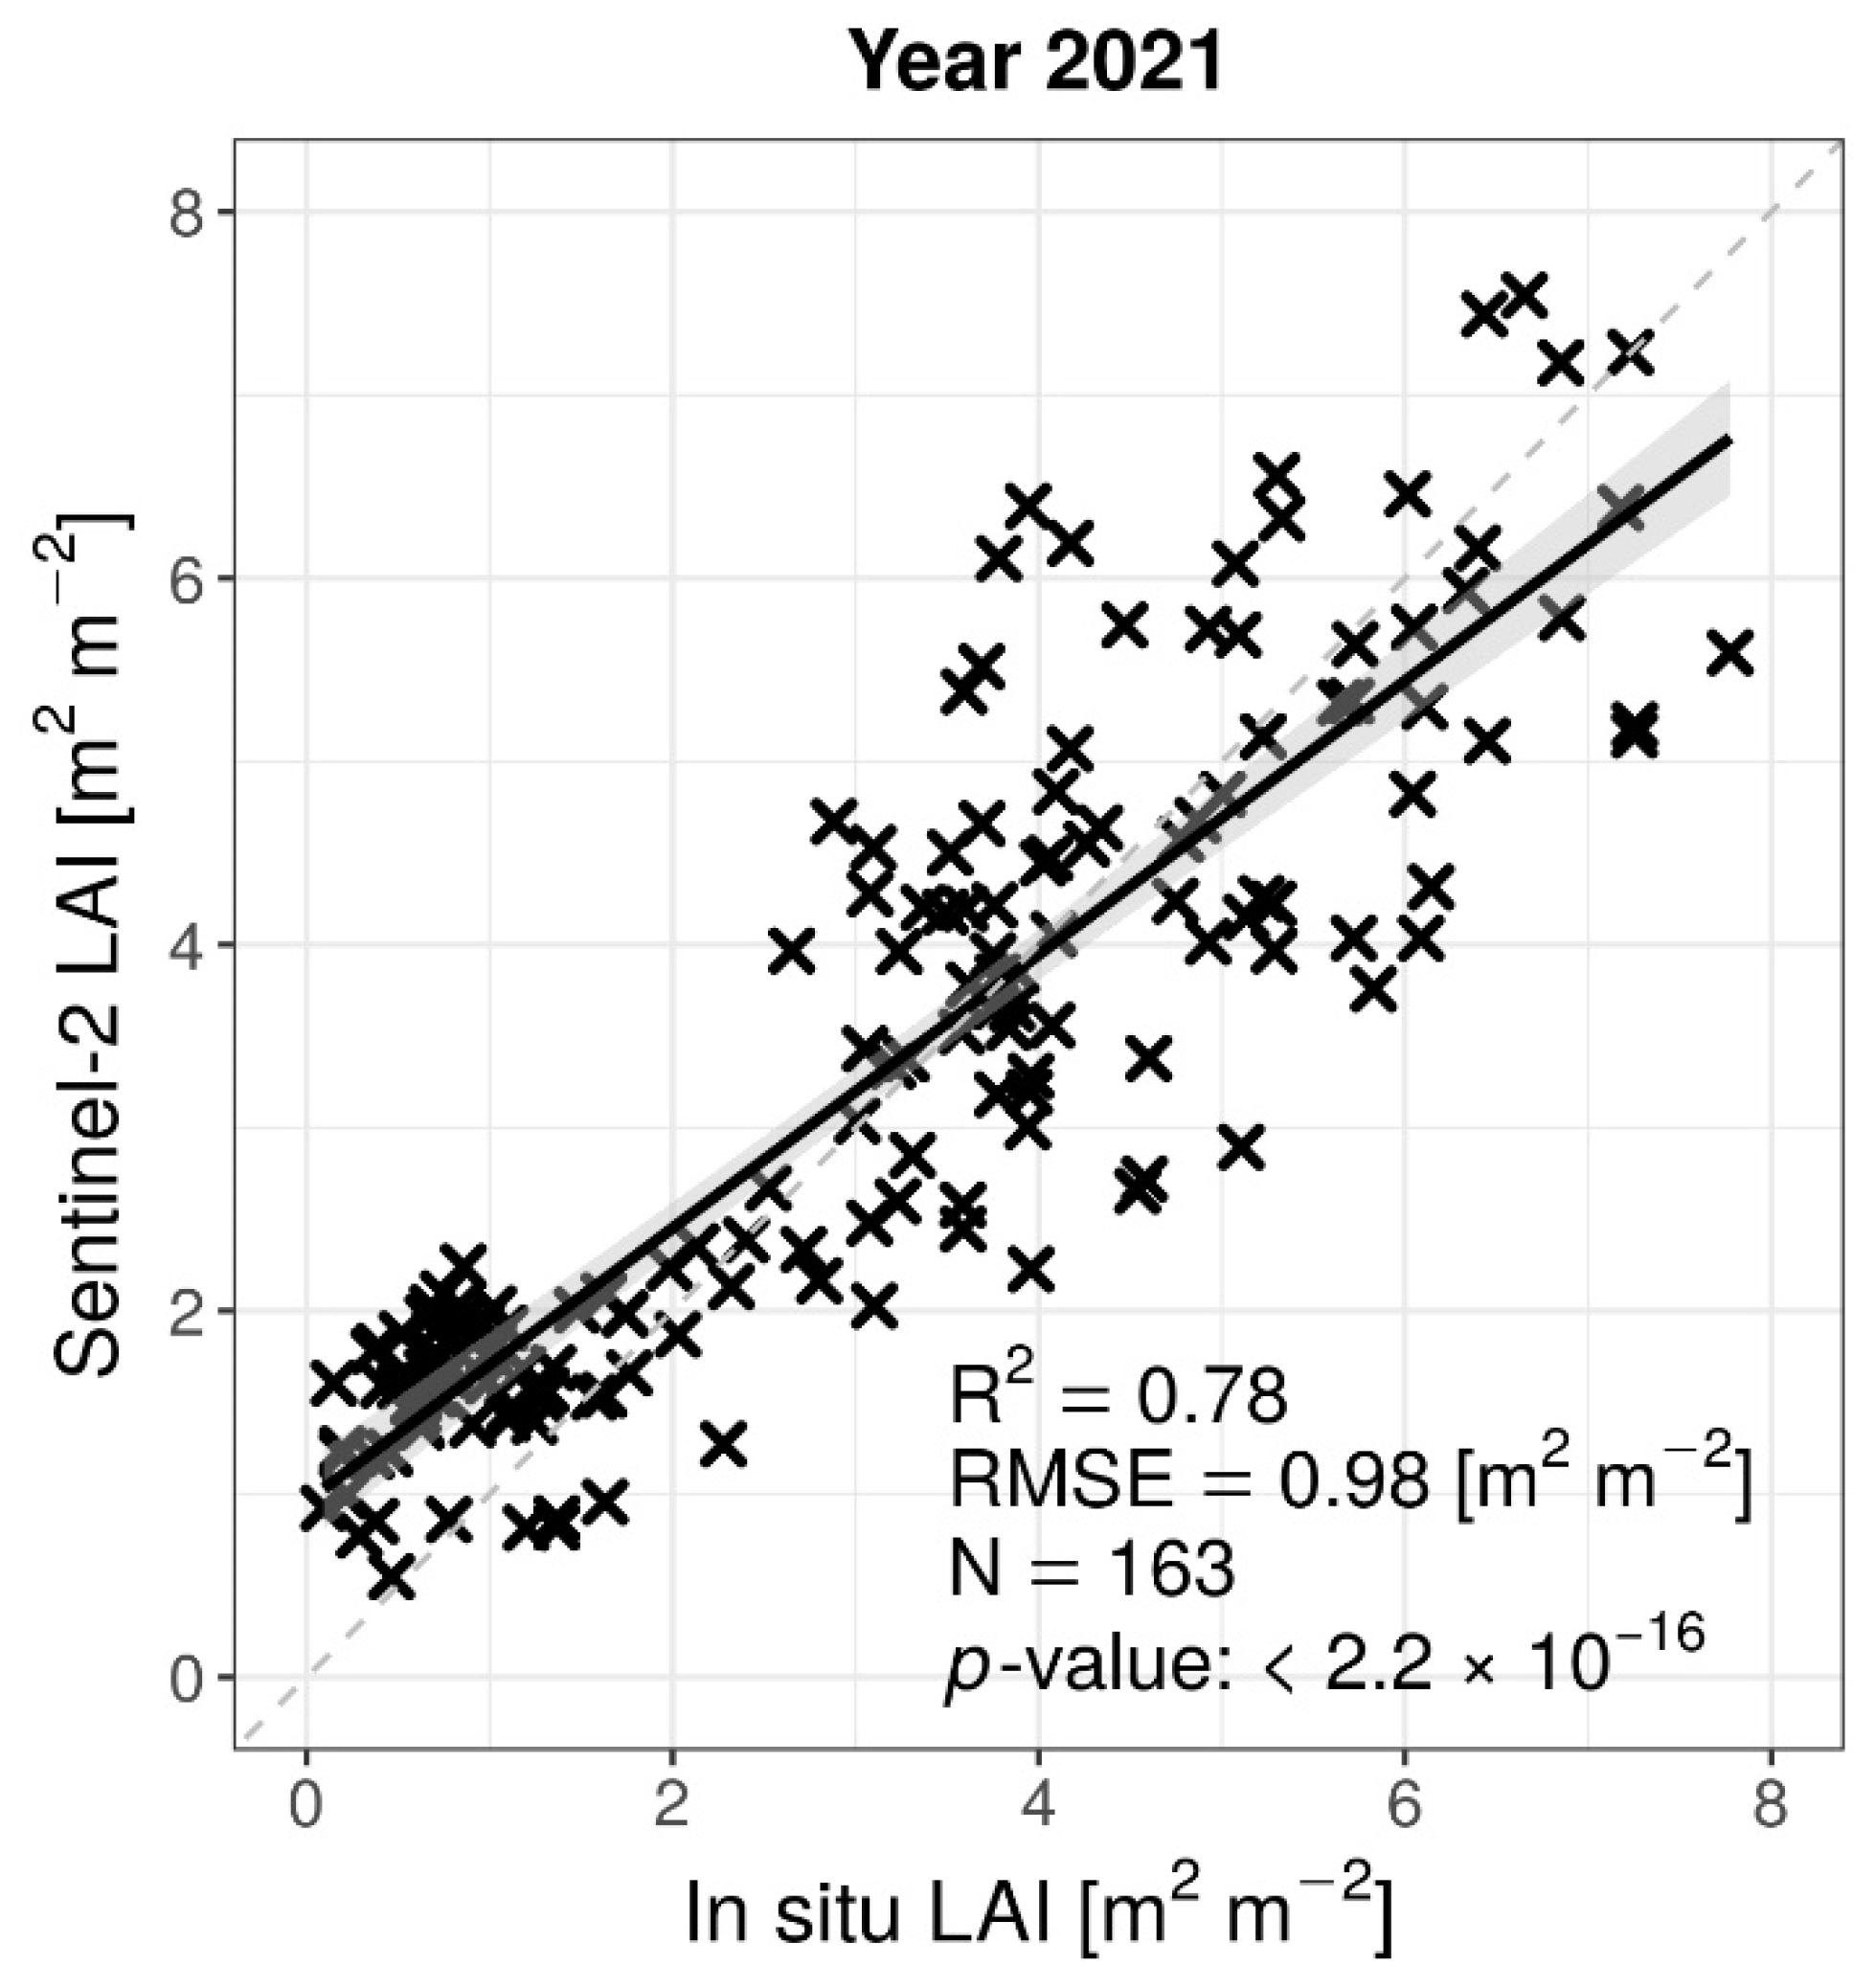
| All (Figure 5) | 2021 | 0.78 | 0.98 | −0.19 | 0.78 | 163 |
| All | 2017–2021 | 0.80 | 0.92 | −0.31 | 0.81 | 289 |
Disclaimer/Publisher’s Note: The statements, opinions and data contained in all publications are solely those of the individual author(s) and contributor(s) and not of MDPI and/or the editor(s). MDPI and/or the editor(s) disclaim responsibility for any injury to people or property resulting from any ideas, methods, instructions or products referred to in the content. |
© 2023 by the authors. Licensee MDPI, Basel, Switzerland. This article is an open access article distributed under the terms and conditions of the Creative Commons Attribution (CC BY) license (https://creativecommons.org/licenses/by/4.0/).
Share and Cite
Castelli, M.; Peratoner, G.; Pasolli, L.; Molisse, G.; Dovas, A.; Sicher, G.; Crespi, A.; Rossi, M.; Alasawedah, M.H.; Soini, E.; et al. Insuring Alpine Grasslands against Drought-Related Yield Losses Using Sentinel-2 Satellite Data. Remote Sens. 2023, 15, 3542. https://doi.org/10.3390/rs15143542
Castelli M, Peratoner G, Pasolli L, Molisse G, Dovas A, Sicher G, Crespi A, Rossi M, Alasawedah MH, Soini E, et al. Insuring Alpine Grasslands against Drought-Related Yield Losses Using Sentinel-2 Satellite Data. Remote Sensing. 2023; 15(14):3542. https://doi.org/10.3390/rs15143542
Chicago/Turabian StyleCastelli, Mariapina, Giovanni Peratoner, Luca Pasolli, Giulia Molisse, Alexander Dovas, Gabriel Sicher, Alice Crespi, Mattia Rossi, Mohammad Hussein Alasawedah, Evelyn Soini, and et al. 2023. "Insuring Alpine Grasslands against Drought-Related Yield Losses Using Sentinel-2 Satellite Data" Remote Sensing 15, no. 14: 3542. https://doi.org/10.3390/rs15143542