Communication

Feature Enhancement Using Multi-Baseline SAR Interferometry-Correlated Synthesis Images for Power Transmission Tower Detection in Mountain Layover Area

1
School of Electronics and Information, Northwestern Polytechnical University, Xi’an 710072, China
2
School of Automation, Central South University, Changsha 410083, China
*
Author to whom correspondence should be addressed.
Remote Sens. 2023, 15(15), 3823; https://doi.org/10.3390/rs15153823
Submission received: 14 June 2023 / Revised: 29 July 2023 / Accepted: 29 July 2023 / Published: 31 July 2023
(This article belongs to the Special Issue Spaceborne High-Resolution SAR Imaging)

Abstract

:
The detection performance of power transmission towers in mountainous areas using SAR amplitude images is obviously influenced by the strong layover background (mainly including vegetation and soil) clutter interference around the towers. In this paper, power transmission tower detection in a mountainous layover area, using single-baseline SAR interferometry coherence images, which show better feature enhancement effectiveness compared to SAR amplitude images, is presented. Moreover, a novel feature enhancement method, that of generating multi-baseline SAR interferometry-correlated synthesis images for power transmission tower detection in a mountain layover area, is proposed. It demonstrates better feature enhancement (layover background cluster suppression) than that using single-baseline SAR interferometry coherence images. Theoretical analysis illustrates that the mountainous layover background clutter interference can be suppressed in the proposed single-baseline/multi-baseline SAR interferometry-correlated synthesis image. Experiments including over 12 repeat-pass TerraSAR-X staring spotlight mode acquisitions were conducted, and the results demonstrate that the detection performance with the use of multi-baseline SAR interferometry-correlated synthesis images showed an improvement of more than 43.6%, compared with the traditional method of using SAR amplitude images when benchmark deep learning-based detectors are used, i.e., Faster RCNN and YOLOv7.

Graphical Abstract

1. Introduction

In China, many power transmission towers are located on mountainous soil or vegetated terrain, as shown in Figure 1. In summer, some natural disasters, such as landslides and debris flow, caused by heavy storms, occur often. For a long time, these disasters resulted in the inclination, or even collapse, of power transmission towers. Spaceborne synthetic aperture radar (SAR) is a widely used technique in remote sensing and non-destructive testing applications [1,2,3,4,5]. SAR is also a potential technique for monitoring the safety status of power transmission towers. For the safety status monitoring of power transmission towers, the inclination degree of a power transmission tower during one period could be calculated using improved differential interferometry SAR (D-InSAR) [6].
For the improved D-InSAR technique, the first step is to detect the locations of all power transmission towers in an entire SAR image. Then, the inclination degrees of every power transmission tower can be obtained using the improved D-InSAR technique. Tower detection is essentially a problem of geometric structure detection of the tower within the detection box. The amplitude of the SAR image was always selected as the feature for power transmission tower detection [7,8], which presented good detection performance in areas without much layover influence, such as relatively flat land areas. Nevertheless, in steep mountain areas, there is significant layover, resulting in strong scattering values in the SAR amplitude image. Such layover, presented as strong background cluster interference around the power transmission towers, will influence the entire geometric structure detection of towers in the detection box, thus influencing the detection performance of the power transmission towers located in steep mountain areas.
For the two repeat-pass spaceborne SAR acquisitions, the feature of SAR interferometry coherence has already shown better effectiveness for land cover classification than the feature of SAR amplitude [9]. For InSAR applications, the decorrelation process of the two repeat-pass spaceborne SAR acquisitions mainly includes spatial baseline decorrelation and temporal decorrelation. In general, the spatial baseline decorrelation is relatively slight if the spatial baseline of the two repeat-pass spaceborne SAR acquisitions is not very long. Most mountainous areas where power transmission towers are located include vegetation or soil. Consequently, the SAR interferometry coherence value around the tower is very low, due to the statistical temporal decorrelation from the vegetation and soil. In contrary, for a relatively short spatial baseline, the SAR interferometry coherence value of the power transmission tower itself is still high, because power transmission towers are made of metal, and thus can remain stable/persistent along the temporal dimension. Based on this, the feature enhancement method, using single-baseline SAR interferometry coherence images for power transmission tower detection in mountainous layover areas, is presented in this paper. Moreover, a novel feature enhancement method, using multi-baseline SAR interferometry-correlated synthesis images for power transmission tower detection in mountainous layover areas, which demonstrates better feature enhancement than that using single-baseline SAR interferometry coherence images, is proposed.
Specifically, the geometric illustration of power transmission towers located on mountainous layover areas is analyzed, and theoretical analysis is further conducted in order to illustrate that the mountainous layover background (i.e., vegetation or soil) clutter interference can be effectively suppressed in the proposed single-baseline coherence image/multi-baseline SAR interferometry-correlated synthesis image. In recent years, deep learning methods have been widely used in object detection applications. For object detection applications, the current deep learning methods also include two-stage methods (such as Region-based CNN (R-CNN), Fast R-CNN, and Faster R-CNN) and one-stage methods (such as you only look once (YOLO) series and single-shot multibox detector (SSD)) [10,11,12,13,14,15,16,17,18,19,20]. Faster R-CNN and YOLOv7 are newer technologies among two-stage and one-stage object detection methods, and they show better comprehensive performance than previous versions. Consequently, in this paper, two benchmark object detectors, based on Faster R-CNN [12] and YOLOv7 [14], were used to demonstrate the detection performance of the proposed method.
The remainder of this paper is organized as follows. The principle of the proposed method will be elaborated upon in Section 2. The experimental results will be analyzed in Section 3 in detail. Section 4 presents the conclusion.

2. Methods

2.1. Power Transmission Tower Detection of Traditional Method Using SAR Amplitude Image

For one spaceborne SAR acquisition, let s denote the complex signal value of the spaceborne SAR acquisition. Figure 2a illustrates a geometric diagram of a power transmission tower located on a mountainous layover area. The layover background (LB) around the power transmission tower mainly includes vegetation and soil. Observed from Figure 2a, we have
s L B = s l b _ 1 + l b _ 2 + ... + l b _ n
where l b _ i i = 1 , 2 , , n denotes the scattering points at different locations along the same equal distance to the radar (i.e., layover line) of the mountainous layover background around the power transmission tower. In traditional object detection applications based on SAR acquisitions, the SAR amplitude was always used as the feature to be detected. Generally, s L B (where “ · ” denotes the amplitude value), will be relatively large and will seriously influence the entire geometric structure detection of the tower in the detection box of the SAR amplitude image. We can define C s as
C s = E s L B E s t o w e r > 0
where E · denotes the expectation value that can be estimated using one small spatial region around the located pixels. C s can be quantitatively evaluated for the interference degree of the mountainous layover background in power transmission tower detection using a SAR amplitude image. The higher the value of C s , the stronger the interference degree of the mountainous layover background in power transmission tower detection. The specific values of C s can be estimated statistically from the real SAR images. As analyzed statistically in Section 3.2, the typical value of C s is generally focused on the region of 0.5~2. Figure 2b is the workflow of the traditional power transmission tower detection method using a SAR amplitude image.

2.2. Feature Enhancement Using Single-Baseline SAR Interferometry Coherence Image for Power Transmission Tower Detection in Mountain Layover Area

Persistent scatterers, like power transmission towers made of metal, can remain in a stable phase along the temporal dimension. The persistent/stable tower can be modeled as follows:
s t o w e r _ x = s s i g n a l _ x + s n o i s e _ x
where s s i g n a l _ x and s n o i s e _ x represent the stable signal and noise parts of the x th SAR acquisition (where x = 1 , 2 in this section), respectively. The noise variables are modeled as independent, and identically zero-mean complex Gaussian random distributed, with the following relationships:
s s i g n a l _ x = σ s _ x
E s n o i s e _ x s n o i s e _ x = E s n o i s e _ x 2 = σ n _ x 2
where “*” indicates complex conjugation. The signal-to-noise ratio (SNR) of the tower is defined as follows:
S N R t o w e r _ x = s s i g n a l _ x 2 E s n o i s e _ x 2 = σ s _ x 2 σ n _ x 2
While the scattering values of vegetation and much of the soil surface change—with different soil moisture concentrations in different weather conditions, or due to the other physical motions caused by a landslide or other event—in mountainous layover background areas around the power transmission tower, especially the phase, they will change dramatically along the temporal dimension. The layover background cluster variable can be modeled as follows:
s L B _ x = a x e j δ x
where the amplitude a is Rayleigh distributed, and δ is uniformly distributed over π , π [21]. s L B _ x is independently zero-mean complex Gaussian distributed, with the following relationship:
E s L B _ x s L B _ x = E s L B _ x 2 = σ l _ x 2
For two repeat-pass spaceborne SAR acquisitions, the single-baseline interferometry coherence γ is defined as follows [22,23]:
γ = E s 1 s 2 * E s 1 s 1 * E s 2 s 2 * , 0 γ 1
where γ represents the statistical stability degree along the spatial and time dimensions for the two SAR acquisitions. s 1 and s 2 , respectively, denote the complex signal values of the two spaceborne SAR acquisitions. Substituting (3), (4), (5), and (6) into (9), we obtain:
γ t o w e r = E s s i g n a l _ 1 + s n o i s e _ 1 s s i g n a l _ 2 * + s n o i s e _ 2 * E s s i g n a l _ 1 + s n o i s e _ 1 s s i g n a l _ 1 * + s n o i s e _ 1 * E s s i g n a l _ 2 + s n o i s e _ 2 s s i g n a l _ 2 * + s n o i s e _ 2 * = σ s _ 1 σ s _ 2 * σ s _ 1 2 + σ n _ 1 2 σ s _ 2 2 + σ n _ 2 2 = 1 1 + 1 / S N R t o w e r _ 1 1 + 1 / S N R t o w e r _ 2
From (10), we can see, the higher S N R t o w e r _ 1 and S N R t o w e r _ 2 , the higher γ t o w e r . Generally, for a power transmission tower made of metal, which has a strong scattering value, S N R t o w e r is very high. From the statistical analysis of the real SAR interferometry coherence image shown in Section 3, we can estimate:
γ t o w e r 1
Substituting (7) and (8) into (9), considering s L B _ 1 and s L B _ 2 are independent of each other, according to the statistical theory, we have:
γ L B = E s L B _ 1 s L B _ 2 * E s L B _ 1 s L B _ 1 * E s L B _ 2 s L B _ 2 * = 0 σ l _ 1 2 σ l _ 2 2 = 0
We can define C γ as follows:
C γ = E γ L B E γ t o w e r = 0
From (2) and (13), we can theoretically conclude:
C γ < C s
In practical images, γ L B is estimated using one small spatial region around the located pixels. Consequently, E γ L B and C γ are approximately, but not strictly, equal to 0. C γ can be quantitatively evaluated for the interference degree of the mountainous layover background in power transmission tower detection using single-baseline SAR interferometry coherence images. Similarly to C s , elaborated upon in Section 2.1, and as analyzed statistically in Section 3.2, from the real SAR images, the typical values of C γ are generally focused in the region of 0.15~0.25.
From (14) and the above statistical analysis, compared with the use of SAR amplitude images, we can see the mean contrast between the mountainous layover background cluster around a power transmission tower and the power transmission tower itself would be obviously suppressed by using a single-baseline SAR interferometry coherence image for power transmission tower detection. Detecting the power transmission towers located at the steep mountain areas using single-baseline SAR interferometry coherence images demonstrates better detecting performance than that of detection using SAR amplitude images.

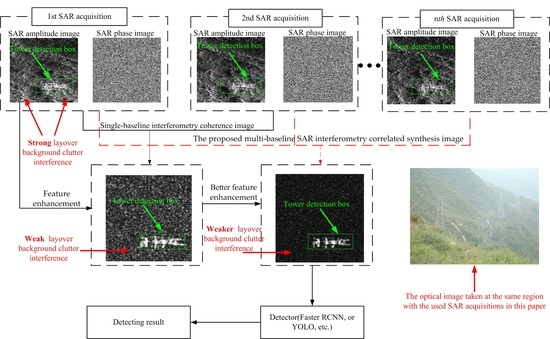
2.3. Feature Enhancement Using Multi-Baseline SAR Interferometry-Correlated Synthesis Image for Power Transmission Tower Detection in Mountainous Layover Area

For multiple repeat-pass spaceborne SAR acquisitions, the multi-baseline interferometry-correlated function γ F a n g l e 13 , a n g l e 14 , ... , a n g l e 1 n , with variables a n g l e 13 , a n g l e 14 , …, a n g l e 1 n can be defined as follows:
γ F a n g l e 13 , a n g l e 14 , ... , a n g l e 1 n = E s 1 s 2 * + E s 1 s 3 * e j * a n g l e 13 + ... + E s 1 s n * e j * a n g l e 1 n E s 1 s 1 * E s 2 s 2 * + E s 1 s 1 * E s 3 s 3 * + ... + E s 1 s 1 * E s n s n *
For the power transmission towers, (15) can be rewritten as follows:
γ F t o w e r a n g l e 13 , a n g l e 14 , ... , a n g l e 1 n = σ s _ 1 σ s _ 2 * + σ s _ 1 σ s _ 3 * e j * a n g l e 13 + ... + σ s _ 1 σ s _ n * e j * a n g l e 1 n σ s _ 1 2 + σ n _ 1 2 σ s _ 2 2 + σ n _ 2 2 + σ s _ 1 2 + σ n _ 1 2 σ s _ 3 2 + σ n _ 3 2 + ... + σ s _ 1 2 + σ n _ 1 2 σ s _ n 2 + σ n _ n 2
In order to obtain the highest multi-baseline interferometry-correlated function value of the power transmission tower, we need to optimize the function γ F t o w e r a n g l e 13 , a n g l e 14 , ... , a n g l e 1 n . Then, we obtain:
a n g l e 13 _ m , a n g l e 14 _ m , ... , a n g l e 1 n _ m = arg max a n g l e 13 , a n g l e 14 , ... , a n g l e 1 n γ F t o w e r
From Figure 3a, we can see that the equation σ s _ 1 σ s _ 2 * + σ s _ 1 σ s _ 3 * e j * a n g l e 13 + ... + σ s _ 1 σ s _ n * e j * a n g l e 1 n can be at its highest if and only if all of the vector lines ( σ s _ 1 σ s _ 3 * , …, σ s _ 1 σ s _ n * ) coincide with the vector line σ s _ 1 σ s _ 2 * via rotating the angles ( a n g l e 13 _ m , …, a n g l e 1 n _ m ). As previously mentioned, γ and γ F are estimated using a small spatial region around the located pixels, such as a 5 × 5-pixel window. Due to the phase stability of the power transmission tower along the temporal dimension, the SAR interferometry complex values (i.e., s 1 s x * , where x = 2 , 3 , ... , n ) are highly correlated between each other in the k × k (such as 5 × 5)-pixel window for estimating γ and γ F . Thus, a n g l e 1 n _ m can be estimated using the phase deviation of any pixel between s 1 s 2 * and s 1 s n * in the k × k-pixel window (the other angles, such as a n g l e 13 _ m , can be estimated similarly). In practical SAR images, considering the noise influence in the k × k-pixel window, the pixel which has the highest single-baseline interferometry coherence value (i.e., γ ) is used to estimate a n g l e 1 n _ m , i.e.,
i max , j max = arg max i , j γ
where i and j denote the line number and column number in a k × k-pixel window in the single-baseline interferometry coherence image. Then, a n g l e 1 n _ m can be estimated with:
a n g l e 1 n _ m ^ = p h a s e γ 12 ^ i max , j max p h a s e γ 1 n ^ i max , j max
where “ p h a s e ” indicates the phase of a complex value. “ ^ ” denotes the estimation value. γ 1 n ^ i max , j max represents the estimated single-baseline interferometry coherence value of line i max and column j max in one k × k-pixel window between the 1st SAR acquisition and nth SAR acquisition. Finally, when we substitute the estimated ( a n g l e 13 _ m ^ , …, a n g l e 1 n _ m ^ ) into (16), we obtain:
γ F t o w e r a n g l e 13 _ m ^ , a n g l e 14 _ m ^ , ... , a n g l e 1 n _ m ^ = σ s _ 1 σ s _ 2 * + σ s _ 1 σ s _ 3 * e j * a n g l e 13 _ m ^ + ... + σ s _ 1 σ s _ n * e j * a n g l e 1 n _ m ^ σ s _ 1 2 + σ n _ 1 2 σ s _ 2 2 + σ n _ 2 2 + σ s _ 1 2 + σ n _ 1 2 σ s _ 3 2 + σ n _ 3 2 + ... + σ s _ 1 2 + σ n _ 1 2 σ s _ n 2 + σ n _ n 2 σ s _ 1 σ s _ 2 * + σ s _ 1 σ s _ 3 * + ... + σ s _ 1 σ s _ n * σ s _ 1 2 + σ n _ 1 2 σ s _ 2 2 + σ n _ 2 2 + σ s _ 1 2 + σ n _ 1 2 σ s _ 3 2 + σ n _ 3 2 + ... + σ s _ 1 2 + σ n _ 1 2 σ s _ n 2 + σ n _ n 2
As previously mentioned, S N R t o w e r is very high, i.e.,
σ n _ i 2 σ s _ i 2
where “ ” denotes “much smaller than”. Substituting (21) into (20), we obtain:
γ F t o w e r a n g l e 13 _ m ^ , a n g l e 14 _ m ^ , ... , a n g l e 1 n _ m ^ 1
For layover background cluster, (16) can be rewritten as follows:
γ F L B a n g l e 13 , a n g l e 14 , ... , a n g l e 1 n = E s 1 s 2 * + E s 1 s 3 * e j * a n g l e 13 + ... + E s 1 s n * e j * a n g l e 1 n σ l _ 1 2 σ l _ 2 2 + σ l _ 1 2 σ l _ 3 2 + .. + σ l _ 1 2 σ l _ n 2
Different from power transmission towers, due to the phase randomness of the layover background, along the temporal dimension, the SAR interferometry complex values (i.e., s 1 s x * ) are decorrelated between each other in the k × k (such as 5 × 5)-pixel window for estimating γ and γ F . Consequently, when we substitute the ( a n g l e 1 n _ m ^ , …, a n g l e 1 n _ m ^ ), estimated using (18) and (19), into (23), the vector lines ( E s 1 s 3 * , …, E s 1 s n * ) cannot basically coincide with the vector line E s 1 s 2 * via rotating the angles ( a n g l e 1 n _ m ^ , …, a n g l e 1 n _ m ^ ), thus obtaining a good coherent superstition result. For different repeat-pass spaceborne SAR acquisitions, E ^ s L B _ 1 s L B _ x * (where x 1 ) and E s L B _ x s L B _ x * basically do not change in the same layover background area, i.e.,
E s L B _ 1 s L B _ 1 * = σ l _ 1 2 E s L B _ x s L B _ x * = σ l _ x 2
E ^ s L B _ 1 s L B _ 2 * E ^ s L B _ 1 s L B _ x *
Substituting (24) and (25) into (23), we obtain:
γ F ^ L B a n g l e 13 _ m ^ , a n g l e 14 _ m ^ , ... , a n g l e 1 n _ m ^ = E ^ s L B _ 1 s L B _ 2 * + E ^ s L B _ 1 s L B _ 3 * e j * a n g l e 13 _ m ^ + ... + E ^ s L B _ 1 s L B _ n * e j * a n g l e 1 n _ m ^ n σ l _ 1 2 < n E ^ s L B _ 1 s L B _ 2 * n σ l _ 1 2 = γ ^ L B
The mean contrast of γ F ^ between the mountainous layover background cluster around a power transmission tower and the power transmission tower itself in a multi-baseline interferometry-correlated synthesis image is defined as follows:
C ^ γ F = E γ F ^ L B E γ F t o w e r < E γ ^ L B E γ t o w e r = C ^ γ
The specific values of C ^ γ F can be estimated statistically from the real SAR images. As analyzed statistically in Section 3.2 and Figure 4, shown later, the typical values of C ^ γ F are generally focused in the range of 0.05~0.08.
From (27) and the above statistical analysis, compared with single-baseline SAR interferometry coherence images, we can see that the mean contrast between mountainous layover background clustering around power transmission towers and the power transmission tower itself is further suppressed by using multi-baseline SAR interferometry-correlated synthesis images for power transmission tower detection. Thus, multi-baseline SAR interferometry-correlated synthesis images can be used to better distinguish the power transmission tower from the layover background. Namely, detecting the power transmission towers located in the steep mountainous areas using multi-baseline SAR interferometry-correlated synthesis images demonstrates better detection performance than that from using single-baseline SAR interferometry coherence images. As a result, the workflow of the feature enhancement method and the corresponding qualitative effectiveness of using multi-baseline SAR interferometry-correlated synthesis images for power transmission tower detection in mountainous layover areas are shown in Figure 3b and Figure 3c, respectively.
The specific steps to this method are summarized as follows:
  • Step 1: Compute the single-baseline SAR interferometry coherence value (i.e., γ ) using (9);
  • Step 2: In the single-baseline SAR interferometry coherence image, for every k × k-pixel window, calculate the pixel line and column number which has the highest single-baseline interferometry coherence value using (18);
  • Step 3: For every k × k-pixel window, estimate the corresponding ( a n g l e 13 _ m ^ , …, a n g l e 1 n _ m ^ ) using (19);
  • Step 4: Substitute the estimated ( a n g l e 13 _ m ^ , …, a n g l e 1 n _ m ^ ) into (15), obtain the final estimated γ F ^ a n g l e 13 _ m ^ , a n g l e 14 _ m ^ , ... , a n g l e 1 n _ m ^ , i.e., multi-baseline SAR interferometry-correlated synthesis image generated using the proposed method;
  • Step 5: Use the benchmark object detectors, e.g., Faster R-CNN and YOLO, in order to detect the power transmission tower in the generated image.
Actually, in (15), γ F is defined when s 1 is used as the master SAR acquisition for interferometry correlation with all the other SAR acquisitions (i.e., s x , when x 1 ). We can name the generated image using this approach as “multi-baseline interferometry-correlated synthesis image based on master image approach”. In order to investigate the influence of the baseline lengths of the SAR acquisitions further, we can redefine the multi-baseline interferometry-correlated function γ F by selecting different baseline interferometry pair combinations, as follows:
γ F a n g l e 23 , a n g l e 34 , ... , a n g l e n 1 n = E s 1 s 2 * + E s 2 s 3 * e j * a n g l e 23 + ... + E s n 1 s n * e j * a n g l e n 1 n E s 1 s 1 * E s 2 s 2 * + E s 2 s 2 * E s 3 s 3 * + ... + E s n 1 s n 1 * E s n s n *
The shorter the baseline of two repeat-pass spaceborne SAR acquisitions, the lower the decorrelation of SAR interferometry [3]. Consequently, in (28), we can define γ F by selecting small baseline (SB) subsets as interferometry pair combinations. We name this approach “multi-baseline interferometry-correlated synthesis image based on SB approach”. Similar to the generation method of multi-baseline interferometry-correlated synthesis images based on the master image approach, the multi-baseline interferometry-correlated synthesis image based on the SB approach can also be obtained.

3. Results and Discussions

3.1. Datasets

In order to verify the detection performance of the method proposed in this paper, 12 repeat-pass TerraSAR-X staring spotlight mode acquisitions, taken from 23 April 2016 to 2 September 2016 in Mao County, Sichuan province, China, were used in this experiment. The baselines of different repeat-pass SAR acquisitions relative to the master image acquired on 23 April 2016 are presented in Table 1. The symbol “− “ on the baseline in Table 1 means that the SAR acquisition of the corresponding date is on the left side of the master image acquired on 23 April 2016. Otherwise, it is on the right side of the master image acquired on 23 April 2016. The SAR interferometry pair combinations of the SB case, and the corresponding baselines, are shown in Table 2. The resolution of these SAR data is 0.4547 m (Range direction) × 0.1685 m (Azimuth direction). The look angle of satellite is 40°. The pass/track direction is along the ascending path. In order to filter the noise effectively, multi-look preprocessing was used for the SAR data. The look was set to 5.
Considering that the inner geometric structure of power transmission towers could be clearly seen in the very high-resolution SAR image, such as in the TerraSAR-X staring spotlight mode data used in this paper, two benchmark object detectors, i.e., Faster R-CNN and YOLOv7, were adopted for learning the inner geometric structure of the tower. Particularly, the DL toolbox in Matlab version 2021a was used to implement these two algorithms using a PC with Intel single Core i7 CPU, NVIDIA RTX-3090 GPU (24 GB video memory), and 128 GB RAM. Specifically, the Faster R-CNN object detector was trained using the Matlab toolbox function, ‘trainFasterRCNNObjectDetector’, in which the input size, the number of anchor boxes, and the feature extraction network were 400 × 400, 3, and ResNet50 [24], respectively. For the YOLOv7 network architecture setting, the input size and the number of anchor boxes were 400 × 400 and 9, respectively. For both of these detectors, the initial learning rate of the network, the momentum, the minimum batch size, and the maximum epochs were set to 1 × 10⁻³, 0.9, 2, and 100, respectively.
The power transmission tower and background training samples were cropped manually from part of the SAR interferometric coherence image/multi-baseline interferometry-correlated synthesis image or amplitude image. Then, the cropped samples were synthesized together to generate patches with sizes of 400 × 400 pixels per patch. In patch generation, for the same tower target, the background samples around the tower could be changed and increased via geometric transformation, such as translation motion. Finally, after data augmentation based on the geometric transformation of the background samples, the training data, with 350 patches, were generated and fed into the training network. After obtaining the object detector, the entire large SAR single-baseline/multi-baseline interferometric coherence image or SAR amplitude image, with dimensions of 3674 × 7890 pixels (which could be approximately regarded as 9 × 20 = 180 patches, with a size of 400 × 400 pixels per patch), was used for testing.

3.2. Expermental Results and Analysis

From Figure 4, we can statistically analyze the degree of quantitative suppression of the mountainous layover background in SAR amplitude images and single-baseline/multi-baseline SAR interferometry coherence images. The typical values of C s , C γ and C ^ γ F are generally focused in the regions of 0.5~2, 0.15~0.25 and 0.05~0.08, respectively. The detection results of power transmission towers in the entire SAR single-baseline interferometric coherence image, multi-baseline interferometry-correlated synthesis image, and the SAR amplitude image are shown in Figure 5, in which the yellow boxes, red boxes, and green boxes denote the true detections, the false detections, and the missing detections, respectively. In order to quantitatively evaluate the detection performance of the obtained power transmission tower detector, the target detection probability, false detection probability, and F1 score [20] are adopted as follows:
P d = N t d N ground _ truth , P f = N f d N total _ t arg et , F 1 = 2 × P d × 1 P f P d + 1 P f
where N t d , N ground _ truth , N f d , and N total _ t arg et denote the number of true detections, the total number of ground truths, the number of false detections, and the total number of detections, respectively. Considering the tradeoff between P d (target detection probability) and P f (false alarm probability), F1 can be used to evaluate the comprehensive performance of the object detector. The quantitative detection performance of Figure 5 is presented in Table 3.
As can be observed from Figure 5 and Table 3, for power transmission tower detection, compared with the traditional method using the SAR amplitude image, the detection performance has been improved by using the single-baseline interferometric coherence image/multi-baseline interferometry-correlated synthesis image, no matter which detector is used. Also, multi-baseline interferometry-correlated synthesis images (including both those based on the master image-based approach and those based on the SB-based approach) demonstrate better detection performance than single-baseline SAR interferometry coherence images. The detection performance of multi-baseline interferometry-correlated synthesis image based on the master image approach and the SB-based approach are basically the same. When Faster R-CNN is adopted as the object detector, compared with the traditional method using the SAR amplitude image, the target detection probability when using the multi-baseline interferometry-correlated synthesis image increases by more than 47.7%, while false detection probability decreases by more than 36.1%. In terms of the F1 score, the performance improvement is at least 44.8%. Similarly, when YOLOv7 is adopted, compared with the SAR amplitude image, the target detection probability when using the multi-baseline interferometry-correlated synthesis image increases by more than 52.4%, while false detection probability decreases by more than 17.5%. The final F1 score increases by at least 43.6%. The SAR amplitude images are contaminated by strong layover background cluster interference in mountainous areas, which significantly influences the detection performance of power transmission towers. However, by using the multi-baseline interferometry-correlated synthesis image, generated as proposed in this paper, such layover background cluster interference can be greatly suppressed; a more than 43.6% of improvement can be achieved, as shown in Table 3.

4. Conclusions

In the application of power transmission tower detection in mountainous areas, single-baseline SAR interferometry coherence images have the effectiveness of feature enhancement compared to SAR amplitude images. Moreover, the proposed multi-baseline SAR interferometry-correlated synthesis images (including both those based on the master image-based approach and those based on the SB-based approach) demonstrate better feature enhancement than that of using single-baseline SAR interferometry coherence images for power transmission tower detection in a mountainous layover area. Consequently, for power transmission tower detection in mountainous layover areas, the method of using multi-baseline SAR interferometry-correlated synthesis images demonstrates better detection performance than the traditional method of using SAR amplitude images.

Author Contributions

Conceptualization, B.W.; methodology, B.W.; software, B.W. and H.W.; validation, B.W. and H.W.; formal analysis, B.W. and H.W.; investigation, B.W. and H.W.; resources, B.W.; data curation, B.W.; writing—original draft preparation, B.W.; writing—review and editing, J.C.; visualization, J.C.; supervision, J.C.; project administration, B.W. and J.C.; funding acquisition, B.W. All authors have read and agreed to the published version of the manuscript.

Funding

This research was funded by the Shanghai Aerospace Science and Technology Innovation Foundation (No. SAST2022-042) and the Open Fund of the Laboratory of Pinghu.

Data Availability Statement

The data presented in this study are available on request from the corresponding author. The data are not publicly available due to privacy.

Conflicts of Interest

The authors declare no conflict of interest.

References

  1. Wu, B.; Gao, Y.; Laviada, J.; Ghasr, M.T.; Zoughi, R. Time-reversal SAR imaging for nondestructive testing of circular and cylindrical multilayered dielectric structures. IEEE Trans. Instrum. Meas. 2020, 69, 7588–7593. [Google Scholar] [CrossRef]
  2. Wu, B.; Tong, L.; Chen, Y.; He, L. New methods in multibaseline polarimetric SAR interferometry coherence optimization. IEEE Geosci. Remote Sens. Lett. 2015, 12, 2016–2020. [Google Scholar]
  3. Berardino, P.; Fornaro, G.; Lanari, R.; Sansosti, E. A new algorithm for surface deformation monitoring based on small baseline differential SAR interferograms. IEEE Trans. Geosci. Remote Sens. 2002, 40, 2375–2383. [Google Scholar] [CrossRef] [Green Version]
  4. Chen, J.; Yu, H. Wide-beam SAR autofocus based on blind resampling. SCIENCE CHINA Inf. Sci. 2023, 66, 140304. [Google Scholar] [CrossRef]
  5. Chen, J.; Zhang, J.; Jin, Y.; Yu, H.; Liang, B.; Yang, D. Real-Time Processing of Spaceborne SAR Data With Nonlinear Trajectory Based on Variable PRF. IEEE Trans. Geosci. Remote Sens. 2022, 60, 5205212. [Google Scholar] [CrossRef]
  6. Wu, B.; Tong, L.; Chen, Y. Revised Improved DINSAR Algorithm for Monitoring the Inclination Displacement of Top Position of Electric Power Transmission Tower. IEEE Geosci. Remote Sens. Lett. 2018, 15, 877–881. [Google Scholar] [CrossRef]
  7. Zeng, T. Power Transmission Tower Detection Based on Polar Coordinate Semivariogram in High-Resolution SAR Image. IEEE Geosci. Remote Sens. Lett. 2017, 14, 2200–2204. [Google Scholar] [CrossRef]
  8. Peng, D.; Zhang, H.; Guo, W.; Yang, W. Power Transmission Tower Series Extraction in PolSAR Image Based on Time-Frequency Analysis and A-Contrario Theory. Sensors 2016, 16, 1862. [Google Scholar] [CrossRef] [Green Version]
  9. Jacob, A.; Vicente-Guijalba, F.; Lopez-Martinez, C.; Lopez-Sanchez, J.M.; Litzinger, M.; Kristen, H.; Mestre-Quereda, A.; Ziolkowski, D.; Lavalle, M.; Notarnicola, C.; et al. Sentinel-1 InSAR Coherence for Land Cover Mapping: A Comparison of Multiple Feature-Based Classifiers. IEEE J. Sel. Top. Appl. Earth Obs. Remote Sens. 2020, 13, 535–552. [Google Scholar] [CrossRef] [Green Version]
  10. Girshick, R.; Donahue, J.; Darrell, T.; Malik, J. Rich feature hierarchies for accurate object detection and semantic segmentation. arXiv 2014, arXiv:1311.2524. [Google Scholar]
  11. Girshick, R. Fast R-CNN. arXiv 2015, arXiv:1504.08083. [Google Scholar]
  12. Ren, S.; He, K.; Girshick, R.; Sun, J. Faster R-CNN: Towards real-time object detection with region proposal networks. IEEE Trans. Pattern Anal. Mach. Intell. 2017, 39, 1137–1149. [Google Scholar] [CrossRef] [Green Version]
  13. Redmon, J.; Divvala, S.; Girshick, R.; Farhadi, A. You only look once: Unified, real-time object detection. arXiv 2016, arXiv:1506.02640. [Google Scholar]
  14. Wang, C.Y.; Bochkovskiy, A.; Liao, H. Yolov7: Trainable bag-of-freebies sets new state-of-the-art for real-time object detectors. arXiv 2022, arXiv:2207.02696. [Google Scholar]
  15. Wang, C.Y.; Bochkovskiy, A.; Liao, H. Scaled-YOLOv4: Scaling cross stage partial network. arXiv 2021, arXiv:2011.08036. [Google Scholar]
  16. Glenn, J. YOLOv5 Release v6.1. Available online: https://github.com/ultralytics/yolov5/releases/tag/v6.1 (accessed on 22 February 2022).
  17. Akyon, F.C.; Altinuc, S.; Temizel, A. Slicing Aided Hyper Inference and Fine-Tuning for Small Object Detection. In Proceedings of the IEEE International Conference on Image Processing (ICIP), Bordeaux, France, 16–19 October 2022. [Google Scholar]
  18. Liu, W.; Anguelov, D.; Erhan, D.; Szegedy, C.; Reed, S.; Fu, C.-Y.; Berg, A.C. SSD: Single shot multibox detector. arXiv 2016, arXiv:1512.02325. [Google Scholar]
  19. Deng, Z.; Sun, H.; Zhou, S.; Zhao, J. Learning Deep Ship Detector in SAR Images from Scratch. IEEE Trans. Geosci. Remote Sens. 2019, 57, 4021–4039. [Google Scholar] [CrossRef]
  20. Lin, Z.; Ji, K.; Leng, X.; Kuang, G. Squeeze and Excitation Rank Faster R-CNN for Ship Detection in SAR Images. IEEE Geosci. Remote Sens. Lett. 2019, 16, 751–755. [Google Scholar] [CrossRef]
  21. Touzi, R.; Lopes, A. Statistics of the Stokes parameters and of the complex coherence parameters in one-look and multilook speckle fields. IEEE Trans. Geosci. Remote Sens. 1996, 34, 519–531. [Google Scholar] [CrossRef]
  22. Cloude, S.R.; Papathanassiou, K.P. Polarimetric SAR interferometry. IEEE Trans. Geosci. Remote Sens. 1998, 36, 1551–1565. [Google Scholar] [CrossRef]
  23. Touzi, R.; Lopes, A.; Bruniquel, J.; Vachon, P.W. Coherence estimation for SAR imagery. IEEE Trans. Geosci. Remote Sens. 1999, 37, 135–149. [Google Scholar] [CrossRef] [Green Version]
  24. He, K.; Zhang, X.; Ren, S.; Sun, J. Deep Residual Learning for Image Recognition. arXiv 2016, arXiv:1512.03385. [Google Scholar]
Figure 1. Real power transmission towers located on mountainous soil or vegetated terrain.
Remotesensing 15 03823 g001
Figure 2. (a) The geometric diagram of a power transmission tower located in a mountainous layover area and (b) the workflow of the traditional power transmission tower detection method using a SAR amplitude image.
Remotesensing 15 03823 g002
Figure 3. (a) The geometric diagram of angle deviation of the signal part between different baseline SAR interferometry phase; (b) the workflow of the feature enhancement method using multi-baseline SAR interferometry-correlated synthesis images for power transmission tower detection in a mountainous layover area; and (c) the qualitative effectiveness comparison between the different detected images after feature enhancement.
Remotesensing 15 03823 g003
Figure 4. The degree of suppression of mountainous layover background in (a) a SAR amplitude image; (b) a single-baseline SAR interferometry coherence image; (c) a multi-baseline interferometry-correlated synthesis image based on the master image approach; and (d) a multi-baseline interferometry-correlated synthesis image based on the SB approach.
Remotesensing 15 03823 g004
Figure 5. Detection/testing results of power transmission towers in the entire SAR image. (a) Traditional power transmission tower detection method in SAR amplitude image using Faster R-CNN technique; (b) traditional power transmission tower detection method in SAR amplitude image using YOLOv7 technique; (c) power transmission tower detection in single-baseline SAR interferometry coherence image using Faster R-CNN technique; (d) power transmission tower detection in single-baseline SAR interferometry coherence image using YOLOv7 technique; (e) power transmission tower detection in multi-baseline interferometry-correlated synthesis image based on the master image approach using Faster R-CNN technique; (f) power transmission tower detection in multi-baseline interferometry-correlated synthesis image based on the master image approach using YOLOv7 technique; (g) power transmission tower detection in multi-baseline interferometry-correlated synthesis image based on the SB approach using Faster R-CNN technique; and (h) power transmission tower detection in multi-baseline interferometry-correlated synthesis image based on the SB approach using YOLOv7 technique. The yellow boxes, red boxes, and green boxes denote the true detections, the false detections, and the missing detections, respectively.
Remotesensing 15 03823 g005
Table 1. The baselines of different repeat-pass SAR acquisitions relative to the master image acquired on 23 April 2016.
SAR Acquisition Date (Year/Month/Day)23 April 20164 May 201615 May 201626 May 20166 June 201617 June 201628 June 20169 July 201620 July 201631 July 201622 August 20162 September 2016
Baseline (meters)0−6.12−139.86−113.11163.7756.74−40.74−23.10153.81144.40−81.1250.64
Table 2. The SAR interferometry pair combinations of the SB case.
SAR Interferometry Pair Combinations of SB Case (Year/Month/Day)15 May 2016 and 26 May 201626 May 2016 and 22 August 201622 August 2016 and 28 June 201628 June 2016 and 9 July 20169 July 2016 and 4 May 20164 May 2016 and 23 April 2016
Baseline (meters)26.7531.9940.3817.6416.986.12
SAR Interferometry Pair Combinations of SB Case (Year/Month/Day)23 April 2016 and 2 September 20162 September 2016 and 17 June 201617 June 2016 and 31 July 201631 July 2016 and 20 July 201620 July 2016 and 6 June 2016
Baseline (meters)50.646.1087.669.399.96
Table 3. Quantitative detection performance.
Benchmark DetectorInput ImagePdPfF1 Score
Faster R-CNNSAR amplitude image [7]33.3%41.7%42.4%
Single-baseline SAR interferometry coherence image52.4%0%68.8% (↑26.4%)
Multi-baseline interferometry-correlated synthesis Image based on master image approach81%5.6%87.2% (↑44.8%)
Multi-baseline interferometry-correlated synthesis Image based on SB approach81%5.6%87.2% (↑44.8%)
YOLOv7SAR amplitude image [7]23.8%37.5%34.5%
Single-baseline SAR interferometry coherence image57.1%25%64.8% (↑30.3%)
Multi-baseline interferometry-correlated synthesis Image based on master image approach76.2%20%78.1% (↑43.6%)
Multi-baseline interferometry-correlated synthesis Image based on SB approach81%19.1%81% (↑46.5%)
Disclaimer/Publisher’s Note: The statements, opinions and data contained in all publications are solely those of the individual author(s) and contributor(s) and not of MDPI and/or the editor(s). MDPI and/or the editor(s) disclaim responsibility for any injury to people or property resulting from any ideas, methods, instructions or products referred to in the content.

