


Advancements in Spaceborne Synthetic Aperture Radar Imaging with System-on-Chip Architecture and System Fault-Tolerant Technology

1
Beijing Key Laboratory of Embedded Real-Time Information Processing Technology, Beijing Institute of Technology, Beijing 100081, China
2
Beijing Institute of Radio Measurement, Beijing 100854, China
*
Author to whom correspondence should be addressed.
Remote Sens. 2023, 15(19), 4739; https://doi.org/10.3390/rs15194739
Submission received: 28 July 2023
/
Revised: 18 September 2023
/
Accepted: 23 September 2023
/
Published: 27 September 2023
(This article belongs to the Special Issue Spaceborne High-Resolution SAR Imaging)
Abstract
:With the continuous development of satellite payload and system-on-chip (SoC) technology, spaceborne real-time synthetic aperture radar (SAR) imaging systems play a crucial role in various defense and civilian domains, including Earth remote sensing, military reconnaissance, disaster mitigation, and resource exploration. However, designing high-performance and high-reliability SAR imaging systems that operate in harsh environmental conditions while adhering to strict size, weight, and power consumption constraints remains a significant challenge. In this paper, we introduce a spaceborne SAR imaging chip based on a SoC architecture with system fault-tolerant technology. The fault-tolerant SAR SoC architecture has a CPU, interface subsystem, memory subsystem, data transit subsystem, and data processing subsystem. The data processing subsystem, which includes fast Fourier transform (FFT) modules, coordinated rotation digital computer (CORDIC) modules (for phase factor calculation), and complex multiplication modules, is the most critical component and can achieve various modes of SAR imaging. Through analyzing the computational requirements of various modes of SAR, we found that FFT accounted for over 50% of the total computational workload in SAR imaging processing, while the CORDIC modules for phase factor generation accounted for around 30%. Therefore, ensuring the fault tolerance of these two modules is crucial. To address this issue, we propose a word-length optimization redundancy (WLOR) method to make the fixed-point pipelined FFT processors in FFT modules fault tolerant. Additionally, we propose a fault-tolerant pipeline CORDIC architecture utilizing error correction code (ECC) and sum of squares (SOS) check. For other parts of the SoC architecture, we propose a generic partial triple modular redundancy (TMR) hardening method based on the HITS algorithm to improve fault tolerance. Finally, we developed a fully automated FPGA-based fault injection platform to test the design’s effectiveness by injecting errors at arbitrary locations. The simulation results demonstrate that the proposed methods significantly improved the chip’s fault tolerance, making the SAR imaging chip safer and more reliable. We also implemented a prototype measurement system with a chip-included board and demonstrated the proposed design’s performance on the Chinese Gaofen-3 strip-map continuous imaging system. The chip requires 9.2 s, 50.6 s, and 7.4 s for a strip-map with 16,384 × 16,384 granularity, multi-channel strip-map with 65,536 × 8192 granularity, and multi-channel scan mode with 32,768 × 4096 granularity, respectively, and the system hardware consumes 6.9 W of power to process the SAR raw data.
1. Introduction
Synthetic aperture radar (SAR) imaging is a kind of active-observation system of the Earth that is able to work day and night under all weather conditions. As an important technique for space-to-earth observation, spaceborne synthetic aperture radar (SAR) has the ability to collect data continuously over large areas at high resolution, making it a flexible and effective tool for information retrieval [1]. Therefore, SAR plays a significant role in the areas of disaster emergency response, environmental monitoring, resource exploration, and geographic information access [2,3,4,5,6]. Review of the status of satellite SAR imaging and image algorithms have been presented in a recent paper [7]. Notably, the groundbreaking work [8] on sparse signal processing and deep learning in SAR and contributions to MIMO-SAR [9] have significantly advanced our understanding of the field. So far, countries around the world have launched a large number of SAR satellites such as Sentinel-1 [10], TanDEM-X/TerraSAR-X (TDX/TSX) [11], ALOS [12], and Chinese Gaofen-3 [13]. Most of the above-mentioned missions impose high demands on the real-time performance of SAR data processing to obtain effective information. Spaceborne processing is an efficient solution that leads to better image quality, enabling optional image compression and higher precision SAR data to be processed as opposed to ground-based processing. With these processed data products, decision makers can quickly plan and respond. Normally, spaceborne real-time processing performance improvement mainly includes three aspects: optimizing the appropriate algorithm, developing an optimal algorithm implementation strategy, and building a high-performance and high reliability processing platform. In recent years, countries worldwide have been giving increasing attention to the development and research of SAR, mainly including aspects on system design and imaging algorithms.
In recent years, the chirp scaling (CS) algorithm has become the mainstream in the SAR imaging algorithm field, especially for spaceborne SAR. It consists of multiplying the SAR data in the range-Doppler domain with a quadratic phase function (chirp scaling) in order to equalize the range cell migration to a reference range, followed by a range compression and secondary range compression (SRC) in the frequency domain. Although the SRC is strictly correct only for one reference range, it is updated as a function of the azimuth frequency. The processing proceeds with phase multiplies and FFT operations, which make the algorithm extremely efficient [14]. Moreover, the CS algorithm can significantly improve the performance of the SAR imaging because of the accurate processing in the squint mode. Due to the advantage of high efficiency, CS and its improved algorithms, mainly including nonlinear chirp scaling (NCS) [15], extend chirp scaling (ECS) [16], and so on, are still employed for spaceborne SAR imaging of various modes, including strip-map mode [17], spotlight mode [18], scan mode [19], multi-channel mode [20], and TOPS mode [21]. This paper chose the CS algorithm for multi-mode SAR imaging. With the development of SAR technologies, a huge amount of imaging calculation is brought about by the higher demand for the resolution and swath of SAR images. Therefore, algorithm engineering optimization is in fact indispensable for the fast and even real-time imaging processing in a spaceborne system.
For the aspect of system design, the MIT Lincoln Laboratory started a study of the implementation of real-time signal processors for SAR front-end signal processing in as early as 2000 [22]. The processors were designed to have high computational throughput and low power implementations based on their own VLSI bit-level systolic array technology. S. Langemeyer et al. of the University of Hannover, Germany, proposed a multi-DSP system for real-time SAR processing using the highly parallel digital signal processor (HiPAR-DSP) technique in 2003 [23]. The small volume and low power consumption of their processor make it suitable for compact air or spaceborne systems. The Jet Propulsion Laboratory (JPL) proposed an experimental SAR processing system based on VLSI/SOC hardware, which was worked to develop spaceborne processing [24]. A fault-tolerant FPGA-based (Xilinx Virtex-II Pro) architecture has been proposed and tested using the SIR-C data [25,26]. The University of Florida developed a high-performance space computing framework based on a hardware/software interface in 2006 [27]. An FPGA serves as the co-processor/accelerator of the CPU in this framework. A near-real-time SAR processor (NRTP) was developed by the Indian Space Research Organization (IRSO) based on the Analog Devices TigerSHARC TS101S/TS201S DSP multiprocessor. Spaceborne or on-ground quick-look real-time SAR signal processing was found to be achievable for ISRO’s RISAT-1 [28]. With the rapid increase in the storage and computing capacities of commercial-off-the-shelf (COTS) FPGAs, the state-of-the-art Xilinx Virtex-6 FPGA was adopted for an entire real-time SAR imaging system in 2013 [29]. In recent years, graphics processing units (GPUs) with high computing power were used for real-time SAR processing [14]. Preliminary works from the laboratory [30,31] described two options for the SAR imaging system: FPGA+ASIC and single FPGA integration. Especially for the second option, we propose a multi-node parallel accelerating system to realize a spaceborne real-time SAR processing system. However, all systems focus on the standard strip-map, which is the most foundational mode of SAR imaging application. Reference [32] focuses on analyzing the methodology of CS coefficient decomposition and implementation in FPGAs, not SoC chips. In addition, to meet the increasing need for wide-breadth imaging, multi-channel correlated modes should be considered.
However, building a high-performance and high reliability SAR real-time processing platform for space deployment is hampered by the hostile environmental conditions and power constraints in space. As mentioned above, the FPGA, ASIC, DSP, CPU, and GPU are superior in some respects for real-time processing. The CPU and DSP take advantage of their design flexibility by software reconfiguration, but they cannot provide sufficient FLOPS per watt, which leads to a bottleneck in large-scale and high-resolution applications. Benefiting from its customized design, FPGAs and ASICs can provide sufficient processing power and high computation ability. The problem is when implementing an FPGA or ASIC for specific-mode SAR imaging, the large-scale and complicated logic design requires a longer development period. Although the GPU has a high processing performance, its large power consumption and weak radiation resistance makes it unsuitable for the harsh conditions of spaceborne processing. Based on the above analysis, we adopted SoC architecture for SAR imaging in this paper in order to enhance system performance, reduce power consumption and cost, and minimize the overall system size.
In many mission-critical applications (e.g., in aerospace and telecommunication), radiation hardening (RH) or fault tolerance is mandatory [33]. For example, the avionics on-board aerospace craft or satellites often suffer a very harsh radiation environment, where the energetic particles such as protons and ions can cause them invalid. Especially as the features shrink in size, the microelectronic devices and circuits become more sensitive to space radiation [34]. The ionizing radiation origins may send charged particles through transistor junction regions, which will cause changes in sensitive areas such as the memory or logic region of devices [35,36]. This process is the cause of single event upsets (SEUs). In many integrated circuits (for example SRAM-based FPGAs in [37]), SEUs will occur as an unintentional change. Nowadays, the demand for high reliability in modern electronic systems has been increasing. The increase in integration and complexity makes VLSI circuits more sensitive to errors. To improve system reliability, effective fault-tolerant techniques are required in the system design.
Among various radiation hardening or fault-tolerant (FT) measures, triple modular redundancy (TMR) is one commonly used approach. Stamenković et al. [38] introduced full TMR into ASIC design to enhance the system’s tolerance to soft errors. TMR requires a majority voter for error detection and correction, and it has been widely applied in aerospace domains, including flight computers on Boeing 777 aircraft [39] and the LEON-FT processor based on the SPARC V8 architecture designed by the European Space Agency [40]. Although full TMR can effectively reduce the soft error rate of a system, it can result in excessive system size and power consumption. As a result, with the scaling and operating speed improvement of space processors, the full TMR design is becoming inadequate for circuit design requirements. Snodgrass [41] proposed a new method called reduced precision redundancy (RPR), which provides a trade-off between computational precision and power consumption. Recently, another popular approach involves the use of error correcting codes (ECCs). This technique is suitable for linear operations such as FFT and adaptive filters [42].
Furthermore, many researchers have started utilizing partial redundancy techniques to mitigate this problem. Partial redundancy emphasizes the protection of critical components and offers higher flexibility compared to full TMR design. Theoretically, partial redundancy design achieves a balance between circuit size and stability. Sánchez-Clemente et al. [43] simplified practical circuits into approximate functional circuits and applied partial redundancy techniques in the simplified circuits to achieve a trade-off between system stability and area/power overhead. Although several researchers have proposed methods for partial TMR, there is no universal approach among the existing methods, nor have they presented evaluation metrics for the effectiveness of circuit hardening.
Traditional fault-tolerant methods, such as full TMR, are limited in their applications due to their high resource requirements and power consumption. To address these issues, this paper proposes the system-level fault-tolerant techniques designed specifically for SAR chips, which include
- Fault-tolerant fixed-point pipelined FFT processors with the word-length optimization redundancy method (WLOR). We modified the RPR method and the signal-to-quantization noise ratio (SQNR) assessment expression for FFT. By analysis of word-length expression and utilizing the proposed WLOR comparison process, more than 26% memory bits were saved for 16,384 point FFT.
- Radiation hardening pipelined CORDIC processors combing SOC check in trigonometric function with ECCs in modular redundancy. The proposed design with 16/5 ECC presented lower overhead than protection using the TMR (40% saved) or RPR (14% saved) method.
- The partial triple modular redundancy (PTMR) method for fault-tolerant circuits based on the HITS algorithm. This is a low-cost and high-reliability partial redundancy hardening method that does not rely on functional analysis; using PTMR can save more than 20% of logic resources for general circuits (such as circuits from ISCAS benchmarks).
The remainder of the paper is organized as follows: Section 2 reviews the CS algorithm and analysis the computation burden of three SAR modes. Section 3 presents a single-chip integration design for optimizing the CS algorithm implementation with system fault-tolerant techniques, and we designed a FPGA-based fault injection system to validate these FT techniques. In Section 4, the corresponding hardware realization details and results are discussed. A comparison with related work is conducted to demonstrate the validity of the system. Section 5 concludes the paper.
2. Methods and Analysis
2.1. Review of the CS Imaging Algorithm
The imaging algorithm illustrated in Figure 1 represents the heart of the integrated CS SAR imaging algorithm [44], which can incorporate strip-map, scan, multi-channel, and other extend modes. Compared to other algorithms, the advantage of the CS algorithm lies primarily in its use of the “chirp scaling” principle, in which phase multiplies are used instead of a time-domain interpolator to implement a range-variant range cell migration correction (RCMC) shift [44].
This paper focuses on standard and multi-channel modes. Thus, the pre-processing mainly includes operations of inverse filtering and sub-channel data fusion [45]. The algorithm mainly includes operations of four FFTs, three phase functions, and two Doppler parameters (Doppler frequency center (DFC) and Doppler frequency rate (DFR)) estimation. Fast Fourier transformation (FFT)/inverse FFT (IFFT) and CS coefficient calculations are the major features of the main procedure of the algorithm, constituting more than 80% of the overall computation.
Figure 1.
Flowchart of the CS algorithm.
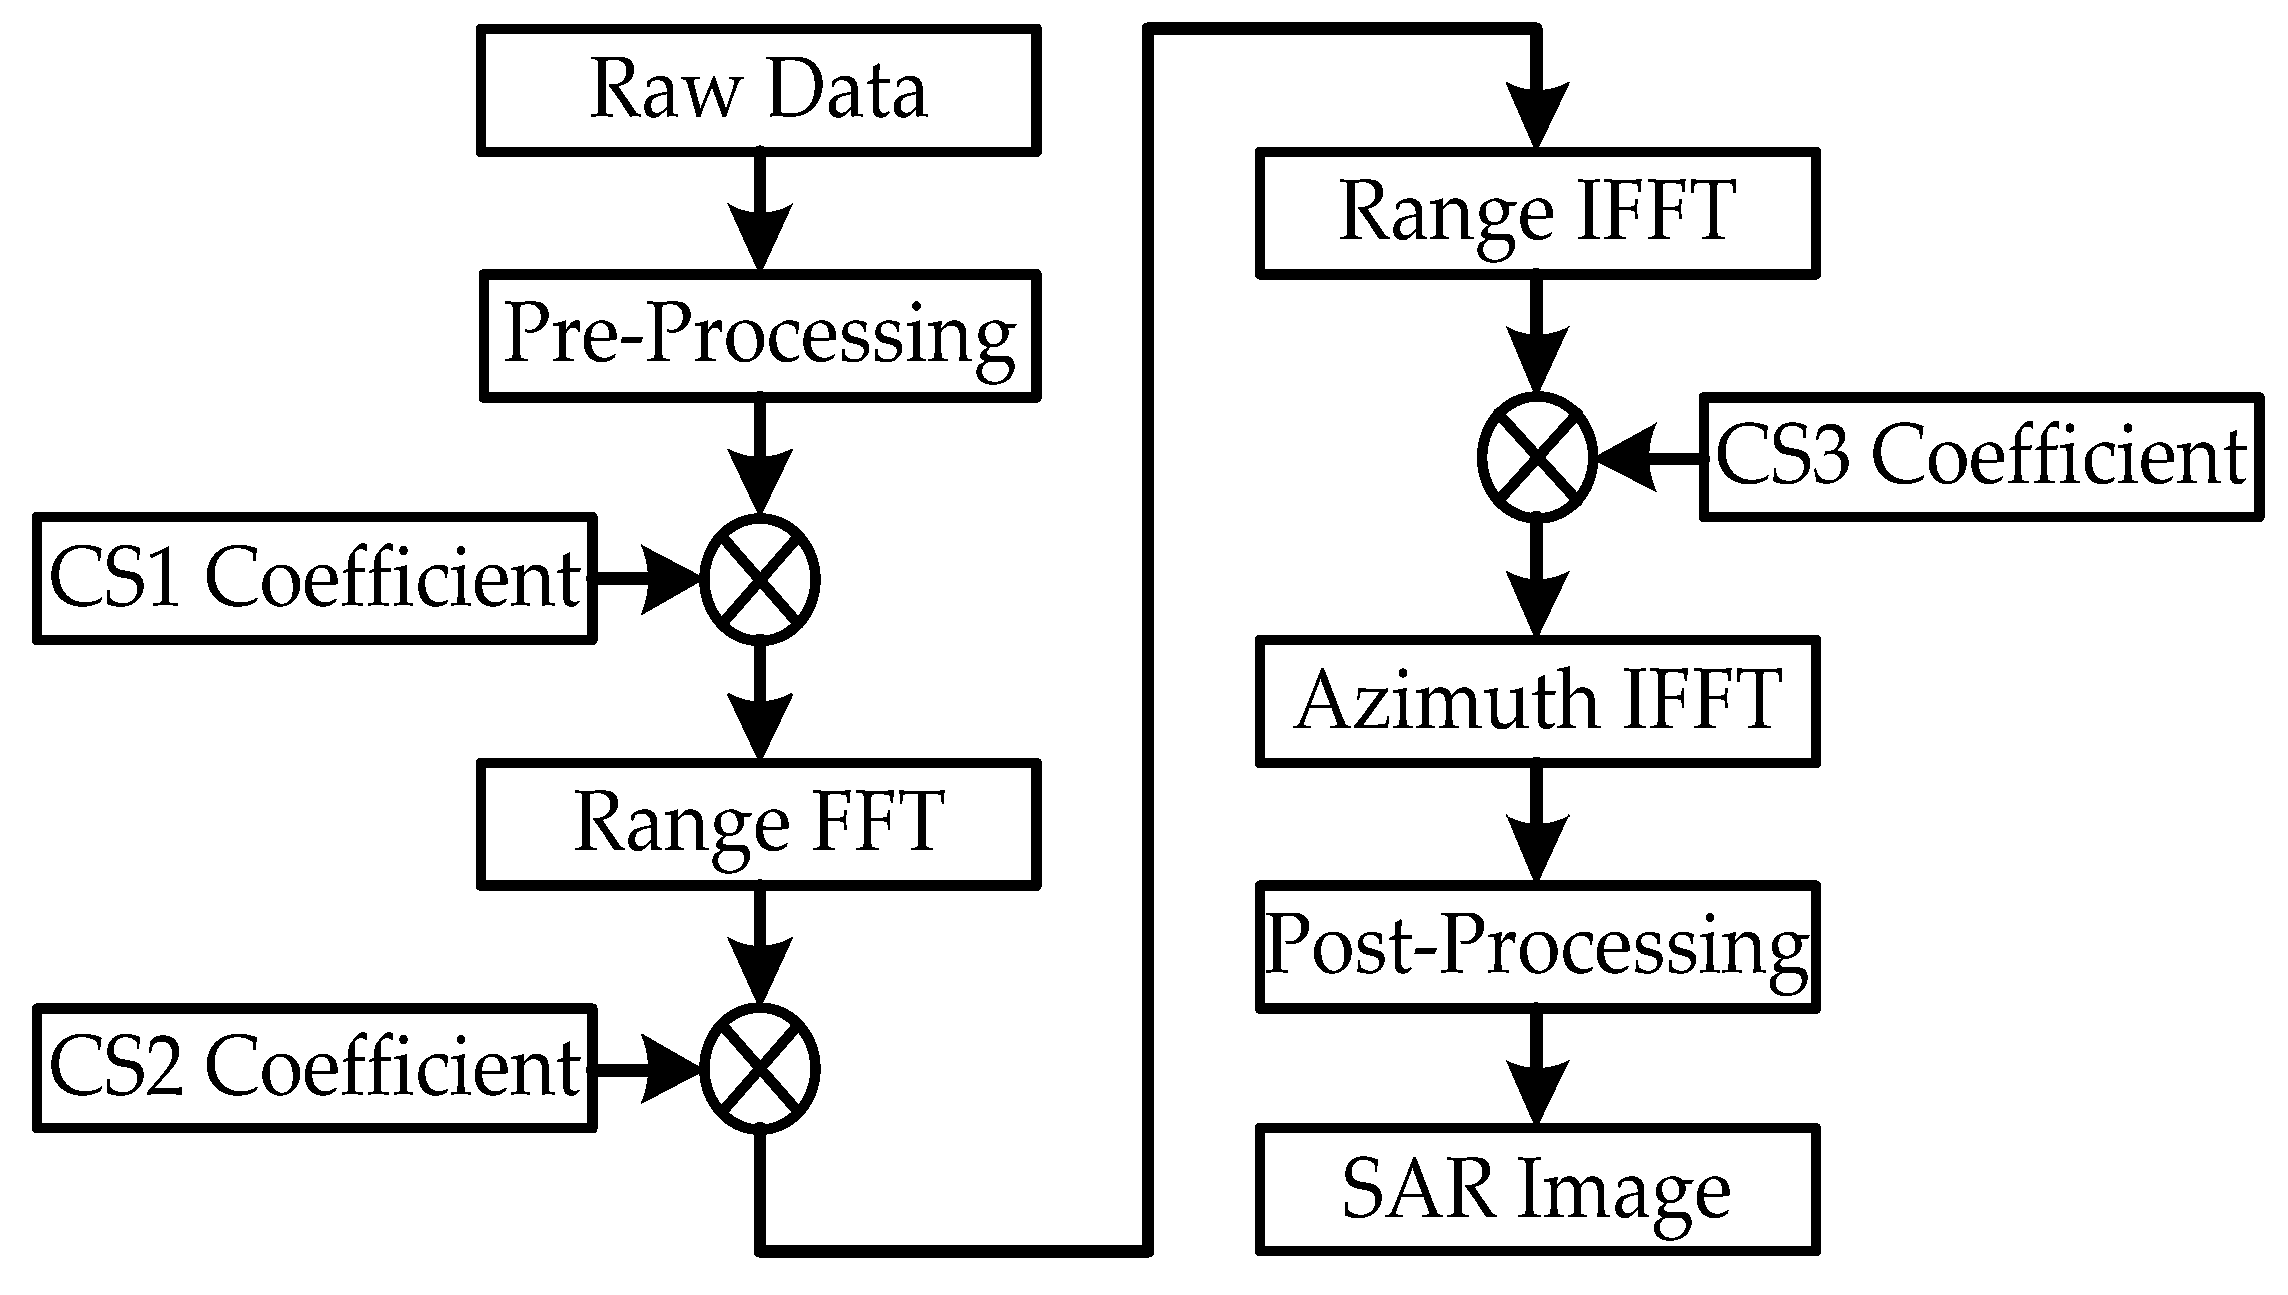
The steps in the CS algorithm are as follows:
Step1: The SAR raw data after pre-processing will be transferred to the range-Doppler domain via a FFT in the azimuthal direction. Second, the data will be multiplied by the CS1 coefficient to achieve the chirp scaling, which makes all the range migration curves the same. The CS1 coefficient can be described as (1):
where is the range time, is the azimuthal frequency, is the reference distance, is the modulating frequency in the phase center of the range direction, and is the curvature factor, expressed as follows:
where is the wave length; b is the modulation frequency of the transmitted signal; and and represent equivalent squint angle and equivalent squint velocity, respectively. These variables can be described as follows:
where represents DFC and represents DFR. Because the CS1 coefficient and CS2 coefficient consider the range dimension, the initial values obtained by the ephemeris parameter can be adopted to simplify the calculation.
Step2: The data are transferred to the two-dimensional frequency domain via an FFT in the range direction. Next, the data are multiplied by the CS2 coefficient to complete the range compression, the SRC, and the remaining RCMC. The CS2 coefficient can be described as follows:
where is the range frequency.
Step3: The data are transferred to the range-Doppler domain via an inverse FFT in the range direction. The data can be multiplied by the CS3 coefficient to complete the azimuth compression and the phase correction. The DFR based on the raw data is used to refine the equivalent velocity v to ensure the precision of the third phase function and is described as follows:
Finally, the inverse FFT operation in the azimuthal direction is executed to complete the CS algorithm. A visualized grayscale image can be obtained after performing the 8 bit quantization operation, which can be consider as a kind of post-processing.
2.2. The Pre-Processing of Azimuth Reconstruction in Multi-Channel Mode and Sliding Spotlight Mode
Multi-channel mode SAR transmits a single beam and receives multiple echoes through multiple receivers at the same time. When spaceborne SAR works in multi-channel mode, the multi-phase central azimuth multi-beam system is adopted to solve the contradiction between the high azimuth resolution and wide range swath of traditional single-channel SAR imaging while ensuring high azimuth resolution. Figure 2 shows a schematic of the multi-channel SAR system [45]. The phase center of the transmitter of the system is located in the center of the antenna, which is designed as a one-transmitter four-receiver antenna system.
The key problem of multi-channel mode SAR is that the receiving mechanism of the multi-channel will lead to the occurrence of azimuth non-uniform sampling between channels. Due to the inevitable hardware errors such as digital circuit errors and satellite attitude pointing errors in the operation of radar systems, which will lead to the inconsistency of amplitude and phase between channels, there exists the problem of amplitude and phase error between channels. The common solution is to use digital beam forming (DBF) to convert the echo signal. We see an equivalent in the echo transmitted by the single channel and received by the multi-channel in multi-channel mode SAR to the echo transmitted by the single channel and received by the single channel. This process is called the equivalence of azimuth spatial sampling position.
In order to produce multi-channel uniform sampling, the system design requires high parameters. In most cases, the forward distance of the antenna of multi-channel SAR in a pulse cycle is not equal to half the antenna length. Therefore, most of the time, multi-channel azimuth sampling is non-uniform, which will lead to range migration correction and focusing error. It is necessary to sample and homogenize the original received signal through a preprocessing operation in order to recover the azimuth spectrum of the signal. The preprocessing method of inverse filter reconstruction can reconstruct the original signal and effectively solve the problem of azimuth non-uniform sampling. Figure 3 shows the specific implementation flow of signal reconstruction based on an inverse filter.
The left half of Figure 3 is equivalent to the sampling part of multi-channel SAR. The transmitted original signal is processed through each sub channel. Each channel is a linear time invariant system, and its transmission function corresponds to . Sampling the output of each sub channel is the original echo data received by the receiver. The multi-channel acceptance mechanism reduces the sampling rate requirement to several times the input signal bandwidth. The latter part is the signal reconstruction part, which can be realized by the inverse filter, and the transmission function of the inverse filter can be determined by the transmission function of each sub channel.
Assuming that the bandwidth of the signal is Ba, the sampling rate of the actual system is PRF, refers to the number of channels or sub-apertures used, the corresponding transmission function of each channel is , represents the echo data of each subchannel, and the corresponding inverse filter coefficient is pl; the reconstructed signal is
In the various imaging modes of the High-Resolution Satellite-3 (High-Res-3), the sliding spotlight mode with a 1 m resolution is the highest-resolution imaging mode. In strip-map mode, the antenna remains fixed in its illumination direction as the radar platform moves, providing a wide observation range. However, the azimuthal resolution is limited by the length of the antenna in the azimuthal direction. The spotlight mode, also known as staring imaging mode, operates differently. When the radar passes over a specified target imaging area, the antenna is controlled to gradually adjust its beam direction backward, allowing it to continuously focus on the target area. This effectively simulates a shorter antenna, enhancing azimuthal resolution. However, there are limitations to how far the radar antenna can adjust backward, and after completing imaging of the target area, the antenna must return to the forward illumination mode. Therefore, the imaging scene size is limited in spotlight mode, and the imaging area is not continuous.
The sliding spotlight mode combines the characteristics of both strip-map and spotlight modes. It achieves a balance between resolution and scene size by controlling the speed at which the antenna adjusts backward, concentrating the focus of the beam center on a virtual point beneath the ground. This approach allows for high-resolution imaging within a larger scene. In summary, the Sliding Spotlight mode azimuth defocusing process involves four main steps:
- Multiplying the signal by the azimuth defocusing phase factor to perform defocusing.
- Conducting azimuth fast Fourier transform (FFT).
- Multiplying the signal by the azimuth residual phase compensation factor to complete phase compensation.
- Final phase compensation occurs during the first phase factor multiplication in the standard CS processing flow.
2.3. Computation Burden Analysis of SAR Imaging
The preprocessing in the multi-channel mode does not involve data up-sampling, and the raw data to be processed after preprocessing have a granularity of Na × Nr, where Na represents the number of samples in the azimuth direction and Nr represents the number of samples in the range direction. The imaging processing flow mainly consists of FFT, phase compensation factor calculation, and complex multiplication of phase compensation factors. The FFT operation can be decomposed into butterfly operations (which involve only addition and subtraction) and complex multiplication with rotation factors. The complex multiplication operation is implemented by splitting it into addition, subtraction, and real multiplication operations. The nonlinear part of the phase factor generation calculation is approximated as a linear operation. The subtraction operation is equivalent to the addition operation in implementation. Therefore, the number of real multiplications and additions can be used to estimate the computational complexity of the entire multi-mode SAR imaging CS processing. Thus, analyzing the computational complexity of the imaging algorithm primarily involves analyzing the number of real multiplications and additions in each processing step. The number of real multiplications and additions, as well as the total number of multiply–add operations for each processing step, are shown in Table 1.
For the strip-map mode, the proportion of FFT computation and the proportion of phase factor generation (PFG) are

Table 1.
Analysis of computational complexity for multi-mode CS imaging.
| Processing Stages | Number of Real Multiplications | Number of Real Additions | Total Number of Multiply–Add Operations |
|---|---|---|---|
| CS Step 1 | |||
| CS Step 2 | |||
| CS Step 3 | |||
| Multi-channel mode preprocessing | |||
| Sliding spotlight mode preprocessing | |||
| Strip-map mode Total computational complexity | |||
| Sliding spotlight mode total | |||
| Multi-channel mode total |
For the multi-channel mode, the proportion of FFT computation and the proportion of phase factor generation are
For the sliding spotlight mode, the proportions of FFT computation and phase factor generation are
To provide a more visual representation of the proportion of FFT and phase factor generation in the multi-mode SAR imaging algorithm, an analysis was conducted on the typical values for the three modes, as shown in Table 2. In this analysis, the processing granularity was considered as multiples of 2 to align with FFT computations.
Based on the analysis of computational requirements, it can be observed that FFT accounted for over 50% of the total computational burden in all three SAR imaging modes, making it the most significant component. Additionally, the implementation of FFT requires a substantial amount of hardware resources due to its pipelined structure and the need for data buffering. The phase factor generation, on the other hand, accounted for approximately 30% of the computational burden in all three modes. Therefore, it is crucial to focus on fault-tolerant protection techniques for these two key components.
Table 2.
The proportion of FFT and PFG on the typical values for the three modes.
| Processing Mode | Processing Granularity | Proportion of FFT | Proportion of PFG |
|---|---|---|---|
| Strip-map | 16,384 × 16,384 (Na × Nr) | 65.54% | 31.09% |
| Sliding spotlight | 16,384 × 8192 (Na × Nr) | 62.4% | 32.97% |
| Multi-channel | 8×1024 × 32,768 (Nc × Na_sub × Nr) | 51.69% | 27.70% |
3. Architecture of the SAR SoC
As mentioned before, considering the integrated SAR imaging algorithm from the perspective of vector operations, it can be considered that the part with many FFT/IFFT operations is the key operation part of the imaging algorithm, and the complexity of the CS phase operation circuit is reduced by utilizing the CORDIC processor to compute. Effort to improve the operational efficiency can improve the overall system performance, and system fault-tolerant techniques can improve the reliability.
3.1. SAR Real-Time Imaging Processing Architecture Based on Bus Switching Network
Based on the optimized data network processing architecture, to realize the multi-mode integrated spaceborne SAR real-time imaging processing flow, according to the imaging mode for selecting the corresponding data flow scheduling mode, we designed a multi-mode integrated spaceborne SAR real-time imaging processing system. The multi-mode integrated spaceborne SAR real-time imaging processing system was designed with a classic SoC structure, shown in Figure 4. The bus and DMA architecture were used to build a data exchange network. The data stream drive mode was used to schedule each operation (FFT/IFFT, CORDIC, and MUL) to complete multi-mode integrated spaceborne SAR real-time imaging processing flow. The system is mainly composed of six parts:
CPU subsystem, memory subsystem, data transit subsystem, data processing subsystem, high-speed interface, and global logic and peripherals. The data processing subsystem, which includes FFT, CORDIC (for phase factor calculation), and complex multiplication modules (MUL), is the most critical component, and it can achieve various modes of SAR imaging. Through the analysis shown in Section 2.3, we found that FFT accounted for over 50% of the total computational burden in SAR imaging processing, while the phase factor generation module (based on CORDIC) accounted for around 30%. Therefore, ensuring the fault tolerance of these two modules is crucial. To address this issue, we proposed a word-length optimization redundancy method to make the fixed-point pipelined FFT processors in FFT modules fault tolerant. Additionally, we proposed a radiation hardening pipeline CORDIC architecture utilizing the error correction code and sum of squares check. For the rest of the parts of the SoC architecture (such as MUL module, CPU), we proposed a generic partial triple modular redundancy hardening method based on the HITS algorithm to improve fault tolerance. Finally, we developed a fully automated FPGA-based fault injection platform to test the design’s effectiveness by injecting errors at arbitrary locations. The simulation results demonstrated that the proposed methods significantly improved the chip’s fault tolerance, making the SAR imaging chip safer and more reliable.
CPU subsystem: It mainly includes the CPU processor, which is responsible for the control of the multi-mode integrated spaceborne SAR real-time imaging processing flow and the calculation of partial SAR algorithm parameters. According to the specified imaging mode, the CPU subsystem adopts the corresponding flow control according to the multi-mode integrated spaceborne SAR real-time imaging processing flow in order to complete the SAR imaging processing, and it is also responsible for the calculation of some algorithm parameters.
Data transit subsystem: It is mainly responsible for moving the data stored by the address, converting it into a data stream, and sending it to the data processing subsystem. Data transit management is the core module, has programmable addressing, supports flexible storage access, meets the needs of different algorithm storage access, supports multiple instruction parsing, has an internal design instruction queue, can achieve efficient data handling, supports SoC bus with different types of low delayed access, and supports controllable parsing instruction speed. With the SoC bus to operator sub-bus conversion function, support sending and receiving channels works in parallel. The data transfer subsystem assists the processing system in completing the imaging process by carrying data from the data processing subsystem under the control of the CPU subsystem.
Figure 4.
The framework of the fault-tolerant spaceborne SAR real-time imaging processing system.

Data processing subsystem: In addition to the original data stream input and result data stream output, the top-level exchange network is also responsible for the data interaction between the CIRDIC module, MUL module, and FFT module. The design described in this paper exemplifies two parallel FFT modules that can flexibly configure the structure and sequence of complex multiplication. The FFT pipeline works by instructions to improve the system reconfiguration performance. Due to the complexity of the CS phase operation, the CORDIC processor is adopted in the subsystem. To sum up, through the configuration of the modules themselves and the bus routing address, these arithmetic modules can realize the calculation of different formulas by different combinations of data flow and solve the compatibility problem of different calculation formula factors. The switch network designed in this paper is based on the general AXI4 architecture.
Memory subsystem: It is mainly composed of an external DDR controller and an internal SRAM controller, being responsible for the original image and intermediate data buffer in the SAR imaging process. In order to balance the reading and writing efficiency of SAR data in DDR storage, the literature [31] description method can meet the requirements of balanced reading and writing efficiency, as well as retaining the basic data access mode of DDR memory.
Interface subsystem: It mainly realizes high-speed input and output control of the original echo data, and it also supports serial or parallel bus data interfaces.
Global signal and peripherals: It is mainly composed of clock, reset, PAD control, and some general peripheral interface controllers. It is mainly responsible for dealing with the internal global logic and peripheral control of the system.
The data transit subsystem is responsible for the data moving of the raw input data and the calculated results. Before the start of the operation, the CPU subsystem configuration first of all distributes operation instructions to the data processing subsystem, retrieves data from the DDR memory storage, and puts the data into a data stream into to the operation modules (FFT/CORDIC/MUL). After the data flow is calculated by the processing subsystem, it will flow to the bus. Finally, the calculated results will be transmitted and stored into DDR through the memory sub-system.
The overall system architecture is designed to achieve real-time imaging processing for multi-mode integrated spaceborne SAR. By carefully designing the interaction and data flow scheduling among the subsystems, as well as optimizing the configuration of algorithm modules and memory, efficient and reliable SAR imaging processing can be achieved.
3.2. Fault-Tolerant Fixed-Point Pipelined FFT Processors with the Word-Length Optimization Redundancy Method (WLOR)
3.2.1. Review of FFT Algorithm
The algorithm used to transform a digital signal sampled in the time domain into its representation in frequency domain is known as discrete Fourier transform (DFT). The N-point discrete Fourier transform (DFT) of an input sequence is defined as follows:
The Cooley–Tukey algorithm [46] leverages the divide-and-conquer technique to recursively partition a DFT of size N = M × L into many smaller DFTs of sizes M and L. For N = M × L and M = 2k, let
The N-point FFT can be represented in a two-dimensional form as
The calculation of the M × L-point FFT can be decomposed into three steps: (1) calculate M-point FFT , (2) generate the twiddle factor underlined in (18) for corresponding and (3) calculate L-point FFT. Here, is the M-point FFT, and is described as follows:
- SDF Pipeline Architecture
Single feedback delay (SDF) architecture is one of the most frequently used pipeline architectures. A 256 point SDF radix-22 FFT is shown in Figure 5. There is only one data path, and part of the butterfly operation result is stored in the feedback memories (S1~S8).
Large word-length achieves high precision of the FFT algorithm. However, bit width of memories (S1~S8) and arithmetic logic units (BFI, BFII, M1~M3) is directly determined by the internal word-length configuration (b1~b8). Memories and arithmetic logic units occupy the most area and power consumption, which are the most crucial parameters of an FFT processor. Thus, we need a trade-off between precision and circuit area. The word-length optimization problem is expressed as the equation below. The goal is to optimize the word-length sequence under a set of constraints: input word-length output SQNR, and FFT length NFFT.
3.2.2. Modified Reduced Precision Redundancy (MRPR) for FFT
The concept of reduced precision redundancy allows for the sacrifice of precision in calculation when errors occur, in return for area and power savings of the algorithm implementation on FPGA or other VLSI circuits. Different from TMR that generates identical copies of primary circuits and voters, the main function of systems using RPR is full precision (FP), while the backups operate at a certain reduced precision. Then, the reduced-precision backups will generate an error bound relative to the correct function output. The precise calculation result is compared with the truncation result, and the designed voting logic will determine whether the precise result may be used or not. If an error has occurred in the precise solution, the average of the error bound will be used to form a less-precise result.
Obviously, protection using RPR has the advantage of saving resources. Since there is less resource consumption, another benefit is that the error probability of redundancy modules will be lower, which results from the reduced bit width of data.
Now, we assume that the inputs of a linear system are n-bit fixed-point number, which range from 0~1. If not, we can perform normalization to meet the requirement. The RPR bound module truncates the n-bit binary inputs into m-bit binary numbers (m ≤ n), and the error range is shown in (21). If an error occurs, the corrected result will be formed as shown in (22).
When applying RPR in FFT, the decision of error bound is a critical problem. Different from [41], which uses two redundancy modules for upper and lower bound, we take SQNR as an error bound standard for voting logic.
Specifically, we proposed a modified RPR (MRPR) method for FFT, and the reduced-precision (RP) comparison process is presented in Figure 6. In reduced precision modules, the last (n-r) bits of input are truncated. Two comparators are adopted to verify whether errors occur in precise solution or not. When an error occurs that makes the (FP-RP) result negative, the first comparator will detect the error. In the rest of the situations, the second comparator will work. SQNR is calculated as (23) shown. Compared to SQNRtypical of the same signal, which is calculated using error-free FP and RP result, the error can be detected. The value of SQNRtypical will be different, which depends on the distribution properties of input data and the RPR degree (r/n).
As an example, we chose a set of typical remote sensing data as the input signal, which follows K-distribution in most situations. By leveraging a 4K point FFT design, the average value of 1000 times of SQNR resulted in different RPR degrees obtained, which is shown in Table 3. These values are taken as SQNRtypical. We can see that when 1/2 MRPR degree (12 bit) was adopted, if output of precise FFT was greater than RP-FFT and the SQNR of FFT result was no less than 37.3 dB, the precision result will be considered as correct. If not, FFT output will be generated by the RP correction result.
- Modified SQNR Assessment Expression
In this section, we express the way in which to obtain the value of SQNRtypical. In previous work [47], we reached an SQNR analytical expression of radix-22 fixed-point FFT. We relist the output quantization noise power output signal power and output SQNR expression here and briefly describe the definition of the variables in the expression.
The variables are defined as follows:
- is the variance of input signal.
- is the addition noise variance in stage i.
- is the complex multiplication noise variance in stage i.
- is the initial input word-length of FFT, and is the word-length in stage .
- is the word-length scaling variable in stage i. According to addition operation rules, word-length is expected to increase by 1 bit after one addition. Thus, we define if the word-length increases by 1 bit after the butterfly operation in stage i. The relationship between , , and is described as follows:
In order to establish the relationship between quantization noise variance and word-length, we make some assumptions about the statistical properties of the signal in [48]. We analyzed the rounding and truncation issues depending on these assumptions. The roundoff error range and corresponding quantization error variance when scaling a number to b bit are listed in Table 4.
Now, the addition noise variance in both rounding and truncation issues is expressed as (28) shows. The variable is defined according to addition operation rules.
A complex multiplication is usually composed of four real multiplications. In addition, we usually ensure that the data word-length remains unchanged after a multiplication operation. Thus, the multiplication noise variance in both rounding and truncation issues can be expressed as Equation (30). is the number of non-trivial twiddle factors.
Although Equation (26) is extended to both rounding and truncation issues, it is still not complete. For a simple example, we used Equation (26) to evaluate a 4 point radix-22 FFT in which no rounding or truncation occurs, according to (28)~(30). The SQNR becomes infinite. This is undoubtedly out of reality. The total quantization noise should consist of two parts. One part is the quantization noise generated by the internal arithmetic operations of fixed-point FFT. The power of this part is shown above as Equation (25). Another is the quantization noise generated by input signal floating-point to fixed-point conversion. The quantization noise power of input signal can be expressed as follows:
By substituting (28), (30), and (31) into (26), the modified SQNR assessment expression is described as Equation (32). It shows that rounding offers about improvement of SQNR. As we discuss above, the essential difference between the radix-2k algorithms is the distribution of the twiddle factors. Different radix-2k algorithms correspond to the different values of in the formula. Thus, the modified SQNR analytical form (32) is suitable for radix-2k algorithms.
- SQNR Error Test
In this part, we performed an experiment to verify the modified SQNR expression. The SQNR error between real SQNR and the SQNR calculated from the analytical form (32) was obtained.
It is time-consuming to obtain the real SQNR performance of an FFT processor by register transfer level (RTL) implementation. System C contains signed and unsigned fixed-point data types that can be used to accurately model hardware. Therefore, we applied the System C platform to perform a fixed-point simulation.
The System C fixed-point data types are accurate to the bit level and support a number of features that allow a high level of modeling. These features include modeling quantization and overflow behavior at a high level. The SQNR obtained from System C fixed-point simulation is credible. A System C fixed-point data type declaration is shown below.
- —total word length;
- —integer word length;
- —quantization mode;
- —overflow mode.
Figure 7 shows the histogram of the SQNR error with 5000 random tests for the 4096 point FFT of radix-22, radix-23, and radix-24 algorithms. Both rounding and truncation cases were also tested. For radar applications, we chose chirp signal with/without white gauss noise as the input signal. The mathematical expression of the chirp signal is shown as (33). K is the chirp rate. The experiment result shows that the mean value of the SQNR error was within 3 dB in all test scenarios.
The modified analytical expression of the radix-2k FFT output SQNR was verified using the simulation-based error analysis. The SQNR error was obtained by subtracting the SQNR of the System C simulation from that of the analytical expression. Table 5 shows an example of the comparison. The word-length scaling variable was generated randomly from −2 to 2. The input word-length was 16 bits.
Figure 7.
Histogram of the SQNR error with randomly generated word length. (a–c) Test chirp signal with/without noise under round case; (d–f): test chirp signal with/without noise under truncation case.
Figure 7.
Histogram of the SQNR error with randomly generated word length. (a–c) Test chirp signal with/without noise under round case; (d–f): test chirp signal with/without noise under truncation case.


3.2.3. Analytical Word-Length Expression and Word-Length Optimization Method
In this section, we discuss the word-length expression and propose a word-length optimization method.
- Expression of Internal Word-length {bi}
We find that it is hard to derive the analytical form of sequence directly from (32). However, reviewing (28), (30), and (32), the difference between and is the number of addition and the number of non-trivial multiplication Therefore, in order to make it feasible to derive , we performed an approximation as follows:
Define that
Then, Equation (34) is expressed as follows:
Define that
Then, Equation (34) is induced as follows, and x is the root of the equation:
Finally, the expression of is derived as Equation (39) by using the root of the quadratic equation. For the reason that x must be a positive number, the negative root is rejected.
The current stage scaling variable is closely related with SQNR, and the scaling variables of previous stages: By substituting (39) into (27), the presentation of internal word-length is finally obtained.
- Word-length Optimization Method
According to the derivation above, the internal word-length can be directly calculated. However, the approximation performed in (34) may affect the accuracy and practicality of the calculated results to a certain extent. Considering that the modified SQNR assessment expression (32) is accurate enough, we set up a recursive feedback mechanism to ensure the calculated is practicable. This mechanism is summarized as a word-length optimization method. Pseudo code of the method is described in as follows:
| Word-length optimization method |
| begin input b0, SQNR, Nfft, Quantization_mode; while () { calculate using Equation (39); substitute into Equation (32) to obtain ; ; } transform to using Equation (27); output ; end |
Although there is a recursive procedure in the proposed method, it usually requires only three to four recursive operations to obtain the output.
Limited by the lack of literature on large-point FFT implementation, but also to verify that the method is universal in a variety of application requirements, we selected the study [49], which presents a 128/256/512/1024/1536/2048-point single-path delay feedback pipeline FFT processor for the LTE and WiMAX system as comparison work.
The authors in [49] adopted fixed-point simulation for the selection of word-length. The input, internal, and output word-lengths were all set to 12 bits. We used the proposed method to generate a set of equivalent word-length schemes. Table 6 shows the memory and SQNR comparison results. Compared with the inflexible 12 bit scheme, the schemes saved more memory resource, meanwhile ensuring that the SQNR performance remained unchanged. For the 2048 point case, the method reduced the memory occupation by nearly 17%.
3.2.4. Proposed Word-Length Optimization Redundancy Method
According to the word-length scheme discussed above, a 16,384 point WLOR FFT was proposed and implemented. Figure 8 shows the circuit architecture of the 16,384 point fixed-point FFT. It was designed based on SDF architecture and it consists of three main parts: memory units, arithmetic units, and control units. Memory units include the feedback buffer RAM and the twiddle factor ROM. Leveraging the symmetry of twiddle factors, the proposed design requires only one-quarter as much ROM space for both real and imaginary parts. Arithmetic units are butterfly operation units (adders and subtractors) and multipliers. Control units configure the word-length sequence and control the data stream.
Adopting the word-length optimization method in Section 3.2.3, and setting SQNRtypical as 35 dB for the chirp signal, we obtained the optimal word-length configuration as shown in Table 7. It can save more than 26% memory bits for 16,384 point FFT.
By utilizing the WLOR comparison process shown in Figure 9, which is enhanced from the RP comparison, WLOR-FFT was used for radiation protection of the original n-bit FFT module in this paper. Compared with the MRPR method, the WLOR method had a higher value of SQNRtypical when saving the same area and power resources, which means the redundancy FFT module has a higher precision. When set with the same SQNRtypical value, the WLOR method can save more resources.
3.3. Radiation Hardening Pipelined CORDIC Processors Combing SOC Check in Trigonometric Function with ECCs in Modular Redundancy
3.3.1. Review of the CORDIC Algorithm and Pipelined Architecture
The unified CORDIC algorithm is defined as follows:
where m denotes a coordinate system (+1: circular, 0: linear, or −1: hyperbolic), is the rotation direction, and is the rotation angle that is defined as follows:
In the vectoring mode, the magnitude and the angle of an initial vector will be computed. In rotation mode, the processor will continuously calculate the vast vector rotation. is thus determined by the following equation:
Table 8 summarizes the operations that can be performed in rotation and vectoring modes in each of these coordinate systems. The final scale-factor converges to 1.6467605, and converges to 0.8281.
Three common hardware architectures can be applied in CORDIC processors—specifically, iterative, pipelined (unroll), and a combination of the two. The iterative architecture of CORDIC is shown in Figure 10, which can also be considered as one stage of the pipelined architecture. Full pipelining is real time, which can be achieved by the way that data are latched at the output of every stage. To guarantee the performance of real time, we adopted a full pipelined design in this paper.
3.3.2. Error Correction Codes (ECCs)
This part is mainly based on our previous work [50]. At the outset, ECCs is usually used in binary data in a communication network or other computer architectures such as memory cells. The purpose is to protect the integrity of the bitstream when it is moved over some spatial distance or stored for some length of time. Up to the different requirements of the systems, ECCs may correct errors automatically or merely detect them in order to alert that errors have occurred. Generally, we consider that only one error will occur in several modules at the same time.
Currently, Dr. Gao has proven that the use of ECCs can protect linear systems as well [42]. In this paper, the proposed pipelined CORDIC applied ECCs in the internal structure. The applied scheme in this paper using the Hamming single error correction (SEC) code is presented as follows:
To protect a 16 stage pipelined CORDIC processor by the Hamming SEC code, we need five extra-redundancy modules. To be specific, the number of redundancy modules can be analyzed by Equation (44), in which k and r represent the amount of original and redundancy modules that we need, respectively. Extra overhead of the protection will decrease in the form of a logarithmic curve when the degree of parallelism increases.
Assume that the check bits are C4C3C2C1C0 and C0 will be decided by (43). If the equation is set up, C0 returns 1. Otherwise, C0 returns 0. The same method is used to obtain the value of C1~C4. If an error occurs, the fault module can be corrected by changing its output using the results of redundancy modules. For example, if Y0 is wrong, correction would be completed by Equation (45).
All the twenty-one error locating modes of the 16/5 Hamming SEC code are summarized and presented in Table 9. Sixteen single-error situations of original modules and five single-error situations of redundancy modules were able to be detected and corrected.
3.3.3. Proposed Radiation Hardening CORDIC Processor
To enhance the fault-tolerant resilience as well as reduce overhead, we proposed a radiation hardening CORDIC processor using error correction codes and sum of square check, which is shown in Figure 11. The original part is a 16 stage full pipelined CORDIC processor, and the redundant part includes five extra iteration stages. The proposed 16/5 ECC method is applied in the five redundant stages to detect soft errors, which can lower the resource comparing with TMR or RPR method [39,41]. Furthermore, a sum of square (SOS) check module is adopted after the last stage of original part.
Architecture of the SOS check is presented in Figure 11. The inputs of the SOS check are the outputs of original part. It is noticed that in the rotation mode of the CORDIC circular systems, cos and sin results will be produced at the same time. In the rotation mode of CORDIC hyperbolic systems, cosh and sinh results have the same situation. Hence, we can utilize the characteristic of trigonometric function to detect whether an error occurs or not. Equation (46) is applied in the detection. The input1 and input2 will do a magnitude square at first, then add or subtract according to Equation (46). The result will be compared with “1” to obtain the error report signal. It is worth mentioning that we used 24 bit fixed-point data in the FPGA implementation. The data had 22 bit decimals, which means the least significant digit (LSB) was 2−22 ≈ 2.4 × 10⁻⁷. Thus, we set [1 − 10−6, 1 + 10−6] as the confidence interval in the comparing process. To be more specific, we applied the comparator “=1” shown in Figure 12.
Figure 11.
Architecture of the RH CORDIC processor.

Combining SOS check and ECC protection strategies, we propose a “two-step” RH method. The flow diagram is shown in Figure 13. First, we performed the SOS check. If the result was not equal to 1, this means a severe error occurred and the whole CORDIC processor needs to reconfigured. Otherwise, we start the second step-ECC detection. If the check bits C4C3C2C1C0 are equal to 00000, the result will be considered correct and output. Otherwise, error position will be found by the proportions in Table 2 and the wrong stage will be repaired.
3.3.4. Architecture of the Proposed Platform
In this paper, we designed a FPGA-based fault injection platform to mimic SEUs that may occur in the space radiation environment. This is also based and expanded by our previous work [51]. The proposed fault injection system is mainly composed of the DUT (RH Pipelined CORDIC) module, fault injection controller, and a host computer. A Fault injection controller consists of a fault injector, address generator, analyzer of the error report and recovery, and 2MUX1 selector. The C++ script is deployed for the fully automatic fault injection process. The advantage of this system is its fast speed, and it will not stop the whole system running. The architecture of the proposed system is presented in Figure 14.
DUT: design-under-test, which is where we verify the error sensitivity and fault tolerance of it. In this paper, we adopted a RH pipelined CORDIC design for fault injection tests. The research background of space-borne SAR imaging has a high requirement of real-time and performance, which is the reason we adopted full pipeline architecture. To shorten the article, we only present the fault injection flow for RH CORDIC. The corresponding results can be obtained by replacing the DUT with WLOR FFT or any PTMR circuits.
Fault injection controller (FIC): It is designed as the kernel of the fault injection system. The main function is to read back, modify, and rewrite the bit stream without halting the system. By utilizing the internal configuration access port (ICAP) module, fault injection and error reparations can be realized by using FIC. The fault injection or error repair is a simple read–modify–write process. When we finish the procedure of injecting fault, the computer will transfer the data that includes errors to the CORDIC processor to operate. FIC will be controlled by the finite state machine (FSM), as shown in Figure 15.
Figure 14.
Architecture of the fault injection system.

Address generator: Physical frame address and linear frame address (LFA) are two available approaches to obtain the frame address for an error injection. LFA is more intuitively able to be understood, and we use it to obtain information of the type and location of signals. The format of LFA is shown in Figure 16. For the stacked silicon interconnect (SSI) device, SS is the hardware SLR number, and for non-SSI is set to 00. For calculating the LFA, we still need to know LL…LLL, WW…WWW, and BBBBB. Using the relevant technical manual [52], we derived the Equation (47) for calculating the LFA and proved the correctness of the equation through a large number of experiments. The variables of offset and frame_offset shown in the equation can be easily obtained when we generate the bit stream using VIVADO by Tcl script.
Figure 16.
The format of the linear frame address.

Analyzer of error report and recovery: After injecting single or multiple faults into the DUT, we started CORDIC processing and then stored the result in the DUT output module. Through the flow diagram shown in Figure 13, we can obtain the error report. According to the report, the analyzer will judge the output result and whether requires operating the recovery process.
MUX 2 to 1 selector: Because the fault injection controller and the CORDIC processor share the same data path (using UART) to communicate with PC, thus the MUX 2 to 1 module is required for management. We disconnect the CORDIC processor path when performing fault injection and vice versa.
3.3.5. Automated Fault Injection Process
Figure 17 shows the process of the proposed automated fault injection method. At first, to inject a fault into DUT, we need to read back bit stream through ICAP from configuration memory. Secondly, we invert one configuration bit to mimic the error, then rewrite it back to the configuration memory. The fault injector will emit a done signal to the computer when the error is injected successfully.
Next, the computer will transfer data to DUT to operate. In this paper, the DUT is the RH CORDIC processor. After the operation is done, we apply the output of the two-step RH method to analyze the error report and detect errors. If an error is found, a signal will be emitted to the fault injector to start repairing. In repair flow, we read back a frame from the configuration memory through ICAP according to the relevant LA, reverse the bit according to the bit address, and rewrite it back. The injection process will continuously repeat if the repair is successful. Otherwise, we need to stop the fault injection. For avoiding error accumulation, we should correct the error after output was obtained [53]. The last step is repeating the flow until all LFAs have been used. A C++ script is running on the computer according to various requirements from FIC in order to complete the automatic fault injection process. In the experiment, we selected all the LFAs corresponding to the RH CORDIC processor and divided them into different classes. In order to evaluate the sensitivity and fault tolerance, quantities of experiments were carried out.
Figure 17.
The process of automated fault injection.

3.3.6. Evaluation and Validation by FPGA-based Fault Injection
The proposed RH CORDIC processor was implemented in Xilinx Kintex-7 XC7K325T FPGA, and the hardware resource compared with other fault-tolerant techniques is shown in Table 10. In parentheses, the scale relative to the unprotected CORDIC is given. The proposed RH design presents lower overhead than protection using the TMR or RPR methods.
To avoid errors that occur in the configuration memory affecting the fault injection system, we drew two P-blocks in FPGA implementation to limit the placement in two different areas, as shown in Figure 18. The P-block of DUT included the DUT (CORDIC processor), and the Fault injection controller P-block included the rest. Then, we were able to just select the offset and the frame_offset related to the RH CORDIC processor to perform evaluation and validation.
We used the method in [54] to decide the critical essential bits in this design, whose value affects the CORDIC output. In order to verify the validity of the proposed design, the fault injection experiment was included to mimic the behavior of soft errors that may occur, and for comparison, we adopted the method proposed in [42]. A total of 10,000 errors were randomly injected in critical bits of control signals, the output registers, iteration calculators, and intermediate results. The fault coverage results are shown in Table 11.
Moreover, the average fault injection time was also tested without considering the time of the CORDIC processor operation. The average time required for each fault injection of the whole 10,000 experiments was 1.13 milliseconds. What needs illustration is that, in a very few cases, it is necessary to reset and reprogram the device because of the injection producing persistent errors, which cannot be corrected through reconfiguration.
3.4. Partial Triple Modular Redundancy (PTMR) Method for Fault-Tolerant Circuit Based on the HITS Algorithm
For the rest of the parts of the SAR system that need protection, such as the CPU subsystem of the MUL module in the data processing subsystem, we adopted the partial triple modular redundancy (PTMR) method based on the HITS algorithm to realize fault tolerance.
3.4.1. Review of the HITS Algorithm
The full name of the HITS algorithm is the hyperlink-induced topic search algorithm. It was proposed by Jon Kleinberg in 1999 [55] and is used for ranking web pages. The sorted results of web pages make it easier for people to obtain the information they are interested in. Inspired by academic journal ranking methods [56], top journals such as Science usually have high citation rates, high impact factors, and more authority. Therefore, when comparing two journal articles with roughly the same number of citations, the article cited by top journals will rank higher.
The fundamental idea of the HITS algorithm is that the importance of each web page is characterized by two indicators: authority value (Authority) and hub value (Hub). A web page with high authority value has many other web pages pointing to it, while a web page with high hub value points to many other web pages, as shown in Figure 19.
The algorithm calculates the importance value of each web page based on the connection relationship between nodes. It introduces the concepts of authority value and hub value and follows the algorithm process below:
- Input: directed graph G = (V, E), where V is the set of nodes and E is the set of edges.
- Output: hub score(hub) and authority score(authority) of each node v.
- Initialize the authority and hub values of each node v to 1.
- Repeat the following iteration until convergence:
For each node v ∈ V, update its authority score:
Figure 19.
Relationship of authority value (Authority) and hub value (Hub).

For each node v ∈ V, update its hub score:
where Out(v) represents the set of all nodes that node v points to, and auth(u) represents the authority score of node u.
- 5.
- Normalization:
Normalize the authority and hub values for each node v using the following formula:
3.4.2. Mapping the HITS Algorithm to Circuits
To solve the problem of ranking the importance of circuit nodes, this article introduces the HITS algorithm. The algorithm is based on two fundamental assumptions: a high-quality authority page will be linked to by many high-quality hub pages, and a high-quality hub page will link to many high-quality authority pages. The quality of each page is determined by its hub value and authority value, where the hub value of a page equals the sum of the authority values of all pages it links to, and the authority value of a page equals the sum of the hub values of all pages that link to it. In the HITS algorithm, these two assumptions are used to iteratively calculate the importance of web page nodes based on their reference relationships, yielding a ranking of webpage importance.
This approach is very similar to the fault-tolerant design of the circuit, and these two basic assumptions are consistent with the requirements shown in Equations (48) and (49): trigger circuits that output more need to be strengthened; trigger circuits that have more inputs also need to be strengthened.
By comparing webpage links and the Bi-Logic cone model for circuits, we found that the basic assumptions of the HITS algorithm were consistent with the criteria for evaluating the importance of circuit nodes. Thus, the HITS algorithm was applied to rank the importance of circuit trigger nodes.
3.4.3. Mapping the Basic Concepts of HITS
The basic concepts of the HITS algorithm involve the definition of nodes, paths, and connections.
- The mapping of nodes and paths: In web pages, each node corresponds to a webpage. In circuits, the most important nodes are triggers. The link relationships between web pages correspond to paths between nodes in the HITS algorithm. In circuits, paths refer to combinational logic paths between trigger nodes.
- The mapping of connection relationships: In the HITS algorithm, connections refer to the distribution and direction of paths within webpages. If there is a path between two pages, then there must be a link relationship between these two pages. Such link relationships have directions, and in the webpage model, the direction from i to j means that there is a hyperlink from page node i to page node j.
In circuits, if there is a path between two nodes, it indicates that there is a combinational logic path between the triggers corresponding to these two nodes, with direction from the trigger-receiving signals to the trigger-producing signals. In Table 12, we summarize the mapping relationship between the basic concepts of the HITS algorithm and circuits.
3.4.4. Hardening Method for Circuit Nodes Based on the HITS Algorithm
The circuit node hardening process based on the HITS algorithm is shown in Figure 20. The entire process is divided into three steps: relationship matrix generation, HITS iteration, and hardening of important nodes. The specific operations of these three steps are explained below.
- Relationship matrix generation
By using the chip logic synthesis tool, the hardware design code is read in and synthesized, and the timing paths between internal trigger nodes are reported by the tool and stored in a report file. Then, a script is used to analyze the report file to obtain the trigger node relationship matrix C.
- 2.
- HITS iteration
Using the matrix C generated in the previous step, perform HITS iterations. By accumulating the absolute difference between the authority/hub values of each trigger node before and after iteration, and comparing it with a threshold value, the HITS iteration stops when the accumulated difference is lower than the threshold.
- 3.
- Output of Node sorting results and hardening of important nodes with TMR
Sort the trigger nodes from large to small based on their HITS values (normalized mean square of authority and hub), select the top X nodes (X = 10%~100%) according to the HITS values, and replace them with triple modular triggers. The proportional relationship between the node hardening ratio and the module mean time between failure (MTBF) is evaluated using a Bi-Logic cone model. The node hardening ratio is increased according to the sorting result given in the second step. Based on the relationship curve between the hardening ratio and the MTBF, the proportion of partial triple redundant modular hardening is confirmed. When the theoretical calculation value of partial TMR is close or equal to that of full TMR (defaulted as 99.9%), this partial hardening is applied for implementation.
To validate the effectiveness of the proposed partial TMR hardening method, this paper conducted simulation analysis on key modules in an on-orbit processor, which consisted of seven circuits that had similar structures with modules in the SAR SoC system. The MTBF of each module under no redundancy, partial TMR, and full TMR was calculated, and the proportion of partial redundancy nodes in each module was then calculated to obtain the resource saving ratio. The results are shown in Table 13 and compared with the literature [57] that uses the PageRank method.
Table 13.
Results of different circuit hardening methods.
| Circuit Name | Circuit Size/Gates | Size with Full TMR/Gates | Size with PR Partial TMR/ Resource Saving Ratio | Size with HITS Partial TMR/ Resource Saving Ratio |
|---|---|---|---|---|
| Rproc | 7455 | 22,365 | 15,208/32% | 11,630/48% |
| Lightc | 4140 | 12,420 | 5382/57% | 6541/47% |
| Htgm | 21,300 | 63,900 | 36,636/43% | 44,730/30% |
| Timc | 10,755 | 32,265 | 22,370/31% | 26,457/18% |
| Lmrw | 11,730 | 35,190 | 22,991/35% | 18,533/47% |
| Lbuf | 17,085 | 51,255 | 22,894/55% | 30,070/41% |
| Bproc | 19,080 | 57,240 | 30,528/47% | 43,502/24% |
Figure 20.
The circuit node hardening process based on the HITS algorithm.

As can be seen from Table 13, the ranking results of the two algorithms were different for different circuit structures (different ratios of sequential circuits, RAM, and IO), each with its own advantages and disadvantages. The reason for this is that the PR and HITS ranking algorithms have different principles. By analyzing the circuit structures of these modules, the conclusion is as follows: When the number of incoming connections (inputs) is higher than the number of outgoing connections (outputs), the PR algorithm is more effective. When the number of outgoing connections (outputs) is higher than the number of incoming connections (inputs), the HITS algorithm is better. The advantages and disadvantages of the two methods depend on the connection relationship of inputs and outputs.
In addition, we also tested some circuits from the ISCAS benchmarks. The results in Table 14 show that under the threshold condition of MTBF not less than 99.9% with full TMR, the savings ratio of the HITS partial TMR hardening method was above 21%.
In summary, for general circuits (such as circuits from ISCAS benchmarks), using the HITS partial TMR hardening method for fault-tolerant design can save more than 20% of logic resources. This is a low-cost and high-reliability partial redundancy hardening method that does not rely on functional analysis. For specific applications, such as on-orbit processors, this method can save even more resources, up to 48%. The fault-tolerant effect of this method is better than that of the PR algorithm [57] for some circuit modules.
Table 14.
Results of ISCAS benchmark circuits using the HITS partial TMR hardening methods.
| Circuit Name | Circuit Size/Gates | Size with Full TMR/Gates | Size with HITS Partial TMR/Gates | Resource Saving Ratio/% |
|---|---|---|---|---|
| S27 | 165 | 495 | 376 | 24.04 |
| S386 | 2535 | 7605 | 5932 | 22.00 |
| S713 | 2745 | 8235 | 6478 | 21.34 |
| S953 | 5910 | 17,730 | 13,948 | 21.33 |
| S1488 | 10,125 | 30,375 | 23,895 | 21.33 |
| S5378 | 22,665 | 67,995 | 53,489 | 21.32 |
| S9234 | 32,445 | 97,335 | 76,570 | 21.32 |
4. Realization of the SAR SoC Architecture with Fault Tolerance
4.1. Implementation of the SoC SAR Imaging Processor
According to the abovementioned analysis, a prototype SAR imaging chip with system fault-tolerant techniques was implemented in 65 nm semiconductor manufacturing international corporation (SMIC) technology, as shown in Figure 21.
The chip contains five parts as follows:
Computation logic: The largest part of the chip. The logic resource adopts the grid wiring method and contains an ARM soft core as the CPU part mentioned above. PTMR is applied in the MUL module and in CPU that need fault tolerance. The redundancy logic of WLOR FFT and RH CORDIC are also included.
On-chip memory logic: distributed on the periphery of the computation logic part and serves as an internal cache of chips, with a total capacity of 20 Mb.
DDR logic: connects with the external DDR3 chip and realizes data access to DDR3 memory. The proposed chips support three external groups, with each group having 8 GB storage capacity of the DDR3 chip for parallel data access.
Serdes PHY: mainly responsible for high-speed raw data input and result output. The chip supports two external groups of 4x SERDES interfaces with a lane rate of 3.125 Gbps.
GPIO: the low-frequency input/output interfaces shown in the yellow part of the microphotograph, distributed at the periphery of the chip, used for extending control and interrupting application interfaces.
Table 15 summarizes the main characteristics of the chip. The 2005.8 × 104 gates logic source was integrated in a 35 mm × 35 mm area, and the total power consumption was only 6.147 W @ 200 MHz in standard mode. In addition, we also tested the working power at low-temperature, high-voltage mode and high-temperature, low- voltage mode to suit the space application environment.
4.2. Implementation of the Measurement System
The prototype chip is packaged on PCB boards, shown in Figure 22. The chip is mainly composed of one ASIC chip, three groups of DDR3 SDRAM (DDRA and DDRB for raw data and DDRT for the CS factors), and many other high- and low-speed interface peripherals. Based on the chip test platform, we set up the measurement system, which includes the power, the simulator of the spaceborne SAR, the chip test platform, and the corresponding display platform. The simulator, consisting of a Xilinx ZYNQ board, is responsible for the raw data playback and transmits to the chip test platform via a high-speed interface. Finally, the imaging result can be shown through the chip function display.
4.3. Results and Comparison
The proposed chip based on the SoC architecture with system fault-tolerant techniques can execute multiple modes in a flexible manner. Imaging quality and time performance are the two key indicators of spaceborne SAR systems. The raw data with different modes that we chose to test the performance of the chip were sourced from the Chinese Gaofen-3 satellite and included 16,384 × 16,384 points for strip-map mode, 65,536 × 8192 points for multi-channel strip-map mode, and 32,768 × 4096 points as multi-channel scan mode data. The actual scene imaging result of the measurement system is shown in Figure 23.
By recording the numbers of clock cycles, we found that it took 9.2 s, 50.6 s, and 7.4 s for strip-map, multi-channel strip-map, and multi-channel scan mode, respectively, and 6.9 W for the system hardware to process the SAR raw data. Table 16 shows a comparison with previous works. The main advantage of this chip is that it can realize multi-mode imaging with fault tolerance. In addition, the time and power consumptions are less than those of the related design described in [30,31], because the proposed SoC architecture has higher integration. Compared with references [2,28,58,59,60], taking the data granularity processed into consideration, the proposed system shows advantages in both processing time and power consumption. Although [14] takes only 2.8 s to process SAR raw data with 32,768 × 32,768 granularity, the large power consumption of the GPU is unacceptable with respect to the strict spaceborne real-time processing requirements.
5. Conclusions
In this paper, to perform spaceborne multi-mode SAR imaging processing tasks, a float-point imaging chip based on SoC architecture with system fault-tolerant techniques was proposed. The system-level fault-tolerant techniques were designed specifically for SAR chips, mainly including fault-tolerant fixed-point pipelined FFT processors with the word-length optimization redundancy method (WLOR); radiation hardening pipelined CORDIC processors combing SOS check in trigonometric function with ECCs in modular redundancy; and the partial triple modular redundancy (PTMR) method for the fault-tolerant circuit based on the HITS algorithm. The efficient architecture achieved real-time performance with low power consumption and high reliability. A single-chip board requires 20.12 s, 43.23 s, and 10.05 s on a strip-map with 16,384 × 16,384 granularity, a multi-channel strip-map of 65,536 × 8192 granularity, and a multi-channel scan mode of 32,768 × 4096 granularity, respectively, as well as 6.9 W for the system hardware to process the SAR raw data.
In the future, we envision the proposed framework as a potential candidate for expanding its applications to spaceborne multi-mode SAR imaging processing. As space technology continues to advance, especially in anti-radiation reinforcement and system fault-tolerant techniques, we anticipate that our framework can be adapted to accommodate these developments, making it a feasible solution for the demands of spaceborne missions. Our forthcoming research endeavors will primarily revolve around enhancing both the reliability and performance of our framework while maintaining an emphasis on resource efficiency. We aim to strike a balance between efficiency and robustness, ensuring that the system operates optimally while conserving valuable resources. Furthermore, we recognize that algorithm-based fault-tolerant techniques, when combined with redundancy-based approaches, hold great promise as a direction for achieving highly efficient and reliable fault tolerance. As we delve into future work, we will explore the integration of these techniques to advance the overall capabilities of our framework.
Author Contributions
H.C. and Y.X. (Yu Xie) conceived and designed the framework. Y.X. (Yizhuang Xie) and Y.X. (Yu Xie) per-formed the mapping technology and analyzed the data. Y.X. (Yizhuang Xie) and B.L. de-bugged the system hardware. Y.X. (Yu Xie) wrote the paper. Y.X. (Yizhuang Xie) and H.C. reviewed papers and submitted comments. All authors have read and agreed to the published version of the manuscript.
Funding
This work was supported by the National Key R & D Program of China under contract 2022YFB3902304.
Data Availability Statement
The data that support the findings of this study are available from the corresponding author, Y.-Z.X., upon reasonable request.
Conflicts of Interest
The authors declare no conflict of interest.
References
- Franceschetti, G.; Lanari, R. Synthetic Aperture Radar Processing; Taylor and Francis: Abingdon-on-Thames, UK, 1999. [Google Scholar]
- Lou, Y.; Clark, D.; Marks, P.; Muellerschoen, R.J.; Wang, C.C. Onboard Radar Processor Development for Rapid Response to Natural Hazards. IEEE J. Sel. Top. Appl. Earth Observ. Remote Sens. 2016, 9, 2770–2776. [Google Scholar] [CrossRef]
- Hirose, A.; Rosen, P.A.; Yamada, H.; Zink, M. Foreword to the Special Issue on Advances in SAR and Radar Technology. IEEE J. Sel. Top. Appl. Earth Observ. Remote Sens. 2015, 8, 3748–3750. [Google Scholar] [CrossRef]
- Gierull, C.H.; Vachon, P.W. Foreword to the Special Issue on Multichannel Space-Based SAR. IEEE J. Sel. Top. Appl. Earth Observ. Remote Sens. 2015, 8, 4995–4997. [Google Scholar] [CrossRef]
- Tralli, D.M.; Blom, R.G.; Zlotnicki, V.; Donnellan, A.; Evans, D.L. Satellite remote sensing of earthquake, volcano, flood, landslide and coastal inundation hazards. ISPRS J. Photogramm. Remote Sens. 2005, 59, 185–198. [Google Scholar] [CrossRef]
- Percivall, G.S.; Alameh, N.S.; Caumont, H.; Moe, K.L.; Evans, J.D. Improving Disaster Management Using Earth Observations—GEOSS and CEOS Activities. IEEE J. Sel. Top. Appl. Earth Observ. Remote Sens. 2013, 6, 1368–1375. [Google Scholar] [CrossRef]
- Joyce, K.E.; Belliss, S.E.; Samsonov, S.V.; McNeill, S.J.; Glassey, P.J. A review of the status of satellite remote sensing and image processing techniques for mapping natural hazards and disasters. Prog. Phys. Geogr. 2009, 33, 183–207. [Google Scholar] [CrossRef]
- Xu, G.; Zhang, B.; Yu, H.; Chen, J.; Xing, M.; Hong, W. Sparse Synthetic Aperture Radar Imaging from Compressed Sensing and Machine Learning: Theories, Applications and Trends. IEEE Geosci. Remote Sens. Mag. 2022, 10, 32–69. [Google Scholar] [CrossRef]
- Zhang, B.; Xu, G.; Zhou, R.; Zhang, H.; Hong, W. Multi-channel Back-projection Algorithm for mmWave Automotive MIMO SAR Imaging with Doppler-division Multiplexing. IEEE J. Sel. Top. Signal Process. 2023, 17, 445–457. [Google Scholar] [CrossRef]
- Copernicus: Sentinel-1—The SAR Imaging Constellation for Land and Ocean Services. Available online: https://directory.eoportal.org/web/eoportal/satellite-missions/c-missions/copernicus-sentinel-1 (accessed on 24 September 2023).
- TDX (TanDEM-X: TerraSAR-X add-on for Digital Elevation Measurement). Available online: https://directory.eoportal.org/web/eoportal/satellite-missions/t/tandem-x (accessed on 24 September 2023).
- ALOS-2 (Advanced Land Observing Satellite-2; SAR Mission)/Daichi-2. Available online: https://directory.eoportal.org/web/eoportal/satellite-missions/a/alos-2 (accessed on 24 September 2023).
- Zhang, F.; Yao, X.; Tang, H.; Yin, Q.; Hu, Y.; Lei, B. Multiple Mode SAR Raw Data Simulation and Parallel Acceleration for Gaofen-3 Mission. IEEE J. Sel. Top. Appl. Earth Observ. Remote Sens. 2018, 11, 2115–2126. [Google Scholar] [CrossRef]
- Zhang, F.; Li, G.; Li, W.; Hu, W.; Hu, Y. Accelerating Spaceborne SAR Imaging Using Multiple CPU/GPU Deep Collaborative Computing. Sensors 2016, 16, 494. [Google Scholar] [CrossRef]
- Wong, F.W.; Yeo, T.S. New applications of nonlinear chirp scaling in SAR data processing. IEEE Trans. Geosci. Remote Sens. 2002, 39, 946–953. [Google Scholar] [CrossRef]
- Moreira, A.; Mittermayer, J.; Scheiber, R. Extended chirp scaling algorithm for air- and spaceborne SAR data processing in stripmap and ScanSAR imaging modes. IEEE Trans. Geosci. Remote Sens. 1996, 34, 1123–1136. [Google Scholar] [CrossRef]
- Showman, G.A. Stripmap SAR; Principles of Modern Radar: Advanced Techniques; IET Digital Library: London, UK, 2012; pp. 259–335. [Google Scholar]
- Proctor, P. Regional carriers turn to flight schools. Aviat. Week Space Technol. 1994, 146, 37. [Google Scholar]
- Moreira, A.; Mittermayer, J. Method for Azimuth Scaling for SAR-Data and High Precision Processor for Two-Dimensional Processing of Scan-SAR Data. U.S. Patent US5812082A, 22 September 1998. [Google Scholar]
- Ender, J.H.G. Detection and estimation of moving target signals by multi-channel SAR. Proc. Eusar. 1996, 50, 150–156. [Google Scholar]
- Meta, A.; Mittermayer, J.; Prats, P.; Scheiber, R.; Steinbrecher, U. TOPS Imaging with TerraSAR-X: Mode Design and Performance Analysis. IEEE Trans. Geosci. Remote Sens. 2010, 48, 759–769. [Google Scholar] [CrossRef]
- Song, W.S.; Baranoski, E.J.; Martinez, D.R. One trillion operations per second on-board VLSI signal processor for Discoverer II space based radar. In Proceedings of the 2000 IEEE Aerospace Conference, Big Sky, MT, USA, 25 March 2000. [Google Scholar]
- Langemeyer, S.; Kloos, H.; Simon-Klar, C.; Friebe, L.; Hinrichs, W.; Lieske, H.; Pirsch, P. A compact and flexible multi-DSP system for real-time SAR applications. In Proceedings of the 2003 IEEE International Geoscience and Remote Sensing Symposium, IGARSS’03, Toulouse, France, 21–25 July 2003. [Google Scholar]
- Wai-Chi, F.; Jin, M.Y. On board processor development for NASA’s spaceborne imaging radar with VLSI system-on-chip technology. In Proceedings of the 2004 IEEE International Symposium on Circuits and Systems, Vancouver, BC, Canada, 23–26 May 2004. [Google Scholar]
- Le, C.; Chan, S.; Cheng, F.; Fang, W.; Fischman, M.; Hensley, S.; Johnson, R.; Jourdan, M.; Marina, M.; Parham, B.; et al. Onboard FPGA-based SAR processing for future spaceborne systems. In Proceedings of the IEEE 2004 Radar Conference, Philadelphia, PA, USA, 29 April 2004; pp. 15–20. [Google Scholar]
- Fang, W.C.; Le, C.; Taft, S. On-board fault-tolerant SAR processor for spaceborne imaging radar systems. In Proceedings of the IEEE International Symposium on Circuits and Systems, Kobe, Japan, 23–26 May 2005. [Google Scholar]
- Greco, J.; Cieslewski, G.; Jacobs, A.; Troxel, I.A.; George, A.D. Hardware/software interface for high-performance space computing with FPGA coprocessors. In Proceedings of the IEEE Aerospace Conference, Big Sky, MT, USA, 4–11 March 2006. [Google Scholar]
- Desai, N.M.; Saravana Kumar, B.; Sharma, R.K.; Kunal, A.; Gameti, R.B.; Gujraty, V.R. Near Real Time SAR Processors for ISRO’s Multi-Mode RISAT-I and DMSAR. In Proceedings of the 7th European Conference on Synthetic Aperture Radar, Friedrichshafen, Germany, 2–5 June 2008. [Google Scholar]
- Pfitzner, M.; Cholewa, F.; Pirsch, P.; Blume, H. FPGA based architecture for real-time SAR processing with integrated motion compensation. In Proceedings of the 2013 Asia-Pacific Conference on Synthetic Aperture Radar (APSAR), Tsukuba, Japan, 23–27 September 2013. [Google Scholar]
- Yang, C.; Li, B.; Chen, L.; Wei, C.; Xie, Y.; Chen, H.; Yu, W. A Spaceborne Synthetic Aperture Radar Partial Fixed-Point Imaging System Using a Field-Programmable Gate Array—Application-Specific Integrated Circuit Hybrid Heterogeneous Parallel Acceleration Technique. Sensors 2017, 17, 1493. [Google Scholar] [CrossRef]
- Li, B.; Shi, H.; Chen, L.; Yu, W.; Yang, C.; Xie, Y.; Bian, M.; Zhang, Q.; Pang, L. Real-Time Spaceborne Synthetic Aperture Radar Float-Point Imaging System Using Optimized Mapping Methodology and a Multi-Node Parallel Accelerating Technique. Sensors 2018, 18, 725. [Google Scholar] [CrossRef]
- Yang, Z.; Ding, Z.; Chen, L.; Long, T. Implementation of CS Coefficient Calculation Based on Dual-Operator Engines in Multimode Spaceborne SAR Imaging Systems. IET Electron. Lett. 2017, 54, 163–165. [Google Scholar] [CrossRef]
- Kwak, J.-H.; Piuri, V.; Swartzlander, E.E., Jr. Fault-Tolerant High-performance CORDIC Processors. In Proceedings of the International Symposium on Defect and Fault Tolerance in VLSI Systems, Yamanashi, Japan, 25–27 October 2000. [Google Scholar] [CrossRef]
- Wang, S.; Wen, Z.; Yu, L. High-performance fault-tolerant CORDIC processor for space applications. In Proceedings of the International Symposium on Systems and Control in Aerospace and Astronautics, Harbin, China, 19–21 January 2006. [Google Scholar] [CrossRef]
- Ibrahim, M.M.; Asami, K.; Cho, M. Evaluation of SRAM based FPGA performance by simulating SEU through fault injection. In Proceedings of the International Conference on Recent Advances in Space Technologies, Istanbul, Turkey, 12–14 June 2013; pp. 649–654. [Google Scholar] [CrossRef]
- Xilinx. UltraScale Devices Maximize Design Integrity with Industry-Leading SEU Resilience and Mitigation; White Paper: WP462 (v1.0); Xilinx: San Jose, CA, USA, 2015. [Google Scholar]
- Souari, A.; Thibeault, C.; Blaquière, Y.; Velazco, R. An automated fault injection for evaluation of LUTs robustness in SRAM-based FPGAs. In Proceedings of the IEEE East-West Design & Test Symposium, Batumi, Georgia, 26–29 September 2015. [Google Scholar] [CrossRef]
- Stamenković, Z.; Petrović, V.; Schoof, G. Fault-tolerant ASIC: Design and implementation. Factauniversitatis-Ser. Electron. Energetic 2013, 26, 175–186. [Google Scholar] [CrossRef]
- Yeh, Y.C. Triple-triple redundant 777 primary flight computer. In Proceedings of the 1996 IEEE Aerospace Applications Conference, Aspen, CO, USA, 10 February 1996; Volume 1, pp. 293–307. [Google Scholar] [CrossRef]
- Gaisler, J. A portable and fault-tolerant microprocessor based on the SPARC v8 architecture. In Proceedings of the International Conference on Dependable Systems and Networks, Washington, DC, USA, 23–26 June 2002; pp. 409–415. [Google Scholar] [CrossRef]
- Snodgrass, J. Low-Power Fault Tolerance for Spacecraft FPGA-Based Numerical Computing. Ph.D. Dissertation, Naval Postgraduate School, Monterey, CA, USA, 2006. [Google Scholar]
- Gao, Z.; Reviriego, P.; Xu, Z.; Su, X.; Zhao, M.; Wang, J.; Maestro, J.A. Fault Tolerant Parallel FFTs Using Error Correction Codes and Parseval Checks. IEEE Trans. Very Large Scale Integr. VLSI Syst. 2016, 24, 769–773. [Google Scholar] [CrossRef]
- Sanchez-Clemente, A.; Entrena, L.; Garcia-Valderas, M. Partial TMR in FPGAs Using Approximate Logic Circuits. In Proceedings of the European Conference on Radiation and ITS Effects on Components and Systems, Bremen, Germany, 19–23 September 2016. [Google Scholar]
- Raney, R.K.; Runge, H.; Bamler, R.; Cumming, I.G.; Wong, F.H. Precision SAR processing using chirp scaling. IEEE Trans. Geosci. Remote Sens. 1994, 32, 786–799. [Google Scholar] [CrossRef]
- Pei, L.; Ding, Z. Data processing of multi-channel space-borne SAR. In Proceedings of the IET International Radar Conference, Guilin, China, 20–22 April 2009. [Google Scholar]
- O’Brien, J.; Mather, J.; Holland, B. A 200 MIPS single-chip 1 k FFT processor. In Proceedings of the IEEE International Solid-State Circuits Conference, 1989 ISSCC Digest of Technical Papers, New York, NY, USA, 15–17 February 1989; pp. 166–167. [Google Scholar]
- Yang, C.; Xie, Y.; Chen, H.; Deng, Y. New quantization error assessment methodology for fixed-point pipeline FFT processor design. In Proceedings of the IEEE System-on-Chip Conference (SOCC), Las Vegas, NV, USA, 2–5 September 2014; pp. 299–305. [Google Scholar]
- Oppenheim, A.V.; Weinstein, C.J. Effects of finite register length in digital filtering and the fast Fourier transform. Proc. IEEE 1972, 60, 957–976. [Google Scholar] [CrossRef]
- Yu, C.; Yen, M.-H. Area-Efficient 128- to 2048 1536-Point Pipeline FFT Processor for LTE and Mobile WiMAX Systems. IEEE Trans. Very Large Scale Integr. VLSI Syst. 2015, 23, 1793–1800. [Google Scholar] [CrossRef]
- Xie, Y.; Yang, C.; Mao, C.A.; Chen, H.; Xie, Y.Z. A novel low-overhead fault tolerant parallel-pipelined FFT design. In Proceedings of the IEEE International Symposium on Defect & Fault Tolerance in VLSI & Nanotechnology Systems, Cambridge, UK, 23–25 October 2017. [Google Scholar] [CrossRef]
- Mao, C.A.; Xie, Y.; Xie, Y.; Chen, H.; Shi, H. An Automated Fault Injection Platform for Fault Tolerant FFT Implemented in SRAM-Based FPGA. In Proceedings of the 2018 31st IEEE International System-on-Chip Conference (SOCC), Arlington, VA, USA, 4–7 September 2018. [Google Scholar] [CrossRef]
- Xilinx. 7 Series FPGAs Configuration. User Guide: UG470 (v1.13); Xilinx: San Jose, CA, USA, 2018. [Google Scholar]
- Entrena, L. Hardware Fault Injection. Soft Errors in Modern Electronic Systems, 1st ed.; Springer: Grenoble, France, 2011; Chapter 6; pp. 141–166. [Google Scholar]
- Le, R. Soft Error Mitigation Using Prioritized Essential Bits; XAPP538; Xilinx: San Jose, CA, USA, 2012. [Google Scholar]
- Kleinberg, J.M. Authoritative sources in a hyperlinked environment. J. ACM 1999, 46, 604–632. [Google Scholar] [CrossRef]
- Yang, W. An Improved HITS Algorithm Based on Analysis of Web Page Links and Web Content Similarity. In Proceedings of the 2016 International Conference on Cyberworlds (CW), Chongqing, China, 28–30 September 2016. [Google Scholar]
- Zhu, Y.; Wang, H.; Teng, L.; Ding, Z.; Chen, L. Partial TMR method for on-orbit processors based on pagerank algorithm. Electron. Lett. 2019, 55, 124–126. [Google Scholar]
- Gu, C.F.; Chang, W.; Li, X.; Liu, Z. Multi-Core DSP Based Parallel Architecture for FMCW SAR Real-Time Imaging. Radio Eng. 2015, 24, 1084–1090. [Google Scholar] [CrossRef]
- Bierens, L.; Vollmuller, B.J. On-board Payload Data Processor (OPDP) and its application in advanced multi-mode, multi-spectral and interferometric satellite SAR instruments. In Proceedings of the 9th European Conference on Synthetic Aperture Radar, EUSAR 2012, Nuremberg, Germany, 23–26 April 2012. [Google Scholar]
- Franceschetti, G.; Tesauro, M.; Strollo, A.G.M.; Napoli, E.; Cimino, C.; Spirito, P.; Mazzeo, A.; Mazzocca, N. A VLSI architecture for real time processing of one-bit coded SAR signals. In Proceedings of the URSI International Symposium on Signals, Systems, and Electronics, Pisa, Italy, 29 September–2 October 1998. [Google Scholar]
Figure 2.
Multi-channel SAR transceiver system schematic.

Figure 3.
Specific implementation flow of signal reconstruction based on an inverse filter.

Figure 5.
The 256-point Radix-22 pipelined FFT architecture.

Figure 6.
RP comparison process of the MRPR method for FFT.

Figure 8.
Circuit architecture block diagram of the 16,384 point FFT.

Figure 9.
The WLOR comparison process for WLOR-FFT.

Figure 10.
The iterative architecture of CORDIC.

Figure 12.
Architecture of the SOS check.

Figure 13.
Flow diagram of the “two-step” RH method.

Figure 15.
Fault injection FSM.

Figure 18.
Placement of the RH CORDIC and fault injection system.

Figure 21.
The microphotograph of the prototype SAR imaging chip.

Figure 22.
The measurement environment: (a) chip test platform; (b) the measurement system.

Figure 23.
Imaging result: (a) Strip-map mode imaging result; (b) two-channel strip-map mode imaging result; (c) two-channel scan mode imaging result.
Figure 23.
Imaging result: (a) Strip-map mode imaging result; (b) two-channel strip-map mode imaging result; (c) two-channel scan mode imaging result.

Table 3.
SQNR of 4K point FFT at different MRPR degrees.
| 24-Bit | 16-Bit (2/3) | 12-Bit (1/2) | 8-Bit (1/3) | |
|---|---|---|---|---|
| SQNR | / | 42.1 dB | 37.3 dB | 33.8 dB |
Table 4.
Roundoff error range and corresponding variance.
| Error Range for Positive Number | Error Range for Negative Number | Variance 1 | |
|---|---|---|---|
| Truncation | |||
| Rounding |
1 Assume roundoff error to be uniformly distributed.
Table 5.
Example of the random test for fixed-point FFT.
| No. | Word-Length of Stage | SQNR (dB) | ||
|---|---|---|---|---|
| 1 2 3 4 5 6 7 8 | Sim. 1 | Est. 2 | Err. | |
| 1 | 15 14 17 14 14 15 18 16 | 55.66 | 54.78 | 0.88 |
| 2 | 18 15 15 15 14 16 14 13 | 46.23 | 45.18 | 1.05 |
| 3 | 16 17 18 19 20 21 21 22 | 80.98 | 80.62 | 0.36 |
| 4 | 15 15 15 14 17 14 13 12 | 39.81 | 38.79 | 1.02 |
| 5 | 15 15 14 13 13 12 11 10 | 28.14 | 26.92 | 1.22 |
| 6 | 17 15 14 13 12 12 11 12 | 36.18 | 33.36 | 2.82 |
| 7 | 17 20 19 22 21 21 23 23 | 83.90 | 83.89 | 0.01 |
| 8 | 16 19 17 20 19 18 18 17 | 69.45 | 68.49 | 0.96 |
1 SQNR obtained using SystemC fixed-point simulation. 2 SQNR calculated using analytical expression (32).
Table 6.
Memory and SQNR comparison between [49] and the proposed method.
Table 6.
Memory and SQNR comparison between [49] and the proposed method.
| FFT Length | Word-Length Scheme | Memory Counts (Bit) | SQNR (dB) |
|---|---|---|---|
| 128 | 12 12 12 12 12 12 12 12 | 1536 | 36.6 |
| 9 10 10 11 11 12 12 13 | 1309 | 37.2 | |
| 256 | 12 12 12 12 12 12 12 12 12 | 3072 | 34.1 |
| 9 10 11 11 11 11 12 12 13 | 2685 | 35.4 | |
| 512 | 12 12 12 12 12 12 12 12 12 12 | 6144 | 30.1 |
| 9 10 10 10 10 11 11 12 12 13 | 5149 | 30.9 | |
| 1024 | 12 12 12 12 12 12 12 12 12 12 12 | 12,288 | 27.3 |
| 10 10 10 10 10 11 11 11 12 12 13 | 10,301 | 27.4 | |
| 2048 | 12 12 12 12 12 12 12 12 12 12 12 12 | 24,576 | 24.2 |
| 10 10 10 10 10 10 10 11 11 12 13 13 | 20,511 | 24.1 |
Table 7.
Word-length configuration of WLOR FFT implementation.
| Word-Length Scheme | b0 b1 b2 b3 b4 b5 b6 b7 b8 b9 b10 b11 b12 b13 b14 | Memory (Bits) |
|---|---|---|
| Fixed-point simulation | 24 24 24 24 24 24 24 24 24 24 24 24 24 24 24 | 786,432 |
| Proposed method | 16 17 18 18 19 20 21 21 22 23 24 25 26 27 27 | 581,004 |
Table 8.
Generalized CORDIC algorithm in different coordinate systems.
| CORDIC | ) | ) |
|---|---|---|
| Circular systems (m = 1) | ||
| Linear systems (m = 0) | ||
| Hyperbolic systems (m = −1) |
Notes: .
Table 9.
Error locating of the 16/5 Hamming SEC code.
| No. | C4C3C2C1C0 | Error Position | No. | C4C3C2C1C0 | Error Position |
|---|---|---|---|---|---|
| 0 | 00011 | Y0 | 11 | 10001 | Y11 |
| 1 | 00101 | Y1 | 12 | 10010 | Y12 |
| 2 | 00110 | Y2 | 13 | 10011 | Y13 |
| 3 | 00111 | Y3 | 14 | 10100 | Y14 |
| 4 | 01001 | Y4 | 15 | 10101 | Y15 |
| 5 | 01010 | Y5 | 16 | 00001 | Y16 |
| 6 | 01011 | Y6 | 17 | 00010 | Y17 |
| 7 | 01100 | Y7 | 18 | 00100 | Y18 |
| 8 | 01101 | Y8 | 19 | 01000 | Y19 |
| 9 | 01110 | Y9 | 20 | 10000 | Y20 |
| 10 | 01111 | Y10 | 21 | 00000 | Error Free |
Table 10.
Hardware resource evaluation of the proposed RH CORDIC with different fault-tolerant techniques.
Table 10.
Hardware resource evaluation of the proposed RH CORDIC with different fault-tolerant techniques.
| Unprotected CORDIC | TMR Protected [39] | RPR (1/2) Protected [41] | Proposed “Two-Step” Protected | |
|---|---|---|---|---|
| Flip-Flops | 1710 | 5216 (3.05) | 3591 (2.10) | 3044 (1.78) |
| LUTs | 1838 | 5735 (3.12) | 3970 (2.16) | 3327 (1.81) |
Table 11.
Fault coverage results of the proposed RH CORDIC.
| Control Signals | Output Registers | Iteration Calculators | Intermediate Results | |
|---|---|---|---|---|
| Errors injected | 2000 | 2000 | 3000 | 3000 |
| Errors detected | 1802 | 1885 | 2931 | 2983 |
| Fault coverage | 90.1% | 94.25% | 97.7% | 99.4% |
Table 12.
Summary of mapping between the basic concepts of the HITS algorithm and circuits.
| Concepts | Meaning in the Circuit | |
|---|---|---|
| Definition | Node | Input port, output port, and internal trigger |
| Path | Combinational logic path between nodes | |
| Connection | Direction from receiving trigger to sending trigger |
Table 15.
Chip characteristics.
| Parameters | Value |
|---|---|
| Technology | 65 nm SMIC |
| Package | Flip-Chip 1245 |
| Chip area | 35 mm × 35 m |
| Clock frequency | 100 MHz |
| Logic source | 2005.8 × 104 (gate) |
| Power | Low-temperature, high-voltage mode (−40 °C; 1.32 V): 4.565 W |
| Standard mode (25 °C; 1.2 V): 6.147 W | |
| High-temperature, low-voltage mode (125 °C 1.08 V): 8.074 W | |
| On-chip memory | 20 Mb |
| Weight | 50 g |
| Pin count | 506 |
| IO supply voltage | Serdes: 2.5 V, GPIO: 3.3 V |
| Internal voltage | 1.2 V |
| IR–drop | 3.1% |
Table 16.
Comparison with previous works.
| Works | Year | Schemes | Mode | Data Granularity | Working Frequency | Power Consumption | Processing Time |
|---|---|---|---|---|---|---|---|
| Proposed | 2023 | ASIC | Strip-map | 16,384 × 16,384 | 200 MHZ | 6.9 W | 9.2 s |
| Dual-channel strip-map | 65,536 × 8192 | 50.6 s | |||||
| Dual-channel scan | 32,768 × 4096 | 7.4 s | |||||
| [29] | 2017 | FPGA | Strip-map | 16,384 × 16,384 | 100 MHZ | 17 W | 10.6 s |
| [30] | 2017 | FPGA+ASIC | Strip-map | 16,384 × 16,384 | 100 MHZ | 21 W | 12.1 s |
| [2] | 2016 | FPGA+ Microprocess | / | 6472 × 3328 | / | 68 W | 8 s |
| [14] | 2016 | CPU+GPU | Strip-map | 32,768 × 32,768 | / | >330 W | 2.8 s |
| [58] | 2015 | Multi-DSP | / | 4096 × 4096 | 100 MHZ | / | 2.178 s |
| [59] | 2012 | CPU+ASIC | / | 1024 × 1024 | 100 MHz | 10 W | / |
| [28] | 2008 | Multi-DSP | / | 4096 × 4096 | 100 MHZ | 35 W | 13 s |
| [60] | 1998 | ASIC | / | 1020 × 200 | 10 MHz | 2 W | / |
Disclaimer/Publisher’s Note: The statements, opinions and data contained in all publications are solely those of the individual author(s) and contributor(s) and not of MDPI and/or the editor(s). MDPI and/or the editor(s) disclaim responsibility for any injury to people or property resulting from any ideas, methods, instructions or products referred to in the content. |
© 2023 by the authors. Licensee MDPI, Basel, Switzerland. This article is an open access article distributed under the terms and conditions of the Creative Commons Attribution (CC BY) license (https://creativecommons.org/licenses/by/4.0/).
Share and Cite
MDPI and ACS Style
Xie, Y.; Xie, Y.; Li, B.; Chen, H. Advancements in Spaceborne Synthetic Aperture Radar Imaging with System-on-Chip Architecture and System Fault-Tolerant Technology. Remote Sens. 2023, 15, 4739. https://doi.org/10.3390/rs15194739
AMA Style
Xie Y, Xie Y, Li B, Chen H. Advancements in Spaceborne Synthetic Aperture Radar Imaging with System-on-Chip Architecture and System Fault-Tolerant Technology. Remote Sensing. 2023; 15(19):4739. https://doi.org/10.3390/rs15194739
Chicago/Turabian StyleXie, Yu, Yizhuang Xie, Bingyi Li, and He Chen. 2023. "Advancements in Spaceborne Synthetic Aperture Radar Imaging with System-on-Chip Architecture and System Fault-Tolerant Technology" Remote Sensing 15, no. 19: 4739. https://doi.org/10.3390/rs15194739
Note that from the first issue of 2016, this journal uses article numbers instead of page numbers. See further details here.