Article

Quantitative Model Construction for Sustainable Security Patterns in Social–Ecological Links Using Remote Sensing and Machine Learning

1
School of Architecture, Chang’an University, Xi’an 710061, China
2
School of Water and Environment, Chang’an University, Xi’an 710054, China
3
Key Laboratory of Subsurface Hydrology and Ecological Effects in Arid Region, Ministry of Education, Chang’an University, Xi’an 710054, China
4
Xi’an Monitoring, Modelling and Early Warning of Watershed Spatial Hydrology International Science and Technology Cooperation Base, Chang’an University, Xi’an 710054, China
5
State Key Laboratory of Desert & Oasis Ecology, Xinjiang Institute of Ecology & Geography, Chinese Academy of Sciences, Urumqi 830011, China
6
School of Civil Engineering, Sun Yat-sen University, Guangzhou 510275, China
*
Author to whom correspondence should be addressed.
Remote Sens. 2023, 15(15), 3837; https://doi.org/10.3390/rs15153837
Submission received: 15 June 2023 / Revised: 16 July 2023 / Accepted: 17 July 2023 / Published: 1 August 2023

Abstract

:
With the global issues of extreme climate and urbanization, the ecological security patterns (ESPs) in the Qinling Mountains are facing prominent challenges. As a crucial ecological barrier in China, understanding the characteristics of ESPs in the Qinling Mountains is vital for achieving sustainable development. This study focuses on Yangxian and employs methods such as machine learning (ML), remote sensing (RS), geographic information systems (GISs), analytic hierarchy process and principal component analysis (AHP–PCA), and the minimum cumulative resistance (MCR) model to construct an ecological security network based on multi-factor ecological sensitivity (ES) and conduct quantitative spatial analysis. The results demonstrate that the AHP–PCA method based on ML overcomes the limitations of the single-weighting method. The ESPs of Yangxian were established, consisting of 21 main and secondary ecological sources with an area of 592.81 km2 (18.55%), 41 main and secondary ecological corridors with a length of 738.85 km, and 33 ecological nodes. A coupling relationship among three dimensions was observed: comprehensive ecological sensitivity, ESPs, and administrative districts (ADs). Huangjinxia Town (1.43 in C5) and Huayang Town (7.28 in C4) likely have significant areas of ecological vulnerability, while Machang Town and Maoping Town are important in the ESPs. ADs focus on protection and management. The second corridor indicated high-quality construction, necessitating the implementation of strict protection policies in the study area. The innovation lies in the utilization of quantitative analysis methods, such as ML and RS technologies, to construct an ecological spatial pattern planning model and propose a new perspective for the quantitative analysis of ecological space. This study provides a quantitative foundation for urban and rural ecological spatial planning in Yangxian and will help facilitate the sustainable development of ecological planning in the Qinling region.

1. Introduction

With global warming and urbanization, the frequency of extreme natural disasters has increased, posing challenges to regional ecological security [1,2,3]. Issues such as biodiversity reduction [4,5], habitat loss [6], and eutrophication [7,8] have become prominent, thereby hindering balanced development and emphasizing the importance of planning, protecting, and governing regional ecological security patterns (ESPs) [9,10,11]. As a vital ecological barrier in China, the Qinling Mountains region plays a crucial role in protecting the environment and establishing rational ESPs [12,13]. The Qinling Mountains are gene banks of species and serve as an ecological foundation for sustainable development [14]. The health and stability of ecosystems are vital for the ecological balance of a region. To promote the establishment and maintenance of ESPs, the government has implemented regulations for ecological protection in the Qinling Mountains [15]; however, the region has developmental requirements, including infrastructure projects, tourism, and agricultural expansion [16]. Balancing ecological protection with sustainable development is complex.
ESPs are a comprehensive concept aimed at protecting and maintaining regional ecological security through rational planning and the effective management of ecosystems [17]. They have emerged in response to regional environmental challenges. ESPs encompass aspects such as biodiversity conservation [18], ecosystem stability [19], sustainable utilization of natural resources [20], and environmental pollution control [21], with the aim of promoting sustainable socioeconomic development and harmonious coexistence between humans and nature. Recently, significant achievements have been made in constructing ESPs and a typical paradigm has been formed with “source site identification, resistance surface construction, and corridor extraction” as the main research framework. In terms of source site identification, studies have systematically assessed the ecological conditions of research areas using methods such as morphological spatial pattern analysis [22,23], evaluation of the ecological functional importance [24], and evaluation of the ecological suitability, making the identification of ecological source sites more consistent with the regional environmental status. Regarding the construction of resistant surfaces, some studies have explored the benefits of measurements based on ecological security indices or footprints. Currently, the mainstream method for constructing resistance surfaces involves establishing an evaluation system based on the landscape type. The determination of corridors relies primarily on the establishment of ecologically resistant surfaces. Researchers have proposed the circuit theory [25], the minimum cumulative resistance (MCR) model [26], and other methods for ecological network construction, thereby advancing the study of ESPs. Regional ESPs have also been constructed from different perspectives and methods, such as the sustainability of human–environment relationships [27], simulations of land use [28], and urban expansion [29]. However, in reality, there is a significant disconnect between ESPs construction and regional ecological planning, land use, and overall urban–rural planning due to the lack of quantitative research on ecological protection and development construction. This misalignment makes it difficult for ESPs construction to effectively guide spatial optimization and management. Overall, there is a relatively limited amount of relevant research and a lack of established research paradigms, particularly in the Qinba Mountain area of China. Therefore, this study constructs a regional-scale ecological security network using the classic structure of “source site identification, resistance surface construction, and corridor extraction.”
In traditional ecological network analysis, the selection of methods for constructing specific regional ecological networks within a certain spatial range depends on the spatial scale and landscape heterogeneity. Ecological sensitivity (ES) analysis is an effective method for analyzing the differences in ecological environments within a region [30] and provides consistent results in terms of data sources, quality, and research units, thereby enabling a comprehensive evaluation of the importance, connectivity, and sensitivity. Some researchers have already incorporated ES analysis into the “source site identification” and “resistance surface construction” stages, providing scientific decision-making support for regional ecological security [27]. ES analysis can be applied to watersheds [31,32], scenic areas [33], parks [30], and urban–rural areas [34,35,36], and to solve specific ecological issues [37,38]. However, data on disaster prevention and control and socioeconomic aspects are limited. In particular, relevant research on the Qinling Mountains is lacking. Most evaluation models adopt single-weighting methods such as PCA [39], CRITIC [40], AHP [41], and entropy weighting [42]. However, these methods have certain limitations; for instance, PCA and CRITIC require high data quality and variable requirements, AHP lacks objectivity, and the entropy weighting method neglects the interactions between variables. In this study, a combined weighting method that integrates the PCA and AHP methods to calculate weights was utilized. This approach surpasses the single methods by effectively incorporating a range of subjective and objective factors. By considering multiple perspectives and criteria, the combination weighting method enhances the decision-making accuracy and reliability. Additionally, incorporating ML methods can further enhance the accuracy and reliability of weight calculations [42,43]. ML-based weighting can learn from large amounts of data and recognize patterns to automatically adjust weights and parameters, thereby more accurately assessing the impact of different factors on ESPs more accurately. Therefore, this study adopted a tailored approach by selecting multiple ES factors for evaluation, along with the ML methods to optimize the ecological network construction method, making the research more robust.
However, there is a lack of a strong link between ESPs and regional ecological planning, hindering ESPs construction to guide spatial optimization and management [44]. In this regard, remote sensing (RS) and geographic information systems (GISs) technologies play crucial roles as they provide tools for acquiring, analyzing, and visualizing spatial data, helping decision makers to better understand and assess the ecological conditions of a region [45]. Through RS and GISs technologies, a large amount of spatial data can be collected, such as land-use types [34], vegetation coverage [46,47], water-resource distribution [48], and natural disasters [49], to analyze the trends in ecosystem evolution and the degree of ecological vulnerability, thus revealing the correlation between land use and ESPs [50]. Using RS and GISs technology, these data can be integrated, overlaid, and spatially analyzed to form a spatial representation of ESPs. Additionally, RS technology can monitor and evaluate the impact of land-use changes by analyzing the effects of human activities on the ecosystem [51,52]. Furthermore, RS and GISs can help achieve coordination among ESPs, land use, and overall urban–rural planning [53], therefore, facilitating the integration and sharing of different data sources, promoting interdepartmental and interdisciplinary collaboration and coordination, and improving the scientific accuracy of decision-making.
This study employed the MCR model, RS, GISs, and ML methods to develop a multi-factor ecological sensitivity assessment (ESA) system and establish an ESP in Yangxian. The objectives included identifying ecological source areas, constructing a potential ecological network, and quantitatively analyzing the ESPs. Notably, we innovatively and quantitatively analyzed the relationships among regional ESPs, ES, and human living spaces. The outcomes provide valuable theoretical and methodological support for enhancing planning efforts.

2. Materials and Methods
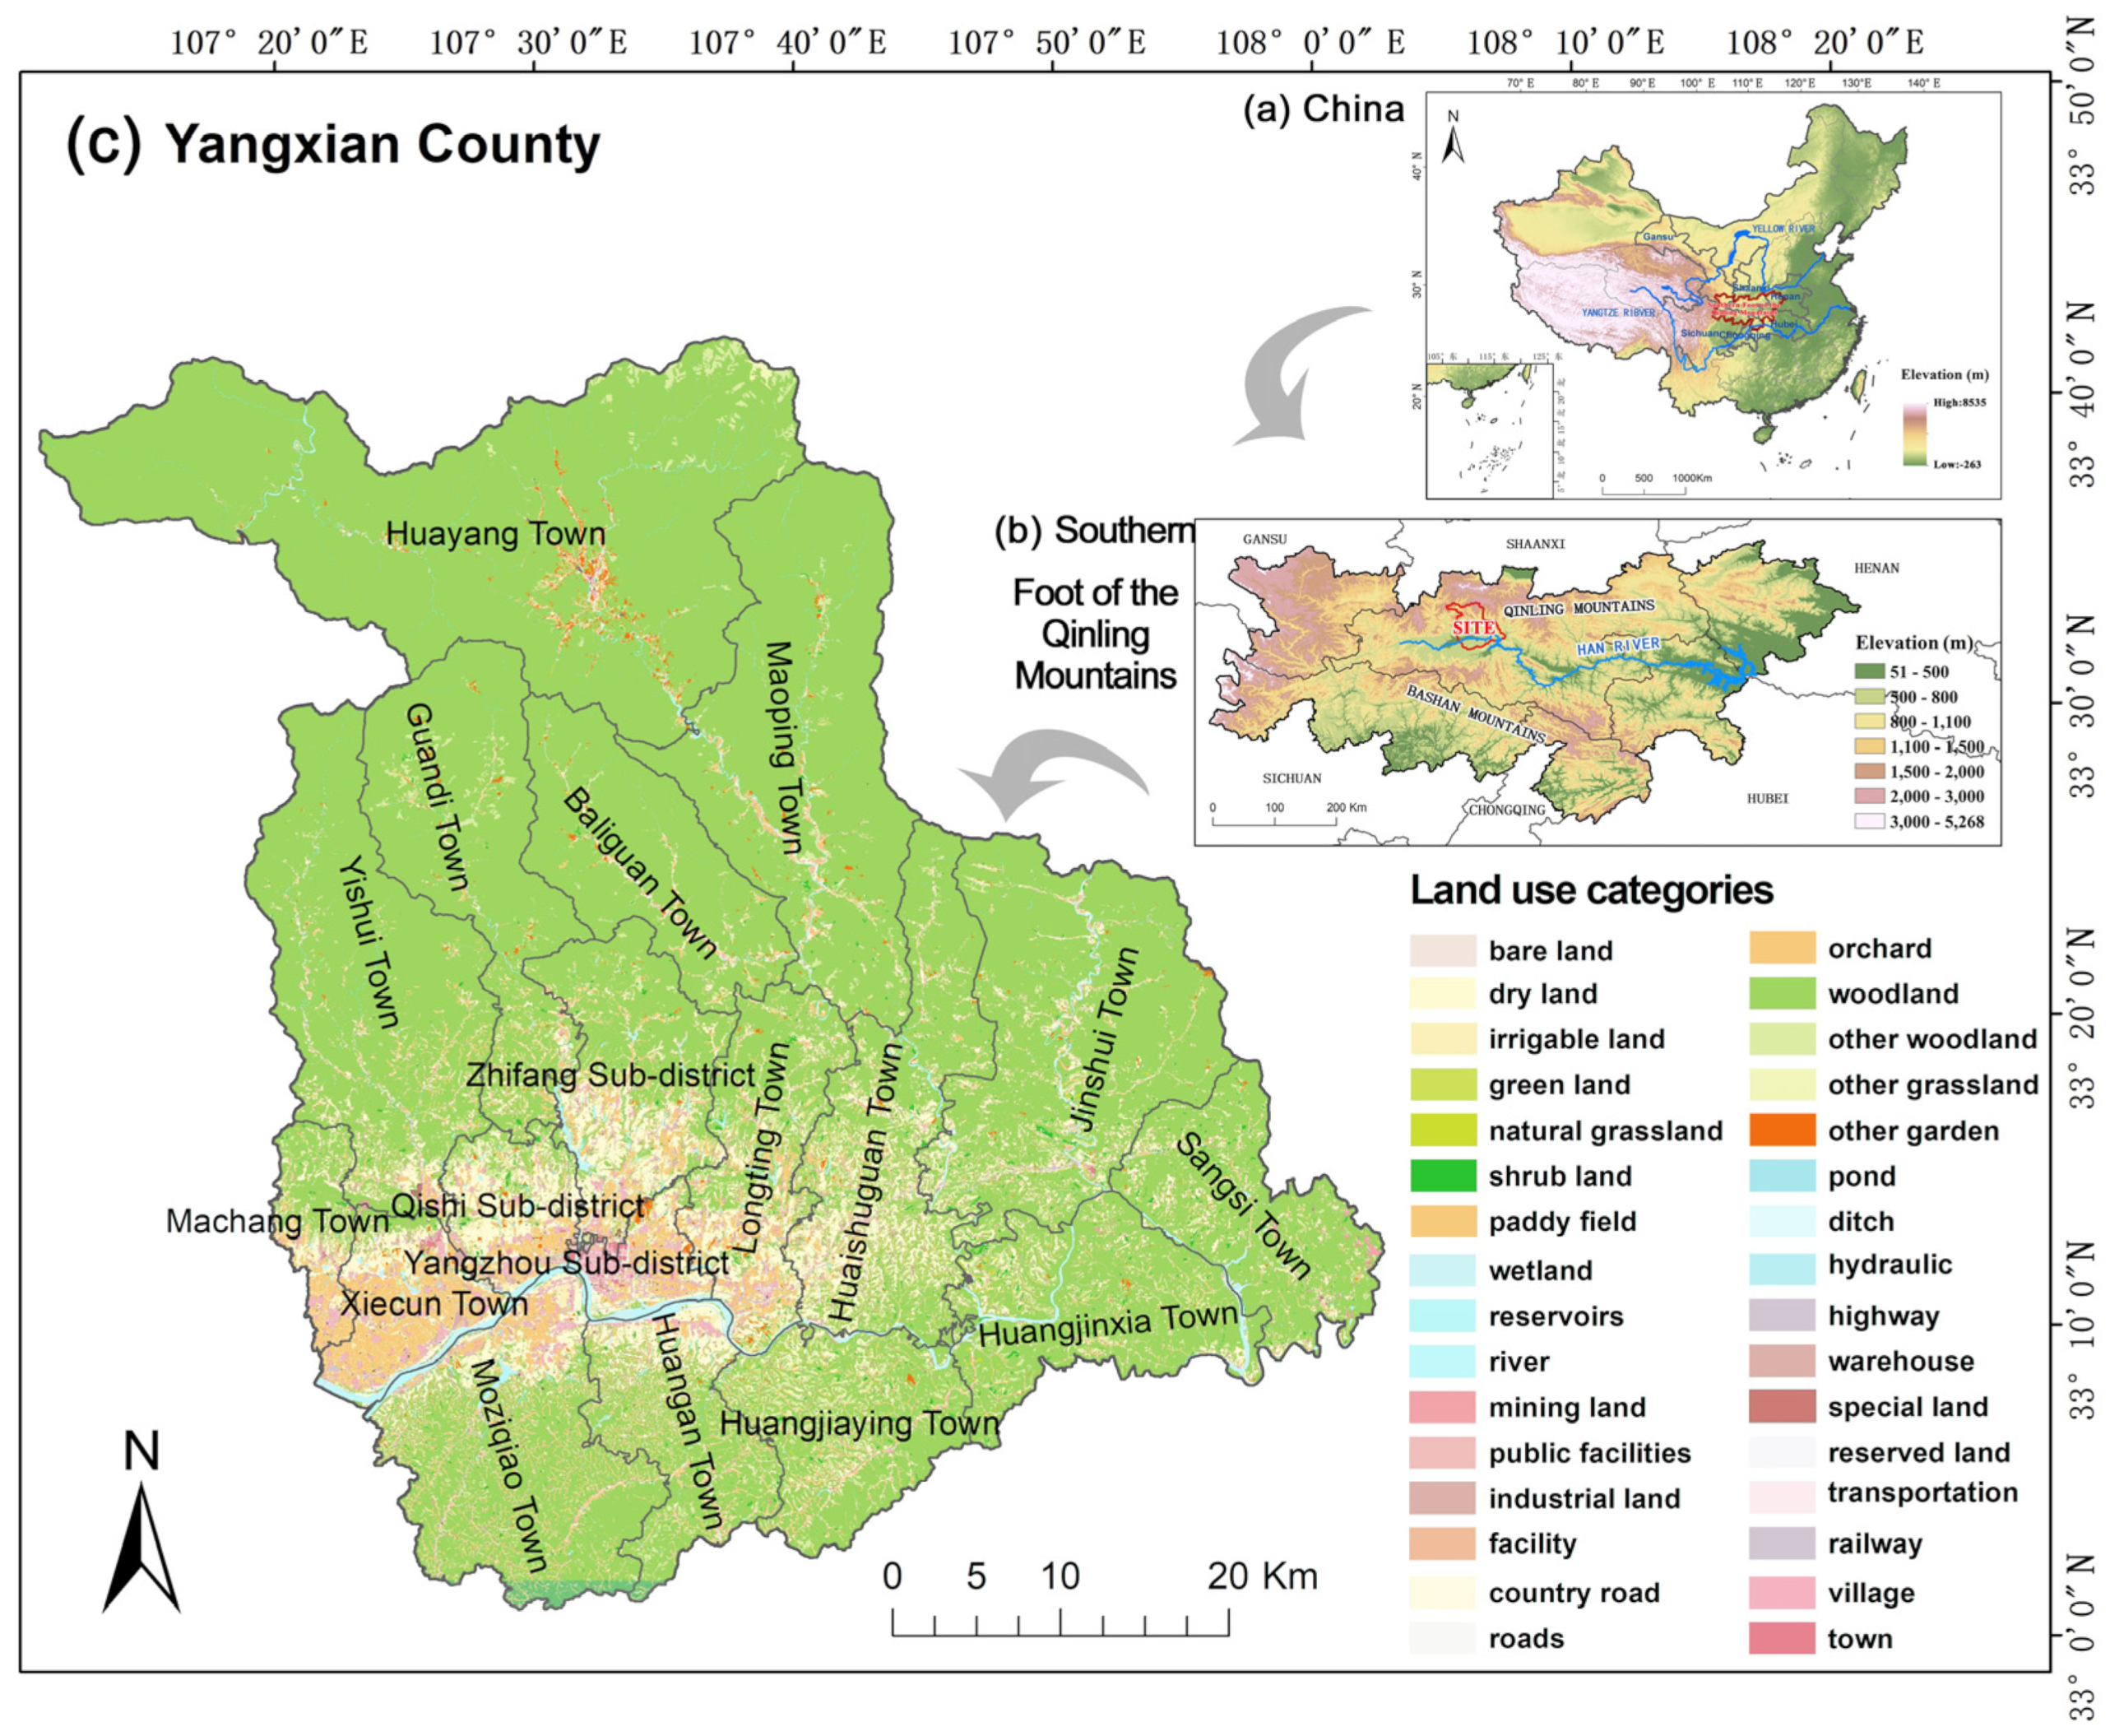
2.1. Study Area

The Qinling Mountains, a natural boundary between northern and southern China, are a crucial ecological barrier that regulates climate and safeguards the environment (Figure 1a). Yangxian, located in southern Shaanxi Province, China, is a major region in the southern foothills of the Qinling Mountains. Bordered by the northern Qinling Mountains and the southern Bashan Mountains, it encompasses a land area of 3195.84 km2 (Figure 1b). With an average altitude of 3071.00 m in the northern Qinling Mountains and a relative elevation difference of 2681.30 m, Yangxian exhibits diverse topography (Figure 1c). The area plays a crucial role in ecological conservation and is part of the highly influential national parks within the Qinling Mountains. Its ecological environment impacts the sustainable development of the environment and local economy, making it a vital region for biodiversity and water conservation.

2.2. Data Sources and Processing

In this study, the digital elevation model (DEM)data used were obtained from the Advanced Land Observing Satellite-1 with a spatial resolution of 30 m (https://search.asf.alaska.edu/#/, accessed on 20 January 2023). The RS images used in this study were acquired from the Landsat 8 OLI satellite data (http://www.gscloud.cn/, accessed on 22 January 2023). Visual interpretation methods were employed to update the land-use data of Yangxian from the 2019 Third National Land Survey Database using RS images. The normalized difference vegetation index (NDVI) data were calculated based on Landsat 5/7/8 RS data from the United States using the Google Earth Engine (GEE) platform and the annual maximum NDVI data for 2021 (http://www.nesdc.org.cn/, accessed on 22 January 2023), with a spatial resolution of 30 m.
The administrative boundary, land use, and ecological redline data used in this study were sourced from the 2019 National Land Survey Database. Basic geographic information data for Yangxian, such as population data, were obtained from the Yangxian Public Security Bureau (retrieved in December 2021). Geological hazards, nature reserves, rivers, tourist attractions, and socioeconomic data were acquired from the Yangxian Natural Resources Bureau (December 2021). After processing, the data could be connected to vector data to establish a fundamental research database.
In ArcGIS 10.8, all spatial data were unified using the GCS WGS 1984 co-ordinate system and converted into a 30 m × 30 m grid format for conducting spatial analysis.

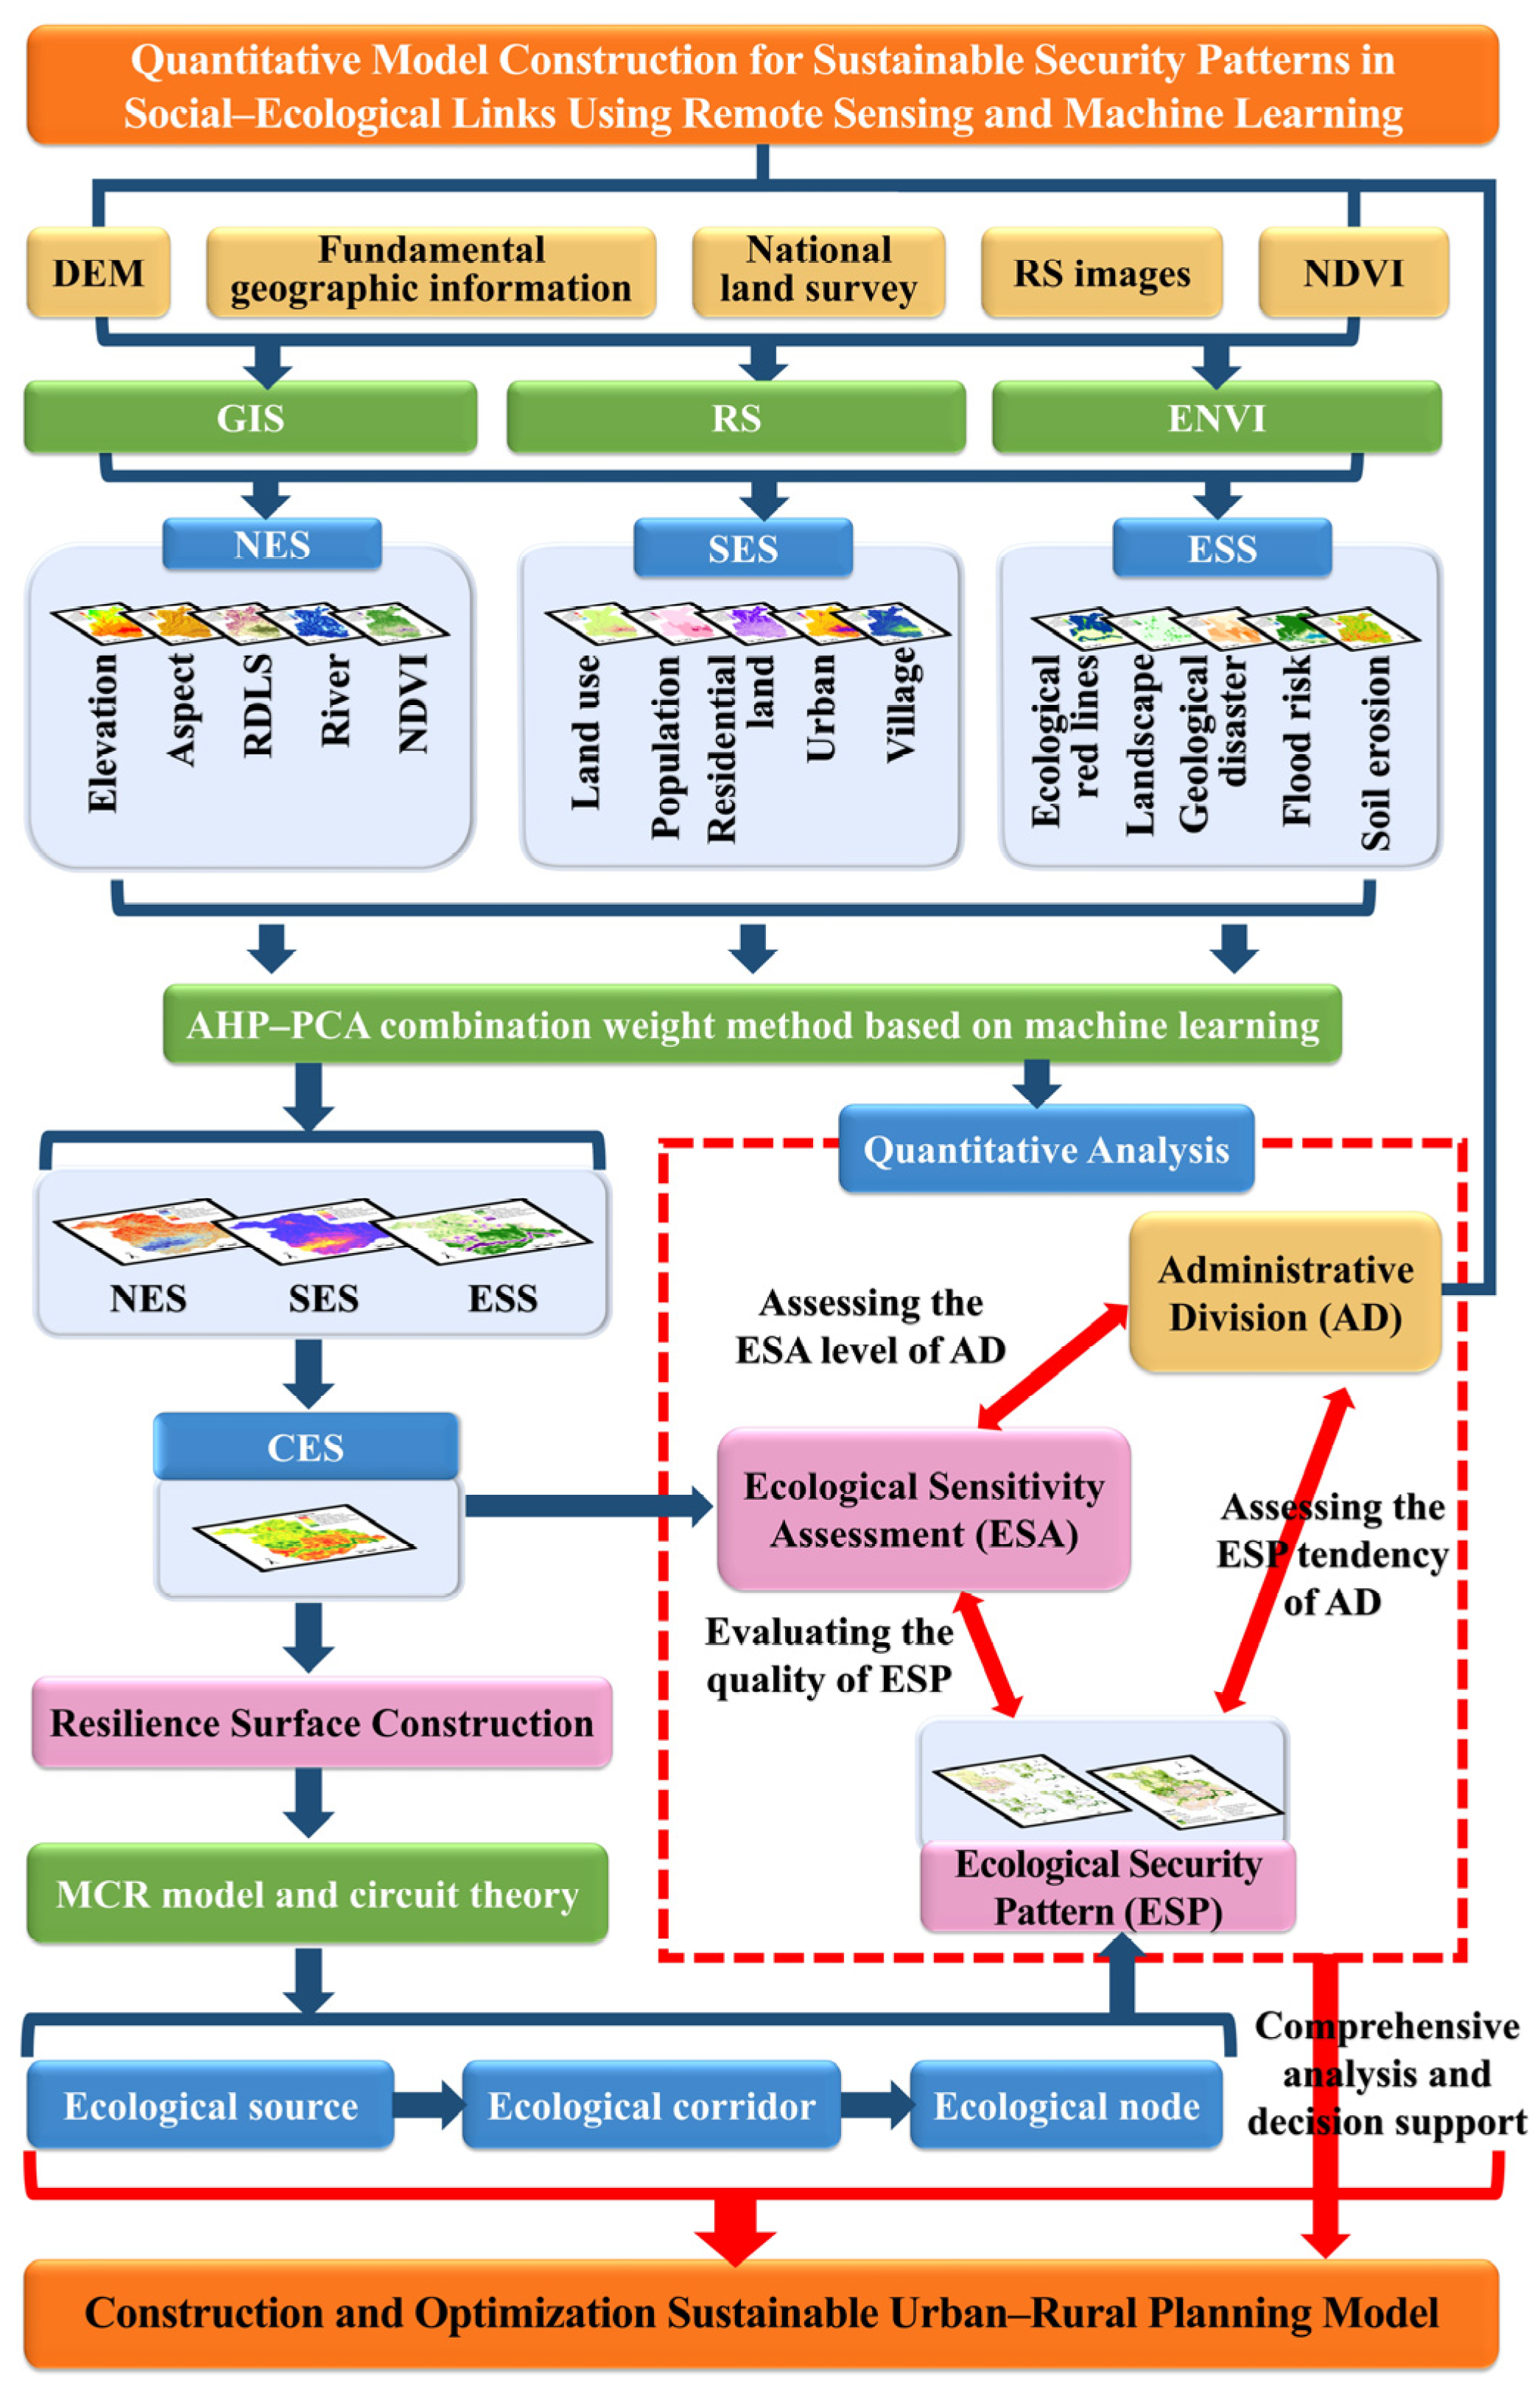
2.3. Research Framework

To construct and quantitatively analyze the ESPs of Yangxian, this study developed the research framework shown in Figure 2. First, the current status of the study area was assessed by processing the RS data, DEM data, and basic geographic information. Second, a comprehensive ecological sensitivity (CES) evaluation system with three indicators was established to determine the regional ecological sensitivity classification and distribution. Third, the MCR model and circuit theory were used to identify ecological sources, establish ecological corridors, and generate ecological nodes, thereby constructing an ESP. Fourth, a quantitative spatial analysis model for the regional ESPs was developed to assist in the spatial planning of Yangxian. In the evaluation system, the ML-based AHP–PCA method was employed to calculate the weights of each factor and enhance the reliability of the evaluation results. The abbreviations of the nouns in this paper are shown in Table A1.

2.4. Research Methods

2.4.1. Resistance Surface Construction Model Based on Sensitivity Evaluation

This study employed the ES to construct the ESPs. The evaluation results of the ES were used as the basis for determining ecological sources. Regions with high ES were designated as ecological source areas; the main and secondary ecological sources were differentiated based on the level of the ES. In this study, the evaluation results for the ES were transformed into ecological resistance surfaces.
(1)
Establishment of ESA Indicators
The formulation of the indicators for evaluating the ES should adhere to principles such as scientific validity, ease of operation, and regional representativeness. Based on the current situation in Yangxian, data availability, heterogeneity of the natural environment in the region, and previous literature [13,14,15,46,54,55,56], expert suggestions were also considered. Fifteen factors and three indicator categories were selected for the evaluation. The indicators and their calculation methods established in this study, including the natural environment sensitivity (NES), socioeconomic sensitivity (SES), and ecological security sensitivity (ESS), are listed in Table 1.
Table 1. Established indicators for ESAs.
TypeIndicatorResearch Method
NESElevationDEM data
AspectSurface analysis from DEM data
RDLS
R = H m a x H m i n

where R represents relief degree of land surface (RDLS),
Hmax is the maximum elevation value within the area,
and Hmin is the minimum elevation value within the area
RiverEuclidean distance from water source
NDVI
N D V I = N I R R N I R + R

where NIR and R represent the reflectance values at
near-infrared and red bands, respectively [57]
SESLand useLand-use data of Yangxian from the 2019 Third National Land Survey Database
Population
D = P S

where D denotes population density,
P is the population quantity in the study area,
and S is the study area’s size [58]
Residential landEuclidean distance from residential areas
Urban construction
U = S l o p e , E l e v a t i o n , R e l i e f

where U represents the modified slope data,
and ∫([Elevation], [Slope]) represents the function that relates the elevation, relief
and slope values to the modified slope data [59,60]
Village construction
V = S l o p e ,   E l e v a t i o n

where V represents the modified slope data,
and the function ∫([Elevation], [Slope]) represents the relationship between
elevation and slope that determines the modified slope values [59,60]
ESSEcological redlinesEuclidean distance from ecological redlines
Landscape resourcesEuclidean distance from landscape resources
Geological disaster
G = N S

where G represents the density of disaster points,
N represents the total number of disaster points,
and S represents the total area of the study region [61]
Soil erosion
S o i l   e r o s i o n   i n t e n s i t y = W 1 * F 1 i + W 2 * F 2 i + W 3 * F 3 i + W 4 * F 4 i + W 5 * F 5 i

Where, W1, W2, W3, W4, and W5 are the corresponding weight of indicators
F1, F2, F3, F4, and F5 are the indicators, namely Slope, Profile curvature, and Surface roughness, and Euclidean distance of valley network
i represents the index of each indicator value [62]
Flood riskInundation analysis [63]
The NES in Yangxian was assessed using indicators such as elevation, slope direction, relief, water sources, and NDVI. These factors are vital for understanding the region’s natural environment, including its diverse terrain and abundant water sources, as well as t their impacts on vegetation growth and ecological risks, such as soil erosion and geological hazards. SES considers land use, population, settlements, urban development, and agriculture. Yangxian’s rapid urbanization has led to conflicts between human habitation and the environment. SES analysis examines population dynamics, urban–rural development, land-use types, and their impact on the ecological environment. ESS indicators included ecological redlines, scenic spots, disaster density, soil erosion intensity, and submergence analysis. Yangxian has significant ecological redline areas, national parks, and protection centers. This region is prone to geological hazards, soil erosion, and flooding, which affect its ecological security. Assessing the ESS helps to identify areas of concern for conservation and management.
(2)
Sensitivity Level Classification and Scoring
Following the sensitivity classification criteria stated in the “Interim Regulations for Ecological Function Zoning” issued by the State Environmental Protection Administration and considering the characteristics of each sensitivity evaluation factor in the study area, sensitivity was categorized into the following types; insensitive, lightly sensitive, moderately sensitive, highly sensitive, and extremely sensitive and assigned values of 1, 3, 5, 7, and 9, respectively, with assigned. Sensitivity values were numerically standardized from low to high. A higher evaluation level indicates a higher ecological environmental value of the area and greater susceptibility to the impacts of development activities; therefore, more focused, protective measures are required. Regions classified as insensitive or lightly sensitive can tolerate stronger human disturbances and are suitable for certain levels of development and construction (Table 2).
Fifteen factors and three indicators were ranked using the natural breakpoint method, and the reclassification tool in ArcGIS was used to assign the values. Additionally, for factors such as elevation and relief with large data ranges, manual classification was utilized to reduce errors. The conditions for urban and rural residential construction were classified using the natural breakpoint method with five levels corresponding to extremely suitable (ES), highly suitable (HS), moderately suitable (MS), barely suitable (BS), and unsuitable (US) areas.
(3)
Construction of a resistance surface based on sensitivity evaluation
The construction of ecological resistance surfaces was based on the definition provided by Keeley et al. [64], which states that the more sensitive an ecosystem is to natural or anthropogenic disturbances, the higher the likelihood of ecological environmental problems and potential imbalances. The resistance to the flow or transmission of ecological processes and functions through the spatial extent of an ecosystem is stronger. Therefore, in this study, a CES evaluation was conducted using the NES, SES, and ESS indicators based on a typical county in the southern foothills of the Qinling Mountains. Based on the results of the CES evaluation, resistance coefficients were assigned to each grid (Table 3) with values ranging from 1 to 5, which enabled the generation of an ecologically resistant surface.

2.4.2. Determining Weights Using ML and AHP–PCA Methods

The weights were calculated using PCA based on ML; PCA is a multivariate statistical method that uses the concept of “dimensionality reduction” to transform multiple indicators into a few comprehensive indicators, called principal components, typically expressed as linear combinations of original variables.
We calculated the covariance matrix R as follows:
R = ( r i j ) n × n = r 11 r 1 n r n 1 r n n
where the eigenvalues λ1λ2 ≥ … ≥ λn ≥ 0 and their corresponding eigenvectors u1, u2, …, un, were calculated, where uj = (u1j, u2j, …, unj), and unj represents the nth component of the jth eigenvector. We constructed a new indicator variable using the eigenvectors:
y 1 = u 11 x ¯ 1 + u 21 x ¯ 2 + + u n 1 x ¯ n y 2 = u 12 x ¯ 1 + u 22 x ¯ 2 + + u n 2 x ¯ n y n = u 1 w x ¯ 1 + u 2 n x ¯ 2 + + u n n x ¯ n
where y1 represents the first principal component, y2 represents the second principal component, and..., yn represents the nth principal component. The contribution rate, bj, for each principal component, yj (j = 1, 2, …, n), and the cumulative contribution rate, ap, for y1, y2, …, yn (pn) were calculated:
b j = λ j k = 1 n λ k ( j = 1 , 2 , , n )
α p = k = 1 p λ k k = 1 n λ k ( p n )
The weights were calculated using AHP based on ML. Fifteen domain experts, well-versed in the local conditions, were consulted to assess the relative importance of pairwise indicators on a scale of 1 to 9. This information was used to construct a comparison matrix. The weights for each factor were then calculated using Yaahp V10.0.0 and ML techniques.
Comprehensive weights were calculated based on ML, AHP, and PCA. The weights obtained from the AHP calculation for the criterion layer were considered the final criterion layer weights, whereas the weights for the indicator layer was calculated using a combination of the ML, AHP, and PCA methods as follows:
W * j = W A H P j W P C A j j = 1 m W A H P j W P C A j
where Wj* represents the comprehensive weight of the jth indicator toward the objective, WAHPj represents the weight of the jth indicator toward the objective obtained using the AHP method, and WPCAj represents the weight of the jth indicator toward the objective obtained using the PCA method.

2.4.3. Constructing ESPs Using the MCR Model

The extraction of ecological corridors between ecological source areas was conducted based on the MCR model; the construction of the ecological resistance surfaces is listed in Table 3. The resistance surfaces of various factors were overlaid and analyzed using ArcGIS to obtain the final comprehensive resistance surface for the study area. The MCR model is expressed as follows:
M C R = f min i = n t n ( D i j × R i )
where MCR denotes the minimum cumulative resistance. D represents the spatial distance from the source grid j to the landscape unit 1 grid for a species. Ri represents the resistance coefficient of the landscape unit i grid to the movement of certain species, and f represents the positive correlation between the minimum cumulative resistance and ecological processes.

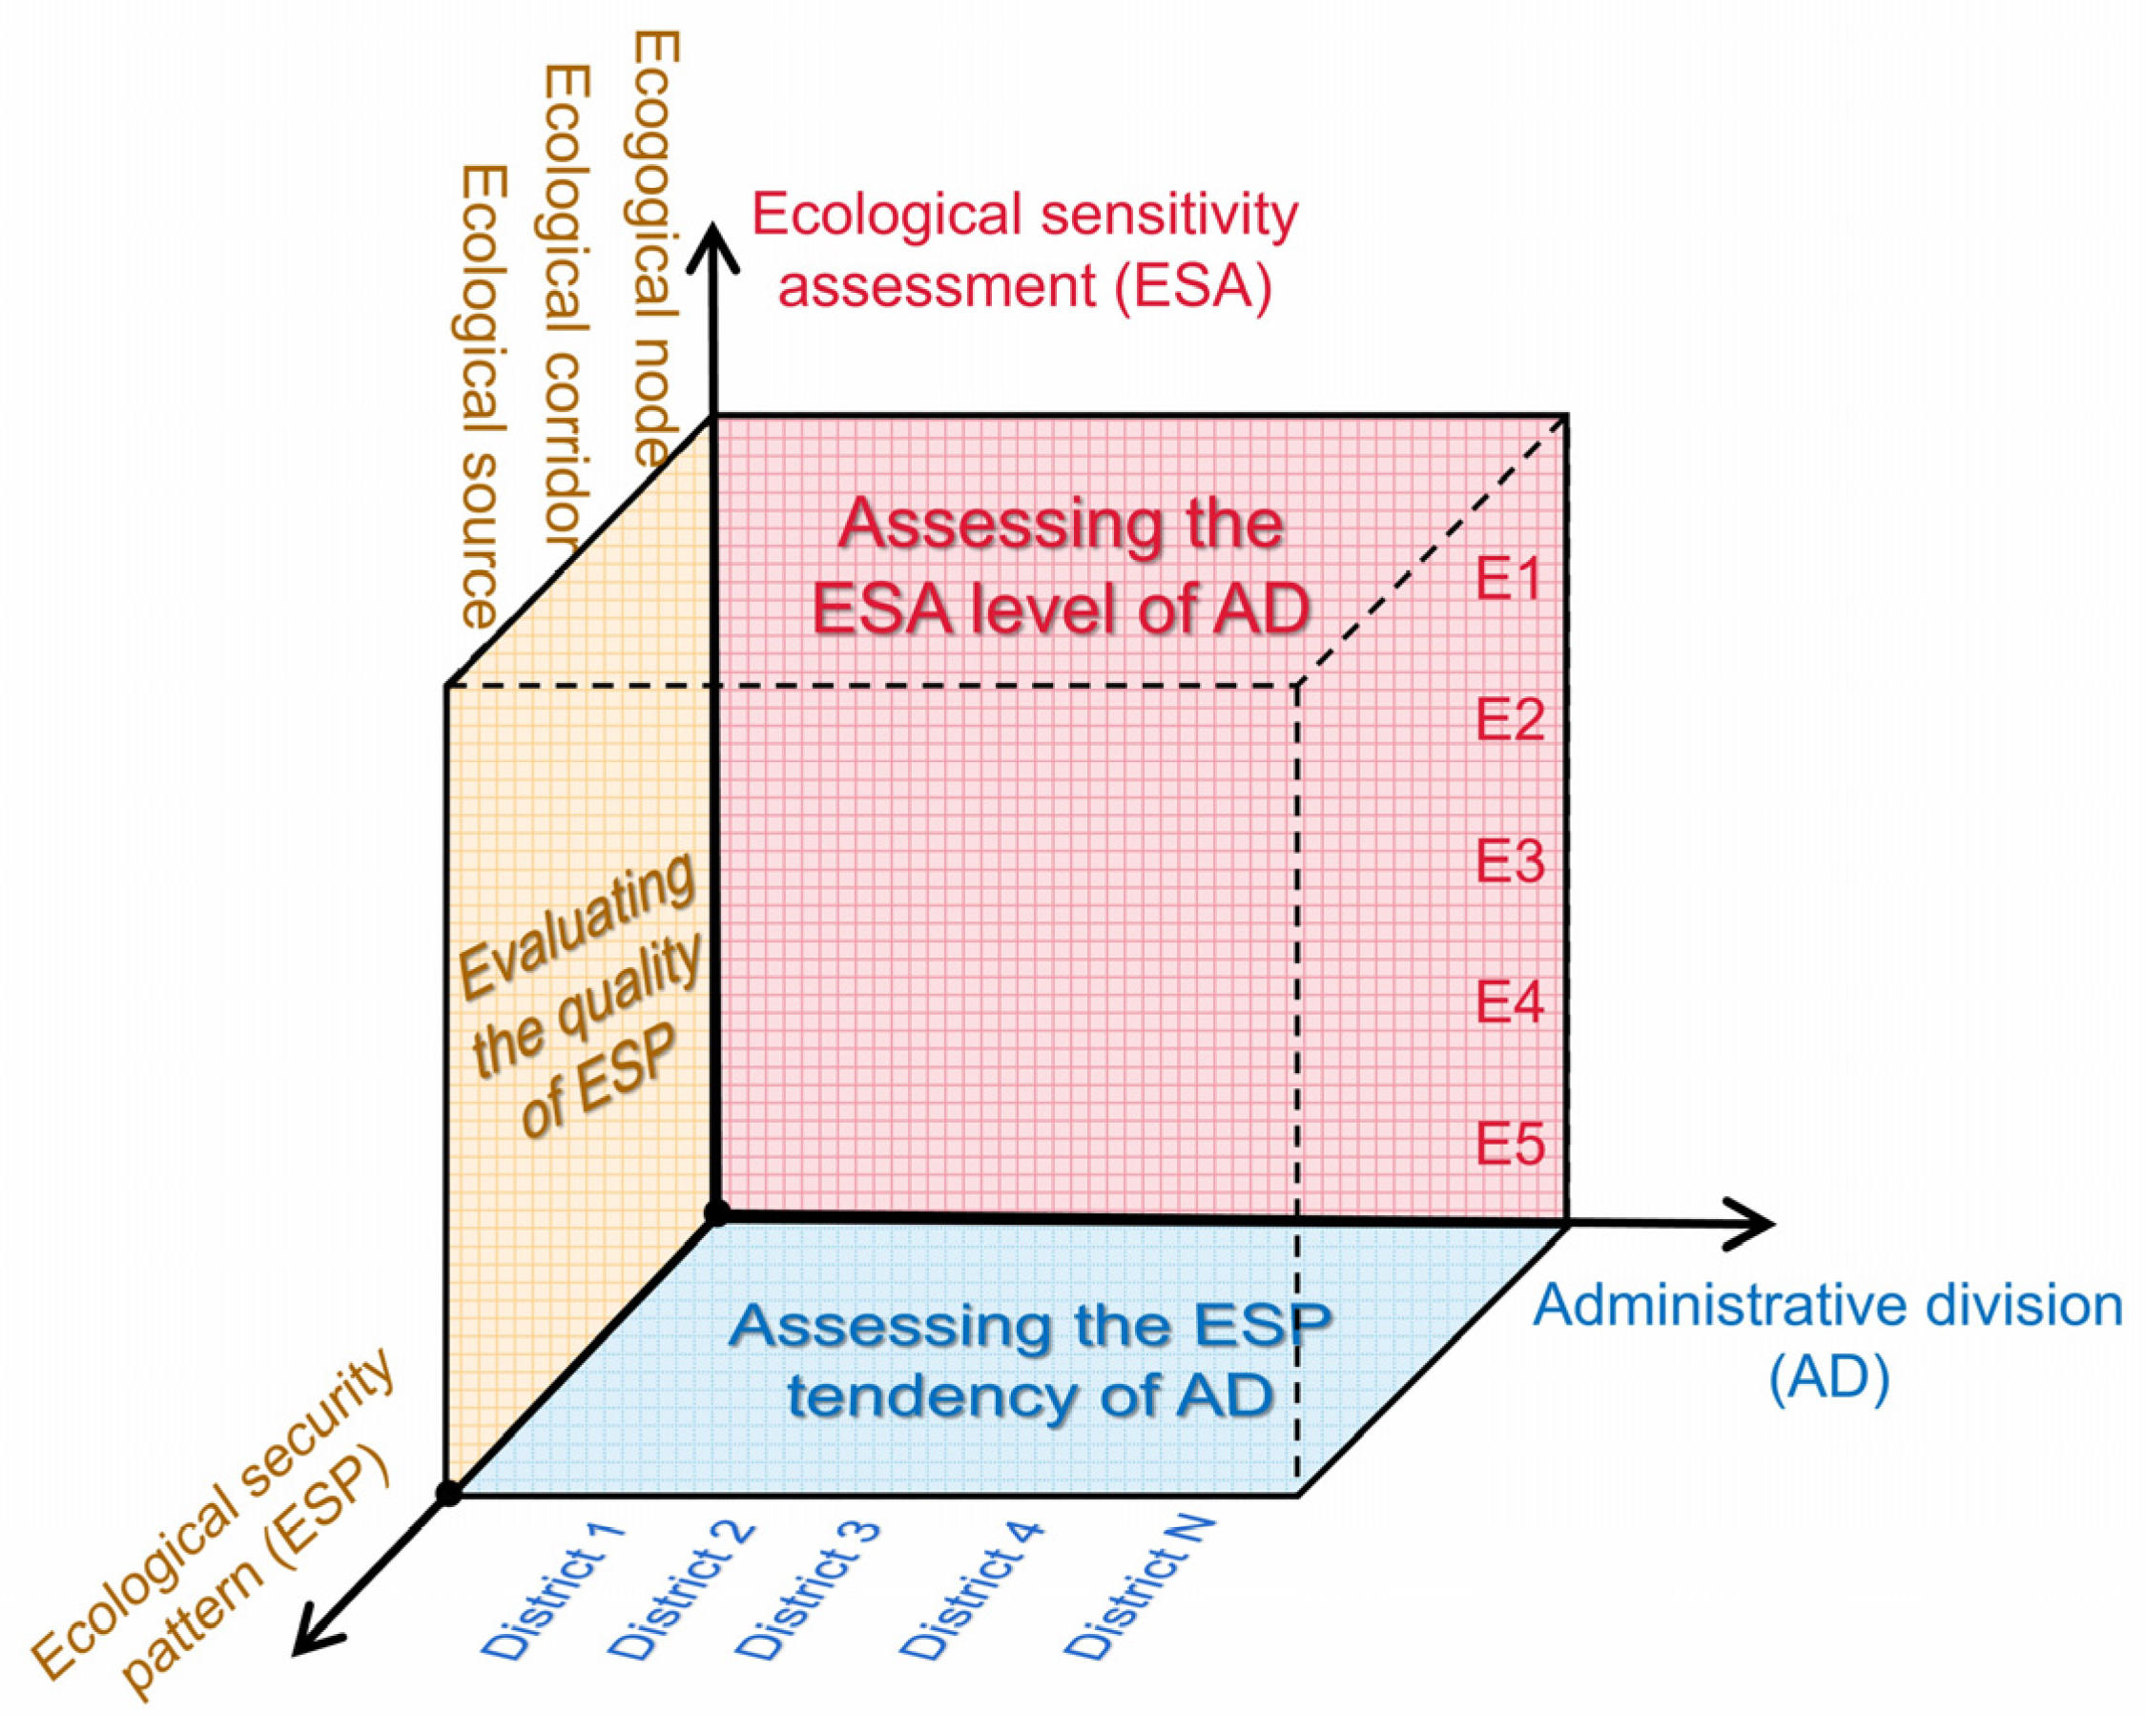
2.4.4. Integrated Urban–Rural Planning Model Based on ESA and ESP

Herein, we utilized the ESA to construct the ESPs of Yangxian and quantitatively analyzed the ESPs of Yangxian from three dimensions, namely, ESAs, ESPs, and administrative districts (ADs), to provide guidance for integrated urban–rural planning (Figure 3).

3. Results and Analysis

3.1. Weight Determination Using the Combined AHP–PCA Method Based on ML

Based on ML, the calculation results for each indicator were obtained by substituting the single-factor calculation results into Equations (8)–(12), as listed in Table 4, where WAHP represents the weights of the indicators calculated using the AHP method, WPCA represents the weights calculated using the PCA method, and W* represents the weights calculated using the combined AHP–PCA weighting method. The “final weight” column indicates the final weight of each factor. A higher weight value indicates a higher importance of the corresponding indicator within its indicator layer.
The weights of river (0.0260) and land use (0.0655) were relatively low in the WPCA calculation results. However, considering the significance of water resources in the natural environment and the importance of land use in urban and rural planning, the weights were subjectively adjusted using the AHP method. Therefore, in the W* calculation results, the weights of river (0.0750) and land use (0.1802) increased compared to the WPCA calculation. This adjustment better aligns with the current natural environment in Yangxian.
Urban and rural construction has relatively high weights in the WPCA and WAHP. In the socioeconomic environment, the conditions of urban and rural construction influence the distribution of residential areas, guide the rational layout and development direction of urban and rural construction, and significantly affect the ecological environmental pattern of Yangxian.
Among the final indicator calculation results, the “ecological redline” indicator had the highest value (0.1624). Yangxian encompasses ecological redline areas, such as the Zhuhuhuan Nature Reserve, the Changqing Nature Reserve, and Qinling National Park; the indicator value aligns with the current situation in Yangxian. This demonstrates that the adjusted weights from the AHP–PCA method, which integrates subjective and objective advantages, showed that the adjusted weights were more reliable.
The calculated weights determined the relative importance of each indicator for assessing the ES. This study utilized the PCA method for objective weight calculation, but, in some cases, adjustments were made using the AHP method. The research findings indicate that the modified weight values obtained using the AHP–PCA method were significantly more scientifically reasonable. These findings are crucial for developing protection and development strategies and guiding urban–rural co-ordination planning in Yangxian.

3.2. ESA

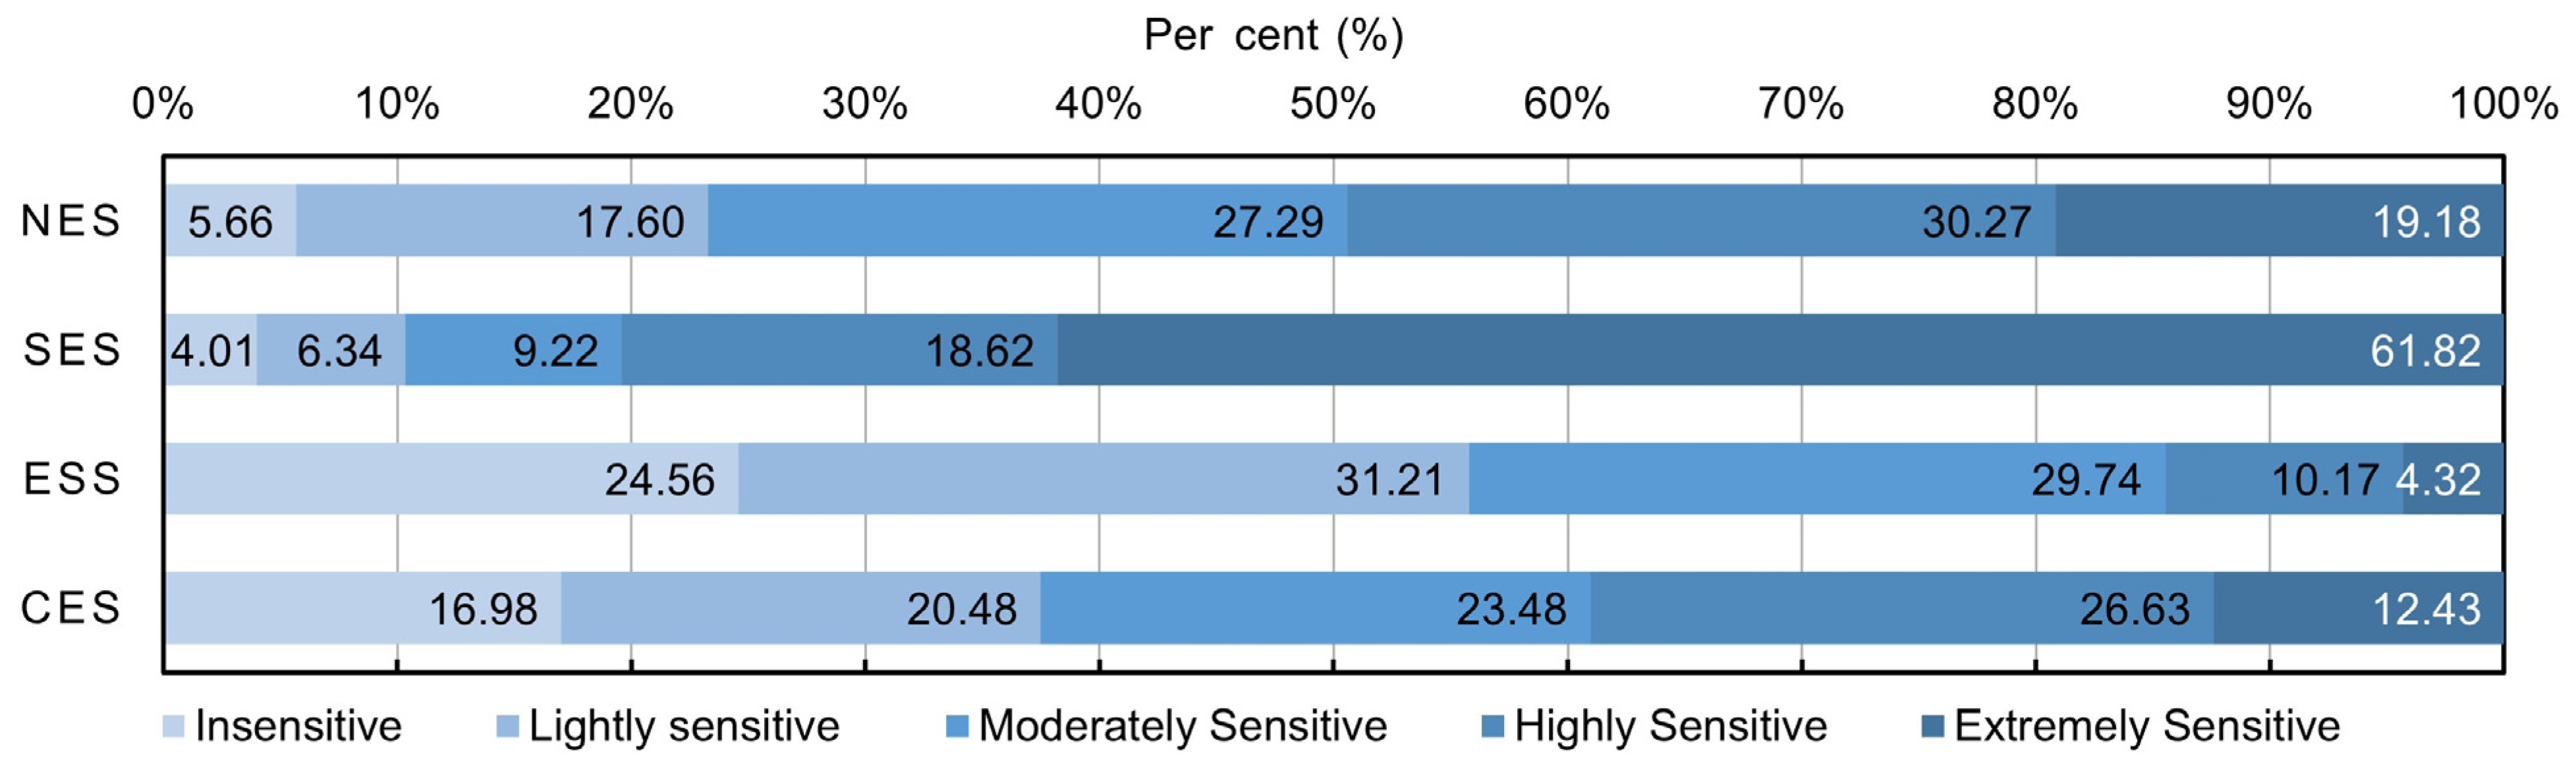
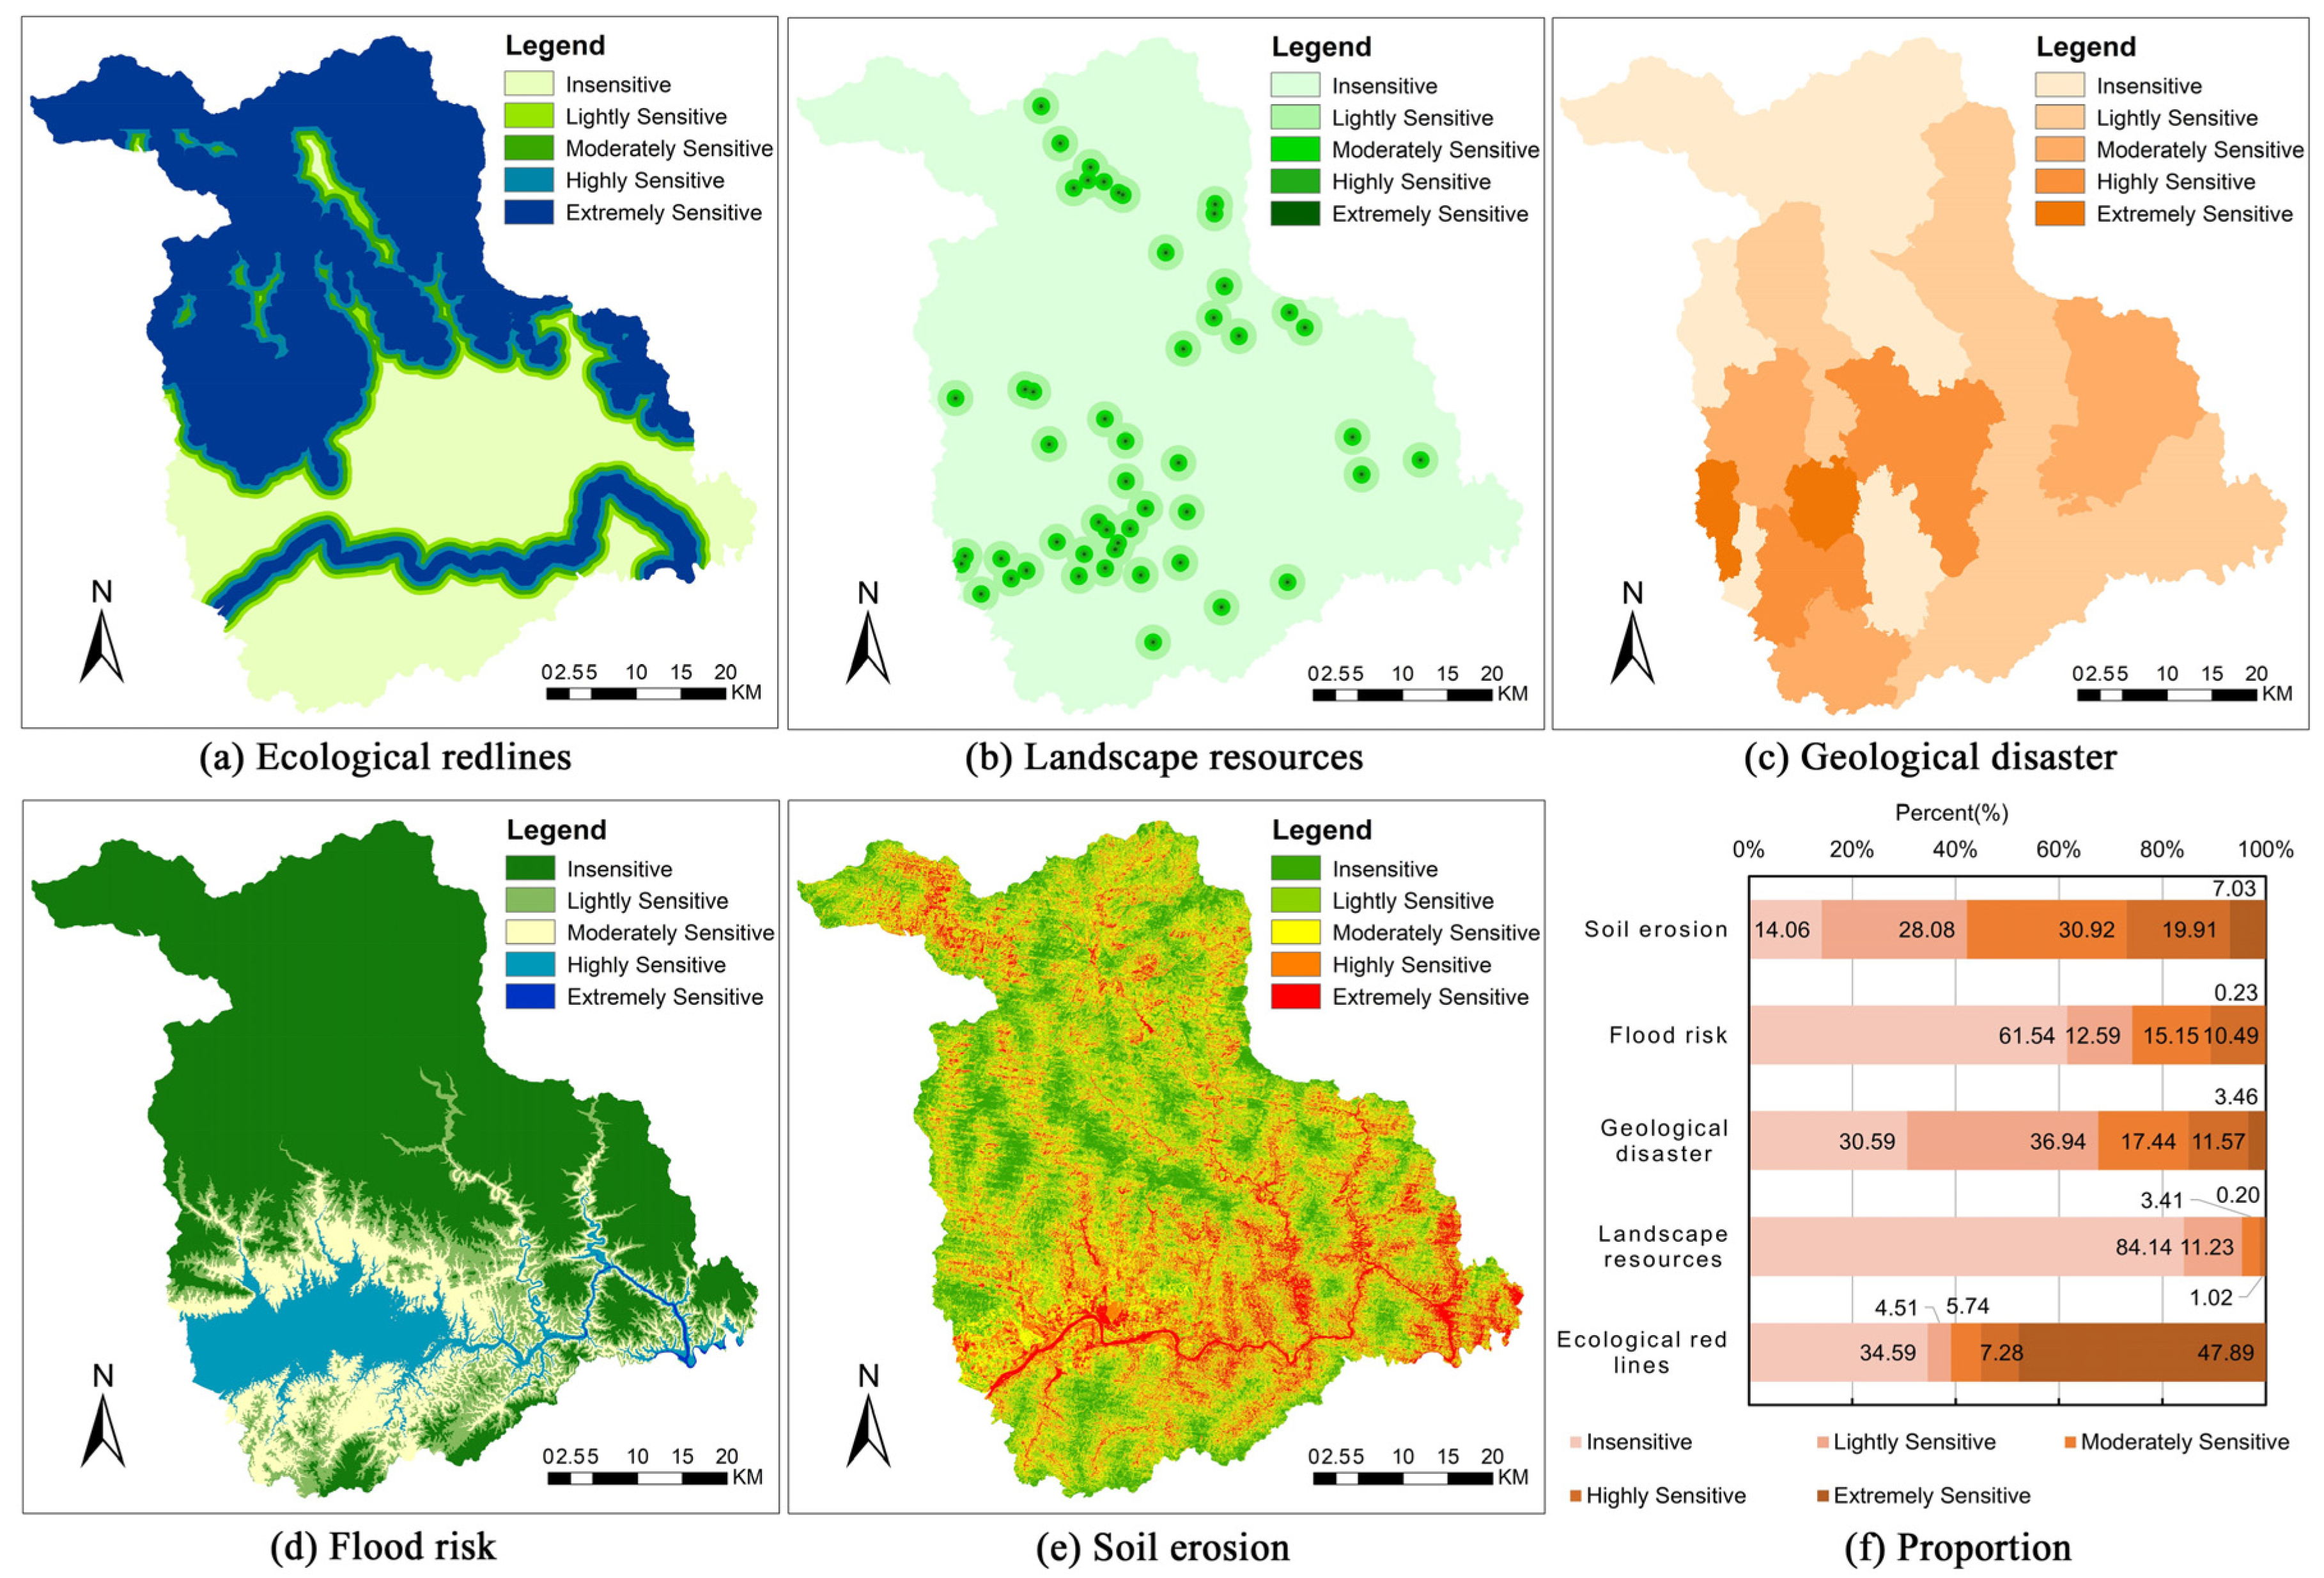
3.2.1. Single-Factor for ESA

Figure 4 depicts the spatial distribution of the NES evaluation factors. The northern region showed high sensitivity, whereas the southern region exhibited low sensitivity. The upstream area of the Han River Basin showed a lower sensitivity than the downstream area. Among these factors, rivers had the highest sensitivity, whereas elevation had the lowest. This highlights the critical role of rivers as water sources and ecological corridors that affect water quality, quantity, and ecosystem health. Rivers are vital components of Yangxian’s ecological system and are highly responsive to environmental changes in the surrounding areas.
Figure 5 illustrates the spatial distribution of SES evaluation factors. The upstream area of the Han River Basin in the southern region exhibited low sensitivity. Among these factors, urban construction had the highest sensitivity, whereas rural construction had the lowest. The high sensitivity of urban construction emphasizes the significant impacts of human activities on the ecosystem during urban development, including environmental degradation, resource consumption, and pollution. This highlights the importance of prioritizing ecological conservation and sustainable development in urban planning. The low sensitivity of rural construction indicates a relatively small impact on the ecosystem during rural development, suggesting a better balance in the ecosystem in the rural areas of Yangxian.
Figure 6 illustrates the distribution of the ESS evaluation factors, providing insights into water and soil conservation, microclimate regulation, and biodiversity promotion. The southern part of Yangxian, particularly the Han River Basin, exhibited high sensitivity. Among these regions, the ecological redline factor showed the highest sensitivity, emphasizing the need for special protection and attention to maintain ecosystem stability. The scenic source exhibited the lowest sensitivity, suggesting that its variation had a relatively small impact on ecosystem stability and functioning. This factor may be related to aesthetic value and landscape diversity.
Although some evaluation factors may have lower sensitivity, they remain important for the entire ecosystem. When formulating ecological conservation strategies, it is necessary to comprehensively consider multiple factors, such as the overall impact of ecological redline factors and the potential influence of human activities. Comprehensive assessment and integrated management can provide more comprehensive protection of ecosystems.

3.2.2. Comprehensive ESA

By conducting a weighted overlay analysis based on single-factor evaluation, the spatial distribution characteristics of the ES were obtained (Figure 7 and Figure 8). Sensitivity was categorized using the natural breaks method. To gain a deeper understanding of the regional distribution patterns of sensitive areas, regional statistics were conducted on the sensitivity outcomes (Figure 9).
The sensitivities of the NES and SES gradually increased from the upstream region of the Han River in the southwestern part of Yangxian towards the periphery. This indicates that the ecosystems in the southwestern part of Yangxian, particularly in the upstream area of the Han River, are more susceptible to disturbances from the influencing factors. Areas such as Xie Village, Yangzhou Street, and Qi Shi Street, located at the intersection of the Han River Basin and the central urban area, have fragile ecosystems.
The sensitivities of the ESS and CES were higher in the northern region and lower in the southern region, with some localized high sensitivities in the southern Han River Basin area. Sharp increases in the ES in the northern region were observed in Yishui, Zhifang, Baliguan, Machang, Huaishuguan, and Jinshui. The main influencing factor in these areas is the ecological redline factor. These areas have higher elevations and significant terrain fluctuations and are home to the Zhuhan and Changqing National Nature Reserves, indicating rich species diversity. This suggests that the ecosystems in the northern region of Yangxian are more sensitive to environmental disturbances than those in the southern region. However, there are some localized areas in the southern region, such as the Han River Basin, where ecological systems exhibit higher sensitivity and stronger resilience to environmental disturbances.
The highest proportion was found in the categories of high sensitivity and extreme sensitivity (80.44%), indicating high overall sensitivity. This suggests that many areas in Yangxian have relatively low levels of socioeconomic development, yet good protection of the natural environment. This implies a significant potential for economic development in many regions of Yangxian, while simultaneously ensuring the protection of the ecological environment and achieving sustainable development. Regarding the ESS, the proportion of the high-sensitivity and extreme-sensitivity categories (14.49%) was the lowest, indicating that the ecological systems in Yangxian were less influenced by natural disasters. This suggests that the ecological environment in Yangxian is relatively stable and less susceptible to disturbances caused by human activity.
By comparing the sensitivity levels of the factors, subdistricts, and townships, Guandi, Yishui, Huayang, Maoping, and Huangjinxia exhibited a relatively high ES across various indicators. These areas are located in the southern foothills of the Qinling Mountains and characterized by robust ecosystems and high resilience to environmental disturbances; therefore, it is important to prioritize ecological conservation in their development to ensure sustainable socioeconomic growth. In contrast, Xiecun Town, Longting Town, Machang Town, and Yangzhou Street, on the other hand, demonstrated lower overall ES across different indicators; most of these areas are situated on the plains and are suitable for urban construction and other economic activities. However, it is necessary to maintain environmental awareness during development and implement appropriate environmental protection measures. Jinshui and Sangxi exhibited moderate levels for the ES. These two areas are primarily located in hilly regions and have the potential to develop ecological tourism. Balancing economic development and conservation is crucial for sustainable growth.

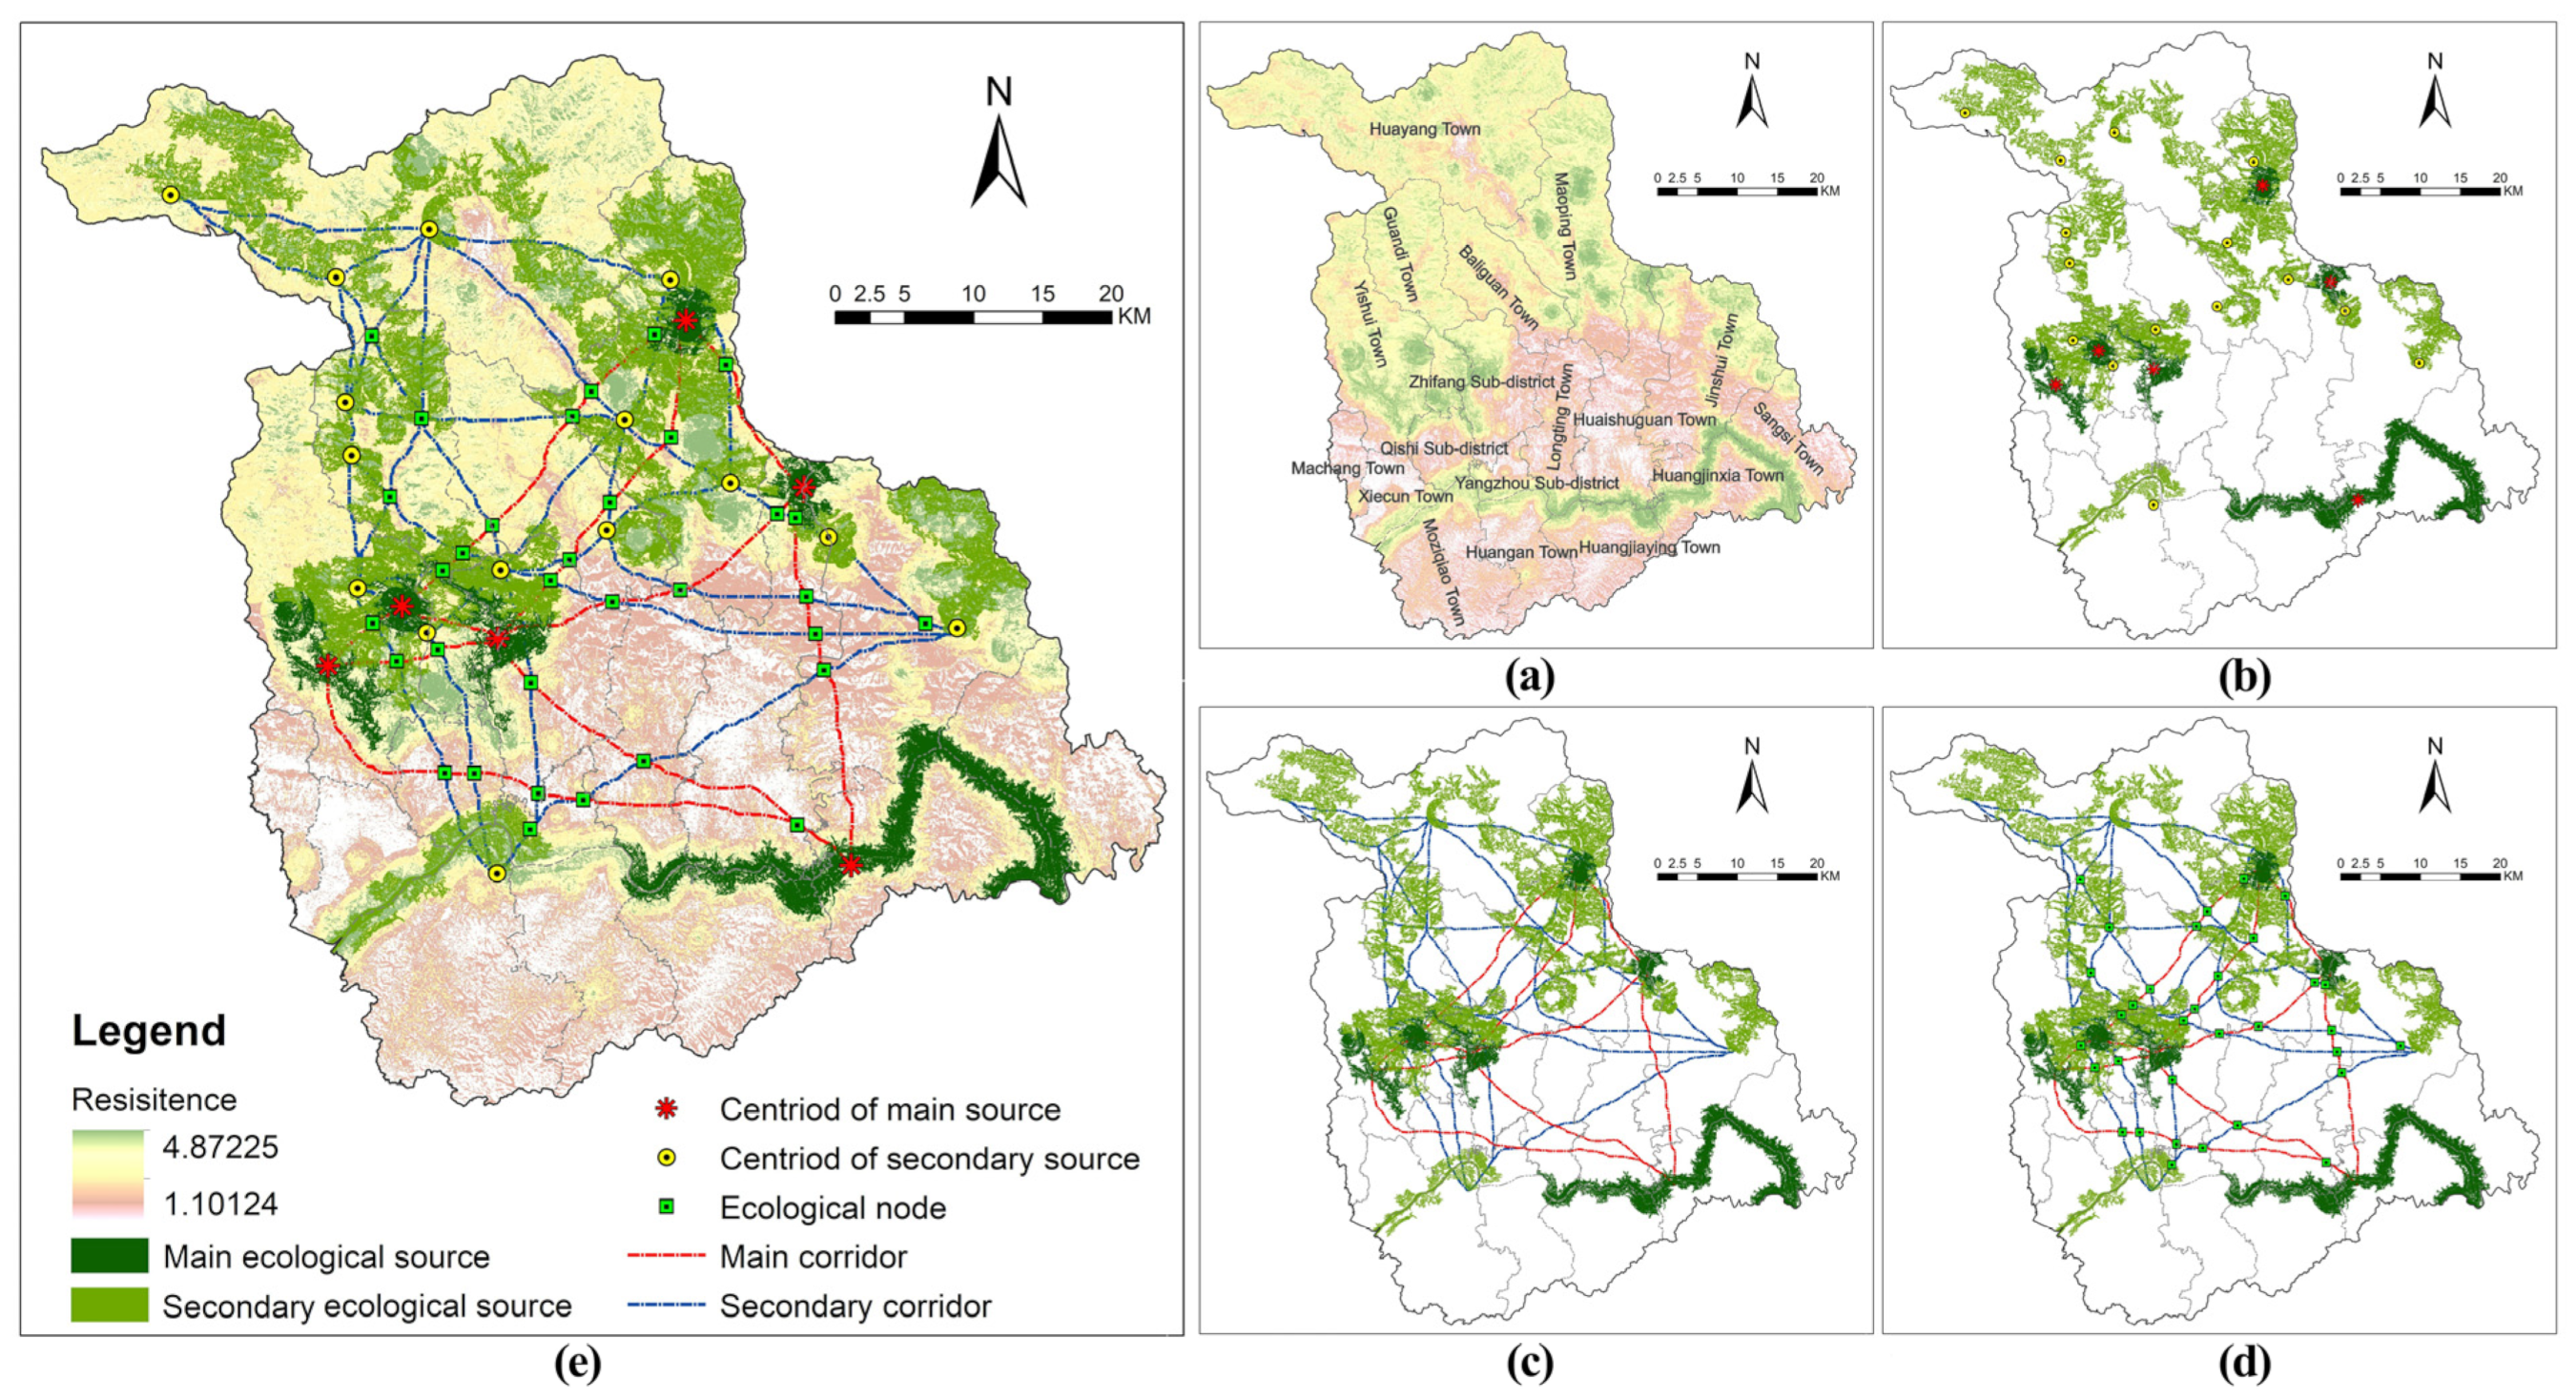
3.3. Constructing an Ecological Network Based on the MCR model

3.3.1. Ecological Sources Identification

Ecological sources refer to ecologically favorable areas with high habitat quality that serve as the foundation for future ecological corridor construction. Therefore, it is necessary to select areas with extremely high sensitivity as ecological sources based on the ESA results. In this study, patches with an area smaller than 10 km2 were excluded, and two categories of ecological sources were established (as shown in Figure 5b). The main ecological sources consisted of six patches from the extreme high-sensitivity area, covering an area of 172.89 km2, accounting for approximately 5.41% of the total area of Yangxian. The secondary ecological source included 15 patches from the high-sensitivity area, covering an area of 419.92 km2, accounting for approximately 13.13% of the total area of Yangxian.
The identification of ecological sources based on sensitivity assessment considers the interaction between the natural ecological environment and human–land relationships, which is more in line with the requirements of high-quality sustainable development in the context of urbanization. It also considers both the current state of the natural ecological environment and mutual interactions between humans and the environment.

3.3.2. Ecological Corridor Identification

In this study, an MCR model was employed, utilizing a comprehensive resistance surface, to create ecological corridors connecting the identified ecological sources. By integrating the results of the ESA for the 21 ecological sources and the constructed comprehensive resistance surface (Figure 10a,b), ecological corridors were established using the cost–distance tool in ArcGIS.
To distinguish the importance of the ecological corridors, they were categorized into two types: main corridors that connected the main ecological sources, and secondary corridors that connected the secondary ecological sources. To prevent an excessive number of ecological corridors from hindering the establishment of targeted conservation measures, redundant and repetitive corridors were eliminated from Yangxian. The final ecological corridors were determined by considering the paths of primary concern and ongoing conservation efforts (Figure 10c). The lengths of the main and secondary corridors were 236.14 km and 509.02 km, respectively.
Ecological corridors serve as essential pathways for ecological and biological activity and not only provide recreational spaces for humans but also habitats for species survival. Furthermore, ecological corridors strengthen the connection between ecological land use and ecosystem functionality, thereby maintaining regional ecosystem stability.

3.3.3. Ecological Node Identification

Ecological nodes were the weakest points in the functionality of ecological corridors typically located at the intersections of ecological corridors connecting ecological sources or multiple ecological corridors. They play crucial roles in animal migration and the preservation of urban and rural landscapes. They are important for maintaining the integrity, con tinuity, and ecological functionality of regional landscape structures. Therefore, ecological nodes are key to the interconnection and communication between ecological sources.
As shown in Figure 5d and Figure 11, this study identified 33 ecological nodes, of which 12 were located in areas with low resistance values. This indicates that they experienced lower levels of disturbance and disruption in urban and rural development, with had better conditions for ecological conservation.

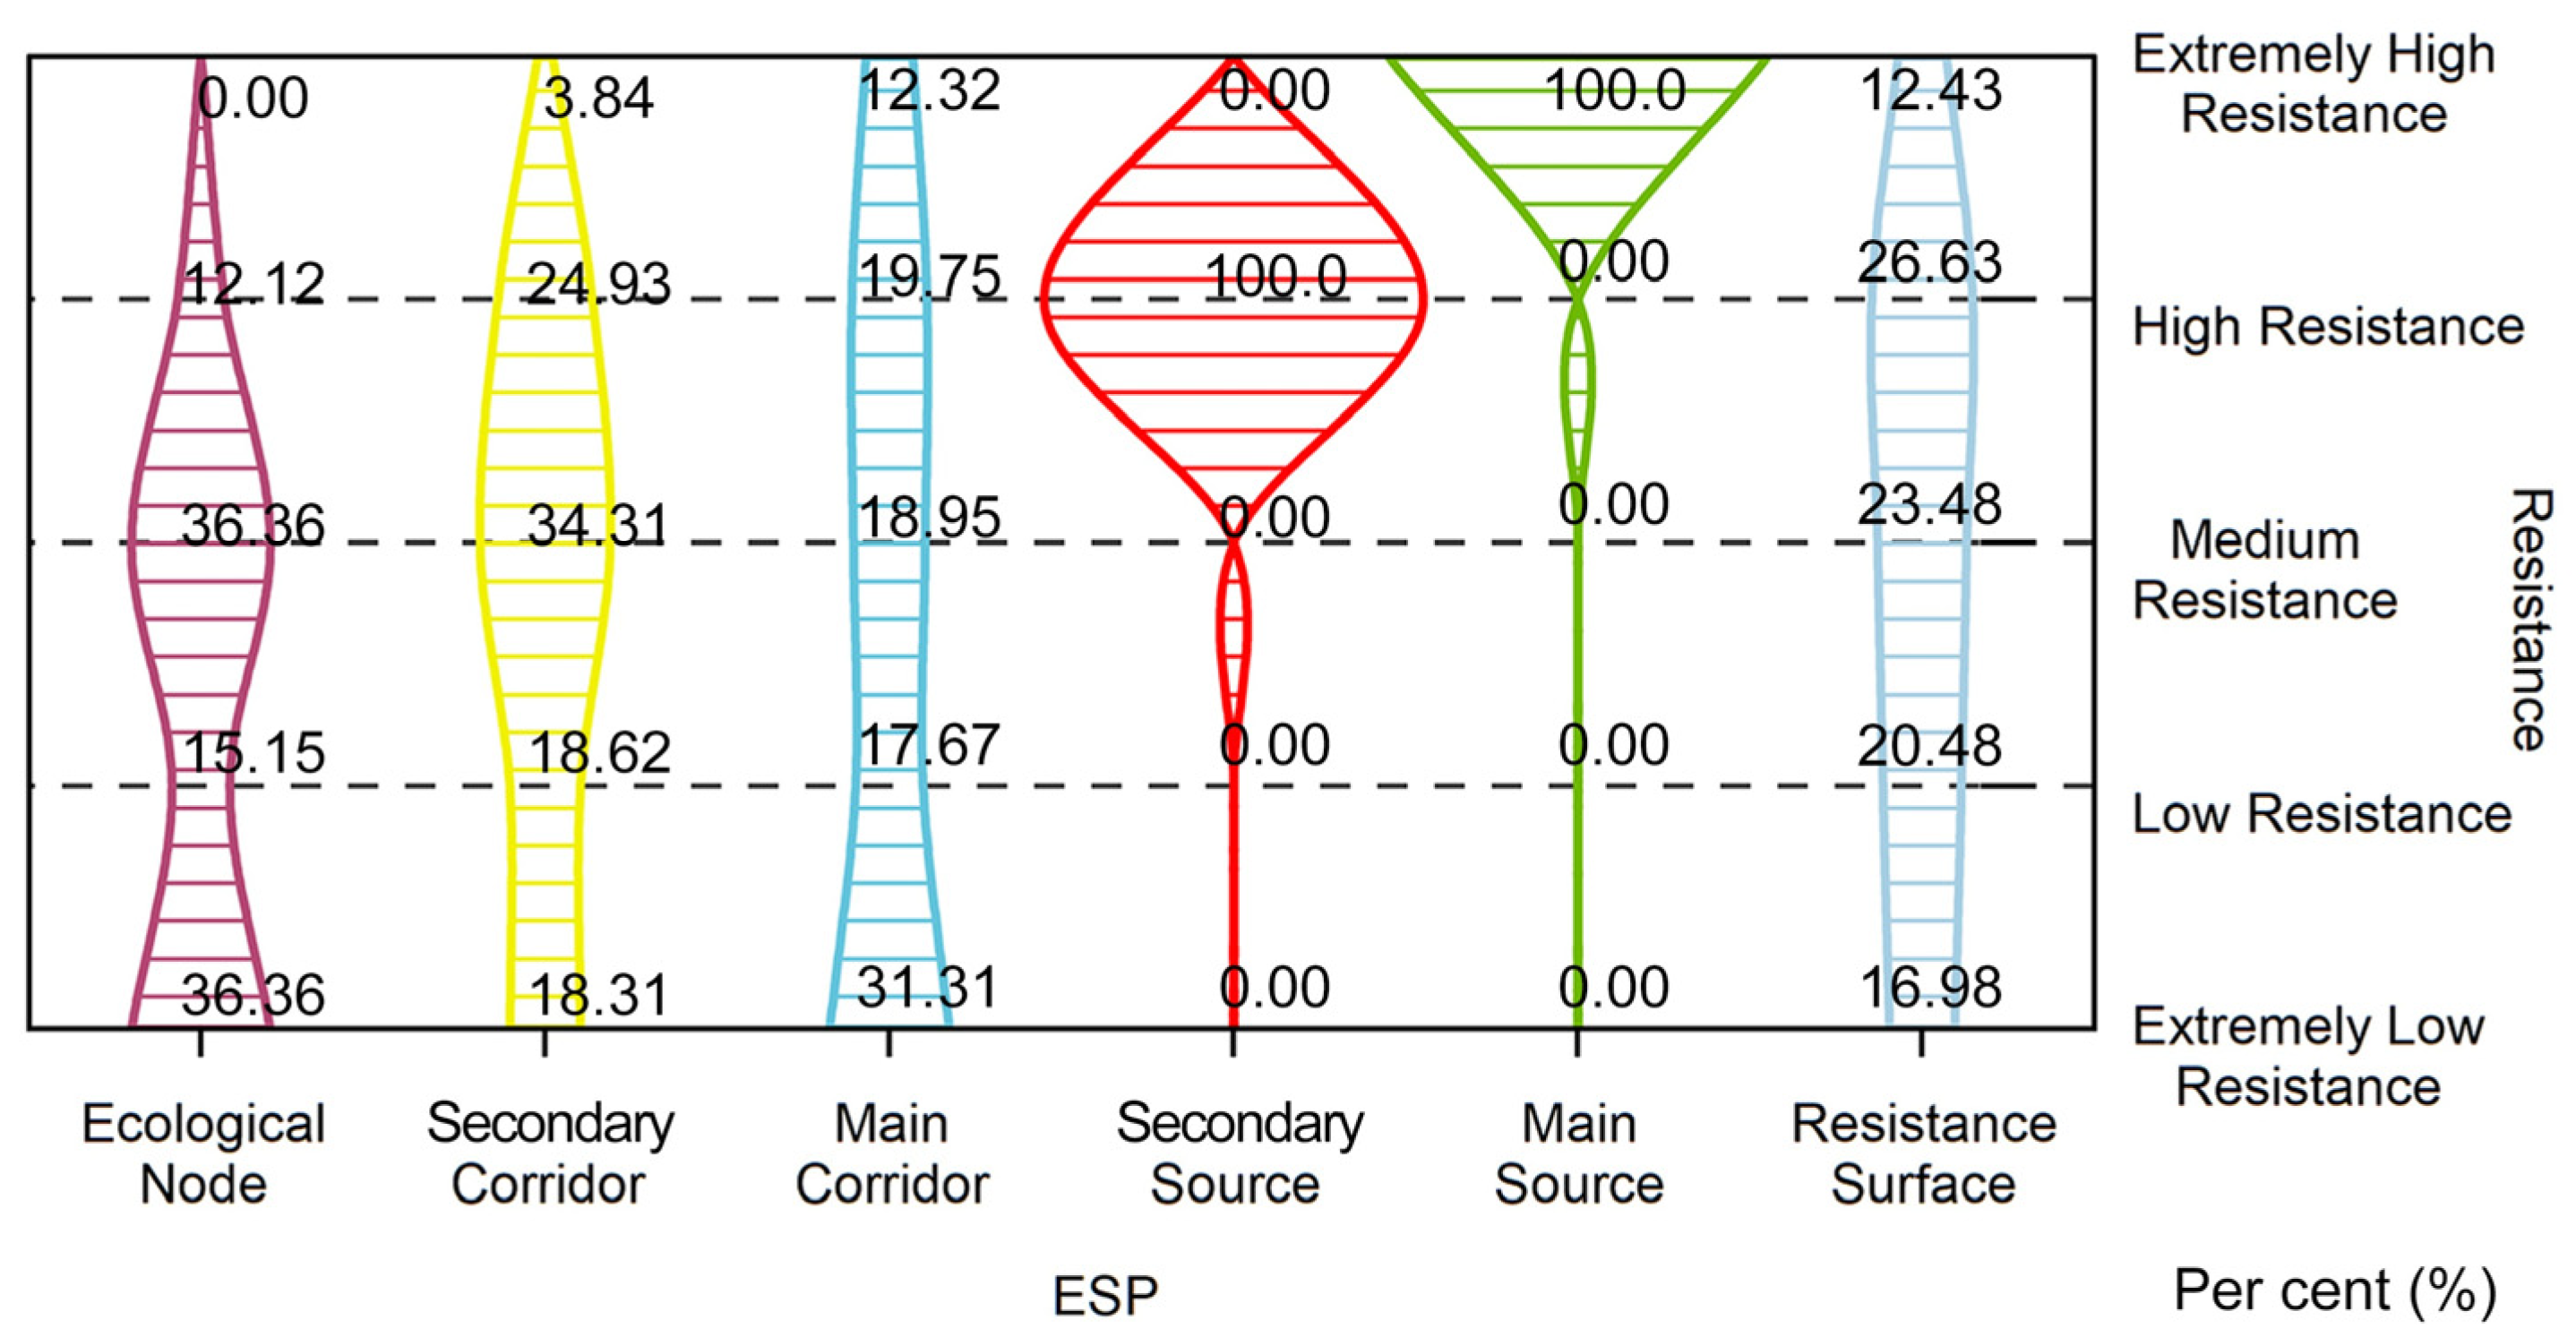
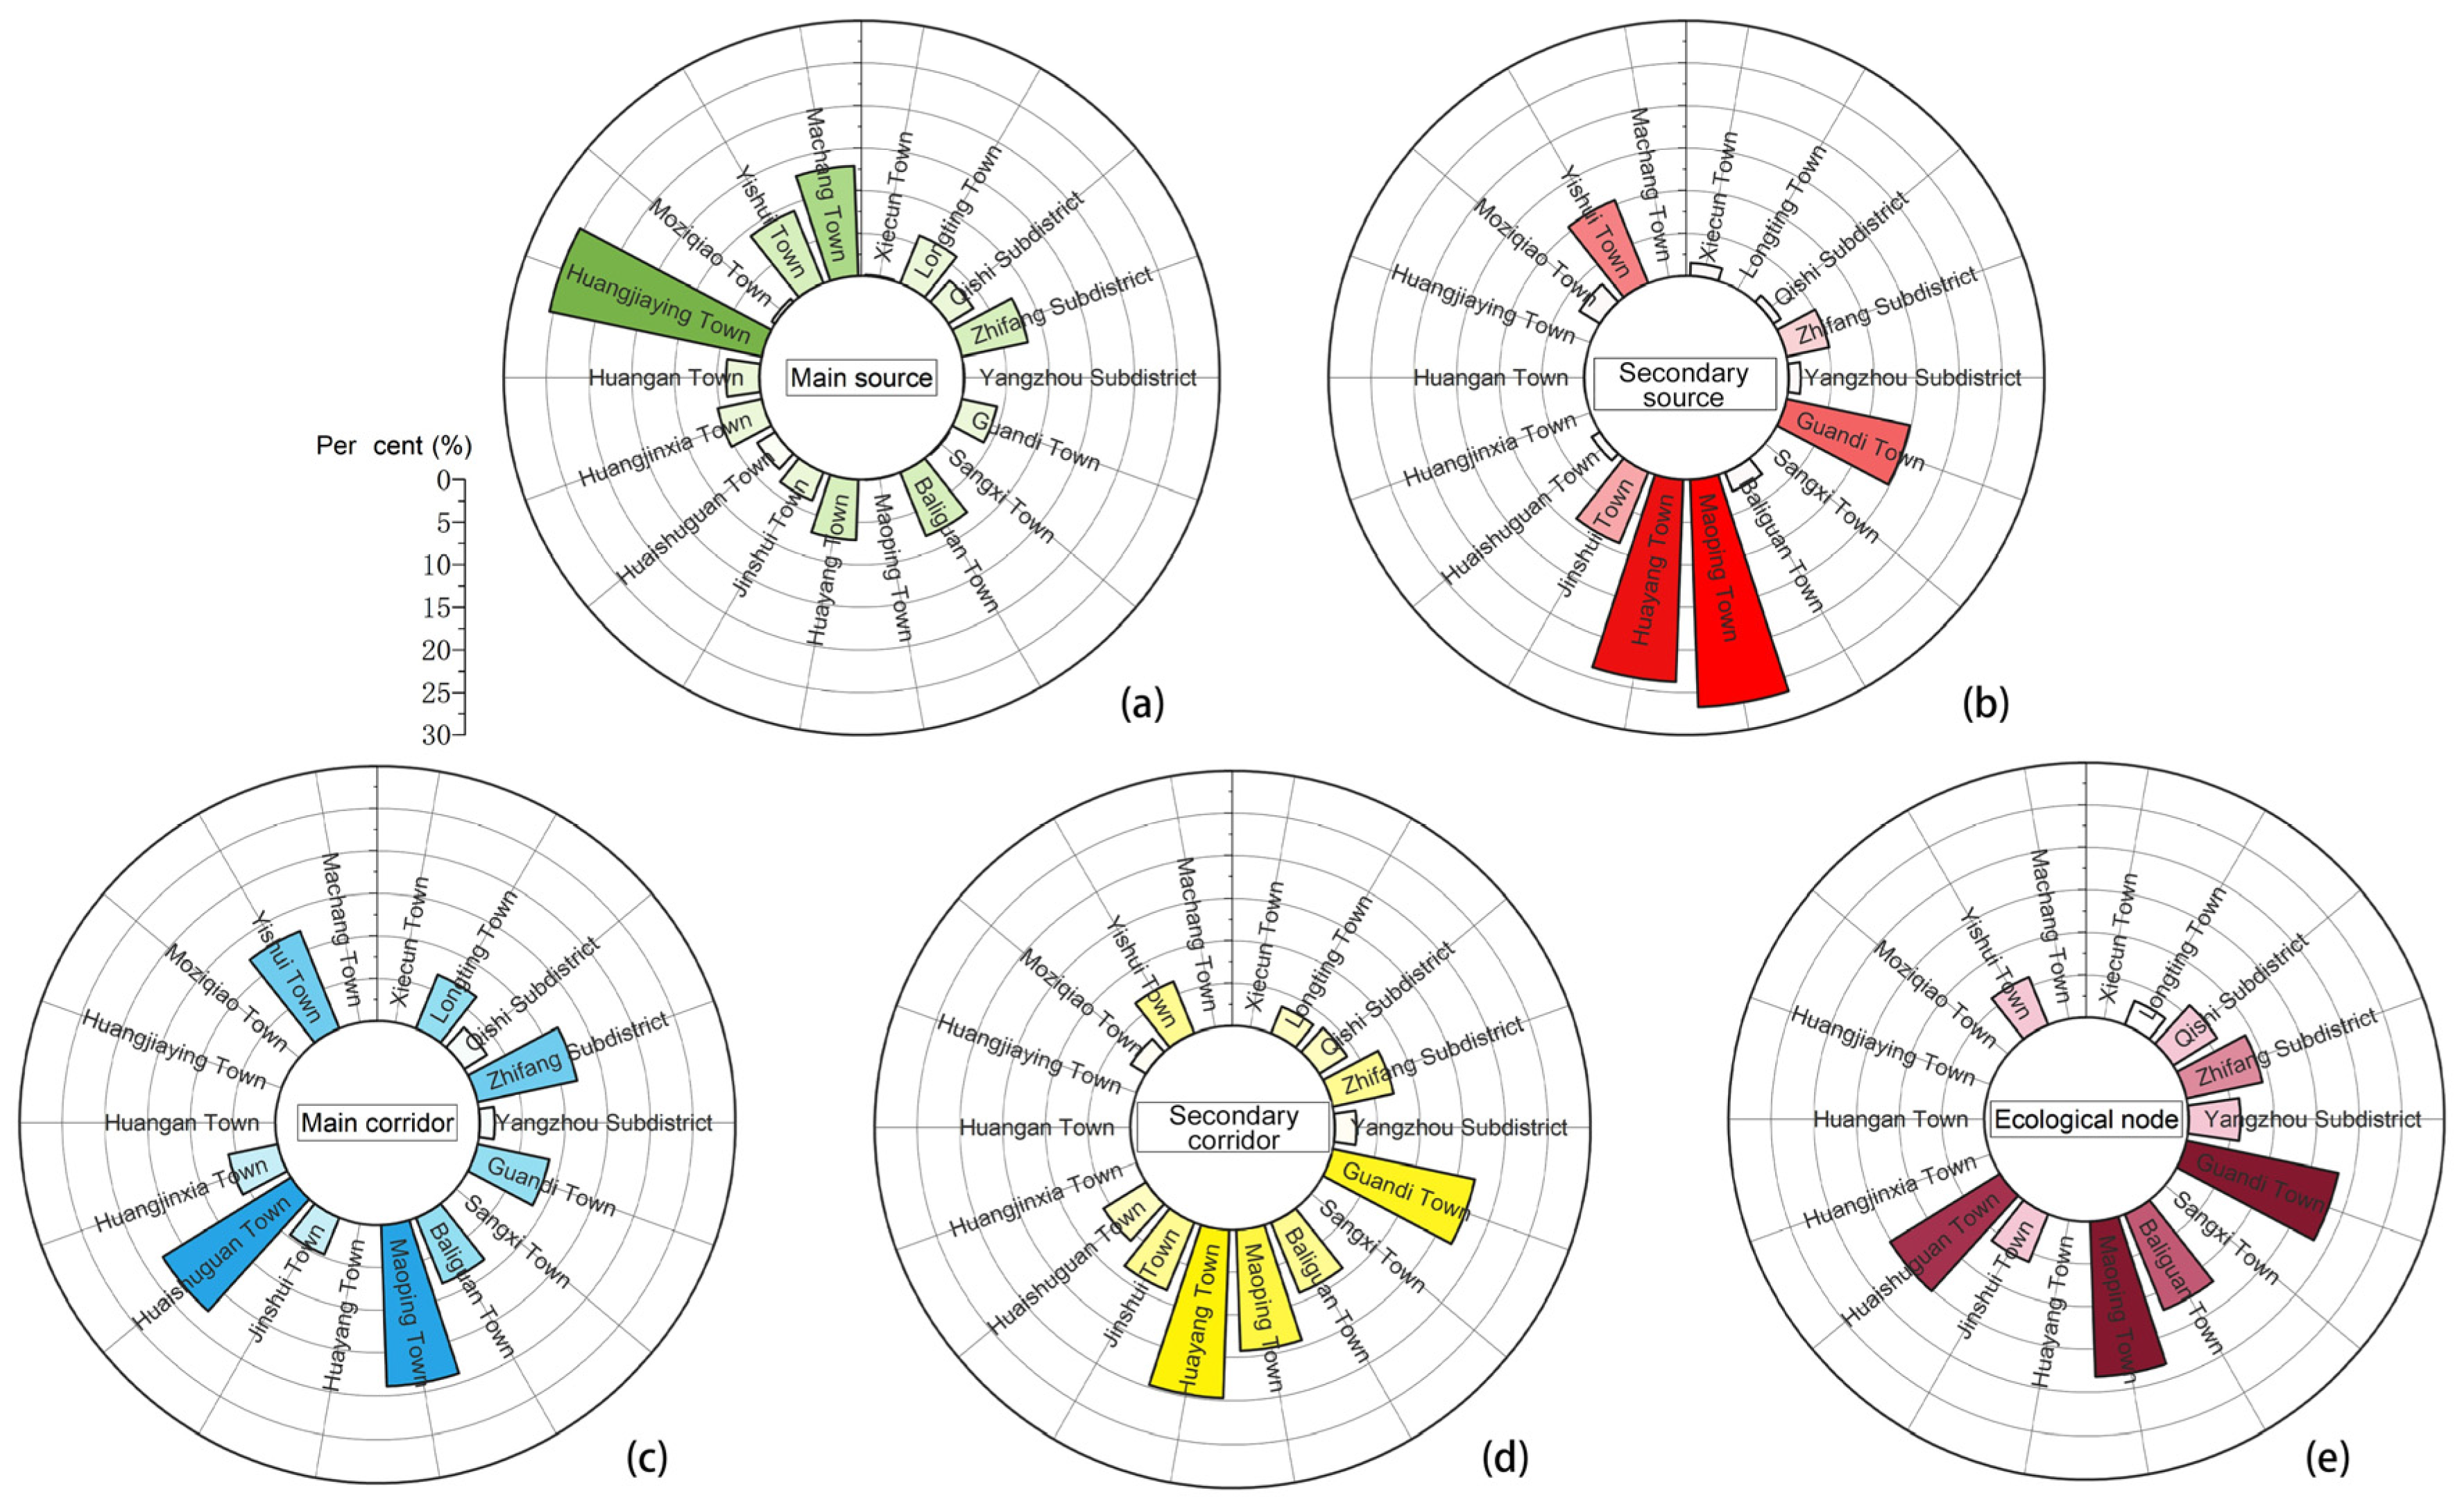
3.3.4. ESPs Construction

The construction of ESPs in Yangxian, which is located in the southern foothills of the Qinling Mountains, is illustrated in Figure 10 and Figure 11. Overall, the study area relies on its natural environment and has formed an ecological pattern, with the northern nature reserve and the southern Han River basin as the core ecological supply zones. The southern foothills of the Qinling Mountains are the core source of important ecosystem services in Central China and Asia and serve as a crucial node for maintaining regional ecosystem services.
Overall, the ecological corridor network had wide coverage, except for some ecological corridors and nodes in the southern part of the study area (Figure 11). The main ecological corridors were largely distributed in low-resistance areas (48.98%), indicating that Yangxian has relatively continuous and stable ecological corridors within these areas, providing favorable conditions for species migration and ecosystem connectivity. The secondary ecological corridors were mostly distributed in higher resistance areas (63.08%), suggesting that the ecological corridors in certain areas of Yangxian face greater disturbances and obstacles, potentially resulting in fragmentation or discontinuity. This poses challenges to the protection of biological migration and ecological functionality. The ecological nodes were predominantly located in low-resistance areas (51.52%), indicating that the ecological nodes in Yangxian are mainly concentrated in more stable and continuous ecological environments that may have higher biodiversity and ecosystem functionality. In terms of the spatial distribution of corridors and ecological nodes, there was a stronger density of distribution between the ecological sources in the Beihu Zhu’an Nature Reserve, with higher densities of corridors and ecological nodes than in the southern part.
The regional variation in the quantified ecological sources showed that 25.45% of the main ecological sources were in Huangjiaying Town, followed by Machang Town (12.91%) (Figure 12). The combined area of these two regions was 66.30 km2, accounting for 38.35% of the total area of the main ecological sources. Regarding the secondary ecological source, 26.71% was located in Maoping, followed by Huayang (23.75%). The combined area of these two regions is 211.90 km2, accounting for 50.46% of the total area of the secondary ecological sources. The ecological sources in Huayang, Yishui, Guandi, and Maoping Town accounted for 59.61% of the total, whereas <10% of the ecological sources were located in Sangxi, Yangzhou, Qishi, Xie, Huang, and Huaishuguan.
Within the ecological corridors, 15.7% were located in Maoping, followed by Guandi (14.36%). The combined length of these two central regions was 223.98 km, accounting for 30.05% of the total corridor length. Huangjiaying and Huang’an Towns did not have any corridors. The main ecological corridors were primarily distributed in Huaishuguan (18.89%), Maoping (17.71%), Yishui (12.33%), and Zhifang Street (11.92%), reaching a total length of 60.85% and amounting to 143.70 km. The densities of the ecological nodes and corridors in the northern region were significantly higher than those in the southern region, indicating a clear imbalance. The southern region suffers from severe low vegetation cover and soil erosion, resulting in limited energy flow, material exchange, and species migration between ecological sources in the southern region. Therefore, it is imperative to promptly optimize the regional spatial patterns and strengthen the connectivity of ecological resources, utilizing the existing ecological corridor network.

3.4. Coordinated Urban–Rural Development Strategy

3.4.1. Urban–Rural Coordinated Planning Model Based on ESAs and ESPs

The quantitative relationships between ADs, ES indicators, and ESPs are shown in Figure 13.
The relationship between the ES levels and ADs revealed distinct variations in numerical distributions. For instance, the Yangzhou Subdistrict has values of 0.29, 0.26, 0.25, 0.34, and 0.10 for the C1–C5 indicators, while the Zhifang Subdistrict had values of 0.80, 1.18, 0.73, 1.11, and 0.55, respectively. Higher values indicate higher sensitivity of the ADs at the corresponding level, highlighting the need for cautious protection and management. Huangjinxia Town had the highest C5 value of 1.43; hence, it requires enhanced protection due to high ES. Huayang Town exhibited relatively high values for the C3 and C4 indicators, implying the presence of sensitive ecological environments that require protection.
The relationship between the ADs and ESPs is evident in the numerical distributions of the main ecological sources, secondary ecological sources, main corridors, secondary corridors, and ecological nodes. For example, the Yangzhou subdistrict had values of 0.02, 1.40, 1.77, 2.55, and 6.06, respectively. These values indicate the importance and distribution of ESPs in different ADs. Machang Town showed the highest value for the “main ecological sources” at 12.91, suggesting the presence of important ecological functional areas, whereas Maoping Town showed the highest value for “secondary ecological sources” at 26.71, signifying the inclusion of critical ecological nodes. Conservation strategies should consider the significance of these areas for protecting ecosystems.
The integration of the ESPs and ESAs provides comprehensive decision support for evaluating the quality of ecological network construction. Variations in the numerical distribution across different sensitivity levels highlight the importance and proportion of ecological resources. These findings aid in formulating conservation strategies, such as implementing strict protection policies in highly sensitive areas and establishing nature reserves. Comprehensive analysis and decision-making efforts will contribute to ecological conservation and sustainable management.
In summary, by analyzing the relationship among ES levels, ADs, and ESPs, we can gain insights into the differences among different ADs in terms of the ES and the distribution of ecological resources. This study provides a basis for ecological conservation and management.

3.4.2. Optimization Plan for ESP

Regional ecological spatial planning is an important reference point in regional ecological management. In this study, considering the ecological sources, corridors, and nodes of Yangxian, we enhanced the connectivity function between ecological corridors and sources, and strengthened the strategic transfer function of ecological nodes, constructing an ESP with “two barriers, five corridors, five regions, and multiple nodes” (Figure 14). This pattern encompasses a multilevel, networked, and functionally complementary ecological spatial structure that maximizes the ecological effects of resource accumulation, correlation, and diffusion in different regions.
The “Two Barriers” refer to the Qinling Ecological Barrier in the north and the Bashan Ecological Barrier in the south. These natural barriers form an enclosed area that helps maintain the ecological balance by preventing external ecological influences. The “Five Corridors” are strategically distributed based on the MCR model, including three north–south and two east–west corridors. These corridors are crucial axes connecting different functional zones and ensure the continuity of the energy flow, material exchange, and ecological functions of the nodes. As a significant water source, the Han River positively influences material cycling and energy flow in the border areas. These “Five Regions” encompass the Pingdu Nature Reserve, Giant Panda National Park, Qinling National Nature Reserve, Crested Ibis National Nature Reserve, and Han River Nature Reserve. They fall within the ecological redline and require targeted protection due to their fragile nature. The “Multiple Nodes” refer to identified ecological nodes aimed at enhancing species transfer and energy circulation pathways’ connectivity.

4. Discussion

Urbanization poses a threat to ecosystems. ESP construction has become an important approach to safeguarding urban and rural ecological security and achieving sustainable development. Taking Yangxian as an example, this study employed multiple methods to assess ES and construct an ESP. Quantitative analysis of the ecological security of Yangxian was conducted in combination with the ADs.
The combination weighting method of AHP–PCA based on ML can address the uncertainty in weight determination. In this study, indicators were established based on the actual development situation in Yangxian, and the research area was subdivided. The weights were determined through a combination of subjective and objective conditions to ensure more accurate results and help to facilitate the revision of territorial spatial planning. The AHP–PCA combination weighting method was employed to determine the weights, which optimized the single-factor weighting method previously used. Researchers have also studied combination weighting methods, such as Zhu et al. [40] and Lin et al. [65], who combined AHP and entropy weighting methods. They found that the combination weighting approach was feasible. Furthermore, this study utilized ML for weight calculation, significantly improving the computational efficiency [66,67]. Previous studies have used neural network methods and random forest algorithms for weight calculation [51], thereby enhancing the scientific nature of weights. Therefore, this study selected the combination weighting method and combined it with local characteristics for indicator selection, indicator weighting, and subsequent subjective–objective weight adjustments. Therefore, the proposed method offers a certain degree of innovation.
Based on the ESAs, the construction results of ESPs were as follows: the important method for constructing ESPs is based on landscape ecology. The widely used MCR model is used due to its strong generality and operational feasibility [68]. When selecting indicators, the habitat of nationally protected animals, such as the Crested Ibis and the Giant Panda in the Qinling Mountains, was considered along with the prevention and control of natural disasters in other studies [35,51]. Factors such as ecological redlines and geological hazards were selected as the ecological security indicators. Based on previous studies, human interference is a major factor affecting the ecological environment; therefore, we considered the impact of the natural environment and socioeconomic indicators on regional ecosystems. In a previous study, a sensitivity analysis was conducted using GIS, RS, and AHP to optimize land-use planning in Malaysia [41] to provide guidance for integrated urban–rural planning. The ESA provides useful concepts and tools for land-use planning and management by considering current environmental issues [69]. Therefore, this study utilized the results of the ESPs analysis to extract ecological sources and construct an ecological network. In the construction of the ecological security network, we relied on circuit theory and the MCR model to establish six main ecologies, 15 secondary ecologies, 10 main corridors, 31 secondary corridors, and 33 ecological nodes to optimize the ESPs in the Qinling Mountains. Previous ESPs studies have focused on regions such as the Loess Plateau [21,70], Liaohe River Delta [71], and Yellow River Basin [27], with few studies specifically targeting the Qinling Mountains.
The construction of ESPs in Yangxian can serve as a foundation for planning and management. Ecological security protects water resources, preserves species diversity, and prevents natural disasters. This is one of the three major strategies for the development and protection of China’s land space [27,48,52,72,73]. The model for the quantitative analysis of ESPs in Yangxian is based on the dimensions of ESAs, ESPs, and ADs. ESAs are correlated with ADs. The distribution of the ES levels differed among the 18 administrative regions, reflecting their ES tendencies. Comparing the sensitivity levels in different regions allows for a better understanding of the differences in the ES. Higher values indicate greater sensitivity to the corresponding sensitivity level, which requires careful protection and management. ADs are associated with ESPs. The numerical distribution of regions with main and secondary ecological sources, corridors, and nodes represented their ecological pattern significance and distribution [74]. Understanding these differences will help determine key areas and develop targeted protection and management strategies [75]. By combining the analysis of ESAs and ADs with ESPs (Figure 13), comprehensive analysis decision support can be provided. Analyzing the numerical distribution of ESPs at different ES levels enables the quality evaluation of ecological networks. For example, regions with high sensitivity analysis values and concentrated distribution of ecological networks are roughly located in Maoping Town, Huayang Town, and Huangjinxia Town. These areas have a good ecological environment and a relatively high level of ecological security. By considering the distribution information of ESPs at different ADs, decision support for ecological protection and management can be provided, aiding the formulation of more effective strategies and measures. Based on the quantitative analysis, an ESP diagram of “two barriers, five corridors, five regions, and multiple points,” this quantitative evaluation serves as a foundation for planning and management.
Overall, research on ecological security in the southern foothills of the Qinling Mountains in China remains limited, and a research paradigm remains lacking. This study has some limitations because it neglects the temporal evolution of ecology and the comprehensive impact of spatiotemporal changes in on the ecological system. Furthermore, differences in socioeconomic development among administrative regions affect the statistics and estimation of indicator data, which, subsequently, influence the construction results of the ESPs.

5. Conclusions

The establishment of a regional ESP is an important approach to address the conflict between ecological conservation and economic development. Focused on Yangxian in the southern foothills of the Qinling Mountains, this study employed the ML, RS, GISs, and AHP–PCA weighting methods to quantitatively construct the ESP network. The network was developed from the perspectives of the ESAs, ESPs, and ADs, with the aim of providing scientific guidance for integrated urban–rural planning. The following conclusions were drawn:
(1)
Combination of the AHP–PCA weighting method based on ML helps to address uncertainty in weight determination. The research area in Yangxian was subdivided based on current development conditions, and weights were determined using a combination of subjective and objective criteria to ensure accurate results and provide a reference for land spatial planning revisions;
(2)
The ESP network in Yangxian of in the Qinling Mountain area was constructed based on ESAs by using RS, GISs, and MCR methods. The ecological node and corridor density in the northern part of Yangxian is significantly higher than in the southern part, indicating a clear imbalance. Therefore, there is an urgent need to optimize the regional space;
(3)
The quantitative analysis model of Yangxian, integrating ESAs, ESPs, and ADs, serves as a foundation for planning and management. The ecological advantages of different ADs were investigated by analyzing the relationship between ESAs and ADs. The analysis explored the integrity and stability of different ADs’ ecosystems by examining the relationship between ADs and ESPs. The relationship between ESPs and ESAs was also analyzed to provide comprehensive decision support for ecological conservation and management.

Author Contributions

Conceptualization, L.L., M.H. and P.L.; methodology, L.L., P.L. and M.C.; validation, L.L., W.D. and M.C.; formal analysis, L.L. and M.C.; investigation, M.C.; data curation, M.C.; writing—original draft preparation, L.L. and M.C.; writing—review and editing, L.L., M.C. and P.L.; visualization, M.C.; supervision, L.L., W.D., M.H. and P.L. All authors have read and agreed to the published version of the manuscript.

Funding

This research was supported by the Research Project on Ecological Space Governance Key Project of Shaanxi Province (No.: 2022HZ1861), the 2022 Social Science Planning Fund Project in Xi’an City (No.: 22LW156), China Scholarship Council (Grant No.: Liujinmei [2022] No. 45; Liujinxuan [2022] No. 133; Liujinou [2023] No. 22), International Education Research Program of Chang’an University (300108221102), Project of Ningxia Natural Science Foundation (2022AAC03700; 2022BEG03059), 2022 Guangdong University Youth Innovation Talent Program (2022KQNCX143), the GDAS Special Project of Science and Technology Development (2021GDASYL-20210103046) and Asia–Pacific Network for Global Change Research (CRRP2020-03MY-He), the Guangdong Foundation for Program of Science and Technology Research (2021A1313030057), Yinshanbeilu Grassland Eco-hydrology National Observation and Research Station, China Institute of Water Resources and Hydropower Research, Beijing 100038, China, (Grant No. YSS2022004).

Data Availability Statement

Not applicable.

Acknowledgments

The authors gratefully thank the editors and anonymous reviewers for their valuable advice in improving this manuscript.

Conflicts of Interest

The authors declare no conflict of interest.

Appendix A

Table A1. List of abbreviations and their definitions.
AcronymsConstituentDefinition/Explanation
RSRemote SensingThe acquisition and interpretation of information about the Earth’s surface using satellite or airborne sensors.
MLMachine LearningA field of study that focuses on the development of algorithms and statistical models that enable computer systems to learn from and make predictions or
decisions based on data.
GISsGeographic
Information Systems
Technology systems used for capturing, storing, managing, analyzing, and
displaying spatial data.
AHPAnalytic Hierarchy ProcessA method used to support decision making and evaluate multiple criteria and
factors. It decomposes complex decision problems into a hierarchical structure and uses quantitative and qualitative criteria for comparison and trade-off, ultimately arriving at the optimal choice.
PCAPrincipal Component AnalysisA commonly used statistical technique for dimensionality reduction and revealing major patterns and variations within data. By projecting the original data onto
a new co-ordinate system, PCA identifies the most significant principal
components, thereby simplifying the dataset and providing clearer interpretation and visualization.
ESPsEcological Security PatternsDescribes the sustainable security patterns in social–ecological linkages.
ESEcological
Sensitivity
An indicator used to measure the sensitivity of a specific area to environmental changes.
NESNatural Environment SensitivityAn indicator that measures the sensitivity of a specific area to changes in the
natural environment. It involves aspects such as elevation, aspect, relief degree of land surface (RDLS), and the river and normalized difference vegetation index (NDVI).
SESSocioeconomic
Sensitivity
An indicator that measures the sensitivity of a specific area to socioeconomic changes. It involves aspects such as land use, population, residential land,
condition of urban construction, and condition of village construction.
ESSEcological Security SensitivityAn indicator that measures the sensitivity of a specific area to ecological security issues. It involves aspects such as ecological redlines, landscape resources,
geological disaster, soil erosion, and flood risk.
CESComprehensive
Ecological Sensitivity
A comprehensive assessment of ecological sensitivity in Yangxian, considering various factors, such as NES, SES, and ESS.
ADsAdministrative
Districts
Administrative regions or units within a specific geographic area, such as
Yangxian.

References

  1. Wang, X.F.; Luo, P.P.; Zheng, Y.; Duan, W.L.; Wang, S.T.; Zhu, W.; Zhang, Y.Z.; Nover, D. Drought Disasters in China from 1991 to 2018: Analysis of Spatiotemporal Trends and Characteristics. Remote Sens. 2023, 15, 1708. [Google Scholar] [CrossRef]
  2. Sun, W.; Huang, C. Predictions of carbon emission intensity based on factor analysis and an improved extreme learning machine from the perspective of carbon emission efficiency. J. Clean. Prod. 2022, 338, 130414. [Google Scholar] [CrossRef]
  3. Zhou, Y.; Zou, S.; Duan, W.; Chen, Y.; Takara, K.; Di, Y. Analysis of energy carbon emissions from agroecosystems in Tarim River Basin, China: A pathway to achieve carbon neutrality. Appl. Energy 2022, 325, 119842. [Google Scholar] [CrossRef]
  4. Qin, J.; Duan, W.; Chen, Y.; Dukhovny, V.A.; Sorokin, D.; Li, Y.; Wang, X. Comprehensive evaluation and sustainable development of water-energy-food-ecology systems in Central Asia. Renew. Sustain. Energy Rev. 2022, 157, 112061. [Google Scholar] [CrossRef]
  5. Shen, X.; Liu, B.; Jiang, M.; Lu, X. Marshland Loss Warms Local Land Surface Temperature in China. Geophys. Res. Lett. 2020, 47, e2020GL087648. [Google Scholar] [CrossRef] [Green Version]
  6. Zhu, W.; Cao, Z.; Luo, P.; Tang, Z.; Zhang, Y.; Hu, M.; He, B. Urban Flood-Related Remote Sensing: Research Trends, Gaps and Opportunities. Remote Sens. 2022, 14, 5505. [Google Scholar] [CrossRef]
  7. Wang, Z.; Luo, P.P.; Zha, X.B.; Xu, C.Y.; Kang, S.X.; Zhou, M.M.; Nover, D.; Wang, Y.H. Overview assessment of risk evaluation and treatment technologies for heavy metal pollution of water and soil. J. Clean. Prod. 2022, 379, 134043. [Google Scholar] [CrossRef]
  8. Wang, S.; Zhang, K.; Chao, L.; Chen, G.; Xia, Y.; Zhang, C. Investigating the Feasibility of Using Satellite Rainfall for the Integrated Prediction of Flood and Landslide Hazards over Shaanxi Province in Northwest China. Remote Sens. 2023, 15, 2457. [Google Scholar] [CrossRef]
  9. Luo, P.P.; Luo, M.T.; Li, F.Y.; Qi, X.G.; Huo, A.D.; Wang, Z.H.; He, B.; Takara, K.; Nover, D.; Wang, Y.H. Urban flood numerical simulation: Research, methods and future perspectives. Environ. Model. Softw. 2022, 156, 105478. [Google Scholar] [CrossRef]
  10. Wang, S.T.; Luo, P.P.; Xu, C.Y.; Zhu, W.; Cao, Z.; Ly, S. Reconstruction of Historical Land Use and Urban Flood Simulation in Xi’an, Shannxi, China. Remote Sens. 2022, 14, 6067. [Google Scholar] [CrossRef]
  11. Guo, B.; Wu, H.J.; Pei, L.; Zhu, X.W.; Zhang, D.M.; Wang, Y.; Luo, P.P. Study on the spatiotemporal dynamic of ground-level ozone concentrations on multiple scales across China during the blue sky protection campaign. Environ. Int. 2022, 170, 107606. [Google Scholar] [CrossRef]
  12. Chen, G.; Zhang, K.; Wang, S.; Xia, Y.; Chao, L. iHydroSlide3D v1.0: An advanced hydrological–geotechnical model for hydrological simulation and three-dimensional landslide prediction. Geosci. Model Dev. 2023, 16, 2915–2937. [Google Scholar] [CrossRef]
  13. Wei, W.; Zou, S.; Duan, W.; Chen, Y.; Li, S.; Zhou, Y. Spatiotemporal variability in extreme precipitation and associated large-scale climate mechanisms in Central Asia from 1950 to 2019. J. Hydrol. 2023, 620, 129417. [Google Scholar] [CrossRef]
  14. Chen, X.; Zhang, K.; Luo, Y.; Zhang, Q.; Zhou, J.; Fan, Y.; Huang, P.; Yao, C.; Chao, L.; Bao, H. A distributed hydrological model for semi-humid watersheds with a thick unsaturated zone under strong anthropogenic impacts: A case study in Haihe River Basin. J. Hydrol. 2023, 623, 129765. [Google Scholar] [CrossRef]
  15. Deng, H.; Pepin, N.C.; Chen, Y.; Guo, B.; Zhang, S.; Zhang, Y.; Chen, X.; Gao, L.; Meibing, L.; Ying, C. Dynamics of Diurnal Precipitation Differences and Their Spatial Variations in China. J. Appl. Meteor. Climatol. 2022, 61, 1015–1027. [Google Scholar] [CrossRef]
  16. Cao, Z.; Zhu, W.; Luo, P.P.; Wang, S.T.; Tang, Z.M.; Zhang, Y.Z.; Guo, B. Spatially Non-Stationary Relationships between Changing Environment and Water Yield Services in Watersheds of China’s Climate Transition Zones. Remote Sens. 2022, 14, 5078. [Google Scholar] [CrossRef]
  17. Luo, P.; Zheng, Y.; Wang, Y.; Zhang, S.; Yu, W.; Zhu, X.; Huo, A.; Wang, Z.; He, B.; Nover, D. Comparative Assessment of Sponge City Constructing in Public Awareness, Xi’an, China. Sustainability 2022, 14, 11653. [Google Scholar] [CrossRef]
  18. Pecl, G.T.; Araujo, M.B.; Bell, J.D.; Blanchard, J.; Bonebrake, T.C.; Chen, I.C.; Clark, T.D.; Colwell, R.K.; Danielsen, F.; Evengard, B.; et al. Biodiversity redistribution under climate change: Impacts on ecosystems and human well-being. Science 2017, 355, eaai9214. [Google Scholar] [CrossRef]
  19. Li, Q.; Zhou, Y.; Yi, S. An integrated approach to constructing ecological security patterns and identifying ecological restoration and protection areas: A case study of Jingmen, China. Ecol. Indic. 2022, 137, 108723. [Google Scholar] [CrossRef]
  20. Ramesh, T.; Bolan, N.S.; Kirkham, M.B.; Wijesekara, H.; Kanchikerimath, M.; Srinivasa Rao, C.; Sandeep, S.; Rinklebe, J.; Ok, Y.S.; Choudhury, B.U.; et al. Soil organic carbon dynamics: Impact of land use changes and management practices: A review. Adv. Agron. 2019, 156, 1–107. [Google Scholar] [CrossRef]
  21. Xu, W.; Wang, J.; Zhang, M.; Li, S. Construction of landscape ecological network based on landscape ecological risk assessment in a large-scale opencast coal mine area. J. Clean. Prod. 2021, 286, 125523. [Google Scholar] [CrossRef]
  22. Wei, Q.; Halike, A.; Yao, K.; Chen, L.; Balati, M. Construction and optimization of ecological security pattern in Ebinur Lake Basin based on MSPA-MCR models. Ecol. Indic. 2022, 138, 108857. [Google Scholar] [CrossRef]
  23. Long, H.; Ma, L.; Zhang, Y.; Qu, L. Multifunctional rural development in China: Pattern, process and mechanism. Habitat Int. 2022, 121, 102530. [Google Scholar] [CrossRef]
  24. Chen, J.; Wang, S.; Zou, Y. Construction of an ecological security pattern based on ecosystem sensitivity and the importance of ecological services: A case study of the Guanzhong Plain urban agglomeration, China. Ecol. Indic. 2022, 136, 108688. [Google Scholar] [CrossRef]
  25. Peng, J.; Yang, Y.; Liu, Y.; Hu, Y.N.; Du, Y.; Meersmans, J.; Qiu, S. Linking ecosystem services and circuit theory to identify ecological security patterns. Sci. Total Environ. 2018, 644, 781–790. [Google Scholar] [CrossRef] [Green Version]
  26. Dai, L.; Liu, Y.; Luo, X. Integrating the MCR and DOI models to construct an ecological security network for the urban agglomeration around Poyang Lake, China. Sci. Total Environ. 2021, 754, 141868. [Google Scholar] [CrossRef]
  27. Zhang, Y.; Zhao, Z.; Yang, Y.; Fu, B.; Ma, R.; Lue, Y.; Wu, X. Identifying ecological security patterns based on the supply, demand and sensitivity of ecosystem service: A case study in the Yellow River Basin, China. J. Environ. Manag. 2022, 315, 115158. [Google Scholar] [CrossRef] [PubMed]
  28. Li, Y.; Liu, W.; Feng, Q.; Zhu, M.; Yang, L.; Zhang, J.; Yin, X. The role of land use change in affecting ecosystem services and the ecological security pattern of the Hexi Regions, Northwest China. Sci. Total Environ. 2023, 855, 158940. [Google Scholar] [CrossRef]
  29. Peng, J.; Pan, Y.; Liu, Y.; Zhao, H.; Wang, Y. Linking ecological degradation risk to identify ecological security patterns in a rapidly urbanizing landscape. Habitat Int. 2018, 71, 110–124. [Google Scholar] [CrossRef]
  30. Xu, Y.; Liu, R.; Xue, C.; Xia, Z. Ecological Sensitivity Evaluation and Explanatory Power Analysis of the Giant Panda National Park in China. Ecol. Indic. 2023, 146, 109792. [Google Scholar] [CrossRef]
  31. Hua, Z.; Yu, L.; Liu, X.; Zhang, Y.; Ma, Y.; Lu, Y.; Wang, Y.; Yang, Y.; Xue, H. PerfLuoroalkyl acids in surface sediments from the lower Yangtze River: Occurrence, distribution, sources, inventory, and risk assessment. Sci. Total Environ. 2021, 798, 149332. [Google Scholar] [CrossRef] [PubMed]
  32. Zhang, X.; Liu, K.; Wang, S.; Wu, T.; Li, X.; Wang, J.; Wang, D.; Zhu, H.; Tan, C.; Ji, Y. Spatiotemporal evolution of ecological vulnerability in the Yellow River Basin under ecological restoration initiatives. Ecol. Indic. 2022, 135, 108586. [Google Scholar] [CrossRef]
  33. Dong, X.; Wu, Y.; Chen, X.; Li, H.; Cao, B.; Zhang, X.; Yan, X.; Li, Z.; Long, Y.; Li, X. Effect of thermal, acoustic, and lighting environment in underground space on human comfort and work efficiency: A review. Sci. Total Environ. 2021, 786, 147537. [Google Scholar] [CrossRef]
  34. Tsou, J.Y.; Gao, Y.; Zhang, Y.; Sun, G.; Ren, J.; Li, Y. Evaluating Urban Land Carrying Capacity Based on the Ecological Sensitivity Analysis: A Case Study in Hangzhou, China. Remote Sens. 2017, 9, 529. [Google Scholar] [CrossRef] [Green Version]
  35. Guan, Q.; Liu, Z.; Shao, W.; Tian, J.; Luo, H.; Ni, F.; Shan, Y. Probabilistic risk assessment of heavy metals in urban farmland soils of a typical oasis city in northwest China. Sci. Total Environ. 2022, 833, 155096. [Google Scholar] [CrossRef]
  36. Shi, C.; Zhu, X.; Wu, H.; Li, Z. Assessment of Urban Ecological Resilience and Its Influencing Factors: A Case Study of the Beijing-Tianjin-Hebei Urban Agglomeration of China. Land 2022, 11, 921. [Google Scholar] [CrossRef]
  37. Li, Q.; Shi, X.; Wu, Q. Effects of protection and restoration on reducing ecological vulnerability. Sci. Total Environ. 2021, 761, 143180. [Google Scholar] [CrossRef]
  38. Dong, S.; Shang, Z.; Gao, J.; Boone, R.B. Enhancing sustainability of grassland ecosystems through ecological restoration and grazing management in an era of climate change on Qinghai-Tibetan Plateau. Agric. Ecosyst. Environ. 2020, 287, 106684. [Google Scholar] [CrossRef]
  39. Hu, X.; Xu, H. A new remote sensing index for assessing the spatial heterogeneity in urban ecological quality: A case from Fuzhou City, China. Ecol. Indic. 2018, 89, 11–21. [Google Scholar] [CrossRef]
  40. Zhu, X.; Niu, D.; Wang, X.; Wang, F.; Jia, M. Comprehensive energy saving evaluation of circulating cooling water system based on combination weighting method. Appl. Therm. Eng. 2019, 157, 113735. [Google Scholar] [CrossRef]
  41. Leman, N.; Ramli, M.F.; Khirotdin, R.P.K. GIS-based integrated evaluation of environmentally sensitive areas (ESAs) for land use planning in Langkawi, Malaysia. Ecol. Indic. 2016, 61, 293–308. [Google Scholar] [CrossRef]
  42. Liu, D.-J.; Li, L. Application Study of Comprehensive Forecasting Model Based on Entropy Weighting Method on Trend of PM2.5 Concentration in Guangzhou, China. Int. J. Environ. Res. Public Health 2015, 12, 7085–7099. [Google Scholar] [CrossRef] [Green Version]
  43. Latifo, F.; Polat, K.; Kara, S.; Gunes, S. Medical diagnosis of atherosclerosis from carotid artery Doppler signals using principal component analysis (PCA), k-NN based weighting pre-processing and artificial immune recognition system (AIRS). J. Biomed. Inform. 2008, 41, 15–23. [Google Scholar] [CrossRef]
  44. Chen, Z.; Liu, Y.; Feng, W.; Li, Y.; Li, L. Study on spatial tropism distribution of rural settlements in the Loess Hilly and Gully Region based on natural factors and traffic accessibility. J. Rural. Stud. 2022, 93, 441–448. [Google Scholar] [CrossRef]
  45. Wang, Z.; Liang, L.; Sun, Z.; Wang, X. Spatiotemporal differentiation and the factors influencing urbanization and ecological environment synergistic effects within the Beijing-Tianjin-Hebei urban agglomeration. J. Environ. Manag. 2019, 243, 227–239. [Google Scholar] [CrossRef] [PubMed]
  46. Zhang, Y.; He, Y.; Li, Y.; Jia, L. Spatiotemporal variation and driving forces of NDVI from 1982 to 2015 in the Qinba Mountains, China. Environ. Sci. Pollut. Res. 2022, 29, 52277–52288. [Google Scholar] [CrossRef] [PubMed]
  47. Xiao, S.; Wu, W.; Guo, J.; Ou, M.; Pueppke, S.G.; Ou, W.; Tao, Y. An evaluation framework for designing ecological security patterns and prioritizing ecological corridors: Application in Jiangsu Province, China. Landsc. Ecol. 2020, 35, 2517–2534. [Google Scholar] [CrossRef]
  48. Li, Y.; Li, Y.; Fan, P.; Long, H. Impacts of land consolidation on rural human-environment system in typical watershed of the Loess Plateau and implications for rural development policy. Land Use Policy 2019, 86, 339–350. [Google Scholar] [CrossRef]
  49. Zhang, S.; Zhong, Q.; Cheng, D.; Xu, C.; Chang, Y.; Lin, Y.; Li, B. Coupling Coordination Analysis and Prediction of Landscape Ecological Risks and Ecosystem Services in the Min River Basin. Land 2022, 11, 222. [Google Scholar] [CrossRef]
  50. Yang, T.; Zhang, Q.; Wan, X.; Li, X.; Wang, Y.; Wang, W. Comprehensive ecological risk assessment for semi-arid basin based on conceptual model of risk response and improved TOPSIS model-a case study of Wei River Basin, China. Sci. Total Environ. 2020, 719, 137502. [Google Scholar] [CrossRef]
  51. Kong, W.; Wang, T.; Liu, L.; Luo, P.; Cui, J.; Wang, L.; Hua, X.; Duan, W.; Su, F. A novel design and application of spatial data management platform for natural resources. J. Clean. Prod. 2023, 411, 137183. [Google Scholar] [CrossRef]
  52. Mu, H.; Li, X.; Ma, H.; Du, X.; Huang, J.; Su, W.; Yu, Z.; Xu, C.; Liu, H.; Yin, D.; et al. Evaluation of the policy-driven ecological network in the Three-North Shelterbelt region of China. Landsc. Urban Plan. 2022, 218, 104305. [Google Scholar] [CrossRef]
  53. Kang, S.; Hao, X.; Du, T.; Tong, L.; Su, X.; Lu, H.; Li, X.; Huo, Z.; Li, S.; Ding, R. Improving agricultural water productivity to ensure food security in China under changing environment: From research to practice. Agric. Water Manag. 2017, 179, 5–17. [Google Scholar] [CrossRef]
  54. Wang, L.; Chen, S.; Zhu, W.; Ren, H.; Zhang, L.; Zhu, L. Spatiotemporal variations of extreme precipitation and its potential driving factors in China’s North-South Transition Zone during 1960–2017. Atmos. Res. 2021, 252, 105429. [Google Scholar] [CrossRef]
  55. Yao, Y.; Wang, X.; Li, Y.; Wang, T.; Shen, M.; Du, M.; He, H.; Li, Y.; Luo, W.; Ma, M.; et al. Spatiotemporal pattern of gross primary productivity and its covariation with climate in China over the last thirty years. Glob. Ecol. Biogeogr. 2018, 24, 184–196. [Google Scholar] [CrossRef]
  56. Ju, X.-T.; Zhang, C. Nitrogen cycling and environmental impacts in upland agricultural soils in North China: A review. J. Integr. Agric. 2017, 16, 2848–2862. [Google Scholar] [CrossRef]
  57. Yang, J.; Dong, J.; Xiao, X.; Dai, J.; Wu, C.; Xia, J.; Zhao, G.; Zhao, M.; Li, Z.; Zhang, Y.; et al. Divergent shifts in peak photosynthesis timing of temperate and alpine grasslands in China. Remote Sens. Environ. 2019, 233, 111395. [Google Scholar] [CrossRef]
  58. Tabata, M.; Eshima, N.; Takagi, I. A mathematical modeling approach to the formation of urban and rural areas: Convergence of global solutions of the mixed problem for the master equation in sociodynamics. Nonlinear Anal. -Real World Appl. 2011, 12, 3261–3293. [Google Scholar] [CrossRef]
  59. Wu, D.; Liu, H. Effects of the bed roughness and beach slope on the non-breaking solitary wave runup height. Coast. Eng. 2022, 174, 104122. [Google Scholar] [CrossRef]
  60. Yong, A.; Hough, S.E.; Iwahashi, J.; Braverman, A. A Terrain-Based Site-Conditions Map of California with Implications for the Contiguous United States. Bull. Seismol. Soc. Am. 2012, 102, 114–128. [Google Scholar] [CrossRef]
  61. Wang, C.; Wang, X.; Zhang, H.; Meng, F.; Li, X. Assessment of environmental geological disaster susceptibility under a multimodel comparison to aid in the sustainable development of the regional economy. Environ. Sci. Pollut. Res. 2022, 30, 6573–6591. [Google Scholar] [CrossRef] [PubMed]
  62. Garcia-Ruiz, J.M. The effects of land uses on soil erosion in Spain: A review. Catena 2010, 81, 1–11. [Google Scholar] [CrossRef]
  63. Teng, J.; Jakeman, A.J.; Vaze, J.; Croke, B.F.W.; Dutta, D.; Kim, S. Flood inundation modelling: A review of methods, recent advances and uncertainty analysis. Environ. Model. Softw. 2017, 90, 201–216. [Google Scholar] [CrossRef]
  64. Keeley, A.T.H.; Beier, P.; Keeley, B.W.; Fagan, M.E. Habitat suitability is a poor proxy for landscape connectivity during dispersal and mating movements. Landsc. Urban Plan. 2017, 161, 90–102. [Google Scholar] [CrossRef]
  65. Lin, L.; Wei, X.; Luo, P.; Wang, S.; Kong, D.; Yang, J. Ecological Security Patterns at Different Spatial Scales on the Loess Plateau. Remote Sens. 2023, 15, 1011. [Google Scholar] [CrossRef]
  66. Duan, W.; Maskey, S.; Chaffe, P.L.B.; Luo, P.; He, B.; Wu, Y.; Hou, J. Recent Advancement in Remote Sensing Technology for Hydrology Analysis and Water Resources Management. Remote Sens. 2021, 13, 1097. [Google Scholar] [CrossRef]
  67. Krizhevsky, A.; Sutskever, I.; Hinton, G.E. ImageNet Classification with Deep Convolutional Neural Networks. Commun. ACM 2017, 60, 84–90. [Google Scholar] [CrossRef] [Green Version]
  68. Zou, L.; Liu, Y.; Yang, J.; Yang, S.; Wang, Y.; Zhi, C.; Hu, X. Quantitative identification and spatial analysis of land use ecological-production-living functions in rural areas on China’s southeast coast. Habitat Int. 2020, 100, 102182. [Google Scholar] [CrossRef]
  69. Jalilian, M.A.; Salmanmahiny, A.; Danehkar, A.; Shayesteh, K. Developing a method for calculating conservation targets in systematic conservation planning at the national level. J. Nat. Conserv. 2021, 64, 126091. [Google Scholar] [CrossRef]
  70. Qiao, Q.; Zhen, Z.; Liu, L.; Luo, P. The Construction of Ecological Security Pattern under Rapid Urbanization in the Loess Plateau: A Case Study of Taiyuan City. Remote Sens. 2023, 15, 1523. [Google Scholar] [CrossRef]
  71. Cui, S.; Han, Z.; Yan, X.; Li, X.; Zhao, W.; Liu, C.; Li, X.; Zhong, J. Link Ecological and Social Composite Systems to Construct Sustainable Landscape Patterns: A New Framework Based on Ecosystem Service Flows. Remote Sens. 2022, 14, 4663. [Google Scholar] [CrossRef]
  72. Ouyang, X.; Xu, J.; Li, J.; Wei, X.; Li, Y. Land space optimization of urban-agriculture-ecological functions in the Changsha-Zhuzhou-Xiangtan Urban Agglomeration, China. Land Use Policy 2022, 117, 106112. [Google Scholar] [CrossRef]
  73. Wang, H.; Zhang, C.; Yao, X.; Yun, W.; Ma, J.; Gao, L.; Li, P. Scenario simulation of the tradeoff between ecological land and farmland in black soil region of Northeast China. Land Use Policy 2022, 114, 105991. [Google Scholar] [CrossRef]
  74. Long, X.; Lin, H.; An, X.; Chen, S.; Qi, S.; Zhang, M. Evaluation and analysis of ecosystem service value based on land use/cover change in Dongting Lake wetland. Ecol. Indic. 2022, 136, 108619. [Google Scholar] [CrossRef]
  75. Kang, J.; Zhang, X.; Zhu, X.; Zhang, B. Ecological security pattern: A new idea for balancing regional development and ecological protection. A case study of the Jiaodong Peninsula, China. Glob. Ecol. Biogeogr. 2021, 26, e01472. [Google Scholar] [CrossRef]
Figure 1. Study area.
Remotesensing 15 03837 g001
Figure 2. Research framework.
Remotesensing 15 03837 g002
Figure 3. Integrated urban–rural planning model based on ESAs and ESPs.
Remotesensing 15 03837 g003
Figure 4. NES evaluation.
Remotesensing 15 03837 g004
Figure 5. SES evaluation.
Remotesensing 15 03837 g005
Figure 6. ESS evaluation.
Remotesensing 15 03837 g006
Figure 7. CES evaluation.
Remotesensing 15 03837 g007
Figure 8. Proportion of the ES area in Yangxian.
Remotesensing 15 03837 g008
Figure 9. CES statistics of ADs in Yangxian.
Remotesensing 15 03837 g009
Figure 10. Results of ESPs construction in Yangxian. (a) Comprehensive resistance surface; (b) Ecological sources; (c) Ecological corridors; (d) Ecological nodes; (e) Ecological network.
Remotesensing 15 03837 g010
Figure 11. Distribution proportion of ecological patterns at different resistance levels.
Remotesensing 15 03837 g011
Figure 12. Analysis of the ecological pattern in various administrative regions of Yangxian. (a) Main Source; (b) Secondary source; (c) Main corridor; (d) Secondary corridor; (e) Ecological node.
Remotesensing 15 03837 g012
Figure 13. Quantitative three-dimensional graph illustrating the relationships between CES, ESPs, and ADs.
Remotesensing 15 03837 g013
Figure 14. Optimization scheme of spatial pattern in Yangxian.
Remotesensing 15 03837 g014
Table 2. ESA model implementation.
TypeIndicatorGrading/Assignment
Insensitive/1Lightly
Sensitive/3
Moderately
Sensitive/5
Highly
Sensitive/7
Extremely Sensitive/9
NESElevation (m)<703703–10251025–13891389–1848>3020
Aspect (°)FlatShadyHalf shadyHalf sunnySunny
RDLS (m)0–6060–120120–200200-280>280
River (m)1500–42521000–1500500–1000200–5000–200
NDVI−0.195–0.27520.2752–0.44470.4447–0.54350.5435–0.62350.6235–0.849
SESLand useConstruction land,
unused land
Farmland,
general
water
Shrubland,
grassland,
orchard
Forest-
land
Waters,
wetland,
bare land
Population (people/km2)6.4194–8.45084.6852–6.41942.6720–4.68521.5118–2.67201.2834–1.5118
Residential land (m)0–100100–300300–500500–1000>1000
Urban constructionESHSMSBSUS
Village constructionESHSMSBSUS
ESSEcological redlines (m)>20001500–20001000–1500500–10000–500
Landscape resource (m)>20001000–2000500–1000200–5000–200
Geological disaster (count/km2)0.0000–0.00910.0091–0.03260.0326–0.06770.0677–0.13410.1341–0.2671
Soil erosion1–2.022.02–2.4592.459–2.8672.867–3.3223.322–5
Flood risk (m)>700 m600–700 m500–600 m400–500 m<400 m
Table 3. Ecological resistance coefficients based on sensitivity evaluation.
Sensitivity Evaluation ScoreEcological Sensitivity
Level
Ecological Resistance
Coefficient
1Insensitive1
3Lightly sensitive2
5Moderately sensitive3
7Highly sensitive4
9Extremely sensitive5
Table 4. Weight determination based on the AHP–PCA combined weighting method.
CriterionWAHPIndicator WAHPWPCAW*Final Weight
NES0.3325Elevation0.07850.21860.11230.0373
Aspect0.16480.27490.29660.0986
RDLS0.11650.20560.15670.0521
River0.44050.02600.07500.0249
NDVI0.19970.27490.35940.1195
SES0.1397Land use0.4690.06550.18020.0252
Population0.09270.30880.16800.0235
Residential land0.05250.06870.02120.0030
Urban construction0.1580.27810.25780.0360
Village construction0.22780.27890.37280.0521
ESS0.5278Ecological redlines0.38580.14890.30760.1624
Landscape
resources
0.1560.28870.24130.1273
Geological disaster0.08940.16470.07890.0416
Soil erosion0.21150.12780.14480.0764
Flood risk0.15730.26990.22740.1200
Disclaimer/Publisher’s Note: The statements, opinions and data contained in all publications are solely those of the individual author(s) and contributor(s) and not of MDPI and/or the editor(s). MDPI and/or the editor(s) disclaim responsibility for any injury to people or property resulting from any ideas, methods, instructions or products referred to in the content.

