

Application of UAS with Remote Sensing Sensors for the Location of Marks in the Archaeological Site of the Europos, Greece

School of Spatial Planning and Development, Aristotle University of Thessaloniki, 54124 Thessaloniki, Greece
*
Author to whom correspondence should be addressed.
Remote Sens. 2023, 15(15), 3843; https://doi.org/10.3390/rs15153843
Submission received: 26 June 2023
/
Revised: 26 July 2023
/
Accepted: 31 July 2023
/
Published: 2 August 2023
(This article belongs to the Special Issue Advancement of Remote Sensing and UAS in Cartography and Visualisation)
Abstract
:The Archaic Acropolis of Europos (region of Central Macedonia, Greece) is an important archaeological site, which was inhabited since the 7th century BC up to the 4th century AD. In the lowland area, south of the acropolis and a short distance away, archaeologists speculate that the extensive ancient cemetery of the acropolis, which is a result of its long-term habitation, was located there. In an effort to locate marks that will support this view, WingtraOne GEN II, one of today’s leading Uncrewed Aircraft Systems, was used to collect RGB and multispectral images. After the production of the necessary digital surface models and orthophotomosaics, index maps related to the crops were created. The total of the products allowed the visual identification of 123 marks, which are probably attributed to hitherto unknown covered ancient tombs. In addition, marks of unknown covered ditches of long length were found in the plain area, and on the outskirts of the acropolis marks of its possible wall and the base of one of its towers.
Keywords:
UAS; remote sensing; RGB sensor; MS sensor; digital surface model; orthophotomosaic; indexes; crop marks; ancient tomb; Europos1. Introduction
Aerial and remote sensing archaeology is founded on the ability to observe surface phenomena associated with the presence of objects below the ground surface [1]. These are methods of archaeological prospection (non-destructive techniques) that indicate possible locations with covered archaeological remains on the images (known as marks). The archaeological excavation follows and documents or rejects the archaeological interest of the sites. Underground archaeological remains can affect bare ground or vegetation, causing a lack of moisture (presence of a solid structure below ground, e.g., building foundations) or excess moisture (presence of an open structure below ground, e.g., a ditch) in the ground that covers them. Thus, by extension, differences in the height and/or quality of vegetation are observed on the one hand, and differences in the surface temperature of the object of observation (soil or vegetation) on the other (Figure 1). These differences are captured as marks in the images of the aerial or satellite sensors [2]. To date, countless new discoveries of underground archaeological remains have been made through aerial and remote sensing archaeology, utilizing a variety of sensors (RGB, multispectral (MS), Thermal camera, Lidar) [3,4,5,6,7,8,9]. For example, Negula et al., 2020, with the help of vegetation indices generated from Sentinal-2 satellite images, identified underground Roman roads and walls [3]. Additionally, Abate et al., 2020, using Sentinal-2 satellite images and transforming them with the Principal Component Analysis technique, identified marks of circular or sub-circular shapes of Neolithic settlements, geometric shapes of the Classical period, rectangular farmhouses of the medieval period and paleochannels and roads of different ages [4]. Hill et al., 2020, highlighted the importance of the combined use of thermal and Near Infrared (NIR) images from UAS for the identification of underground archaeological remains [5]. According to the research/review by Adamopoulos and Rinaudo, 2020, UAS-based archaeological remote sensing applications and, especially, those dealing with the beyond-visible spectra to identify MS contrast variations are scarce [6]. Converging towards this, Materazzi and Pacifici, 2022, added that while UAS are used in many applications of archaeological interest, few of those applications aim to identify marks of covered archaeological remains, and even fewer of those exploit MS images. In their research, the generation of vegetation indices exploiting MS images from UAS enabled the identification of crop marks of covered archaeological remains [7].
In this paper, the new WingtraOne GEN II UAS with RGB and MS sensors was used to locate marks of unknown underground structures in the area of ancient Europos (region of Central Macedonia, Greece), in a site of intense archaeological interest.
The Archaic Acropolis of Europos (40°53′15.5″N 22°33′20.0″E, Figure 2) is located 55 km northwest of Thessaloniki (Greece) and just 15 km from ancient Pella (capital of the Macedonian Kingdom, Greece).
With the absence of written sources until the 7th century BC, the historical significance of the site is indirectly interpreted through significant archaeological finds. From the 6th century BC onwards, literary sources are added to the archaeological observations, from which the possibility of the existence of a wall to protect the acropolis emerges (Figure 2, location 1). In the wider region there is an abundance of archaeological finds from the Classical and Hellenistic periods. Additionally, Seleucus of Nicator (founder of the Seleucid dynasty and founder of important cities of the Hellenistic period) came from Europos. During the early Roman hegemony, Europos continued to flourish, and barbarian raids are often mentioned, which were successfully countered by Roman soldiers. The acropolis also prospered in the 1st to 3rd centuries AD, while in the 4th century AD it gradually declined. In the 5th to 6th centuries AD, the acropolis was abandoned by the inhabitants and was home only to pottery workshops. Excavations of the acropolis began in 1938, when a three-chamber vaulted tomb and sealed roof tiles with the inscription ‘Europos’ were uncovered [10]. In 1989, through geophysical surveys, a large part of the subsoil of the acropolis was mapped in order to rediscover the (previously underground) tomb of 1938 [11]. The results were used for targeted excavation studies from 1991 to 1995, where part of the urban fabric of the acropolis, burial monuments and a pottery kiln were uncovered [12]. This provided information on the spatial organization of the city, such as the urban system, the locations of workshops, residences and streets. Nevertheless, the acropolis of the archaic city is hardly excavated. Today, the site of the Roman and early Christian cemetery (Figure 2, location 3) southwest of the acropolis has been developed as an area open to visitors (with or without shelters), and it is located within the organized archaeological site. In addition, a cluster (Figure 2, location 4) of three tombs (Macedonian tomb, cist and burial vault) survives in the fields southwest of the acropolis [10].
From the above, it can be concluded that the area defined by the southern boundaries of the acropolis (Figure 2, location 1), the open archaeological site (Figure 2, locations 2 and 3), the three ancient tombs (Figure 2, location 4), and the steep slopes to the east of Figure 2, are of particular interest and merit investigation to locate marks of underground archaeological remains. It has an area of 144,000 sqm, it does not present a strong relief (plain area) and is almost universally covered by wheat.
2. Equipment
The WingtraOne GEN II UAS (Figure 3) was used in this study. It is a fixed-wing, VTOL—vertical take-off and landing type UAS. Its weight is 3.7 kg and without the central base it has dimensions 125 × 68 × 12 cm. Its maximum flight time is up to 59 min. It has an integrated Global Positioning System (GPS), while for the calculation of the coordinates of the centres of the images it receives, it uses a Post-Processing Kinematic (PPK) system. The flight plan and all flight parameters are defined through the WingtraPilot® software. It has two propellers and takes off (and lands) vertically. After take-off it turns horizontally and continues its course as a fixed-wing aircraft (and vice versa during landing). It has two sensors, the RGB and the multispectral (MS) sensors (Table 1) [13].
The Topcon HiPer SR GPS was used to collect the necessary data that helped to calculate the coordinates of the acquisition centres of each image in the Greek Geodetic Reference System 87 (GGRS87). It has a real-time horizontal positioning accuracy of ~10 mm and a vertical accuracy of ~15 mm.
3. Methods, Processing and Results
3.1. Flight Plan and Image Collection
Flights were conducted on 6 May 2022 from 10:00 am to 12:30 pm. The flight with the RGB sensor was plotted with 70% side and front overlap images (Figure 4). Twelve strips were implemented, the flight height was 90 m (the minimum allowed by the UAS software for the RGB sensor), the expected (and ultimately actual) spatial resolution of the images was 1.2 cm, the flight time was 13 min and 27 s, and a total of 398 RGB images were collected.
For the MS sensor, the flight was planned with 70% side and front overlap images (Figure 5). Fourteen strips were implemented, the flight height was 100 m (which is the minimum allowed by the UAS software for the MS sensor), the expected (and eventually actual) spatial resolution of the images was 6.8 cm, the flight time was 15 min and 8 s, and a total of 450 MS images were collected.
3.2. Terrestrial Data Collection and Image Processing
The WingtraOne GEN II has a built-in multi-frequency (L1–L2 included) PPK GNSS antenna, which ensures image geotag correction after the flight. PPK is one method to correct the location of UAS mapping data and remove the need for a large number of Ground Control Points (GCPs). For projects requiring accuracy proof, only three ground points should be placed and used as checkpoints to verify the accuracy of the project [13].
The GPS (Topcon Hiper SR) was initially used to measure the X, Y and Z coordinates of a random point (considered as the basis of the subsequent measurements to follow) close (about 15 m) to the home position of the UAS. The GPS was connected to the network of multiple permanent stations in the country available to Topcon, and the location (X, Y and Z) of the point was calculated with an accuracy of a few millimetres using the real-time kinematic (RTK) method. Then, with the same GPS and for the same point, continuous location measurements were made using the static GPS surveying method, for 30 min before the start of the first flight, during the two flights and for 30 min after completion of the second flight. In the office, utilizing the high-accuracy coordinates of the above point, its static measurements and the UAS’s multi-frequency PPK GNSS antenna measurements, the coordinates of the acquisition centres of each image (RGB and MS) of the flights were corrected and calculated, finally giving 3D accuracies of 2 to 3 cm.
Then, utilizing Agisoft Metashape® software, the block of RGB images (without GCPs) was resolved with an RMSE of 1.3 cm, and a digital surface model was generated with a spatial resolution of 2.4 cm and an orthophotomosaic spatial resolution of 2 cm (Figure 6). The processing in Agisoft Metashape® follows a simple workflow. First the images (with known coordinates of the acquisition centres) are imported into the software and the GGRS87 coordinate system is defined. Then, the aligning of images (align photos with high accuracy) is performed and at the same time a sparse point cloud model based on matching pixel groups between images is generated. Then, the dense point cloud is created (build dense cloud, high-quality and aggressive depth filtering). Next the 3D mesh generation (build mesh) follows, where the point cloud is transformed into an actual 3D surface. The following step is to build the texture (build texture), i.e., the coloured overlay of the generated 3D mesh. The last step is to generate a DSM and orthophotomosaic. In the case of the MS sensor, the process is the same as above but initially it is necessary to calibrate the spectral information with spectral targets. Therefore, before and after the flight the suitable calibration target of the Micasense RedEdge-MX was imaged [14,15,16,17,18,19,20,21]. The target was automatically detected by the Agisoft Metashepe® and the reflectance values of all spectral bands were calculated. The resolution (without GCPs) was RMSE 1.2 cm, the resulting digital surface model had a spatial resolution of 28 cm and the orthophotomosaic had a spatial resolution of 7 cm (Figure 7).
To check the horizontal and elevation accuracy of the final products (digital surface models (DSMs) and orthophotomosaics), three targets on the ground (Figure 8) were measured with GPS using the RTK method before the flights. These are simple paper targets that we created, 32 × 32 cm in size. Their coordinates (X, Y and Z) were then compared with the coordinates obtained from the products (DSMs and orthophotomosaics) of the image processing.
3.3. Production of Indexes
Because the marks will be visually observed on crops, since the wheat in the study area is about 1 m high (Figure 3), index maps related to the crops were created. More specifically, the following indexes were exploited: NDVI, optimized soil-adjusted vegetation index (OSAVI), SAVI, SR, NDRE, GSAVI, GNDVI, GCI, GRVI, NLI, NDVIRE, MSR and NGRDI (Table 2). They are derived from the arithmetic operations of combining some of the bands of the MS sensor [22,23,24,25,26,27,28,29,30,31,32,33]. The index formulas were created in the Agisoft Metashepe® [2], and the corresponding index maps were then produced (Figure 9 and Figure 10).
4. Discussion
The use of UASs that do not subsequently impose the collection of GCPs to produce DSMs and orthophotomosaics of high-horizontal and altitudinal accuracy results in a noticeable reduction in field time, as it avoids the time-consuming process of placing and measuring at least 20 GCPs [34] to resolve, and another 20 CPs to check the produced products.
For the three targets placed on the ground (Figure 8), their coordinates (X, Y and Z) were measured with GPS (RTK method) before the flights. Their comparison with the coordinates calculated in the orthophotomosaics (X and Y value extraction) and in the DSMs (Z value extraction) proved that the accuracies calculated in Agisoft Metashepe®, both for RGB and MS images, were real.
In general, the indexes were not decisive for the identification of marks of possible underground archaeological remains (the word “possible” should always be used, as only systematic archaeological research and excavation can establish that detected anomalies in the soil or vegetation are due to the presence of archaeological remains below ground). The marks were mainly located in the Near Infrared (NIR) band of the orthophotomosaic. In some cases the indexes improved the visual observation of the marks, and in particular the index that allowed this was SR (e.g., Figure 9 and Figure 10).
The total number of marks detected and their spatial distribution in the study area are presented in Figure 11.
A total of 123 squared positive crop marks with dimensions from 1 × 1.4 m to 5 × 6.6 m were identified (e.g., Figure 9 and Figure 10, Figure 11 positions of marks F9 and F10, respectively). According to the archaeologists, the squared marks are probably due to open ancient tombs (probably looted). Looking at Figure 11, the scatter of possible burial remains below ground is evident throughout the study area. Thus, the initial feeling of the archaeologists that this study area was used, perhaps, as a cemetery of the acropolis of Europos is probably confirmed.
The blue gridded surface of Figure 11 (south of location 3) shows marks that need further investigation (e.g., repeat shots to visually improve the marks), as the marks are random and not clearly geometric.
Additionally, two marks were identified which may have some relationship to each other. North of Figure 11, a linear negative crop mark of about 40 m long and about 1–2 m wide (Figure 12a–c, Figure 11 position of mark F12) is observed in the RGB image (which is optimally observed in the SR image). Its type (negative crop mark) is unique in the study area and is perhaps attributed to part of the acropolis wall (underground remains). Additionally, at a short distance and to the west of the above mark, a squared positive crop mark measuring 9 m × 17 m (Figure 12d–f, Figure 11 position of mark F12) is detected in the RGB image (observed optimally in the NIR and SR images), which is attributed, perhaps, to one of the tower bases of the wall (possible existence of perimeter foundations holding large amounts of moisture inside the structure).
Finally, two additional linear positive crop marks were identified, one about 52 m long and about 1.2 m wide (Figure 12d–f, Figure 11 position of mark F12) and the second about 57 m long and about 1–3 m wide (Figure 13, Figure 11 position of mark F13). These linear marks are striking because of their type (positive crop marks), implying the presence of an open structure below ground, and therefore cannot be attributed to ancient roads, but to ancient ditches.
5. Conclusions
The utilization of UASs that allows the production of orthophotomosaics of high spatial accuracy without the use of GCPs is highly valuable as it significantly reduces the time spent in the field. Of course, the production of this metric-quality product is not always necessary. In other words, if GCPs with coordinates (X, Y and Z) from, e.g., the National Cadastre with a horizontal and vertical accuracy of 1–2 m and 2–3 m, respectively, were used in this work, the result of the localization of the marks in the images would be the same, and the difference between the calculated 3D positions of the marks and their actual positions would not be prohibitive.
The indexes in some cases helped in visual observation of the marks. In particular, the SR index helped in this regard. In general, however, there was no mark that was not detected (even with a low intensity of visual observation) in the RGB or/and NIR images.
Of particular interest is that the dimensions of the squared marks correspond to the dimensions of the existing (Figure 11, position 3) burial remains of the visited archaeological site. In addition, the number of marks is particularly large. All this may confirm the archaeologists’ initial assumptions that the study area was used as the cemetery of the acropolis of Europos. Specific exploratory excavation sections can be made at locations chosen by the archaeologists, which can be determined in the field with great spatial accuracy.
Author Contributions
Conceptualization, D.K.; methodology, D.K.; Data collection, D.K. and D.T.; Data Processing, D.K. and D.T.; Supervision, D.K.; writing—original draft preparation, D.K. and D.T.; writing—review and editing, D.K. All authors have read and agreed to the published version of the manuscript.
Funding
This research received no external funding.
Data Availability Statement
All data are available from the corresponding author upon reasonable request.
Acknowledgments
Thanks to the Georgia Stratouli (Head of the Ephorate of Antiquities of Kilkis, Greece) and Nektario Poulakaki (Head of the Department of Prehistoric and Classical Antiquities and Museums of the Ephorate of Antiquities of Kilkis, Greece) for permission to collect data. The cost for the publication of the paper is financed by Sub-Project 33: “Support for Actions of the School of Spatial Planning and Development”, cash reserves of ELKE pursuant to the 85588/Β9/Φ11/355/14-7-2021 decision of the Minister of Education and Religious Affairs.
Conflicts of Interest
The authors declare no conflict of interest.
References
- Bewley, R.H. Aerial survey for archaeology. Photogramm. Rec. 2003, 18, 273–292. [Google Scholar] [CrossRef] [Green Version]
- Kaimaris, D. Utilization of different sensors in UAS for the detection and optimal visual observation of the marks over buried ancient remains. Sci. Cult. 2022, 8, 129–145. [Google Scholar]
- Negula, D.; Moise, C.; Lazăr, M.A.; Rișcuța, C.N.; Cristescu, C.; Dedulescu, L.A.; Mihalache, E.C.; Badea, A. Satellite Remote Sensing for the Analysis of the Micia and Germisara Archaeological Sites. Remote Sens. 2020, 12, 2003. [Google Scholar] [CrossRef]
- Abate, N.; Abdelaziz Elfadaly, A.; Masini, N.; Lasaponara, R. Multitemporal 2016–2018 Sentinel-2 Data Enhancement for Landscape Archaeology: The Case Study of the Foggia Province, Southern Italy. Remote Sens. 2020, 12, 1309. [Google Scholar] [CrossRef] [Green Version]
- Hill, C.A.; Laugier, J.E.; Casana, J. Archaeological Remote Sensing Using Multi-Temporal, Drone-Acquired Thermal and Near Infrared (NIR) Imagery: A Case Study at the Enfield Shaker Village, New Hampshire. Remote Sens. 2020, 12, 690. [Google Scholar] [CrossRef] [Green Version]
- Adamopoulos, E.; Rinaudo, F. UAS-Based Archaeological Remote Sensing: Review, Meta-Analysis and State-of-the-Art. Drones 2020, 4, 46. [Google Scholar] [CrossRef]
- Materazzi, F.; Pacifici, M. Archaeological crop marks detection through drone multispectral remote sensing and vegetation indices: A new approach tested on the Italian pre-Roman city of Veii. J. Archaeol. Sci. Rep. 2022, 41, 103235. [Google Scholar] [CrossRef]
- Hollesen, J.; Jepsen, S.M.; Harmsen, H.H. The Application of RGB, Multispectral, and Thermal Imagery to Document and Monitor Archaeological Sites in the Arctic: A Case Study from South Greenland. Drones 2023, 7, 115. [Google Scholar] [CrossRef]
- Kaimaris, D.; Georgiadis, C.; Patias, P.; Tsioukas, V. Aerial and Remote Sensing Archaeology. Int. J. Comput. Methods Herit. Sci. 2017, 1, 58–76. [Google Scholar] [CrossRef]
- Savopoulou, T.; Giannakis, I. Highlighting the archaeological site of Europe: From planning to implementation. In Proceedings of the 26th Archaeological Work in Macedonia and Thrace, Thessaloniki, Greece, 10–12 May 2011. [Google Scholar]
- Tsokas, G.N.; Giannopoulos, A.; Tsourlos, P.; Vargemezis, G.; Tealby, J.M.; Sarris, A.; Papazachos, C.B.; Savopoulou, T. A large scale geophysical survey in the archaeological site of Europos (northern Greece). J. Appl. Geophys. 1994, 32, 85–98. [Google Scholar] [CrossRef]
- Oikonomidis, D.; Karamitrou, A.; Tsokas, G.N.; Astaras, T. Combined use of Satellite Remote Sensing, GIS, and Geophysical Data to Archaeological Research in Europos Area, Macedonia (Northern Greece). In Proceedings of the 31st EARSeL Symposium Remote Sensing and Geoinformation not only for Scientific Cooperation, Prague, Czech Republic, 30 May–2 June 2011. [Google Scholar]
- WingtraOne GEN II Drone, Technical Specifications. Available online: https://wingtra.com/wp-content/uploads/Wingtra-Technical-Specifications.pdf (accessed on 26 June 2023).
- Franzini, M.; Ronchetti, G.; Sona, G.; Casella, V. Geometric and radiometric consistency of parrot sequoia multispectral imagery for precision agriculture applications. Appl. Sci. 2019, 9, 5314. [Google Scholar] [CrossRef] [Green Version]
- Ahmed, O.S.; Shemrock, A.; Chabot, D.; Dillon, C.; Williams, G.; Wasson, R.; Franklin, S.E. Hierar-chicalland cover and vegetation classification using multispectral data acquired from an unmanned aerial vehicle. Remote Sens. 2017, 38, 2037–2052. [Google Scholar] [CrossRef]
- Miyoshi, G.T.; Imai, N.N.; Tommaselli, A.M.G.; Honkavaara, E.; Näsi, R.; Moriya, E.A.S. Radio-metric block adjustment of hyperspectral image blocks in the Brazilian environment. Int. J. Remote Sens. 2018, 39, 4910–4930. [Google Scholar] [CrossRef] [Green Version]
- Guo, Y.; Senthilnath, J.; Wu, W.; Zhang, X.; Zeng, Z.; Huang, H. Radiometric calibration for multispectral camera of different imaging conditions mounted on a UAS platform. Sustainability 2019, 11, 978. [Google Scholar] [CrossRef] [Green Version]
- Mafanya, M.; Tsele, P.; Botai, J.O.; Manyama, P.; Chirima, G.J.; Monate, T. Radiometric calibration framework for ultra-high-resolution UAS-derived orthomosaics for large-scale mapping of invasive alien plants in semi-arid woodlands: Harrisia pomanensis as a case study. Remote Sens. 2018, 39, 5119–5140. [Google Scholar] [CrossRef] [Green Version]
- Johansen, K.; Raharjo, T. Multi-temporal assessment of lychee tree crop structure using multi-spec-tralRPAS imagery. Int. Arch. Photogramm. Remote Sens. Spat. Inf. Sci. 2017, 42, 165–170. [Google Scholar]
- Honkavaara, E.; Khoramshahi, E. Radiometric correction of close-range spectral image blocks captured using an unmanned aerial vehicle with a radiometric block adjustment. Remote Sens. 2018, 10, 256. [Google Scholar] [CrossRef] [Green Version]
- Assmann, J.J.; Kerby, T.J.; Cunliffe, M.A.; Myers-Smith, H.I. Vegetation monitoring using multispectral sensors-best practices and lessons learned from high latitudes. J. Unmanned Veh. Syst. 2019, 7, 54–75. [Google Scholar] [CrossRef] [Green Version]
- Rondeaux, G.; Steven, M.; Baret, F. Optimization of soil-adjusted vegetation indices. Remote Sens. Environ. 1996, 55, 95–107. [Google Scholar] [CrossRef]
- Huete, A.R. A soil-adjusted vegetation index (SAVI). Remote Sens. Environ. 1988, 25, 295–309. [Google Scholar] [CrossRef]
- Moriarty, C.; Cowley, D.C.; Wade, T.; Nichol, C.J. Deploying multispectral remote sensing for multi-temporal analysis of archaeological crop stress at Ravenshall, Fife, Scotland. Archaeol. Prospect. 2019, 26, 33–46. [Google Scholar] [CrossRef] [Green Version]
- Boiarskii, B.; Hasegawa, H. Comparison of NDVI and NDRE Indices to Detect Differences in Vegetation and Chlorophyll Content. J. Mech. Contin. Math. Sci. 2019, 4, 20–29. [Google Scholar] [CrossRef]
- Peter, B.G.; Messina, J.P.; Carroll, J.W.; Zhi, J.; Chimonyo, V.; Lin, S.; Snapp, S.S. Multi-spatial resolution satellite and sUAS imagery for precision agriculture on smallholder farms in Malawi. Photogramm. Eng. Remote Sens. 2020, 86, 107–119. [Google Scholar] [CrossRef]
- Gitelson, A.A.; Kaufman, Y.J.; Merzlyak, M.N. Use of a green channel in remote sensing of global vegetation from EOS-MODIS. Remote Sens. Environ. 1996, 58, 289–298. [Google Scholar] [CrossRef]
- Gitelson, A.A.; Gritz, Y.; Merzlyak, M.N. Relationships between leaf chlorophyll content and spectral reflectance and algorithms for non-destructive chlorophyll assessment in higher plant leaves. J. Plant Physiol. 2003, 160, 271–282. [Google Scholar] [CrossRef] [PubMed]
- Motohka, T.; Nasahara, K.; Hiroyuki, O.; Satoshi, T. Applicability of Green-Red Vegetation Index for Remote Sensing of Vegetation Phenology. Remote Sens. 2010, 2, 2369–2387. [Google Scholar] [CrossRef] [Green Version]
- Marta, A.D.; Grifoni, D.; Mancini, M.; Orlando, F.; Guasconi, F.; Orlandini, S. Durum wheat in-field monitoring and early-yield prediction: Assessment of potential use of high resolution satellite imagery in a hilly area of Tuscany, Central Italy. J. Agric. Sci. 2015, 153, 68–77. [Google Scholar] [CrossRef]
- Chen, J.M. Evaluation of Vegetation Indices and a Modified Simple Ratio for Boreal Applications. Can. J. Remote Sens. 1996, 22, 229–242. [Google Scholar] [CrossRef]
- Hunt, E.R.; Cavigelli, M.; Daughtry, C.S.T.; Mcmurtrey, J.E.; Walthall, C.L. Evaluation of Digital Photography from Model Aircraft for Remote Sensing of Crop Biomass and Nitrogen Status. Precis. Agric. 2005, 6, 359–378. [Google Scholar] [CrossRef]
- Lussem, U.; Bolten, A.; Gnyp, M.; Jasper, J.; Bareth, G. Evaluation of RGB-based vegetation indices from UAS imagery to estimate forage yield in grassland. ISPRS-Int. Arch. Photogramm. Remote Sens. Spat. Inf. Sci. 2018, 42, 1215–1219. [Google Scholar] [CrossRef] [Green Version]
- Kaimaris, D. Image Fusion Capability from Different Cameras for UAS in Cultural Heritage Applications. Drones Auton. Veh. 2022, 1, 1–17. [Google Scholar]
Figure 1.
The anatomy of marks.
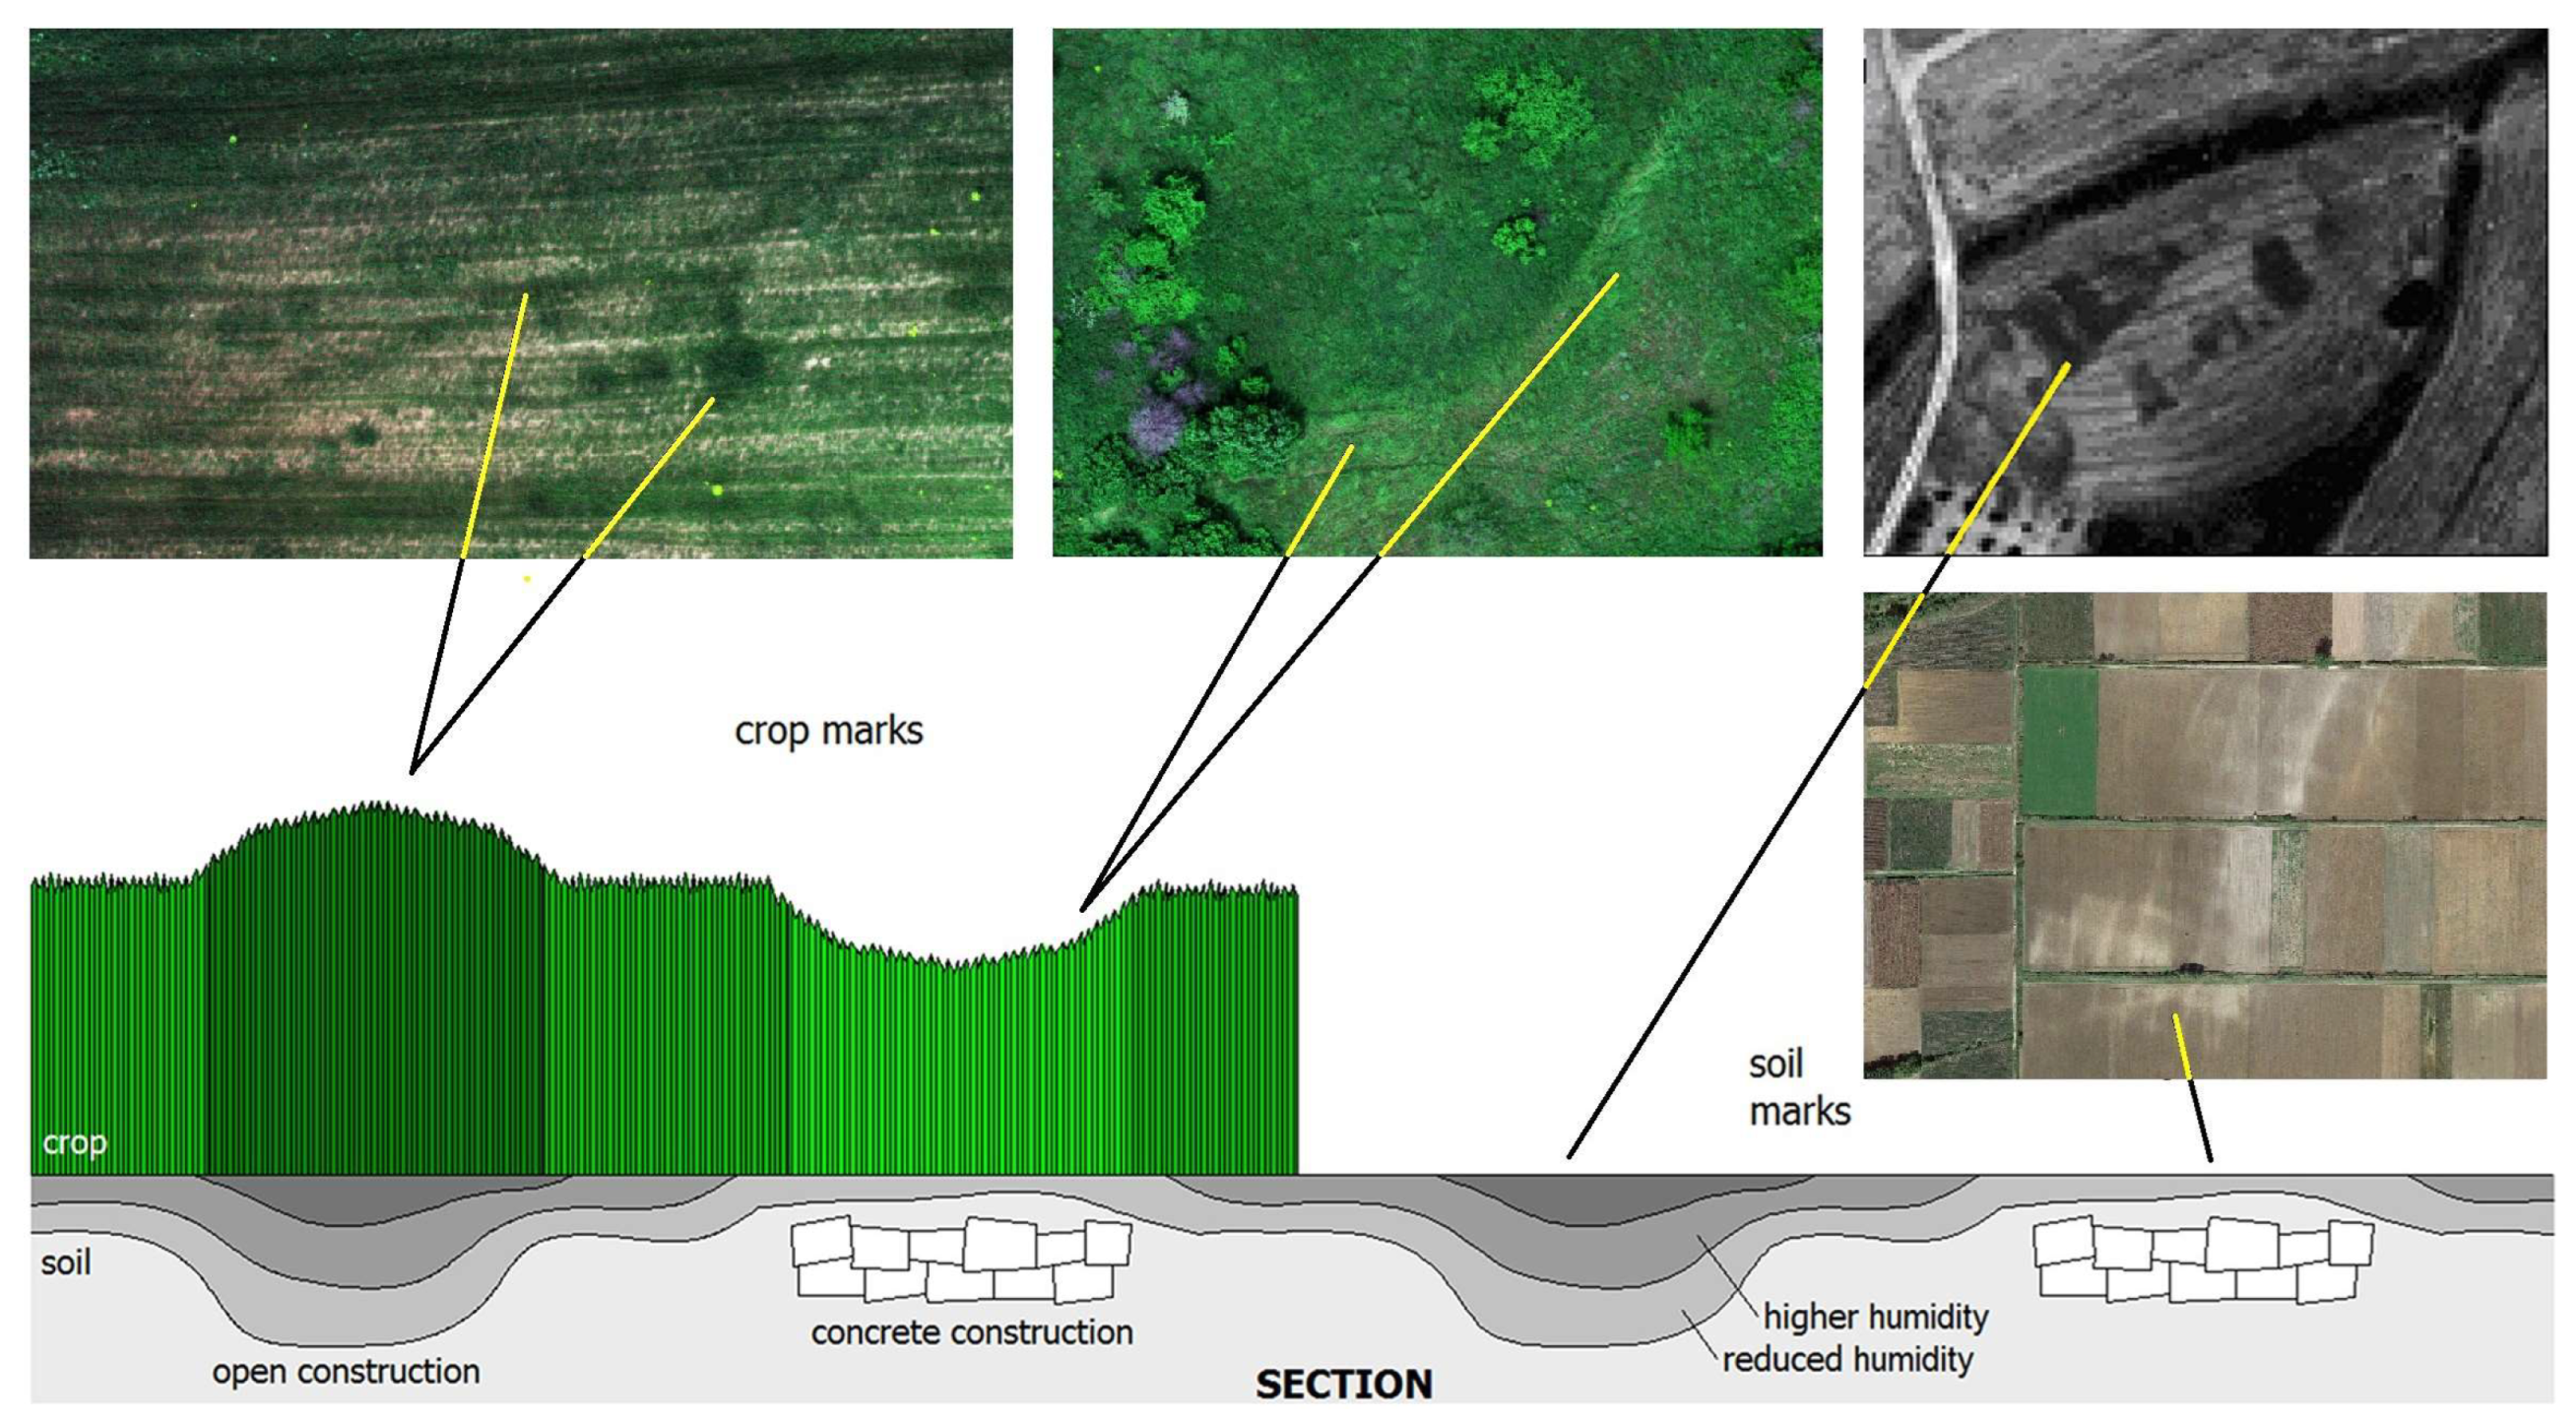
Figure 2.
Upper part: Greece in the European continent and Europos’ location in Greece. Lower part: The wider study area. Location 1, the archaic acropolis of Europos. Location 2, the sheltered information area for visitors to the archaeological site. Location 3, the open-air archaeological site (sheltered or not) of the Roman and early Christian cemetery (with black solid squares representing the existing open or closed ancient tombs). Location 4, the three sheltered ancient tombs (Macedonian tomb, cist and burial vault). The boundaries of the plots are depicted by a dotted line and the contour is shown in grey with a 4 m contour dimension. Only the road west of the acropolis to location 2 is paved, the rest are rural dirt roads.
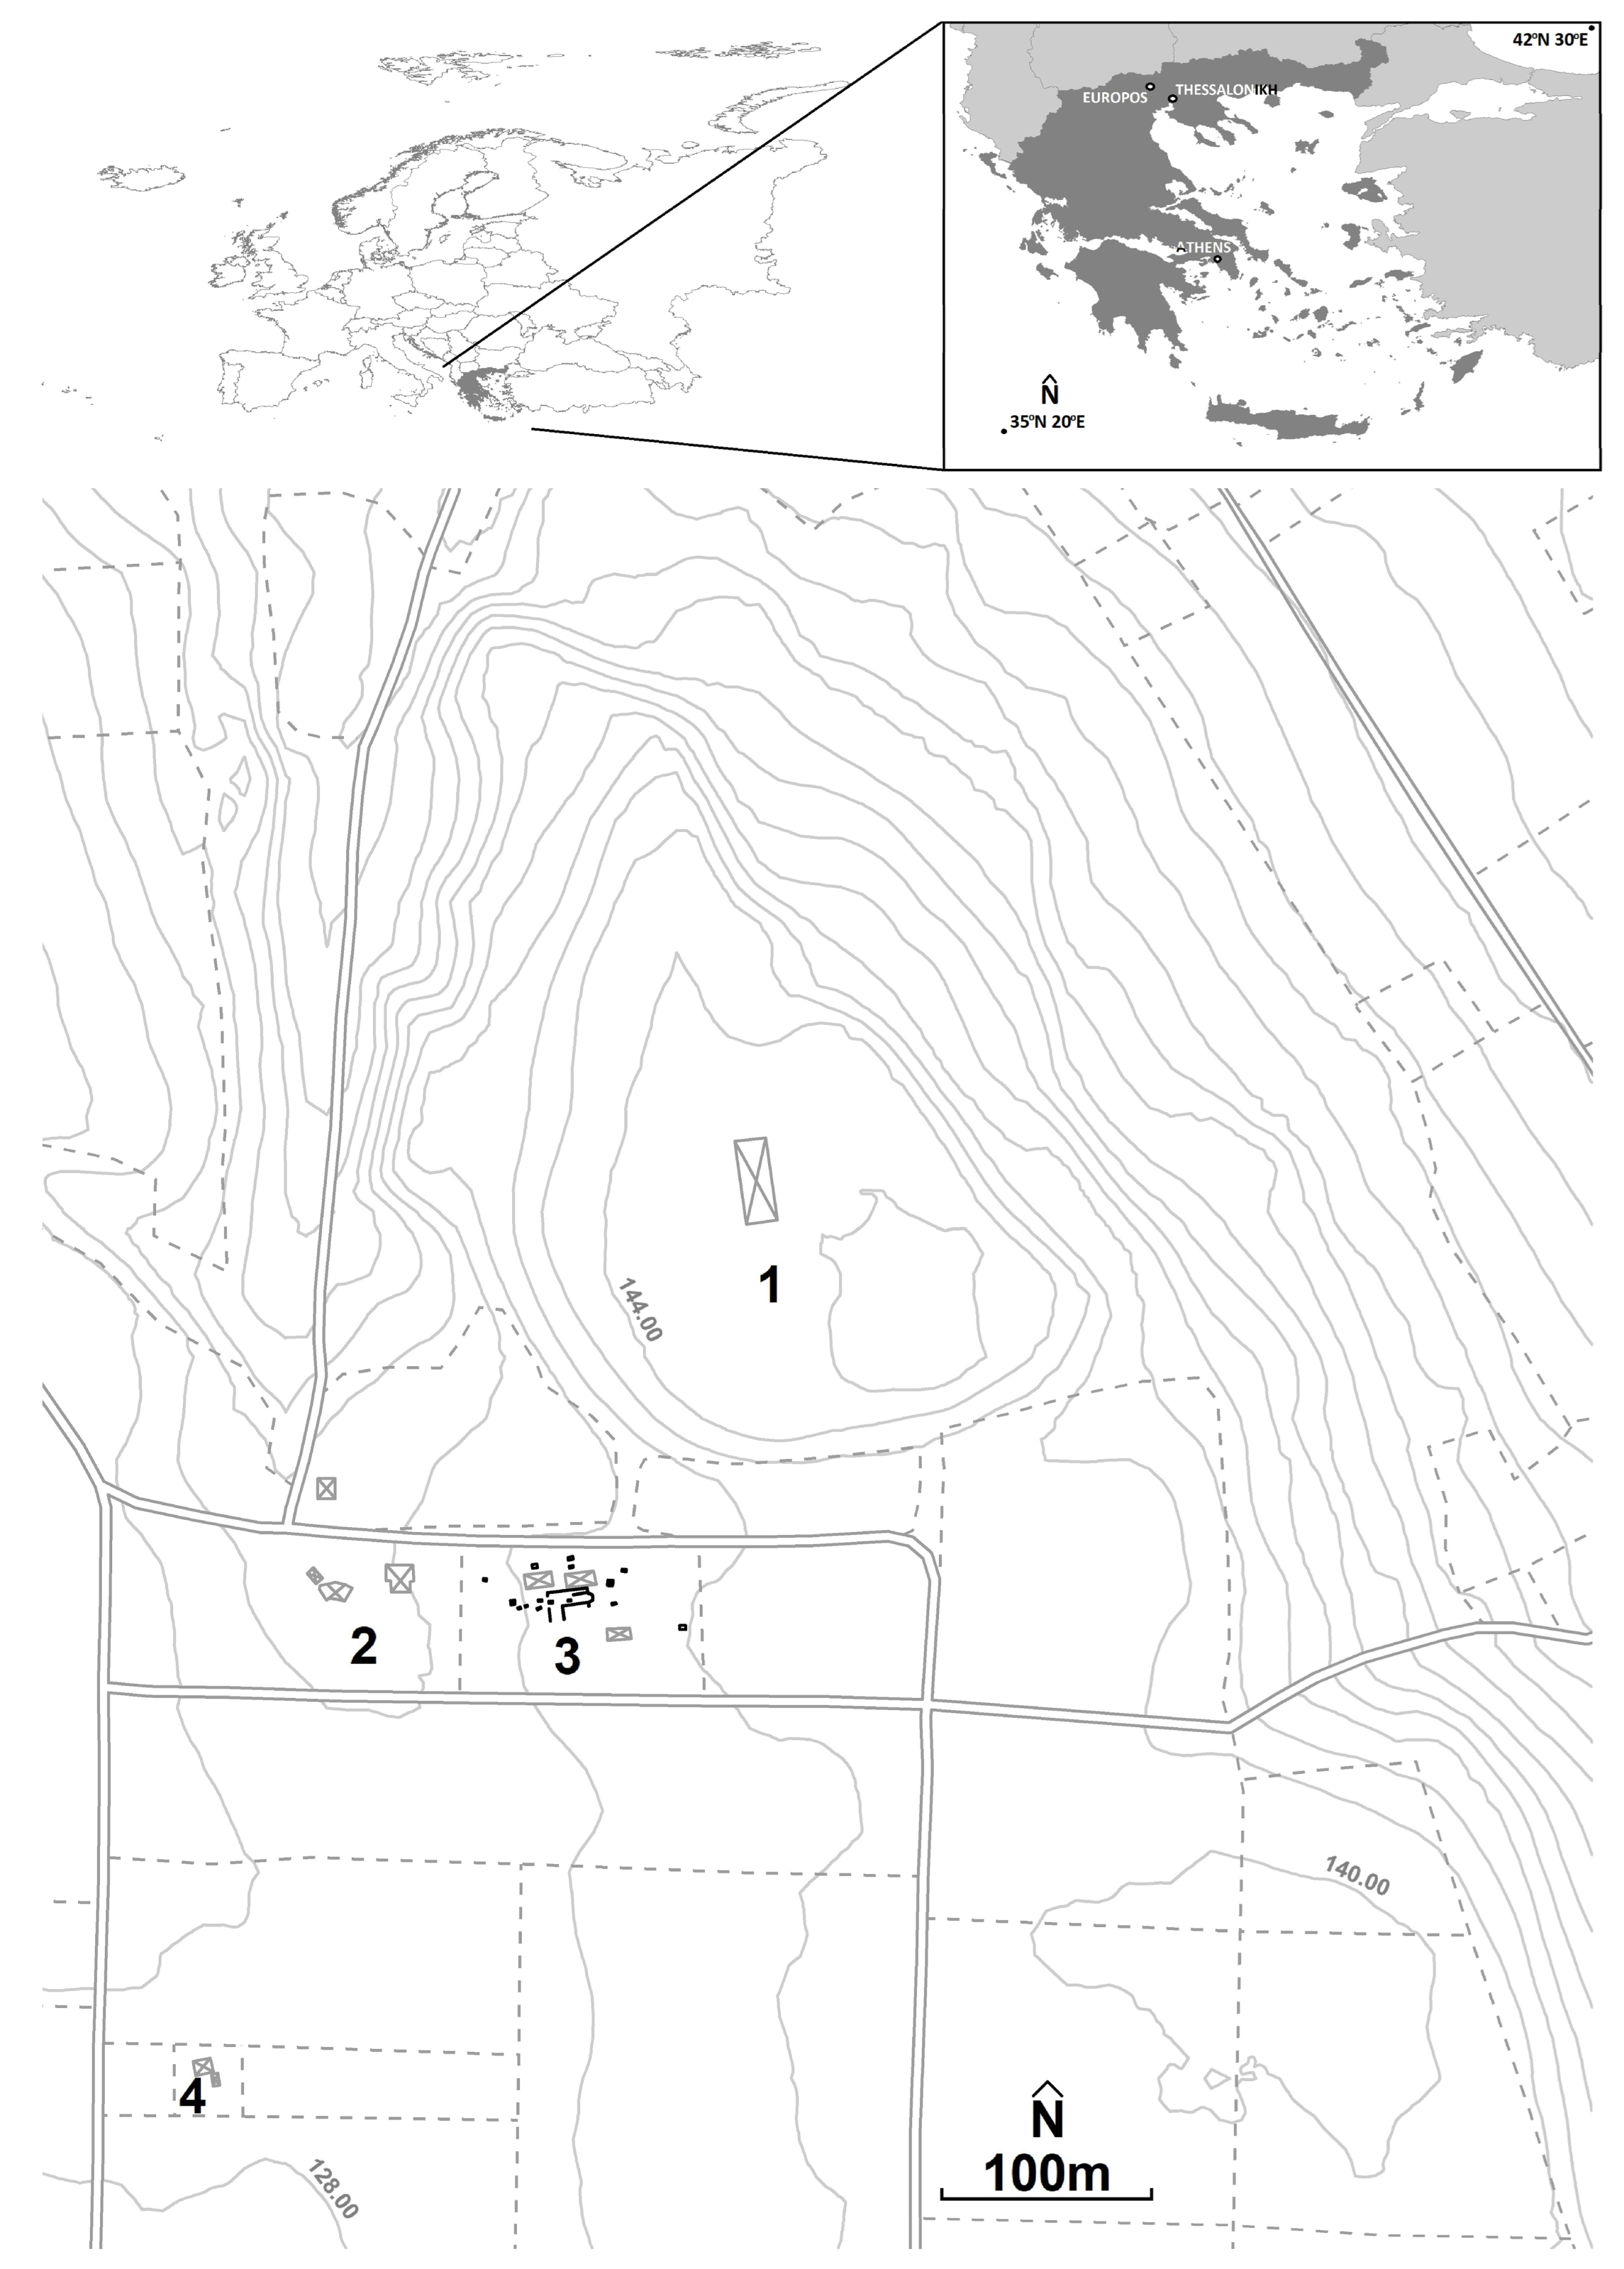
Figure 3.
WingtraOne GEN II at the study area.
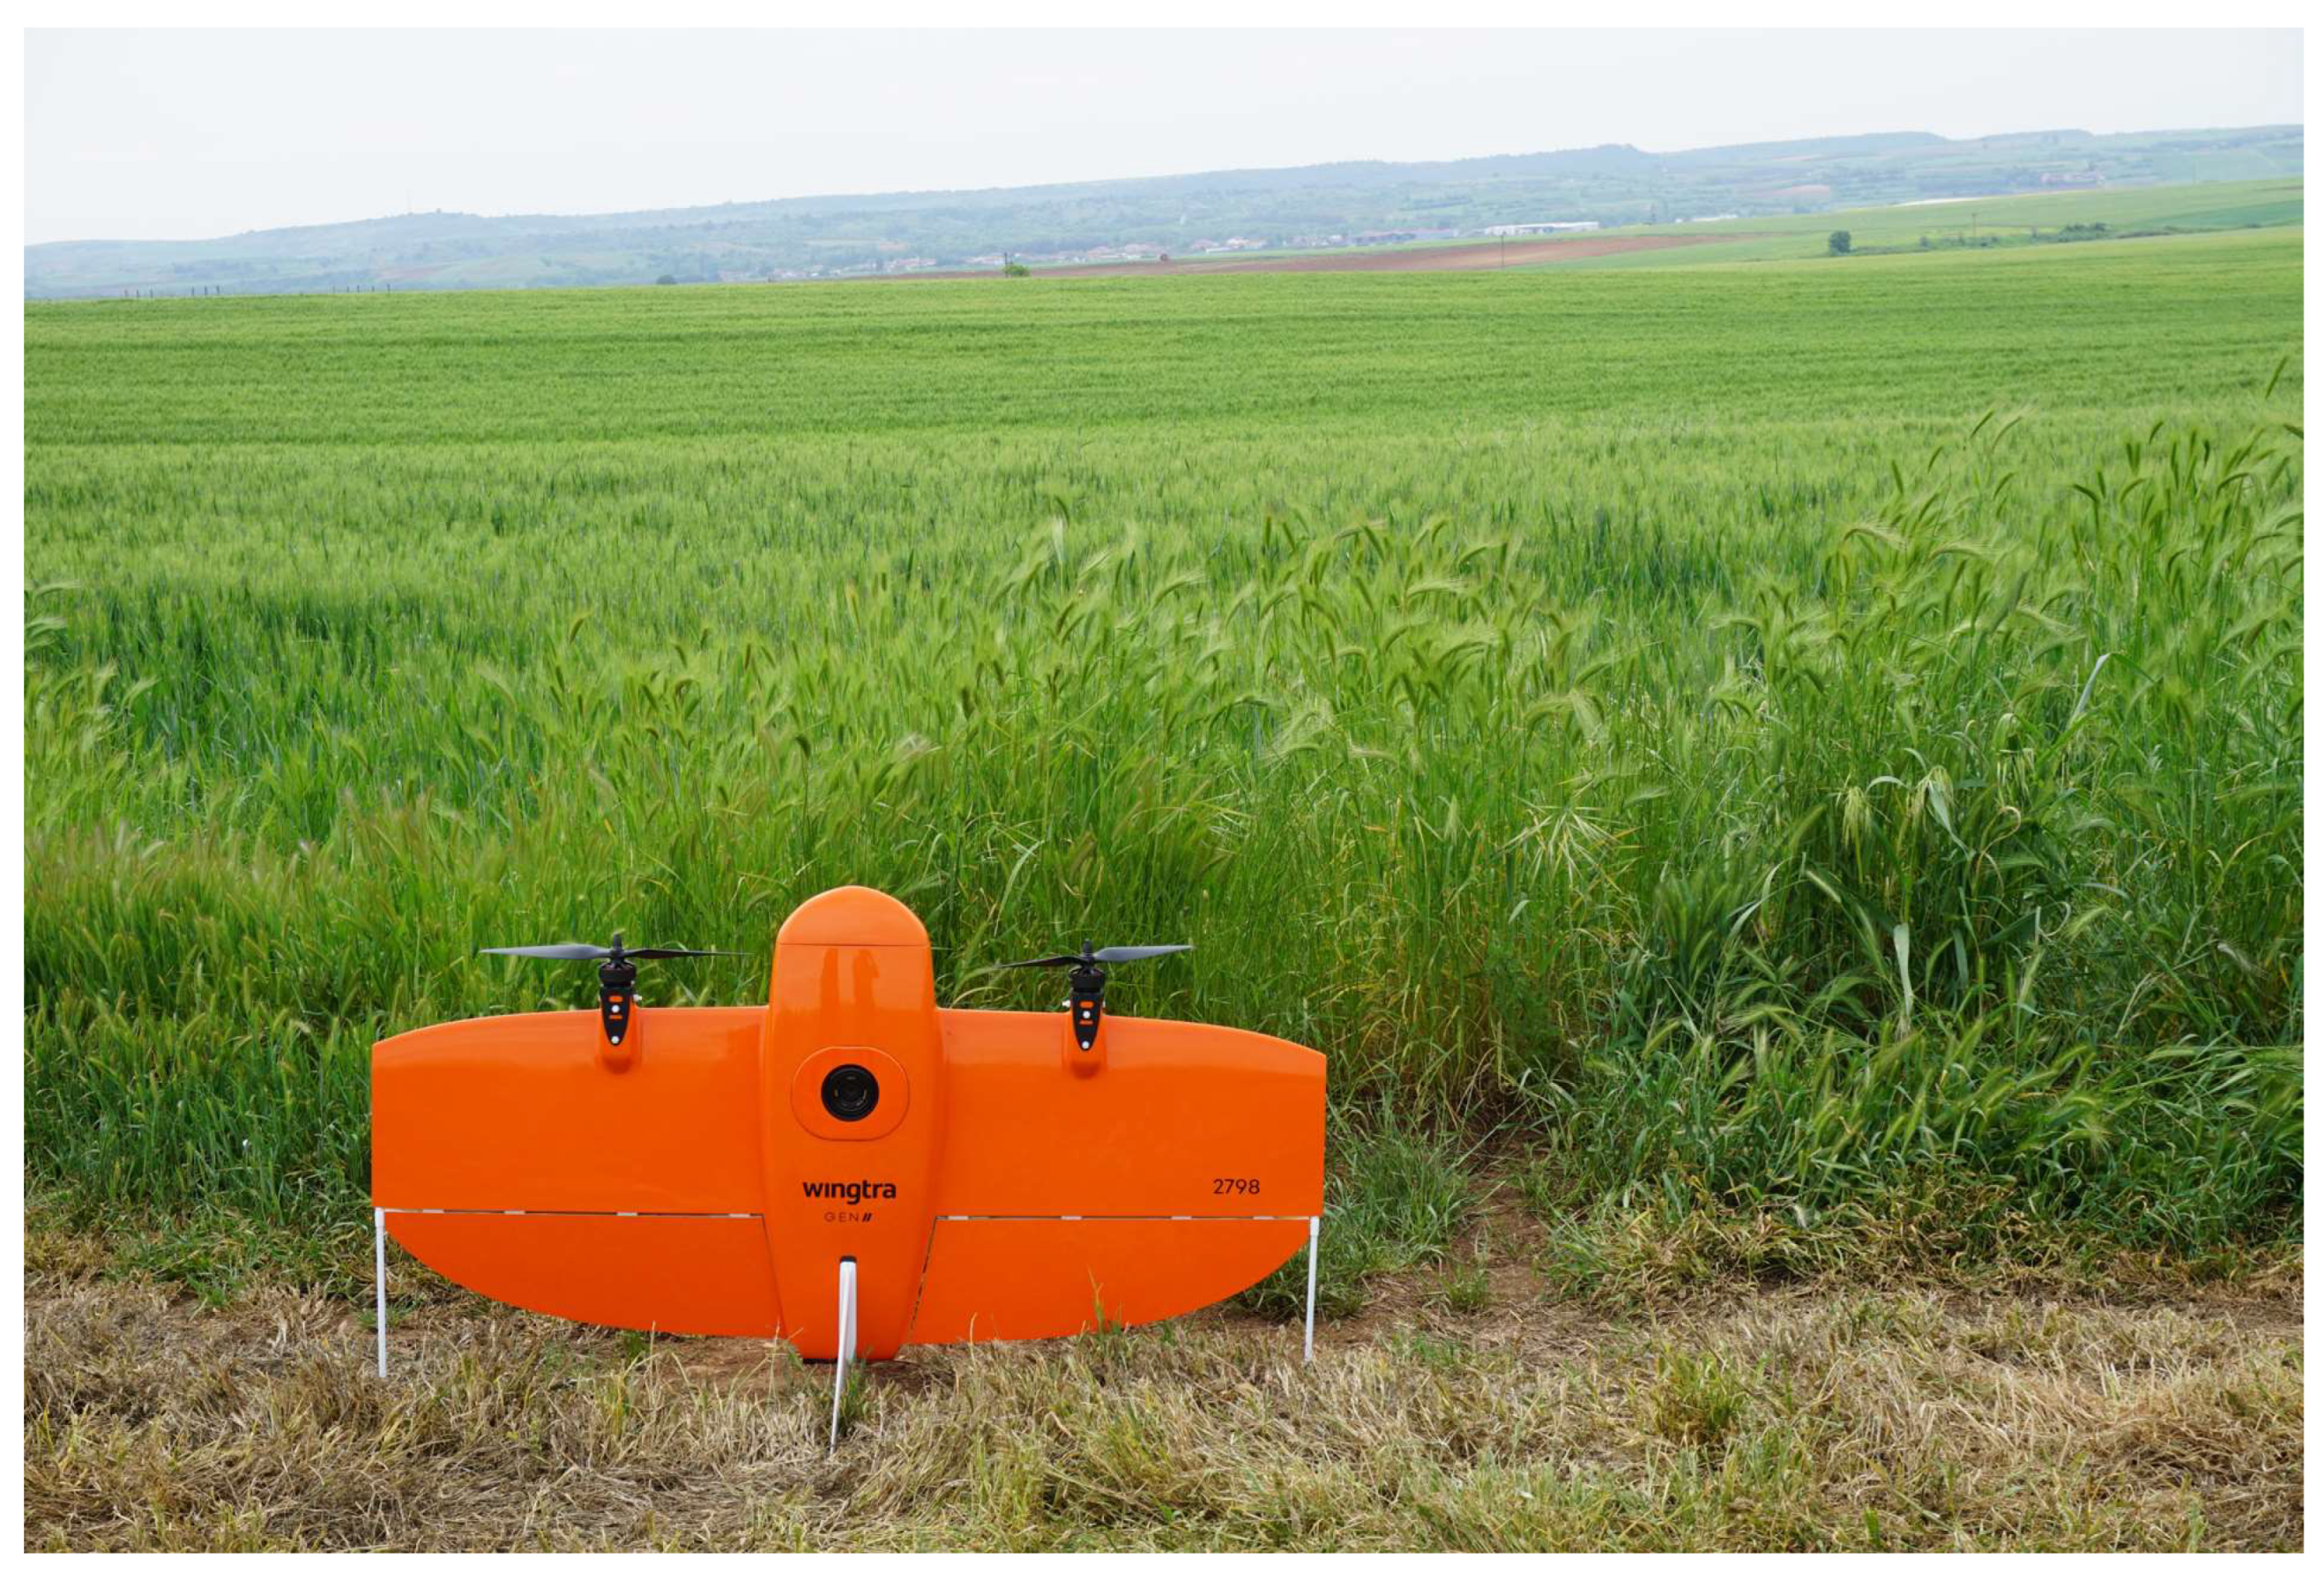
Figure 4.
Flight plan with the RGB sensor.

Figure 5.
Flight plan with the MS sensor.
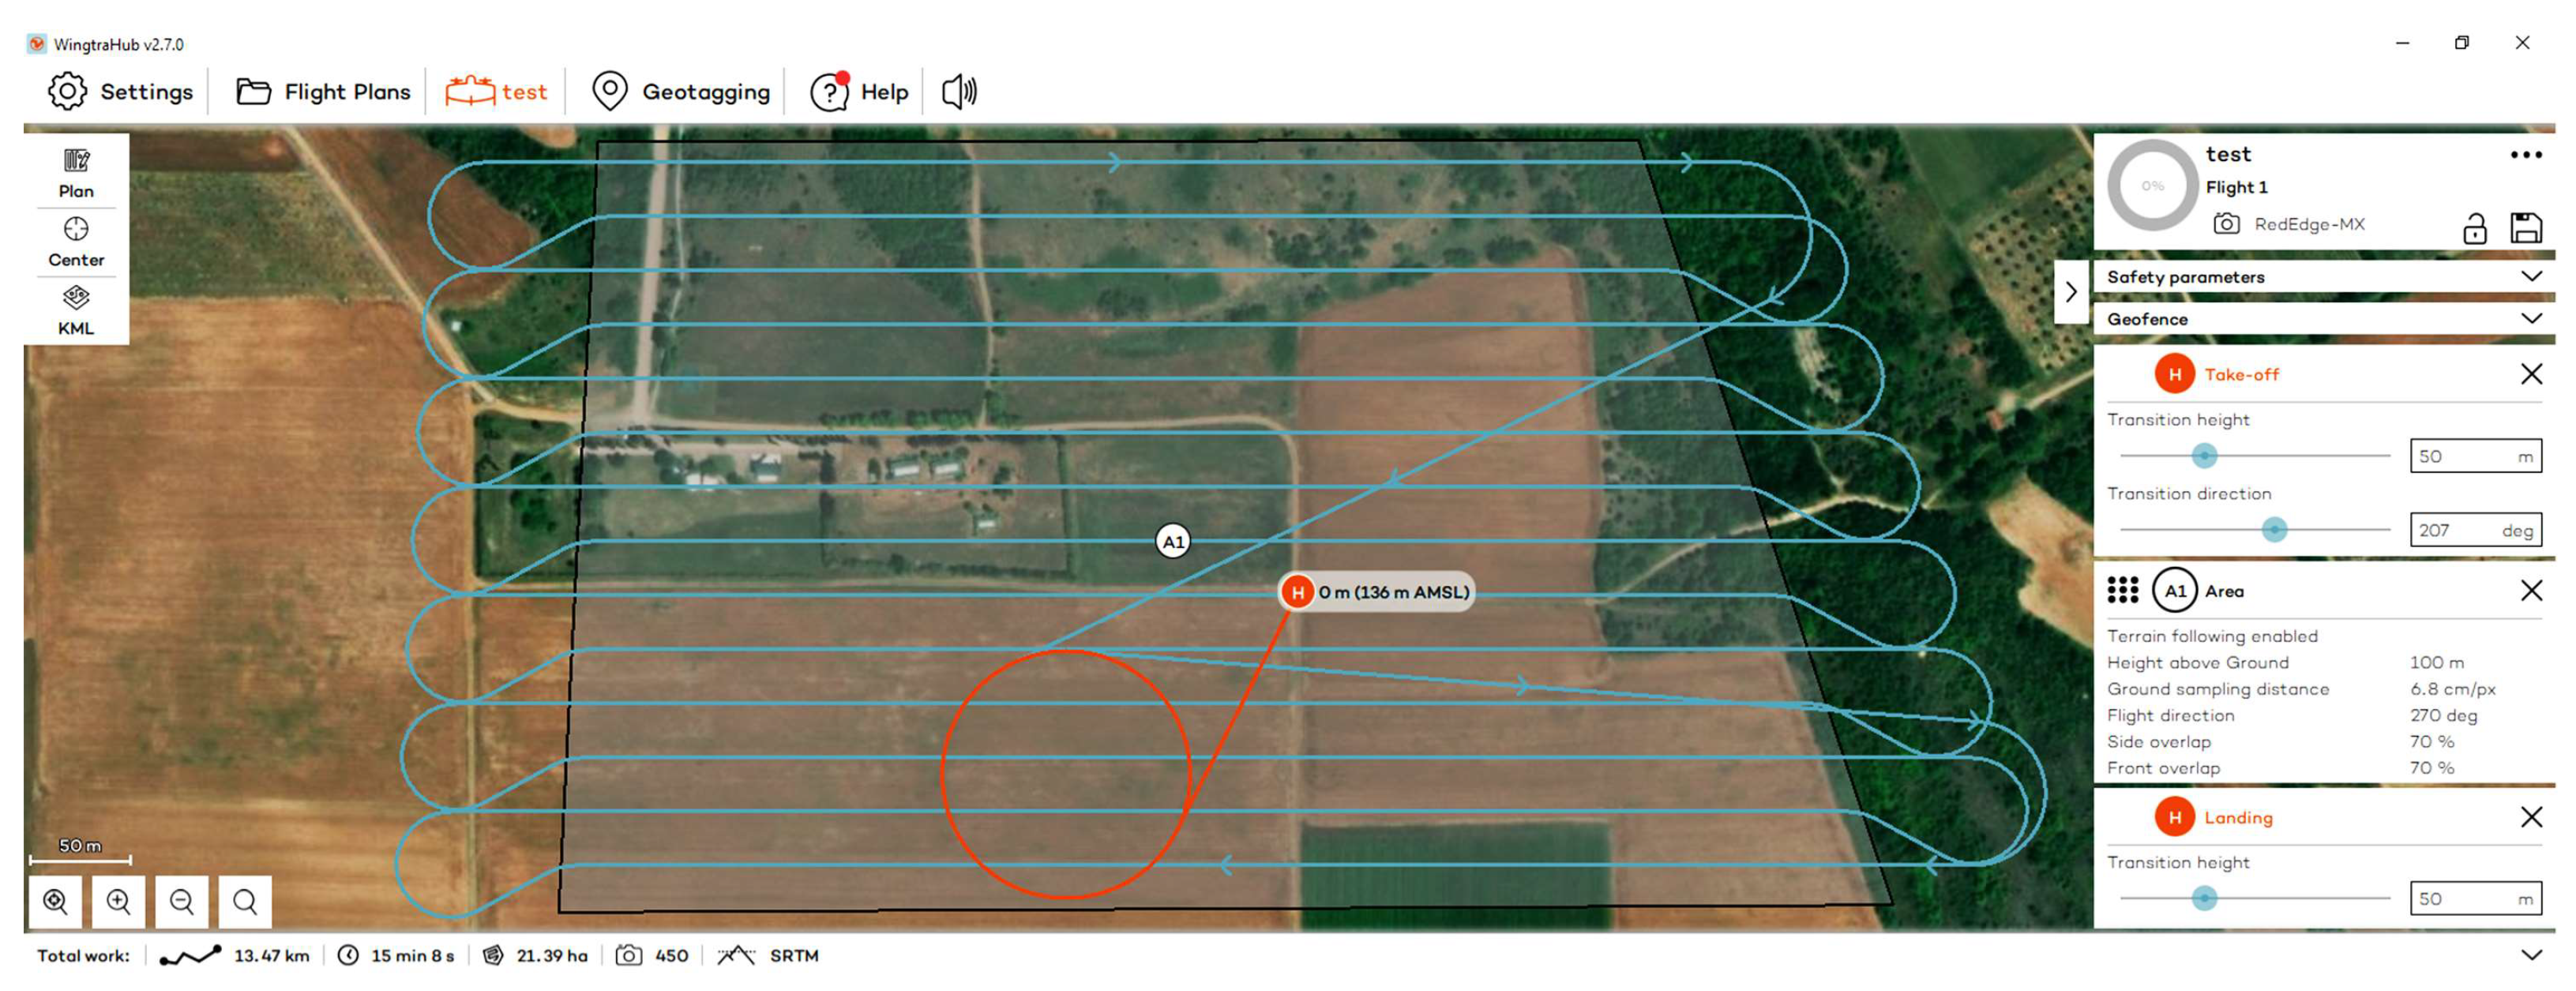
Figure 6.
The digital surface model and orthophotomosaic of the RGB images.

Figure 7.
From top left to right in order: The digital surface model and the orthophotomosaics of the MS images, Blue, Green, Red, Red edge and Near Infrared (NIR).
Figure 7.
From top left to right in order: The digital surface model and the orthophotomosaics of the MS images, Blue, Green, Red, Red edge and Near Infrared (NIR).
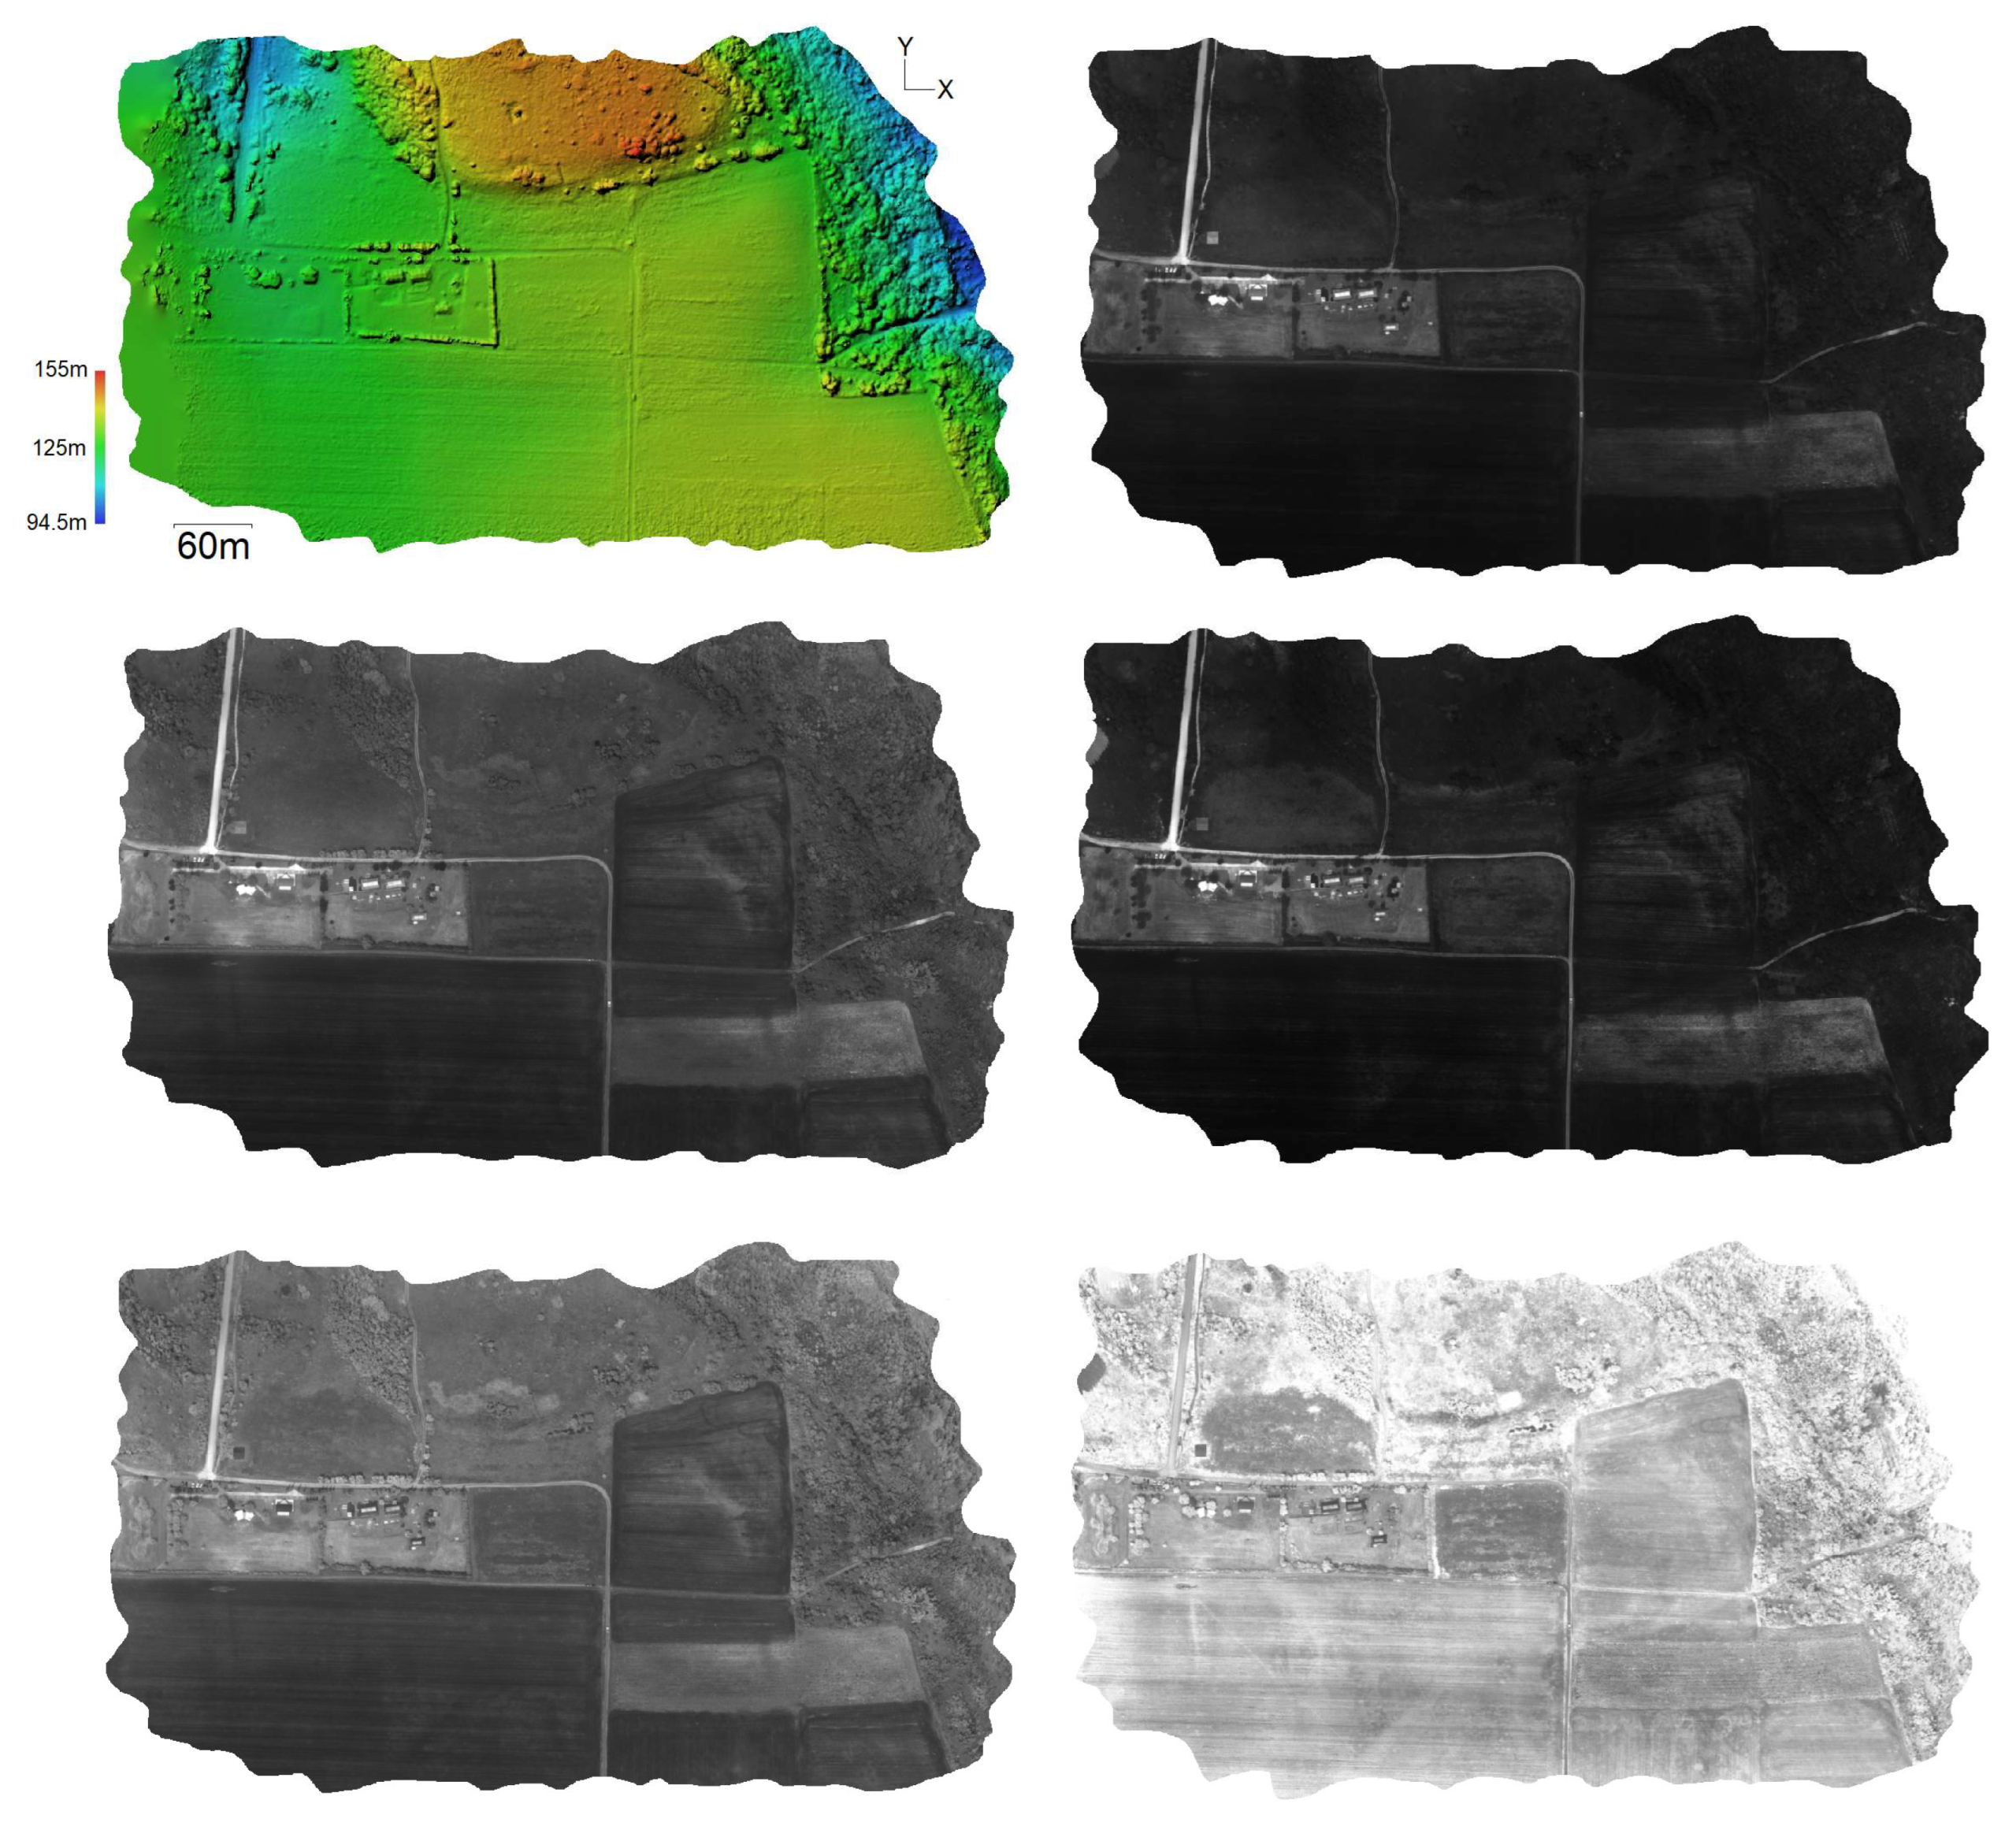
Figure 8.
The three targets, of 32 × 32 cm dimension, used to confirm the accuracies of the Agisoft Metashepe® resolutions.
Figure 8.
The three targets, of 32 × 32 cm dimension, used to confirm the accuracies of the Agisoft Metashepe® resolutions.
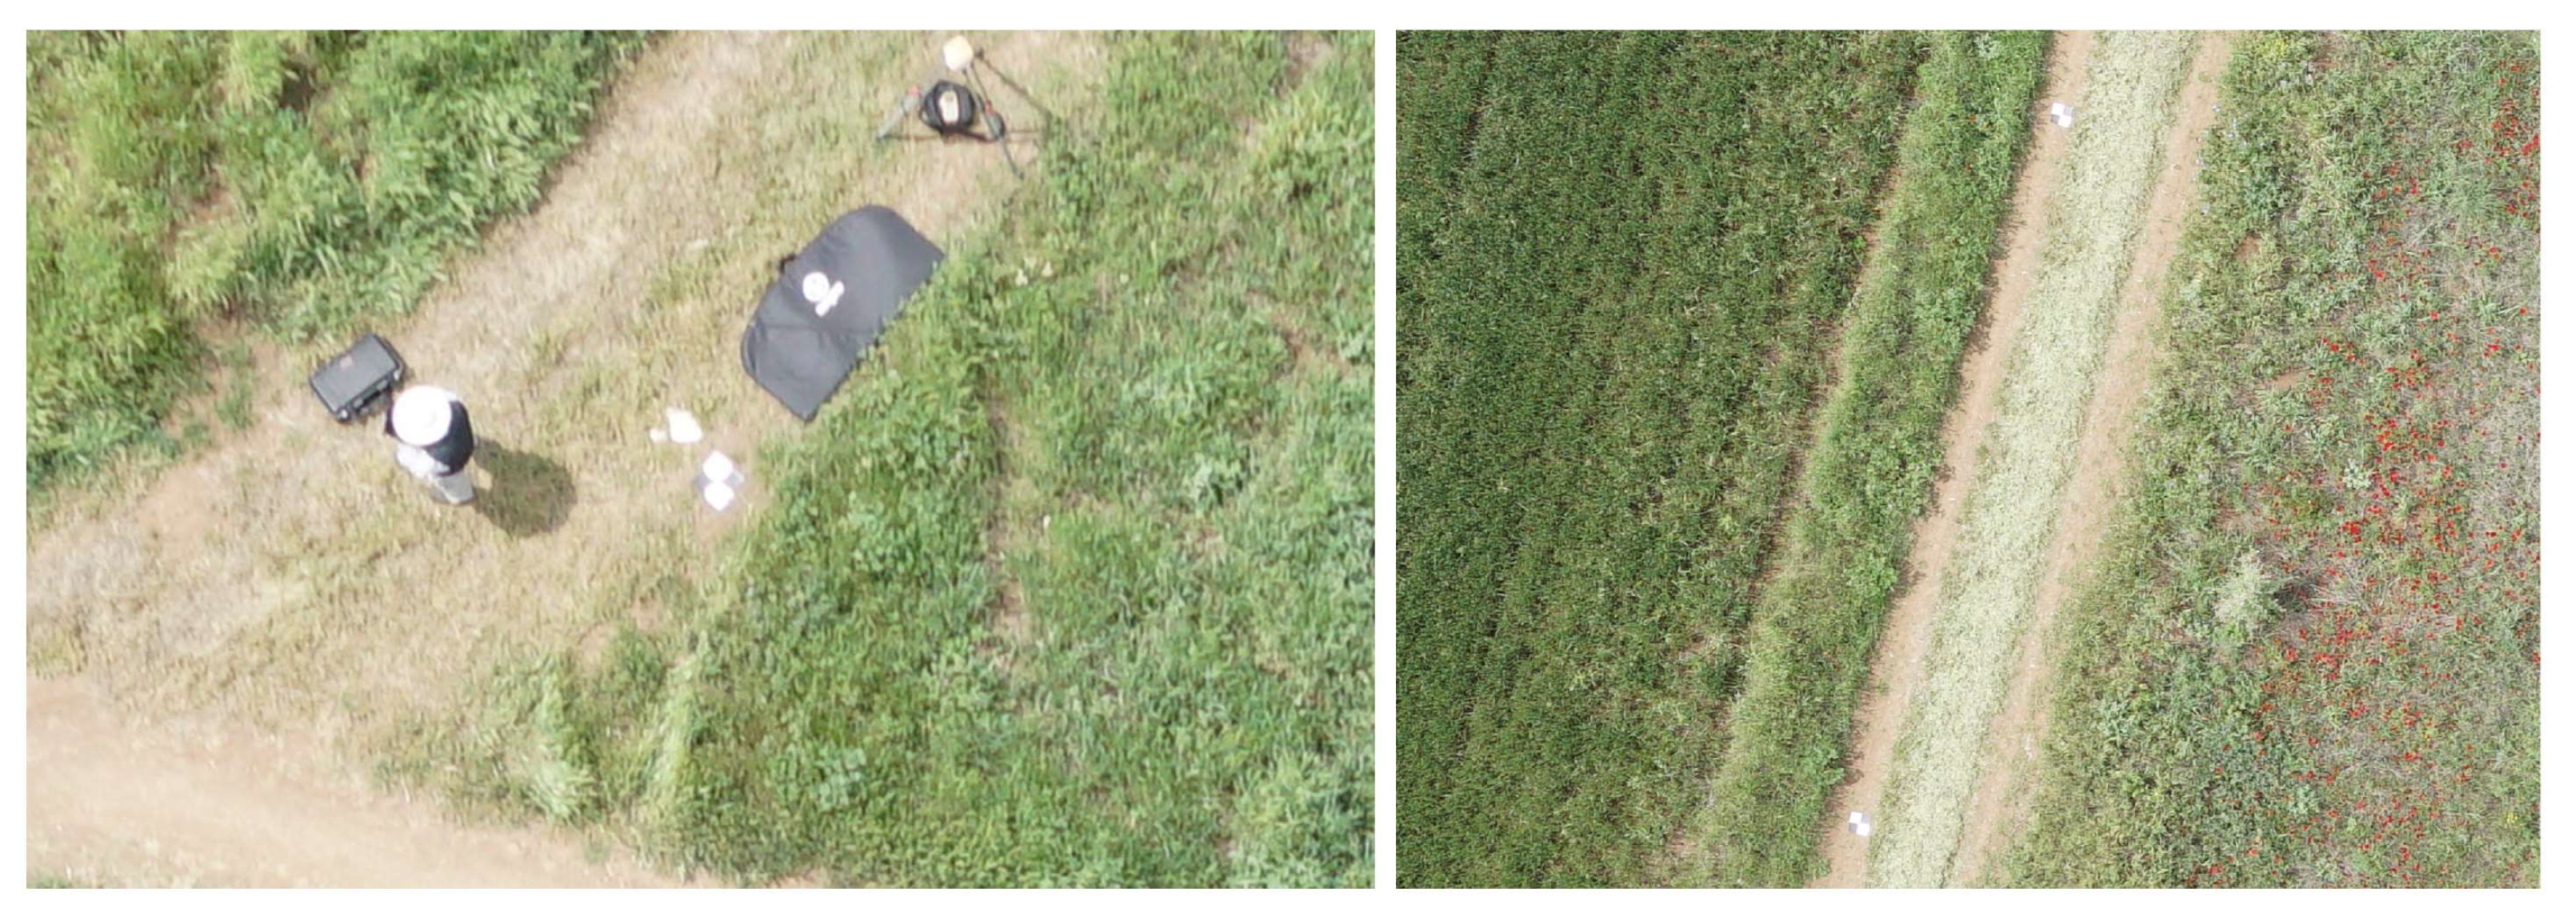
Figure 9.
In a positive crop mark observation position measuring 4.5 m × 6.5 m. Excerpts of images and indexes (a) RGB; (b) NIR; (c) SR; (d) GCI; (e) GNDVI; (f) GRVI; (g) GSAVI; (h) MSR; (i) NDRE; (j) NDVI; (k) NDVIRE; (l) NGRDI; (m) NLI; (n) OSAVI; and (o) SAVI. The grayscale of the images is from 0 (black) to 1 (white), giving 0 to the poorer and 1 to the best results of the index (e.g., for NDVI the value 0 corresponds to pixels without crop, 0.5 to pixels with poor growth or with poor crop health and 1 to pixels with good growth or healthy crop).

Figure 10.
In an observation position of squared positive crop marks. Excerpts of images and indexes (a) RGB; (b) NIR; (c) SR; (d) GCI; (e) GNDVI; (f) GRVI; (g) GSAVI; (h) MSR; (i) NDRE; (j) NDVI; (k) NDVIRE; (l) NGRDI; (m) NLI; (n) OSAVI; and (o) SAVI. The grayscale of the images is from 0 (black) to 1 (white), giving 0 to the poorer and 1 to the best results of the index (e.g., for NDVI the value 0 corresponds to pixels without crop, 0.5 to pixels with poor growth or with poor crop health and 1 to pixels with good growth or healthy crop).

Figure 11.
Extract of Figure 2 with the crop marks added in blue. In grey within the open archaeological site (location 3), are the existing open or closed ancient tombs of the Roman and early Christian cemetery that can be visited. The F code corresponds to the figures in which the marks are presented (e.g., the mark of Figure 9 has the code F9).
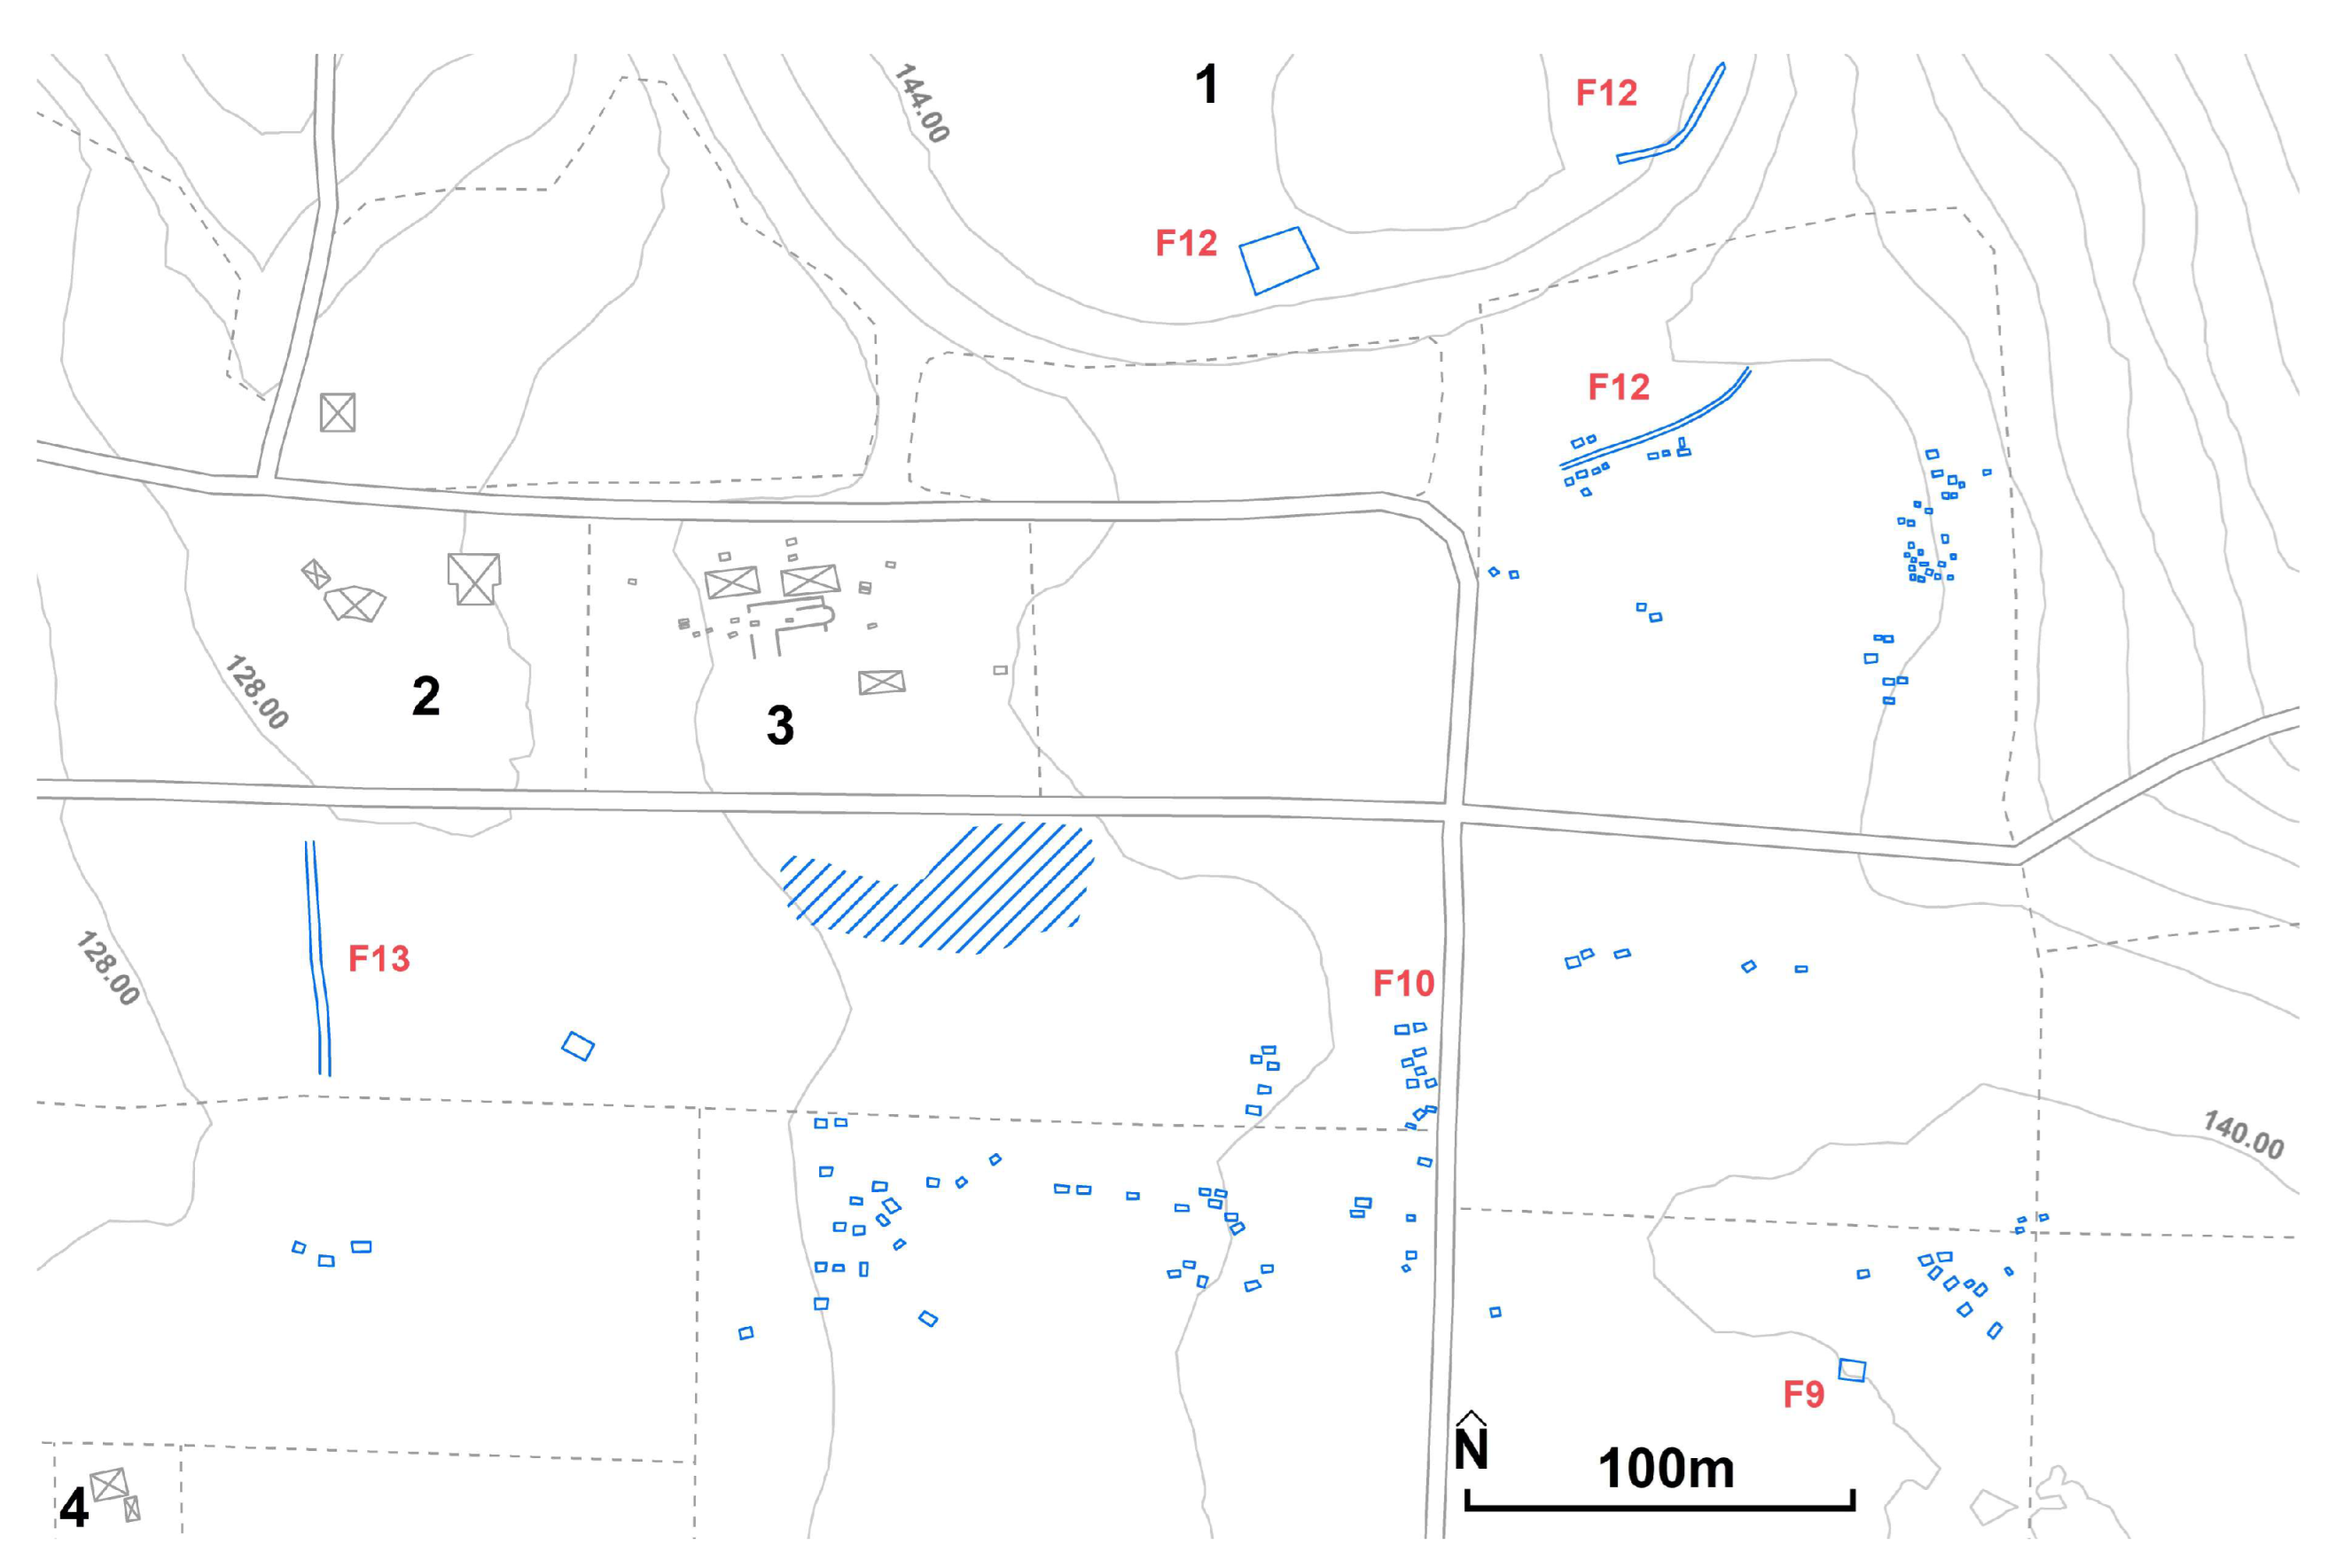
Figure 12.
Image extracts; (a = d) RGB; (b = e) NIR; (c = f) SR; (a–c) location in the northern part of Figure 11 (position F12). In the left part, a squared positive (moisture retention, presence of an open structure below ground) crop mark of the interior of the base of the possible tower of the acropolis wall is detected in the RGB, NIR and SR images. In the right part, a negative (absence of moisture, presence of solid structure below ground) linear crop mark, of the possible acropolis wall, is detected in the RGB and SR images. This mark is not visible in the NIR image. (d–f) Approximately 80 m southeast of marks (a–c), a linear positive crop mark is observed (its type, positive mark, probably refers to a ditch), and on either side of it square positive crop marks (of possible looted burial remains below ground).
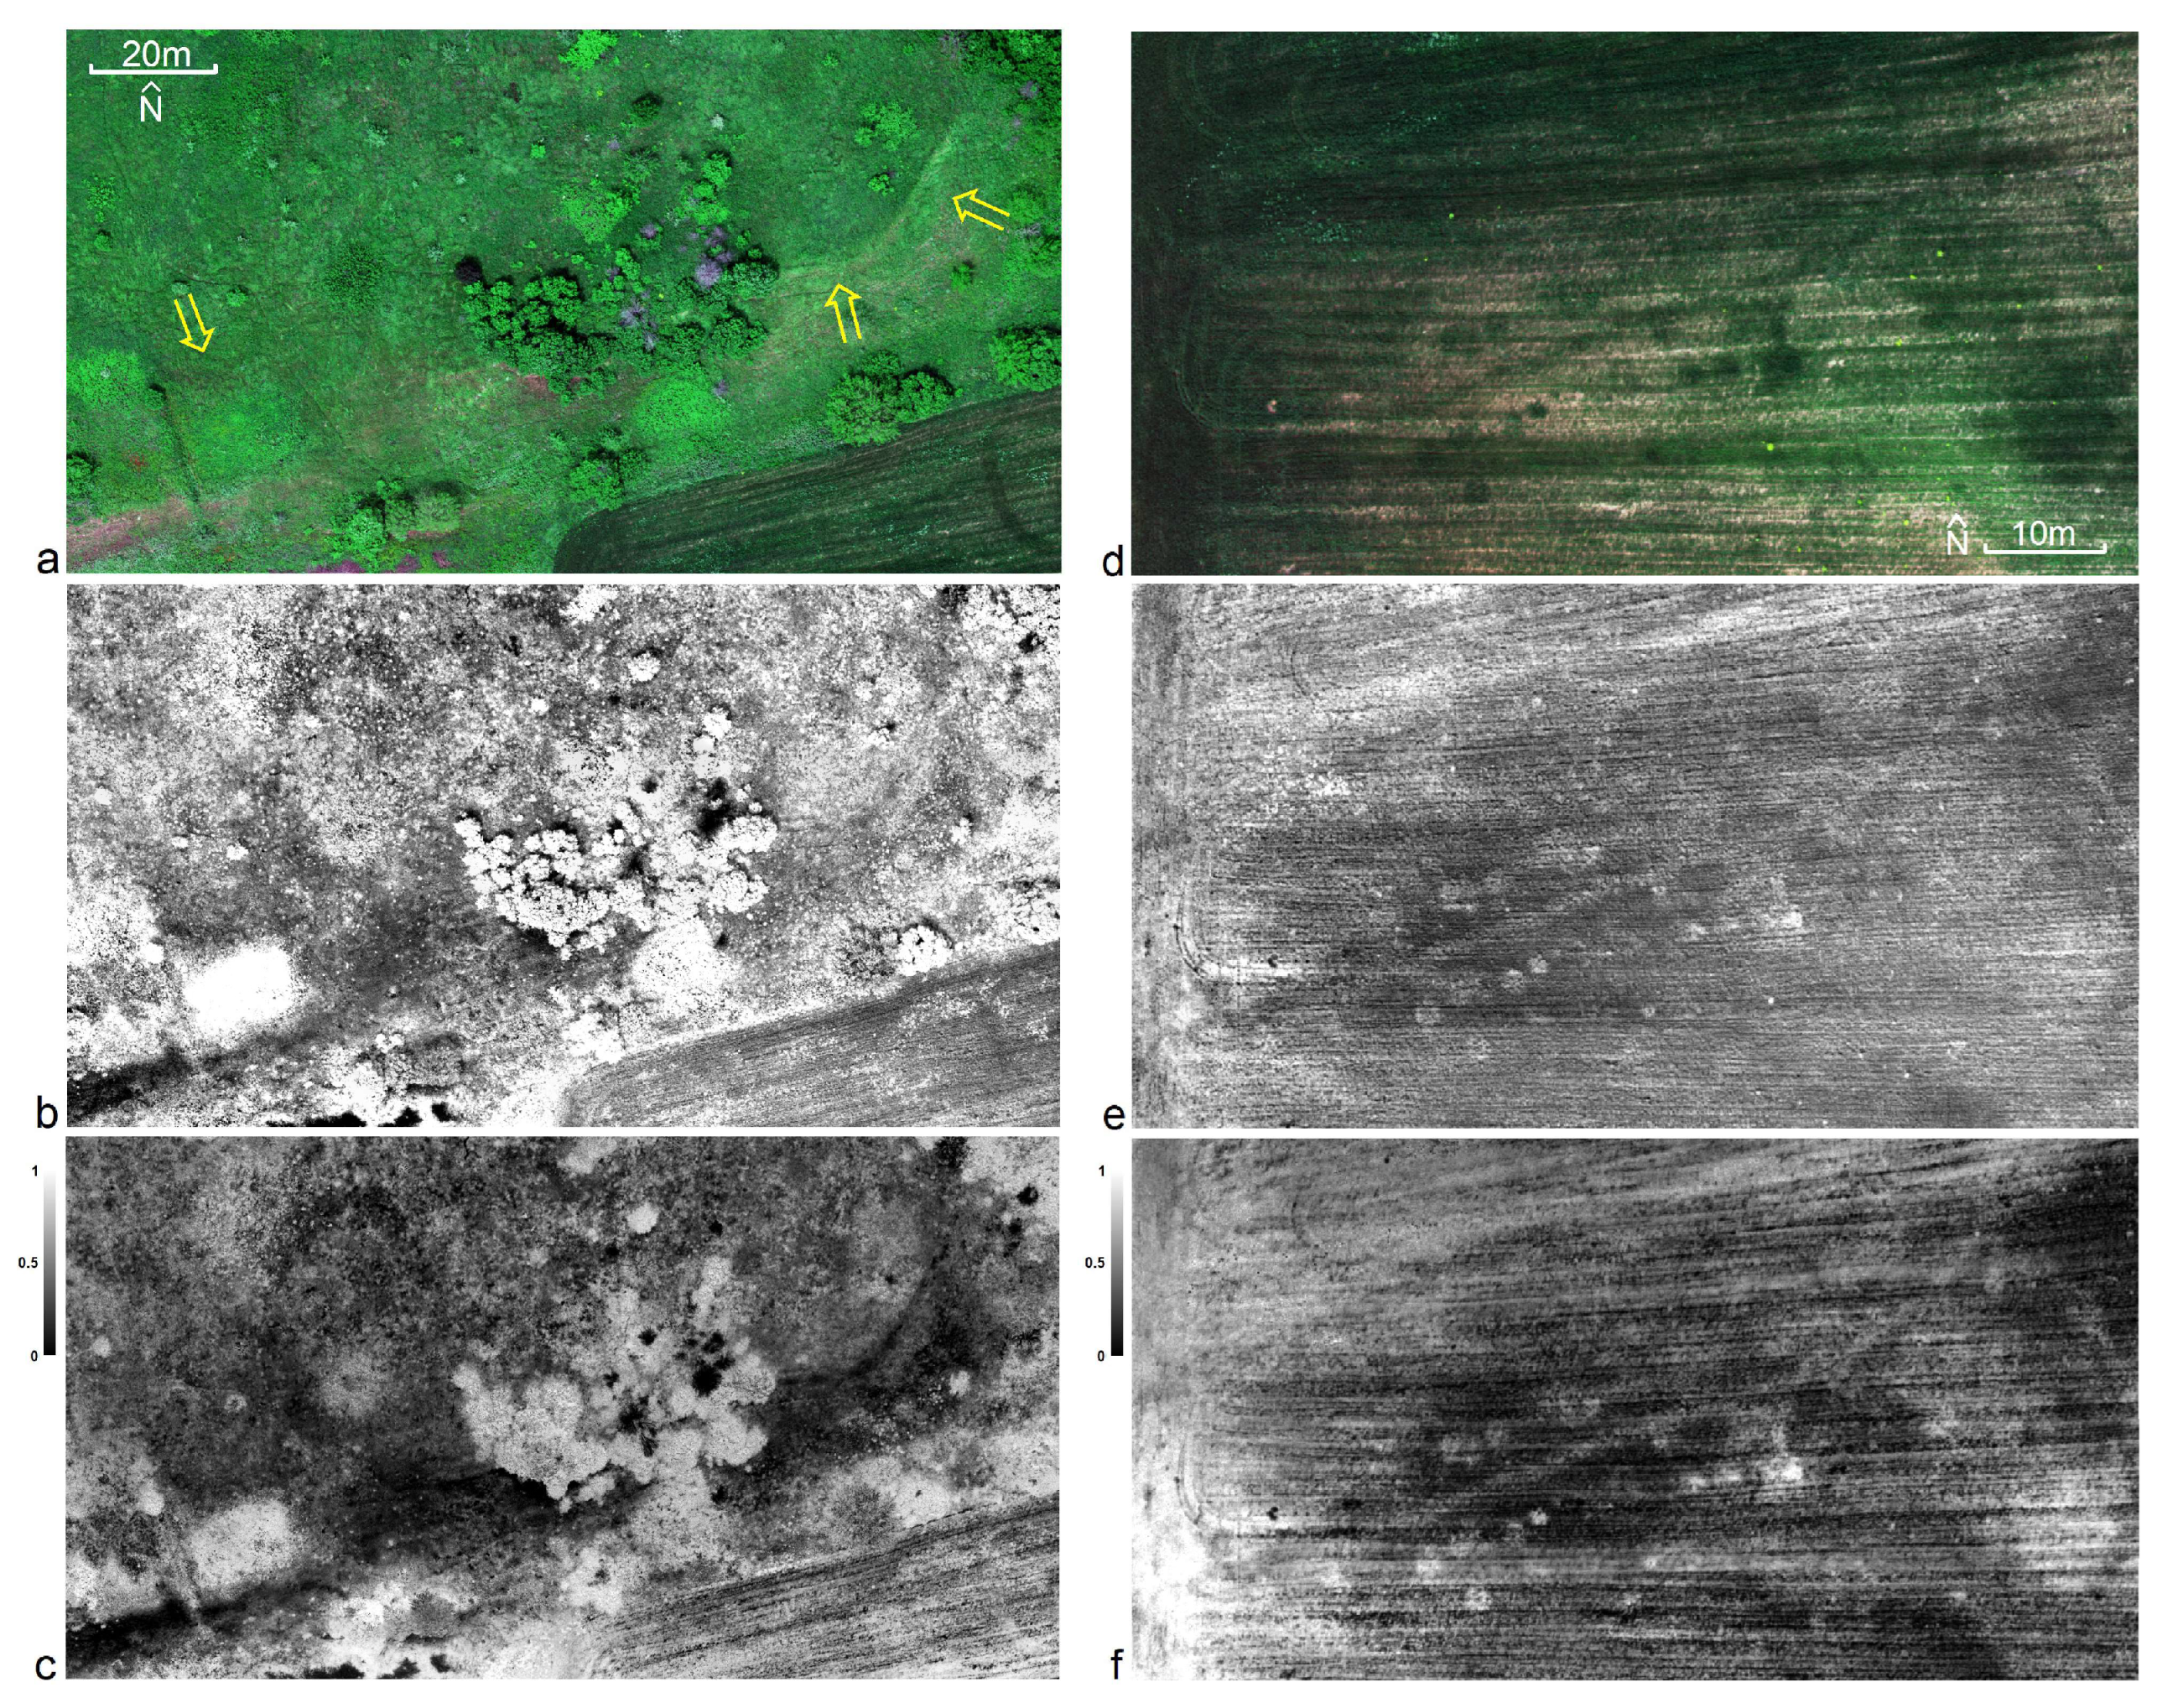
Figure 13.
Image excerpts; (a) RGB; (b) NIR; (c) SR. South of position 2 of Figure 11 (θέση F13), a linear positive crop mark is observed (its type, positive crop mark, probably refers to a ditch).
Figure 13.
Image excerpts; (a) RGB; (b) NIR; (c) SR. South of position 2 of Figure 11 (θέση F13), a linear positive crop mark is observed (its type, positive crop mark, probably refers to a ditch).


Table 1.
Technical specifications of the RBG and multispectral sensors [13].
Table 1.
Technical specifications of the RBG and multispectral sensors [13].
| Camera | Technical Specifications |
|---|---|
| Sony Cyber-shot DSC-RX1R II |
|
| MicaSense RedEdge-MX |
|
Table 2.
List of vegetation indexes that were used in the site of Europos [22,23,24,25,26,27,28,29,30,31,32,33].
| Index | Abbreviation | Formula |
|---|---|---|
| NDVI | Normalised Difference Vegetation Index | |
| OSAVI | Optimized Soil-Adjusted Vegetation Index | |
| SAVI | Soil-Adjusted Vegetation Index | |
| SR | Simple Ratio | |
| NDRE | Normalised Difference Red-Edge Index | |
| GSAVI | Green Soil-Adjusted Vegetation Index | |
| GNDVI | Green Normalised Difference Vegetation Index | |
| GCI | Green chlorophyll index | |
| GRVI | Green Ratio Vegetation Index | |
| NLI | Nonlinear Vegetation Index | |
| NDVIRE | Red-Edge Normalised Difference Vegetation Index | |
| MSR | Modified Simple Ratio | |
| NGRDI | Normalised Green Red Difference Index |
Disclaimer/Publisher’s Note: The statements, opinions and data contained in all publications are solely those of the individual author(s) and contributor(s) and not of MDPI and/or the editor(s). MDPI and/or the editor(s) disclaim responsibility for any injury to people or property resulting from any ideas, methods, instructions or products referred to in the content. |
© 2023 by the authors. Licensee MDPI, Basel, Switzerland. This article is an open access article distributed under the terms and conditions of the Creative Commons Attribution (CC BY) license (https://creativecommons.org/licenses/by/4.0/).
Share and Cite
MDPI and ACS Style
Kaimaris, D.; Tsokas, D. Application of UAS with Remote Sensing Sensors for the Location of Marks in the Archaeological Site of the Europos, Greece. Remote Sens. 2023, 15, 3843. https://doi.org/10.3390/rs15153843
AMA Style
Kaimaris D, Tsokas D. Application of UAS with Remote Sensing Sensors for the Location of Marks in the Archaeological Site of the Europos, Greece. Remote Sensing. 2023; 15(15):3843. https://doi.org/10.3390/rs15153843
Chicago/Turabian StyleKaimaris, Dimitris, and Dimitris Tsokas. 2023. "Application of UAS with Remote Sensing Sensors for the Location of Marks in the Archaeological Site of the Europos, Greece" Remote Sensing 15, no. 15: 3843. https://doi.org/10.3390/rs15153843
Note that from the first issue of 2016, this journal uses article numbers instead of page numbers. See further details here.