


Estimating Early Summer Snow Depth on Sea Ice Using a Radiative Transfer Model and Optical Satellite Data

Earth Observation and Modelling, Department of Geography, Kiel University, Ludewig-Meyn-Str. 8, 24098 Kiel, Germany
*
Author to whom correspondence should be addressed.
Remote Sens. 2023, 15(20), 5016; https://doi.org/10.3390/rs15205016
Submission received: 29 September 2023
/
Revised: 13 October 2023
/
Accepted: 16 October 2023
/
Published: 18 October 2023
(This article belongs to the Special Issue Recent Advances in Sea Ice Research Using Satellite Data)
Abstract
:Sea ice regulates the overall energy exchange and radiation budget of the Arctic region, and understanding this relationship requires an accurate determination of snow depth. However, methods for deriving snow depth have a large error through the annual winter and early spring periods due to the potential complexity of surface melting during early summer. In this study, we explore the potential of retrieving snow depth during the early summer using optical satellite imagery of the sea-ice cover. Measurements using VIS/IR (visible and infrared) usually feature much higher spatial resolution than L-band satellite data and can provide additional surface melting and leads information; in addition, considering the snow grain size–snow surface temperature interaction, there is co-variability between the observed sea-ice surface broadband albedo using an optical satellite sensor, the sea-ice surface temperature, and the retrieval target of snow depth on the spatial scale of optical imagery samples. We applied a surface classification procedure to optical satellite imagery and introduce an approach to derive snow depth from optical satellite imagery and ice surface temperature data using two solar radiation transfer models: the Delta-Eddington solar radiation model, which is the shortwave radiative scheme of the Los Alamos sea-ice model, and a simplified snow albedo scheme, which is tuned to the observational data of buoys. The snow depth was inversed from the model simulation results using a lookup-table-based method. For comparison with the observational data, using the Delta-Eddington solar radiation model, about 55% of the differences are below 5 cm, and thicker snowpack has a larger bias; using the simplified snow albedo scheme, a mean difference of 4.1 cm between retrieval and measurements was found, with 93% of the differences being smaller than 5 cm. This approach can be applied to optical satellite imagery acquired under clear-sky conditions and can serve as an addition to overcome the limitations of existing methods.
1. Introduction
The sea ice of the southern oceans and the Arctic is a crucial component of the earth’s climate system. Sea ice regulates the energy budget between the ocean and atmosphere, modulates the overall radiation budget of the Arctic Ocean and Southern Ocean through ice–albedo feedback and influences ocean circulation through freshwater and salinity distribution [1,2,3,4]. Arctic and Antarctic sea ice are typically snow-covered for the majority of the year [5,6]. Snow, however, exhibits a higher albedo and significantly lower thermal conductivity compared to bare sea ice, insulating the sea ice beneath it, reducing heat flux heat transfer between the ice–ocean and atmosphere and lowering both summer sea-ice melt and winter sea-ice growth [6,7,8,9]. Therefore, a correct understanding of snow depth is key to an understanding of regional and global processes and their changes.
Remote sensing based on satellites can provide information about the sea-ice thickness (SIT) and snow depth distribution in the polar region [10,11,12]. There are sea-ice thickness retrieval methods based on satellite altimetry such as ICESat-2 and Cryosat-2 data. NASA’s Ice, Cloud, and land Elevation Satellite (ICESat-2) is a multi-beam, high-repetition-rate (10 kHz) and 532 nm-wavelength laser altimeter [13], i.e., by knowing the satellite’s precise location and the pointing angle, the elevation or height of the surface features can be determined. The surface elevation with which the emitted laser light interacts is the snow–atmospheric interface, referring to the topmost layer of the snowpack. The directly retrieved value from the laser altimetry measurement is the freeboard of snow. Sea-ice thickness is determined from sea-ice freeboard through prerequisite assumptions of sea-ice density and snow depth/density [3,14]. ESA’s CryoSat-2 is equipped with the SAR/Interferometric Radar Altimeter (SIRAL) instrument, and it can accurately measure surface topography information. This capability was previously only achievable with pulse-based radar altimeters. Radar echoes are assumed to scatter from the snow–ice interface [15,16]; consequently, it becomes possible to measure the sea-ice freeboard, which represents the height of the sea ice above the water’s surface. The ice thickness is then estimated using the estimated freeboard and climatology snow density/depth data by assuming that the sea ice maintains hydrostatic balance [3,5].
As analyzed above, it is evident that snow depth represents the primary source of uncertainty in sea-ice thickness (SIT) and volume retrieval. The estimation of SIT from the freeboard relies on climatology snow-depth data collected from manned drifting stations and isolated locations (accessed via aircraft) on multi-year ice (MYI) in the Arctic. The Warren climatology snow-depth product spanning the period between 1954 and 1991, given the absence of a more comprehensive operational product, continues to be widely utilized at present—sometimes with a modification factor of 0.5 or 0.7. The modification factor is introduced to accommodate the lower snow depths typically observed on first-year ice (FYI) and to account for the fact that less ice survives the melting season [3,14]. So, additional efforts are required to expand observations of snow depth and density throughout the summer season [17].
The existing methods are not configured to retrieve SIT measurements throughout the melt season or snow-depth measurements from late spring to early summer because of the lack of surface melt conditions [18]. During the summer, melt ponds on sea ice interfere with the satellite’s radar signal; surface melt also poses challenges in accurately distinguishing between melt ponds and leads, resulting in melt ponds being mistakenly classified as leads, which introduces bias in the freeboard and thickness estimates, causing them to be underestimated. Therefore, improved knowledge of the surface classification procedure in spring/summer is required. VIS/IR (visible and infrared) remote sensing usually has a much higher spatial resolution compared to L-band satellite data and can provide additional surface melting and leads information [19,20,21,22,23], whereas it has not been used for snow-depth retrieval so far. In this study, we applied a surface classification procedure to Sentinel-2 (S-2) imagery with high spatial resolution to enable detailed snow-depth analysis. Regarding the S-2, we used data from the time period from June 2020 to July 2020, which coincides with the field data on the snow depth in the early summer period observed by the MOSAiC expedition [24]. To enable analysis of larger areas and longer time periods, we have also adopted Moderate Resolution Imaging Spectroradiometer (MODIS) data ranging between 2008 and 2016. Once the surface classification procedure is implemented, the snow depth is derived from the S-2 and MODIS using ice surface temperature data and two different solar radiation transfer models: the Delta-Eddington solar radiation model, which is the shortwave radiative scheme of the CICE (Los Alamos sea-ice model) for sea-ice development (publicly available at https://climatemodeling.science.energy.gov/technical-highlights/cice-consortium-model-sea-ice-development (accessed on 15 October 2023)), and a simplified snow albedo scheme, which has been tuned to buoy data. The inversion of snow depth was accomplished through a lookup-table-based approach utilizing the outcomes of the model simulations. Moreover, this approach can be applied to optical satellite imagery acquired under clear-sky conditions and can serve as an addition to overcome the existing limitations of radar altimetry using ICESat-2 (70 m) or CryoSat-2 (300 m) data. There are three main study regions in this study: (1) Beaufort Gyre, (2) from the Transpolar Drift Stream to the Fram Strait, and (3) around the North Pole. These regions represent different ice regimes and are representative of Arctic sea ice.
The structure of this paper is as follows: Section 2 presents the radiative transfer model employed for snow-depth retrieval. In Section 3, we provide an overview of the datasets used and the data processing workflow. In Section 4, we examine the radiation transfer model’s accuracy and present an assessment of our snow-depth retrieval performance compared to in situ measurements from sea-ice mass-balance buoys. In Section 5, we discuss the retrievability and uncertainty estimates of the methods. In Section 6, we introduce the contributions and shortages of the proposed method and outline a possible direction for further research.
2. Radiative Transfer Model
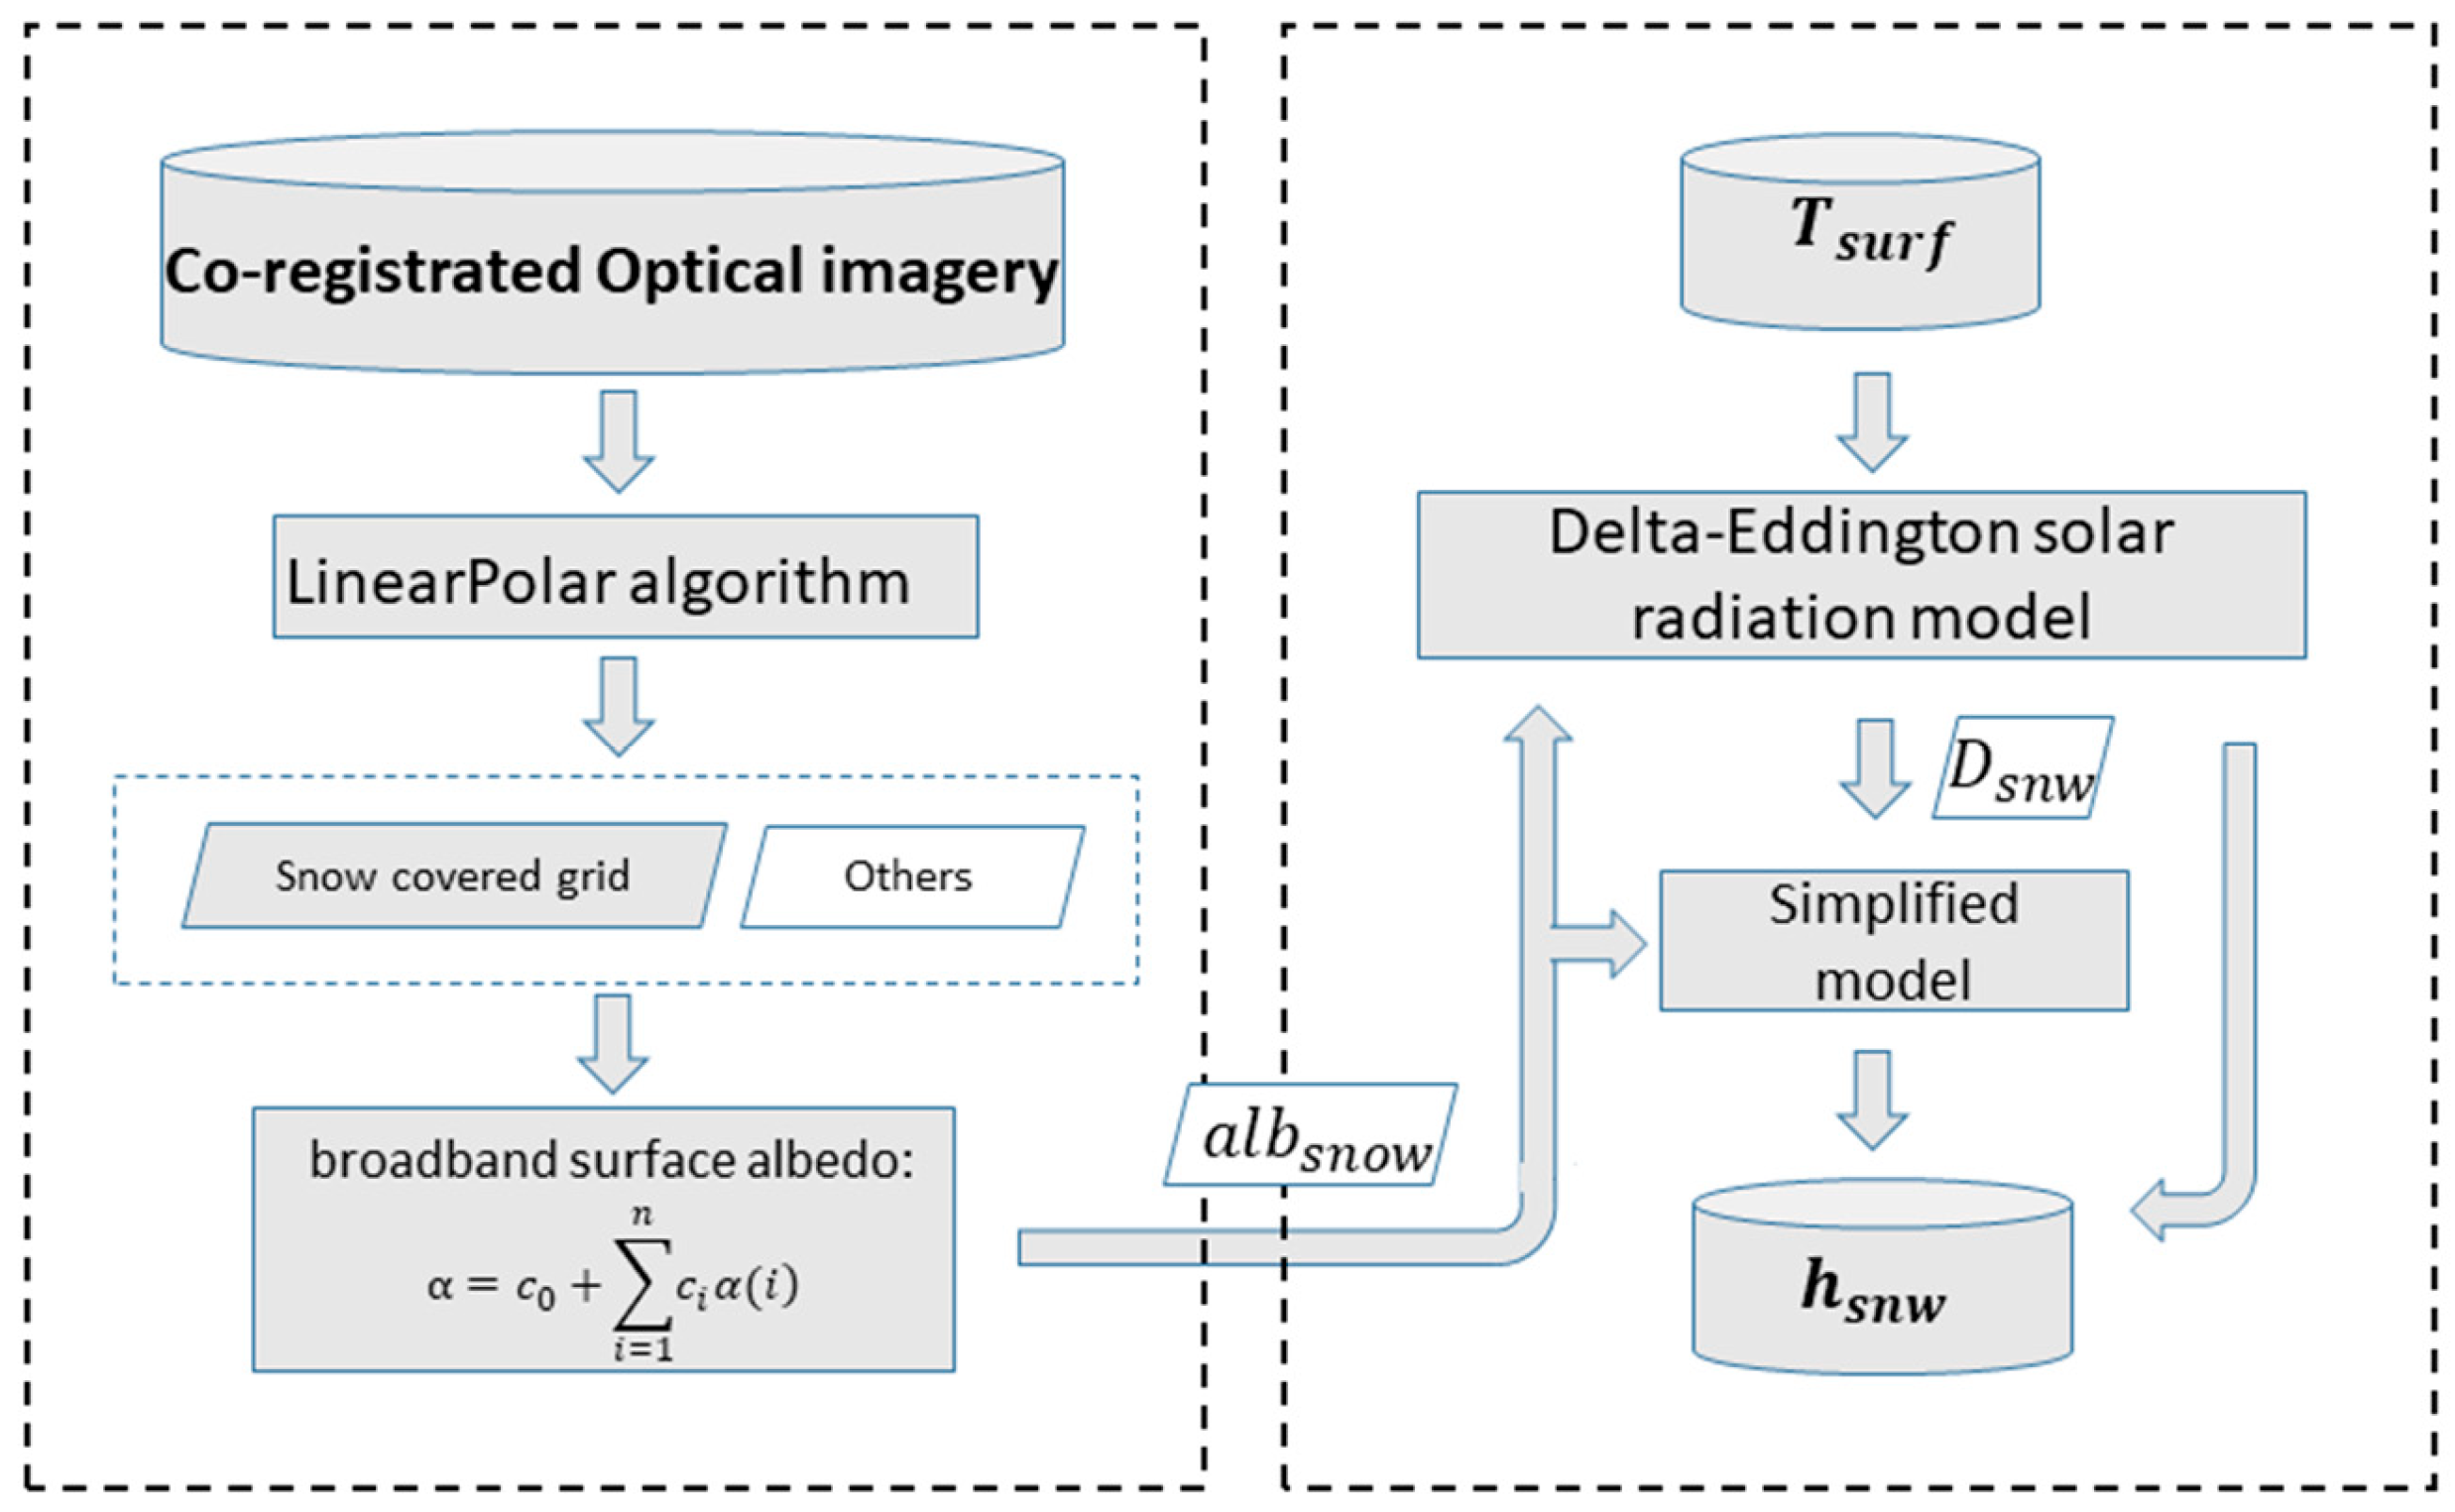
The shortwave radiative characteristics of the sea ice were numerically modeled using a solar radiation transfer model. We used the Delta-Eddington model and built a simplified version of the model to calculate the snow albedo–snow depth relationship. The outline of the algorithm is presented in Figure 1, with the two phases marked with two boxes. The methodological approach consists of sequential steps as follows: snow cover is classified from the imagery, and once the surface classification procedure is implemented, albedo calculation is applied to the snow-covered grid, and snow depth is derived from the snow surface albedo and ice surface temperature using the two different solar radiation transfer models.
2.1. Delta-Eddington Solar Radiation Model
The Delta-Eddington shortwave radiation scheme has been implemented by the commonly used sea-ice model CICE [25]. It is assumed that the prominent forward scattering peak of snow and sea ice can be represented as a delta function [26] (Equation (38) in [26]); this enables the scaling of the radiative transfer equation. Once scaled, the resulting transfer equation can be efficiently solved using the Eddington approximation method [27]. The sea ice is partitioned into multiple layers to account for the multiple scattering of light within each layer (Equation set 50 in [26]). The term “Delta” in the scheme’s name signifies its incorporation of the delta transform to account for the pronounced forward scattering observed in sea ice and snow (Equations (2a)–(2c) in [27]).
Following the Delta-Eddington assumption, the transmittance and diffuse reflectance for a single layer are computed by integrating the direct transmittance and reflectance across the incident hemisphere under the assumption of isotropic incidence. This approach aligns with the method introduced by Wiscombe and Warren [28], as outlined in their Equation (5). In practical implementation, they employed eight Gaussian angles to integrate these values across every layer. In this study, we assumed clear-sky conditions, and only cloudless optical satellite images were used for the estimation of snow depth (Figure 2). The computed reflectance and transmittance for a single layer, considering both direct and diffuse components, are subsequently merged to account for interlayer light scattering. This fusion process facilitates the calculation of the reflectance and transmission values at each interface [26] and further enables the determination of upward and downward fluxes. The upward and downward fluxes, computed at various optical depths, then serve as critical inputs for calculating the column reflectance and transmittance. The model can be used for the determination of absorption profiles for diverse multilayered media, such as sea ice and snowpack.
Snow initially falls as a diverse array of snow crystal shapes and sizes but undergoes a rapid transformation that is primarily driven by vapor diffusion upon settling on the surface. This transformation leads to the formation of nearly unimodal and roughly spherical snow grains [29]. These grains continue to grow gradually over time through temperature-dependent vapor diffusion. Until significant compaction occurs, the density of the snow remains low, and there is a substantial amount of air space between the adjacent, nearly spherical snow grains. Near the melting point, temperatures induce a rapid enlargement of snow grain size, and melting leads to the incorporation of liquid water into the snow. The presence of liquid water, coupled with the growing grain size, typically results in lower snow albedo during melting or near-melting conditions compared to that observed in non-melting fresh snow. As a result of that, there is co-variability between the observed sea-ice surface broadband albedo from an optical satellite sensor, the sea-ice surface temperature and the snow depth, which enables the retrieval of the snow depth from optical remote sensing imagery and the ice surface temperature.
2.2. Development of a Simplified Snow Albedo Scheme
The algorithm’s structure is based on the theoretical retrieval algorithm of Wang et al. [30]. Remote sensing often demands efficient parameterization schemes; to achieve this, we simplified the Delta-Eddington solar radiation model and derived a parameterization that approximates the connection between snow depth, snow albedo and ice surface temperature. This scheme comprises two key components: (a) forward scattering, which accounts for the surface solar reflectance; and (b) backscattering, which refers to the solar radiation entering the surface of snow. The scheme is as follows:
Here, is the albedo of new snow, represents the extinction coefficient (, which characterizes the snowpack’s absorption and scattering capabilities and is the depth of the snow (). Given two extreme conditions—(1) if , is the snow background albedo (i.e., the albedo of the bare ground before the new snowfall or pre-existing old snow); and (2) if approaches an infinitely large snow depth, and is the new and infinite snow albedo—we can determine that , . Therefore,
where (extinction coefficient) and are determined by the snow grain size. Utilizing the albedo values calculated with the Delta-Eddington solar radiation model, we parameterize and as follows:
where is the snow grain size in mm derived from the Delta-Eddington solar radiation model using the ice surface temperature data. The regression coefficients , and (a = −0.061, b = 1.20, c = 9.47, d = −0.16) were determined through fitting to in situ (buoy) observations.
3. Data
3.1. Satellite Data and Ice Surface Temperature Data
Optical satellites provide an estimation of surface reflectance in the VIS/IR parts of the spectrum; some also include thermal infrared. Although limited to clear-sky situations, they provide high swath widths and repetition rates in the polar region during the melt season and allow discrimination between different ice features including lead, melt pond, bare ice and snow-covered ice in different stages of sea-ice development [31]. Moreover, optical satellite data such as MODIS data were used to produce time series of melt-pond fraction (MPF) [19,20,21,22,23]. To construct the retrieval algorithm for snow-depth retrieval, we adopted S-2 and MODIS data, i.e., Level-2A orthorectified atmospherically corrected surface reflectance product S2_SR and Terra Surface Reflectance Daily Global 1 km and 500 m product MOD09GA.061 from the MODIS sensor.
The MODIS Surface Reflectance delivers the measurements of the surface spectral reflectance after atmospheric and aerosol correction. In version 6.1 of MOD09GA, bands 1–7 (620–2155 nm) are provided in a daily gridded L2G product in sinusoidal projection. This includes reflectance with a resolution of 500 m and geolocation statistics with a 1 km or 500 m resolution [32]. The S-2 is a polar-orbiting optical mission designed for land and coastal region monitoring as well as emergency services. The mission comprises two satellites, S-2A and S-2B, both equipped with the Multi-Spectral Instrument (MSI). S-2A and S-2B were launched in 2015 and 2017, respectively. The MSI offers 13 spectral bands spanning from 443 to 2202 nm, with spatial resolutions ranging from 10 to 60 m. The S-2 provides high-spatial-resolution images of Arctic Ocean offshore areas, often capturing data once a day. The S-2 Level 2 data were obtained from Google Earth Engine (GEE) and were processed using Sen2Cor [33].
The ice surface air temperature was retrieved from the reanalysis product ERA5 of the European Centre for Medium-Range Weather Forecasts (ECMWF) [34]. The ERA5 provides hourly analysis and forecast fields and has global coverage with a horizontal spatial resolution of 31 km. In the vertical plane, ERA5 resolves the atmosphere using 137 levels from the surface up to a height equaling 0.01 hPa. The ERA5 ice surface air temperature was interpolated to S-2 and MODIS grids using the Nearest-Neighbor interpolation method.
3.2. Sea-Ice Mass-Balance Buoy Data
To evaluate the snow-depth retrieval of MODIS, we used ice mass-balance (IMB) buoy data with quality-controlled snow-depth measurements. The IMB data span from August 2008 to August 2016 [35]. The data are openly accessible and can be obtained from the CRREL website (http://imb-crrel-dartmouth.org/archived-data/ (accessed on 18 May 2023)). IMB buoys were initially deployed in the beginning of the winter season or during the summer season. They span extensive regions including the central Arctic, Beaufort Sea, Chukchi Sea and the Greenland Sea. Snow depth is measured approximately every 2–4 h using an acoustic sounder, which records the position of the sea-ice surface or snow with an accuracy of approximately 1 cm [36]. To validate the snow-depth data retrieved from the S-2, we utilized data from Snow and Ice Mass Balance Apparatus (SIMBA) buoys deployed in proximity to the MOSAiC Central Observatory (CO) during October and November 2019. These buoys covered an area of approximately 50 km and provided data on snow depth and drift patterns [37]. The data are publicly available in the Pangaea repository (download at https://doi.org/10.1594/PANGAEA (accessed on 18 May 2023)).
3.3. Data Usage Protocols
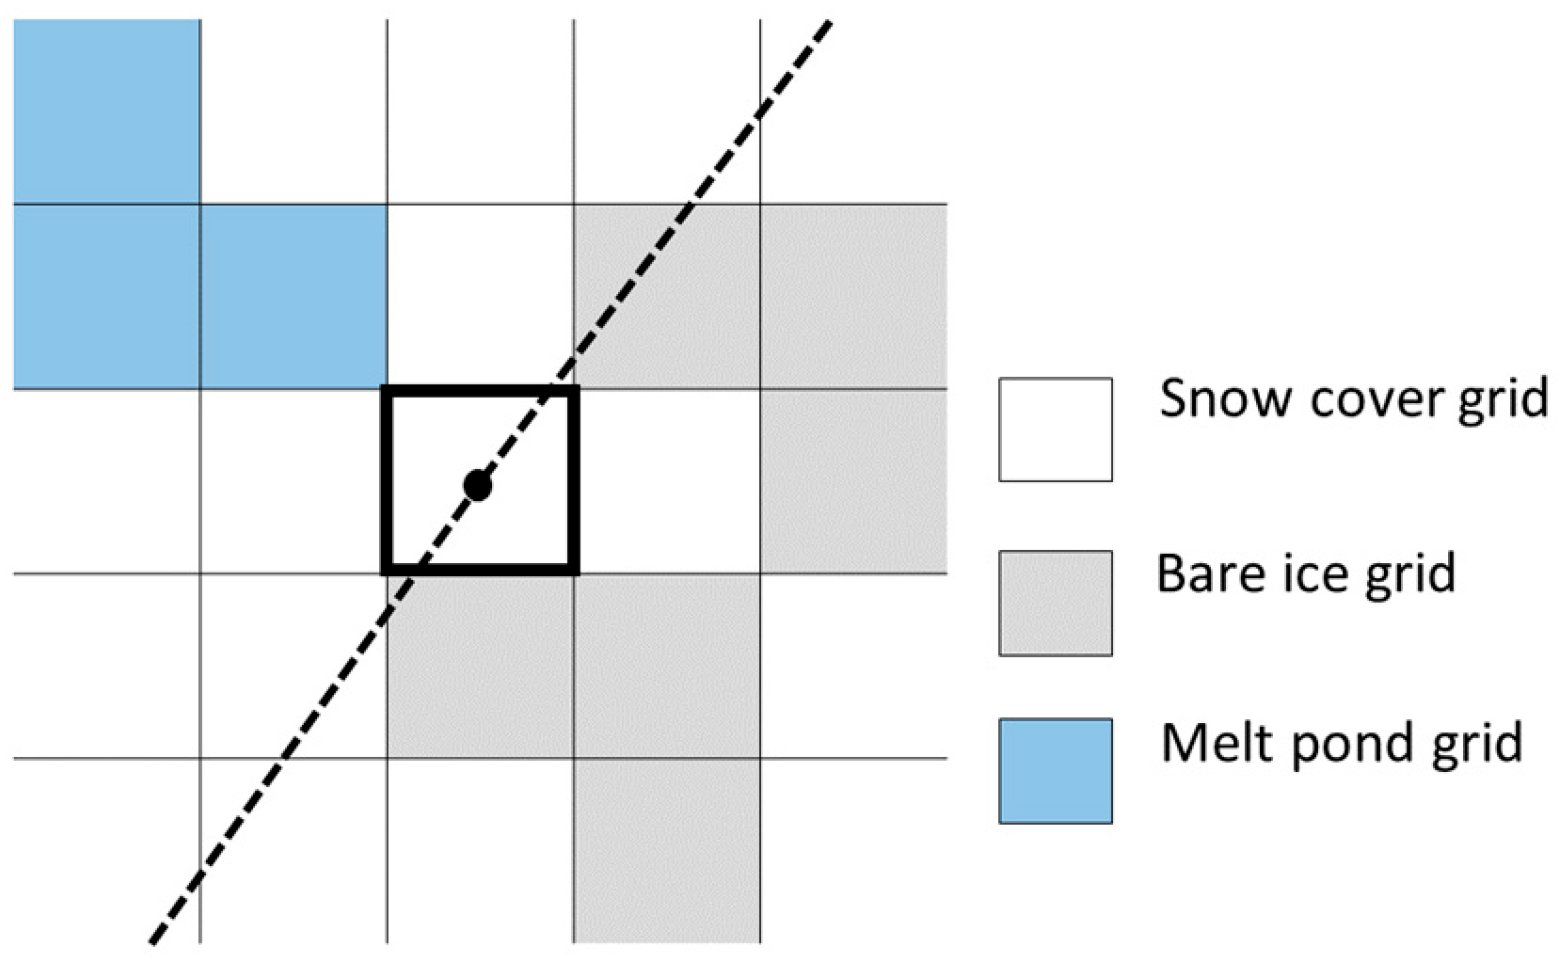
Because of existing differences between the IMB data and the satellite data in both the spatial and temporal dimensions, we outline the following protocols for using those datasets. As illustrated in Figure 3, for each IMB or SIMBA snow-depth observation along the buoy trajectories, satellite images around the buoy position with cloud coverage of less than 10% were selected. The acquisition time of the images was limited from May to August (1 May–31 August). Because the in situ observation data from the IMB and SIMBA measurements are of a small, local scale, we consider the in situ data only as an indicator for an S-2 or MODIS pixel. Moreover, because of the existing temporal gaps between the buoy and satellite observations and the highly variable snow depths due to surface melting, a single S-2 (10 m resolution) or MODIS (500 m resolution) pixel cannot fully represent the in situ observations. Therefore, we approximated the correspondence of the satellite and buoy data by considering satellite measurements in the adjacent 500 × 500 cells (the segment in Figure 3) of equal contribution to the buoy observation at the central cell (the one bounded by thick black lines in Figure 3).
It is worth noting that some of the neighboring areas of a buoy may be covered by melt ponds or leads. To exclude these areas, we applied a linearPolar algorithm to the image [20]. This algorithm can achieve the pixel-wise lead and melt-pond fractions; if the lead fraction or melt-pond fraction of a pixel was greater than 0, it was not considered for further analysis. If the lead and melt-pond fractions of a pixel equal 0, that means they contribute equally to the corresponding buoy observations in the central pixel. This allowed us to rule out the factors that may have compromised the quality of the satellite retrieval.
We calculated the broadband band albedo of each pixel of the satellite data. The broadband surface albedo was calculated using the narrowband spectral albedo data provided by the satellite [38]:
Here, represents the surface albedo of the broadband shortwave, denotes the narrowband albedo for the MODIS or S-2 band ( = 1, 2, …, 7) and represents the coefficients for the conversions from the narrowband albedo to the broadband albedo, as detailed in Table 1. The coefficients used in this study were sourced from Stroeve et al. [39] and Kathrin et al. [40] for snow/ice surfaces.
4. Results
In this section, we examine the simplified model radiation transfer model and the Delta-Eddington solar radiation model to demonstrate whether the simplified model is capable of reproducing the observed snow depth of the buoys comparably to the Delta-Eddington solar radiation model. First, the model was run with the introduced parameter setting, and then we compared the simulated results of the two snow albedo schemes with the in situ snow-depth observations.
Figure 4 illustrates the various parameters related to the solar radiation transfer of the sea-ice cover. In the case of snow covering the sea ice, the Delta-Eddington solar radiation treatment allows for an analysis of solar radiation transfer that is influenced by both snow depth and snow grain size. As the temperature of the ice surface rises, it leads to an increase in the size of individual snow grains. The larger grain size results in each snow grain becoming more effective at absorbing solar radiation. Consequently, as the snow grains grow larger and more absorbent, the asymptotic albedos of thick snow layers decrease. [26]. As shown in Figure 4, as the ice surface temperature of the snowpack rises, a thicker snow depth is required to shield the underlying sea ice from penetrating solar radiation. When ice surface temperatures are closer to zero, just a few centimeters of snow are sufficient to block solar radiation from reaching the sea ice below. Additionally, it is essential to consider the spectral distribution of the incoming solar flux and the solar zenith angle. Clouds modify the distribution of the solar radiation flux between diffuse and direct components. When cloud cover is high, diffuse radiation levels increase as a result of increased cloud height and coverage; therefore, scattering of radiation increases, particularly in comparison to clear-sky conditions.
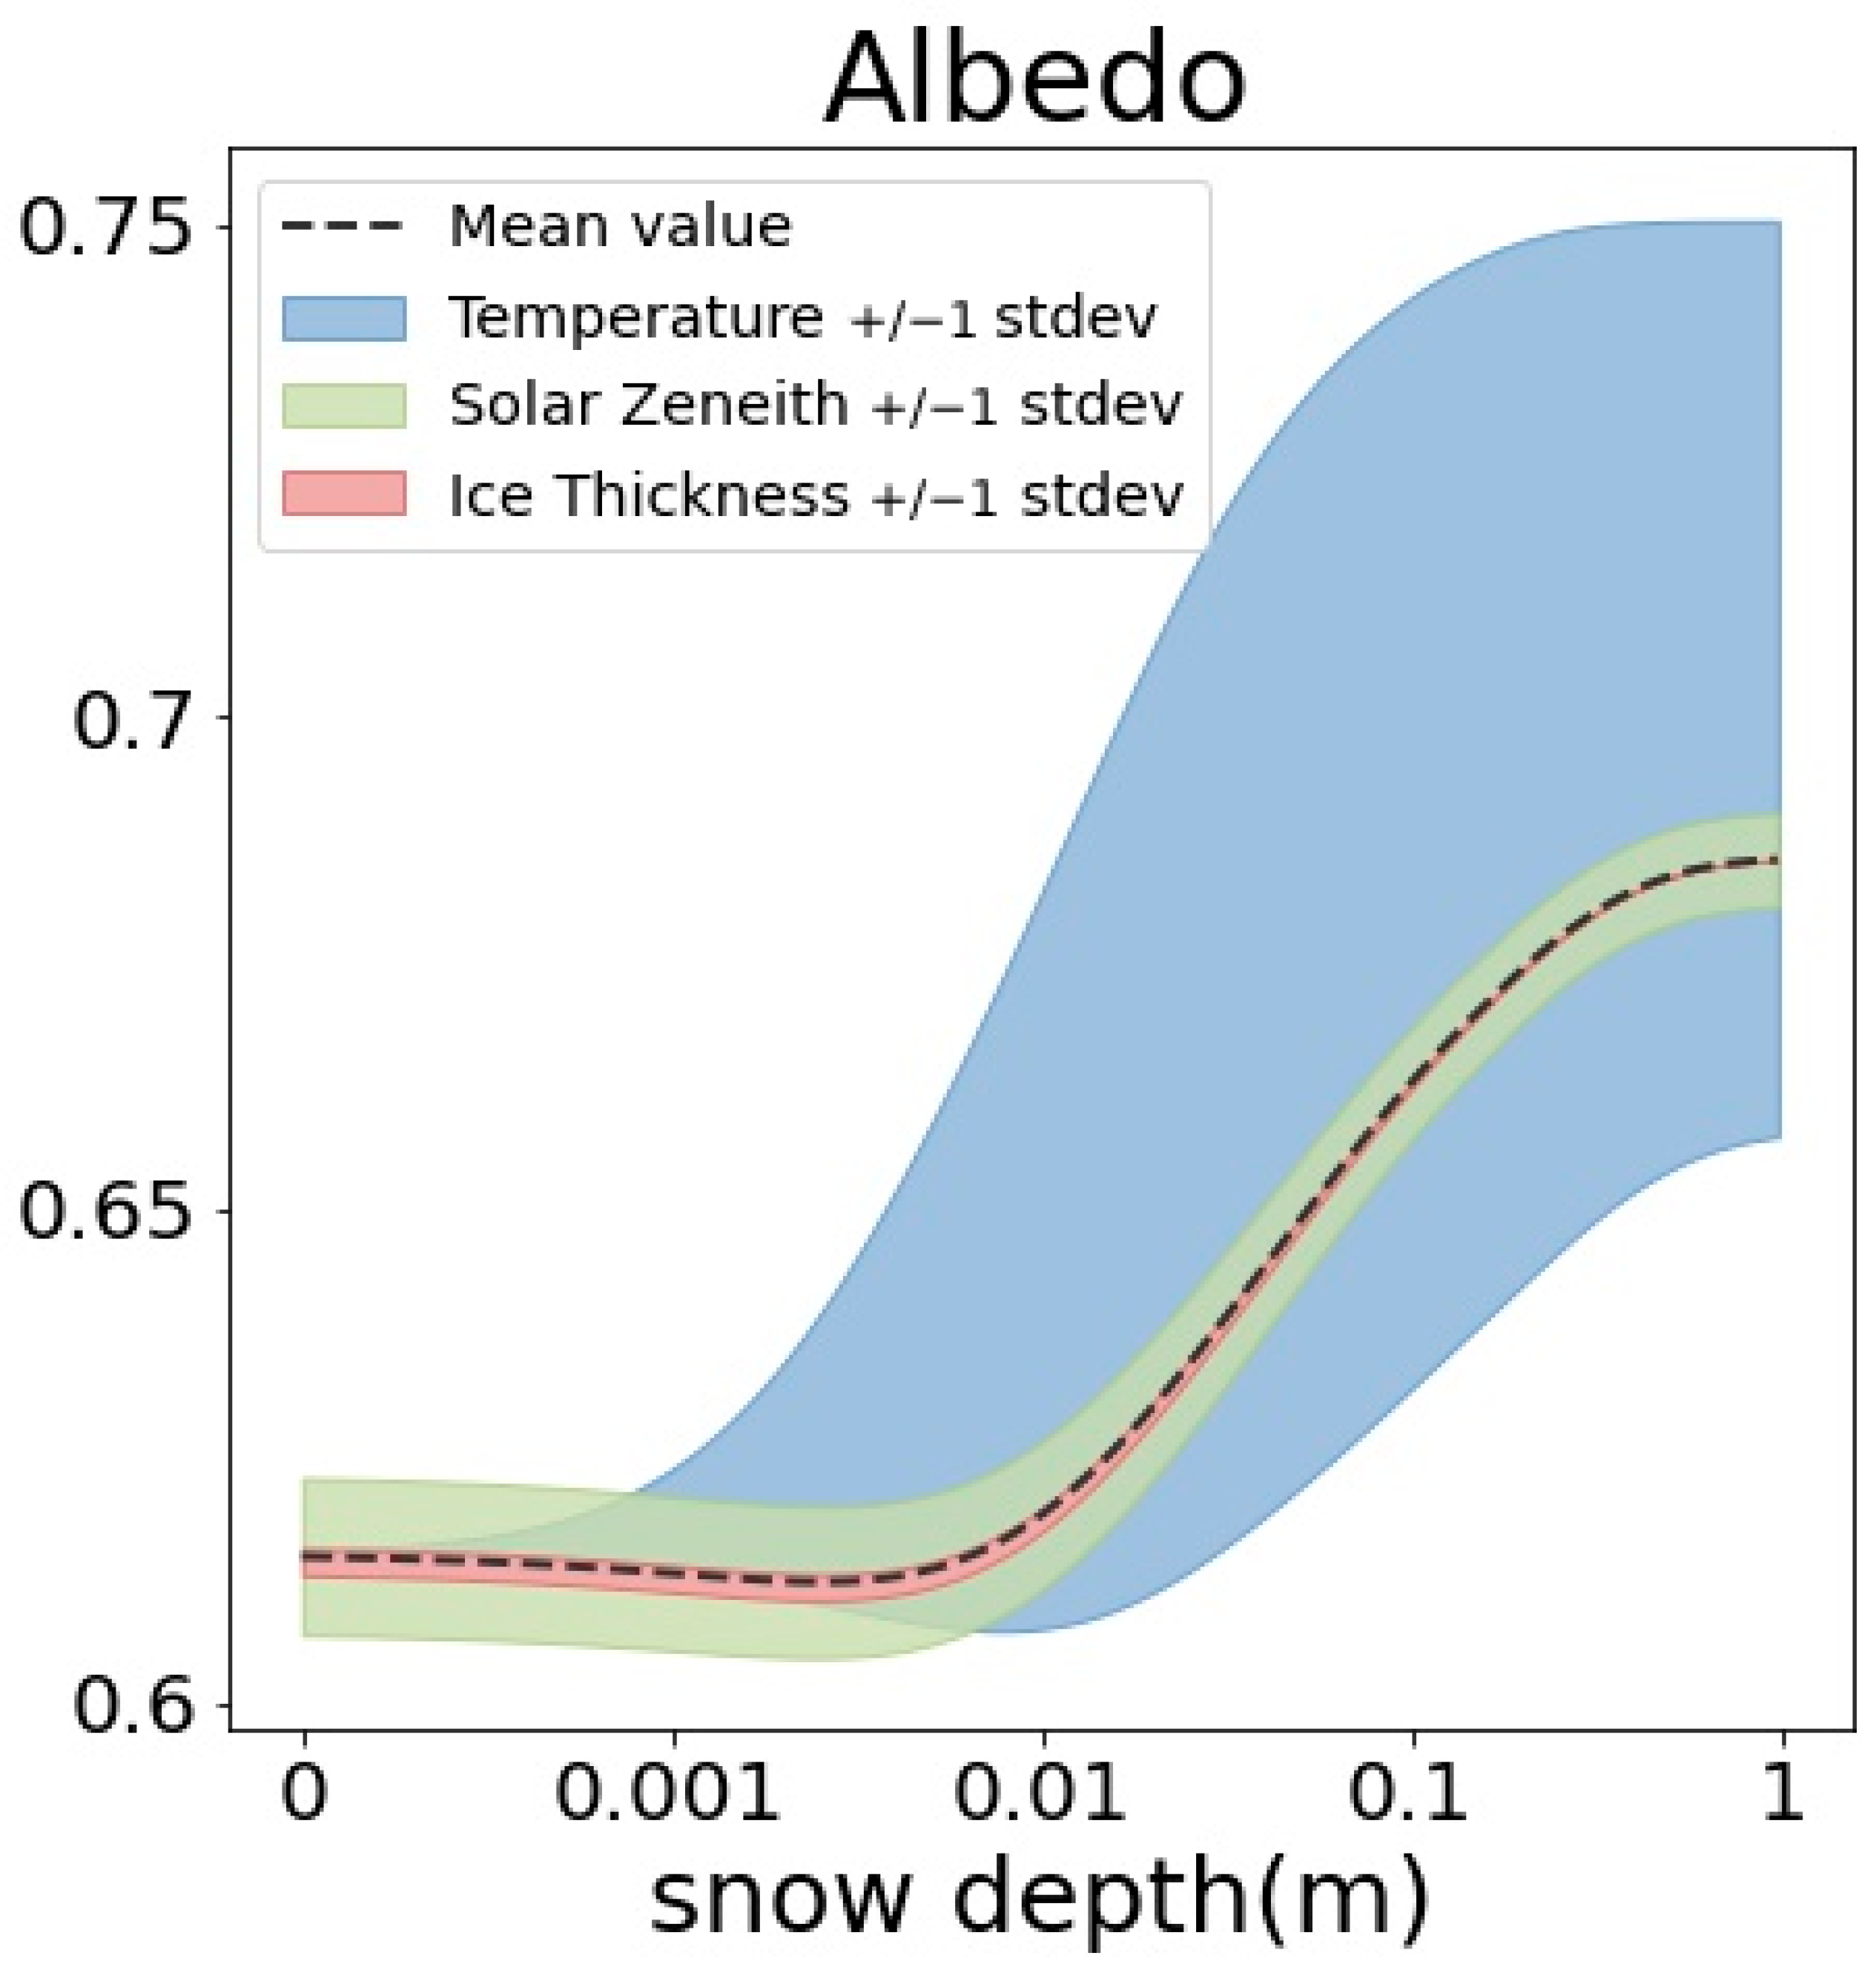
We analyzed the effects of the above-mentioned parameters on snow albedo in reference to a case study from the Delta-Eddington solar radiation model. The uncertainty of the simulated snow albedo has been computed using biased standard deviation estimation concerning the mean values of various parameters that do not involve perturbation. Figure 5 shows the relative uncertainty of the albedo for all scenarios. The albedo variation caused by temperature changes is at most about 0.1; compared to temperature changes, solar zenith and ice thickness play a minor role in albedo variation. Therefore, we can assume that temperature plays a dominant role in the uncertainty of the retrieved snow albedo. Moreover, for a given temperature, the uncertainty in the retrieved albedo is relatively higher for thicker snowpacks.
For the verification of the proposed methods, we used IMB and SIMBA buoy observation data. We conducted the retrieval of the snow albedo from the cloud-free images (MODIS and S-2) that cover the IMB and SIMBA buoy observations (as in Section 3.3). We investigated the dependence of the surface albedo on the snow depth and ice surface temperature using the buoy observations and the retrieved broadband satellite albedo. Figure 6 shows 38 S-2 cases and 10 MODIS cases of those measurements. In addition, the albedo parameterization calculated using the (1) Delta-Eddington solar radiation model and the (2) simplified snow albedo scheme are displayed for different snow grain sizes (shown as isolines). The cases involve strong variability in snow depth, albedo and ice surface temperature (snow grain size) that was distributed in different ice regimes of the Arctic. The surface temperatures were close to or above zero, indicating a late spring/summer season [41]. The simulated albedo values for the 1000 µm grain size (dashed curve in Figure 6) ranged from 0.66 for low snow depth to albedo values above 0.73 for a snow depth larger than 0.5 m. Figure 6 presents the overall trend of increasing snow depth with decreasing snow grain size; the slope, however, follows the parameterization for snow grain sizes between 2000 µm for lower snow-depth values and 500 µm for higher snow-depth values. This might be related to different snow melting stages, as the distribution of the data includes different times and areas in the Arctic.
Extrapolating the observations (pairs of variates) of snow depth and surface albedo along the isolines of the 2000 µm snow grain size to a snow depth of over 0.5 m gives an estimate of the extremely thick snow surface albedo. In the example given in Figure 6, for a snow depth of over 0.5 m and a snow grain size of 2000 µm, a cloud-free albedo of 0.76 is estimated, which is 0.01 lower than the observed one. For snow-depth values exceeding the limitation of the parameterization, we assumed a maximum valid snow depth of 0.5 m; this is based on the truth that thick snow depths rarely exist during the beginning of the melting season. Surface albedo values above or below the range of the parameterization have been removed through filtering. Consequently, by combining the appropriate lookup tables of the Delta-Eddington solar radiation model and observation-fitted simplified albedo scheme, a continuous estimate of snow depth is provided, which considers the snow grain size–snow surface temperature interaction.
As shown in Figure 6 (bottom), the Delta-Eddington solar radiation transfer model fit for snow depth features an R-value of 0.83 and RMSE of 0.072, while the simplified snow albedo scheme fit (using the parameters a = −0.061, b = 1.20, c = 9.47, d = −0.16) features an R-value of 0.89 and RMSE of 0.053. For the retrieval accuracy of snow depth using different remote sensing sensors (Table 2), the S-2 cases exhibit greater retrieval accuracy when compared to the MODIS cases in both methods, as the S-2 cases have a higher resolution than the MODIS cases and produce more accurate albedo values of the snow surfaces. These results indicate that the retrieval is in good agreement with the observations. The simplified snow albedo scheme has a higher accuracy and computing efficiency. The uncertainty, however, increases more rapidly with higher snow-depth values, which is discussed in the next section.
5. Discussion
The light within the first few centimeters of the snowpack is effectively diffuse and isotropic owing to multiple scattering [42]; if thick enough, the snowpack can be considered optically infinite. As a result of that, the snow surface albedo was demonstrated to decay exponentially with decreasing snow depth. In addition, the slope’s overall trend follows the parameterization for snow grain size: for a larger snow-grain size, the albedo of the snow cover increases rapidly with an increase in the depth of the snow cover (within 0–20 cm) and appears to become independent of depth when the snow cover is greater than approximately 20 cm, as shown in Figure 6 (top left and right). For a smaller snow-grain size (following the parametrization of this study, the surface temperature is higher), the snow surface albedo and snow depth are relatively closer to a linear fashion, i.e., have high co-variability. As a result, the retrievability is higher in the beginning of the melting season (the snow grain size is higher) compared with the retrieval during the freezing season.
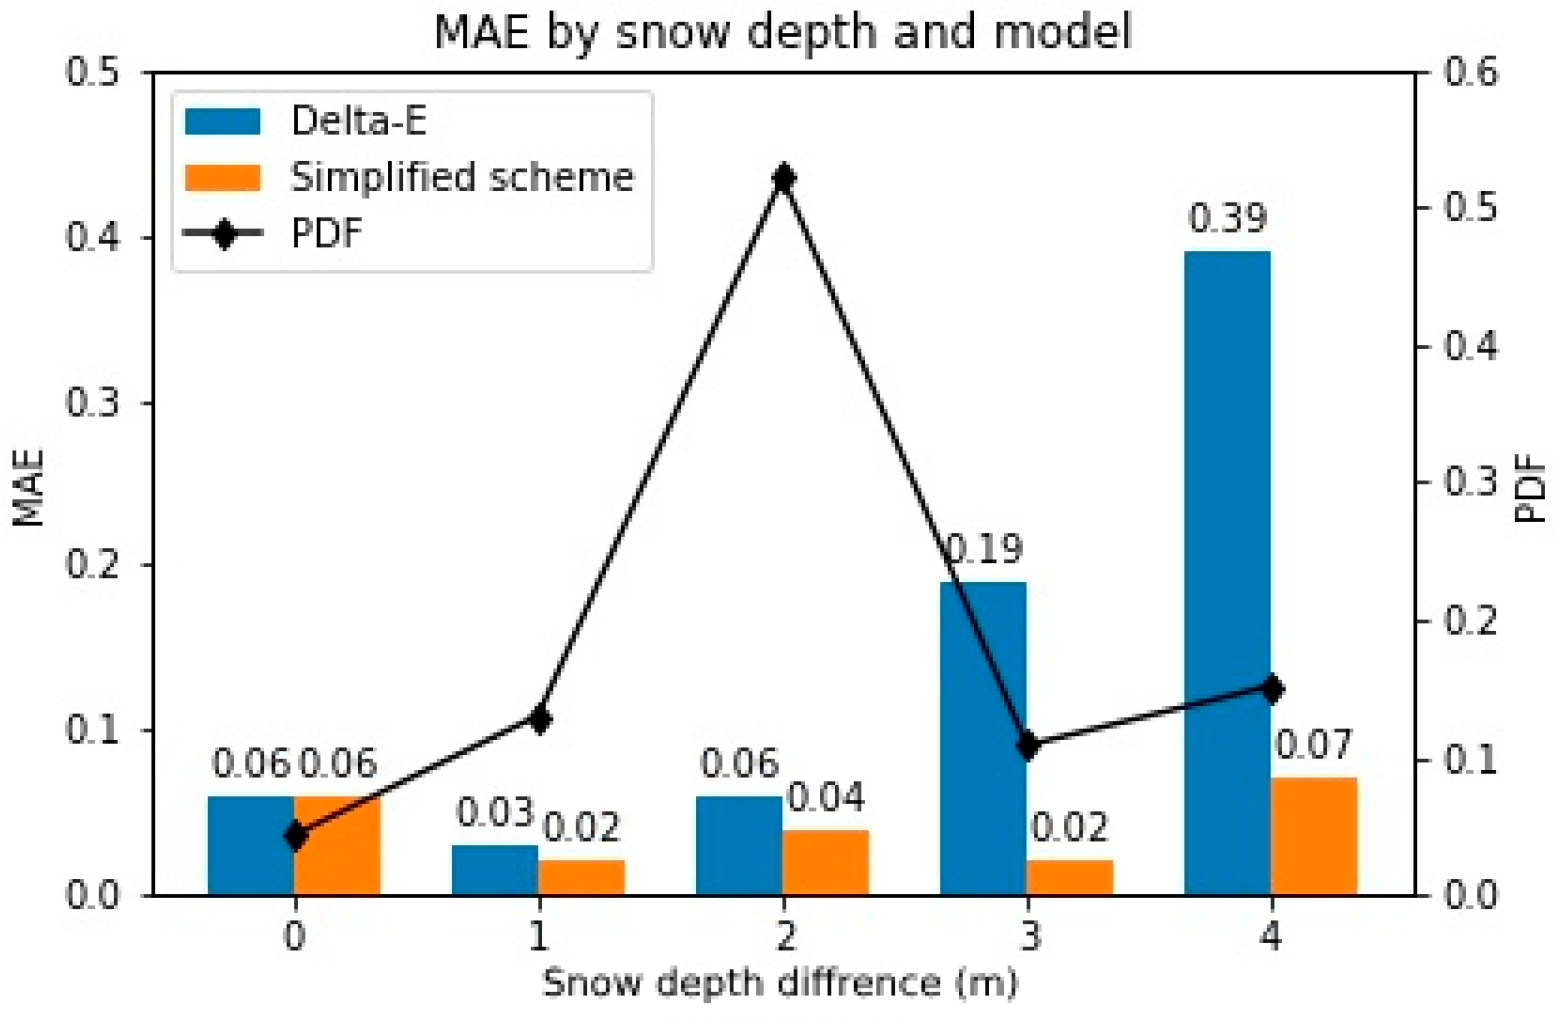
To quantify the snow-depth retrieval performance, the histogram of the differences between the satellite-derived snow depth and buoy snow depth as well as the probability distribution function (PDF) of the snow depth is shown in Figure 7. The differences of the satellite-derived snow depth minus the buoy snow depth that range between 0 and 0.1 m, 0.1 and 0.2 m, 0.2 and 0.3 m and 0.3 and 0.5 m are shown. Overall, the differences are much smaller over thin snowpack than over thick snowpack, which follows the finding that the correlation and the RMSE are generally better over thin snowpack (see Figure 6). Considering the entire snow-depth range, the mean difference is less than 7 cm. For the Delta-Eddington solar radiation model, the differences are smaller than 6 cm when the snow depth is lower than 30 cm; the differences are greater than 19 cm when the snow-depth values are higher than 30 cm. Comparing the buoy snow depths and the satellite-derived snow depths based on the Delta-Eddington solar radiation model and the simplified snow albedo scheme, we can demonstrate that the simplified snow albedo scheme retrieval performs better. The mean difference of the buoy snow depth minus the satellite-imagery snow depth based on the simplified snow albedo scheme is 4.1 cm when using the regression coefficients derived in this study and 11 cm when using the Delta-Eddington solar radiation model; that is, the simplified snow albedo scheme retrieval has a smaller bias. However, the differences spread widely for thick snowpack, whereas only 15% of the snow depths are over 0.4 cm. When employing the Delta-Eddington solar radiation model, the accuracy of snow-depth retrieval from S-2 data is 10% higher than that from MODIS data. In the case of the simplified snow albedo scheme, the S-2 data yield a snow-depth accuracy that is 12% higher than that of the MODIS data. This highlights that higher-resolution data produce more precise measurements of snow depth.
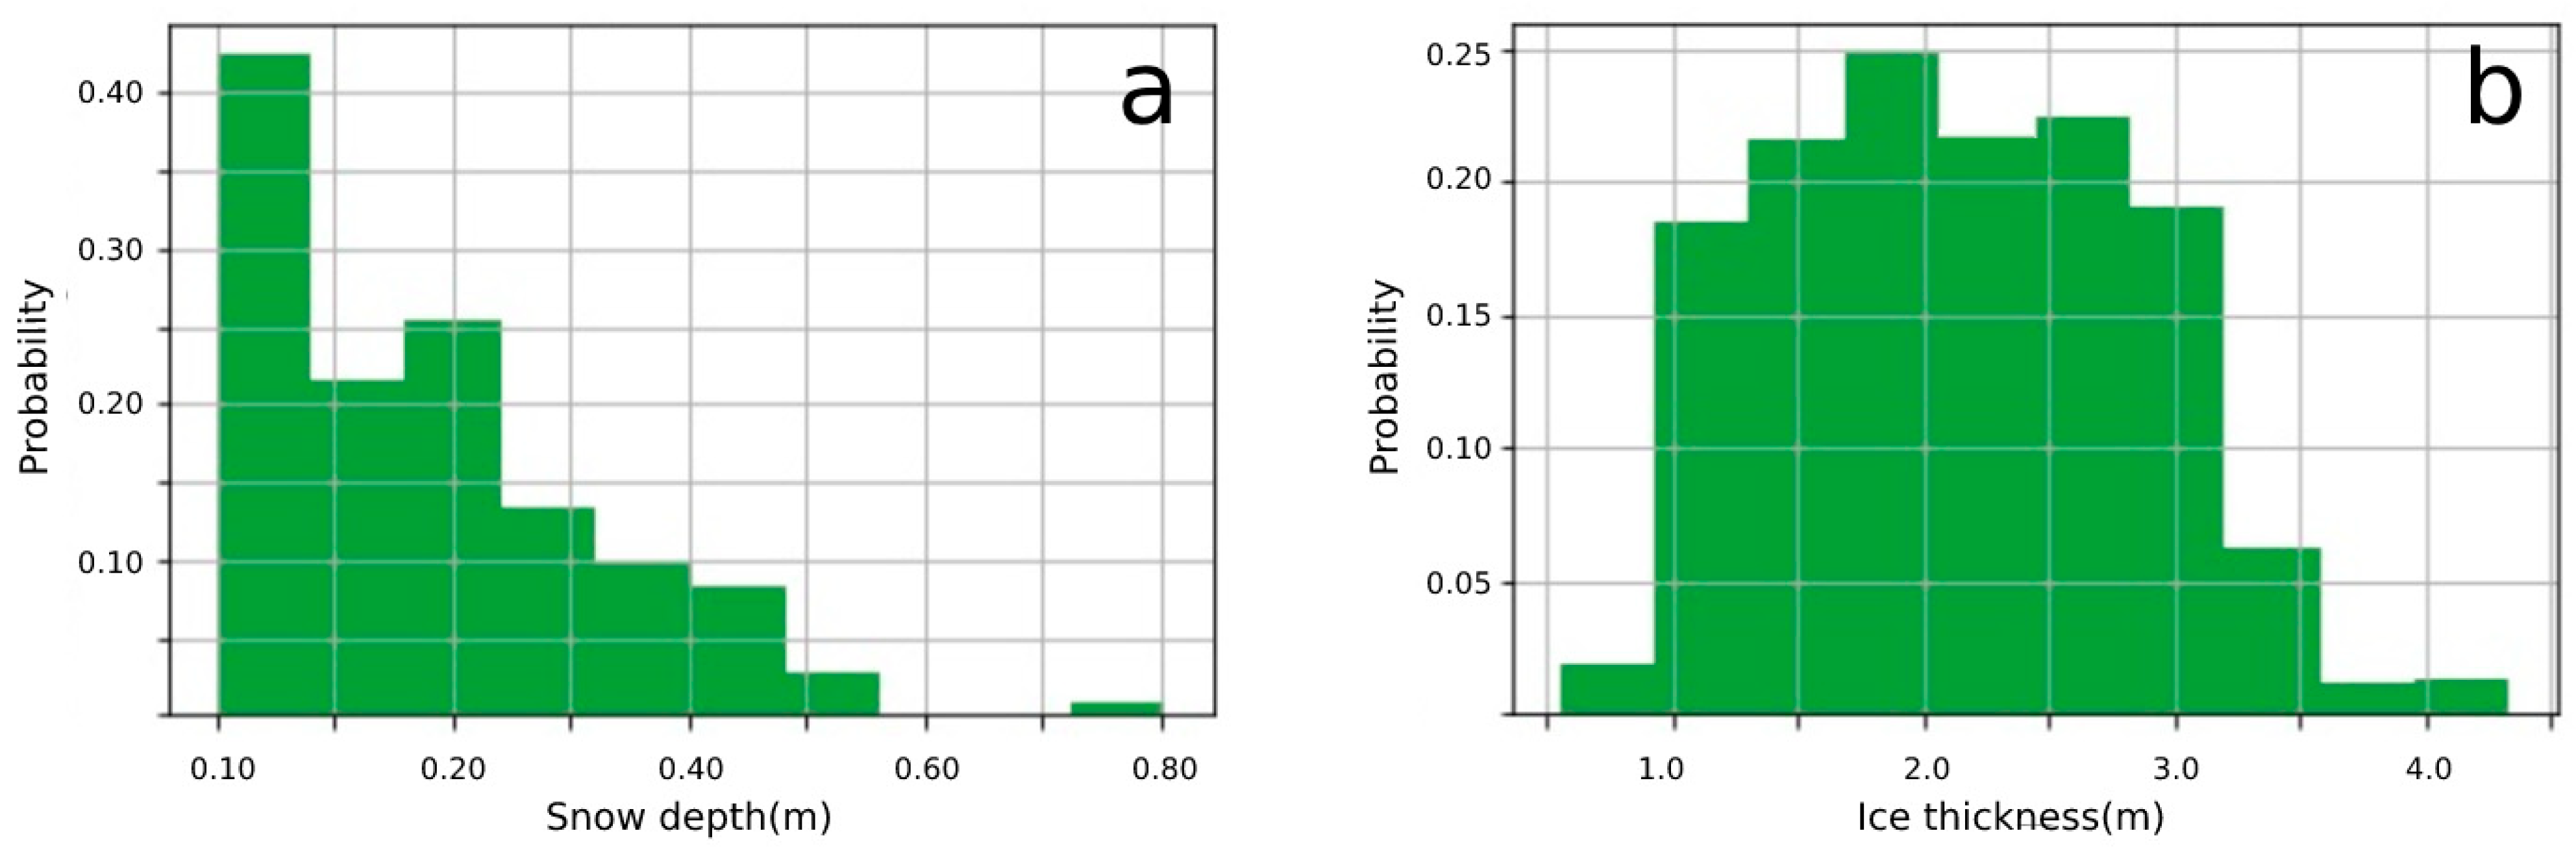
As shown in Figure 8a, only 3% of the buoy-derived measurements of snow depth are higher than 0.5 m. Because of the absence of very thick snow (>0.5 m) during the early summer season, this comparison can be regarded as a preliminary assessment of the potential uncertainties of the proposed method. Figure 8a also demonstrates that optical satellites can be used for snow-depth retrieval lower than 0.5 m, i.e., during the early summer season. Thus, considering our comparison with the buoy data, we conclude that the new, simplified snow albedo scheme shows reasonable results for regional retrieval for melting snowpack using S-2 and MODIS data.
The snow-depth retrieval method was developed assuming that the sea ice underneath the snowpack is optically infinite; over thin sea ice, the accuracy of the method is limited. Figure 8b shows the probability thickness of the sea ice which is covered by snow when using all available buoy data, highlighting that only 3% of the buoy-derived ice thickness is below 1 m. The major reason for the absence of snowpack over thin ice is that the higher thermal conductivity of thin ice accelerates summer snowpack melting; another reason is that buoys tend to be ported on thick ice, and there are not many thin-ice samples. Taking these results into account, additional evaluation of snow-depth retrieval over thin ice is needed. We, therefore, recommend that the application of the optical-based snow-depth retrieval be limited to cases of thick ice (thickness >1 m) and thin snow depth < 0.5 m.
6. Conclusions
In this study, we introduce an algorithm for retrieving the snow depth of Arctic sea ice using S-2 and MODIS data, and a continuous estimate of snow depth is provided that considers the snow grain size–snow surface temperature interaction. We compared the new algorithm, a simplified snow-depth albedo scheme, with the Delta-Eddington solar radiation model. The modeled parameters are tuned to observational data [43], and the snow depth was inversed from the model simulation results using a lookup-table-based method. The results of the simulation show that temperature plays a dominant role in the uncertainty of the retrieved snow albedo, while the solar zenith and underneath ice thickness play a minor role in terms of albedo variation, especially for thicker snowpacks.
An assessment of the retrieved snow depth against IMB and SIMBA buoy measurements shows good results, especially for thin snowpack. For the simplified snow albedo scheme, a mean difference of 4.1 cm between the satellite-retrieval and buoy measurements was found, with 93% of the differences being smaller than 5 cm (with the observed snow depth being less than 40 cm) (Figure 7). For comparison, using the Delta-Eddington solar radiation model, about 55% of the differences are below 5 cm, and thicker snowpack has a larger bias.
In contrast to retrievals based on radar altimetry, the influence of melt ponds and leads in the new approach is less pronounced. Moreover, sea-ice thickness products based on radar data have turned out to be useful only in the winter/early spring period because of the potential complexity of surface melting and the lack of snow data available during late spring and summer. To extend these estimates to the early summer season, we applied a surface classification procedure to optical satellite imagery and introduced an approach to derive snow depth from optical satellite imagery using a simplified solar radiation transfer model. This approach can be applied to optical satellite imagery acquired under clear-sky conditions and can serve as an addition to overcome the limitations of the existing methods [44,45,46,47].
Besides the improved performance, there are several disadvantages of using the snow surface albedo for snow-depth retrieval from optical satellite measurements. Measurements using VIS/IR are less influenced by surface melt but show a lower penetration depth, resulting in a bad performance for snow depths larger than 0.5 m. Cloud coverage limits the application of optical satellites in the freezing season of polar regions, and there is essentially no snow in late summer, so the method should only be used for early summer snow-depth retrieval. The additional surface melting and leads information provided by the optical satellite retrieval could be helpful for possible snow-depth measurements based on altimetry. The typical resolution of ICESat-2 is 70 m, and CryoSat-2 has a resolution of 300 m, which is comparable to the resolution of optical satellite imagery such as that from the S-2 and MODIS. Furthermore, the proposed snow-depth retrieval may be further incorporated in the combined retrieval with active–passive microwave remote sensing data to extend snow-depth and ice-thickness estimates across all seasons.
Author Contributions
Conceptualization of the study was conducted by M.W., the methodology was developed by M.W., M.W. conducted the processing and validation of the data, M.W. prepared the original draft and N.O. reviewed and edited the manuscript. The work was conducted under the supervision of N.O. All authors have read and agreed to the published version of the manuscript.
Funding
This research was funded by the Chinese Government Scholarship (No.201909370082) within the scope of a stipend entitled “Improving Arctic sea ice albedo parametrization using field and remote sensing data”.
Acknowledgments
We kindly acknowledge the financial support from Land Schleswig-Holstein within the funding program Open Access Publikationsfonds. We kindly acknowledge the provision of Sentinel-2 data by the European Space Agency (ESA) and the provision of MODIS data by NASA. We thank the persons involved in the MOSAiC expedition for the provision of SIMBA data, and we thank CRREL for the provision of IMB data.
Conflicts of Interest
The authors declare no conflict of interest.
References
- Screen, J.A.; Simmonds, I. The central role of diminishing sea ice in recent Arctic temperature amplification. Nature 2010, 464, 1334–1337. [Google Scholar] [CrossRef] [PubMed]
- McPhee, M.G.; Proshutinsky, A.; Morison, J.H.; Steele, M.; Alkire, M.B. Rapid change in freshwater content of the Arctic Ocean. Geophys. Res. Lett. 2009, 36, L10602. [Google Scholar] [CrossRef]
- Kurtz, N.T.; Markus, T.; Farrell, S.L.; Worthen, D.L.; Boisvert, L.N. Observations of recent Arctic sea ice volume loss and its impact on ocean-atmosphere energy exchange and ice production. J. Geophys. Res. 2011, 116, C04015. [Google Scholar] [CrossRef]
- Perovich, D.K.; Jones, K.F.; Light, B.; Eicken, H.; Markus, T.; Stroeve, J.; Lindsay, R. Solar partitioning in a changing Arctic sea-ice cover. Ann. Glaciol. 2011, 52, 192–196. [Google Scholar] [CrossRef]
- Warren, S.G.; Rigor, I.G.; Untersteiner, N.; Radionov, V.F.; Bryazgin, N.N.; Aleksandrov, Y.I. Snow depth on Arctic sea ice. J. Clim. 1999, 12, 1814–1829. [Google Scholar] [CrossRef]
- Massom, R.; Eicken, H.; Haas, C.; Jeffries, M.; Drinkwater, M.; Sturm, M.; Worby, A.; Wu, X.; Lytle, V.; Ushio, S.; et al. Snow on Antarctic sea ice. Rev. Geophys. 2001, 39, 413–445. [Google Scholar] [CrossRef]
- Sturm, M.; Massom, R.A. Snow in the sea ice system: Friend or foe? In Sea Ice; John Wiley & Sons, Inc.: Hoboken, NJ, USA, 2017; pp. 65–109. [Google Scholar] [CrossRef]
- Powell, D.; Markus, T.; Cavalieri, D.; Gasiewski, A.; Klein, M.; Maslanik, J.; Stroeve, J.; Sturm, M. Microwave Signatures of Snow on Sea Ice: Modeling. IEEE Trans. Geosci. Remote Sens. 2006, 44, 3091–3102. [Google Scholar] [CrossRef]
- Lecomte, O.; Fichefet, T.; Massonnet, F.; Vancoppenolle, M. Benefits from representing snow properties and related processes in coupled ocean–sea ice models. Ocean Model. 2015, 87, 81–85. [Google Scholar] [CrossRef]
- Kwok, R.; Markus, T. Potential basin-scale estimates of Arctic snow depth with sea ice freeboards from CryoSat-2 and ICESat-2: An exploratory analysis. Adv. Space Res. 2017, 62, 1243–1250. [Google Scholar] [CrossRef]
- Kwok, R.; Kacimi, S.; Webster, M.A.; Kurtz, N.T.; Petty, A.A. Arctic snow depth and sea ice thickness from ICESat-2 and CryoSat-2 freeboards: A first examination. J. Geophys. Res. Oceans 2020, 125, e2019JC016008. [Google Scholar] [CrossRef]
- Kacimi, S.; Kwok, R. The Antarctic sea ice cover from ICESat-2 and CryoSat-2: Freeboard, snow depth, and ice thickness. Cryosphere 2020, 14, 4453–4474. [Google Scholar] [CrossRef]
- Markus, T.; Neumann, T.; Martino, A.; Abdalati, W.; Brunt, K.; Csatho, B.; Farrell, S.; Fricker, H.; Gardner, A.; Harding, D.; et al. The Ice, Cloud, and land Elevation Satellite-2 (ICESat-2): Science requirements, concept, and implementation. Remote Sens Environ. 2017, 190, 260–273. [Google Scholar] [CrossRef]
- Kwok, R.; Cunningham, G.F. ICESat over Arctic sea ice: Estimation of snow depth and ice thickness. J. Geophys. Res. 2008, 113, C08010. [Google Scholar] [CrossRef]
- Beaven, S.G.; Lockhart, G.L.; Gogineni, S.P.; Hossetnmostafa, A.R.; Jezek, K.; Gow, A.J.; Perovich, D.K.; Fung, A.K.; Tjuatja, S. Laboratory measurements of radar backscatter from bare and snow-covered saline ice sheets. Int. J. Remote Sens. 1995, 16, 851–876. [Google Scholar] [CrossRef]
- Laxon, S.W.; Giles, K.A.; Ridout, A.L.; Wingham, D.J.; Willatt, R.; Cullen, R.; Kwok, R.; Schweiger, A.; Zhang, J.; Haas, C.; et al. CryoSat-2 estimates of Arctic sea ice thickness and volume. Geophys. Res. Lett. 2013, 40, 732–737. [Google Scholar] [CrossRef]
- Petty, A.A.; Webster, M.; Boisvert, L.; Markus, T. The NASA Eulerian snow on sea ice model (NESOSIM) v1.0: Initial model development and analysis. Geosci. Model Dev. 2018, 11, 4577–4602. [Google Scholar] [CrossRef]
- Webster, M.A.; Holland, M.; Wright, N.C.; Hendricks, S.; Hutter, N.; Itkin, P.; Light, B.; Linhardt, F.; Perovich, D.K.; Raphael, I.A.; et al. Spatiotemporal evolution of melt ponds on Arctic sea ice: MOSAiC observations and model results. Elem. Sci. Anthr. 2022, 10, 1. [Google Scholar] [CrossRef]
- Rösel, A.; Kaleschke, L.; Birnbaum, G. Melt ponds on Arctic sea ice determined from MODIS satellite data using an artificial neural network. Cryosphere 2012, 6, 431–446. [Google Scholar] [CrossRef]
- Wang, M.; Su, J.; Landy, J.; Leppäranta, M.; Guan, L. A new algorithm for sea ice melt pond fraction estimation from high-resolution optical satellite imagery. J. Geophys. Res. Ocean. 2021, 125, e2019JC015716. [Google Scholar] [CrossRef]
- Ding, Y.; Cheng, X.; Liu, J.; Hui, F.; Wang, Z.; Chen, S. Retrieval of Melt Pond Fraction over Arctic Sea Ice during 2000–2019 Using an Ensemble-Based Deep Neural Network. Remote Sens. 2020, 12, 2746. [Google Scholar] [CrossRef]
- Xiong, C.; Ren, Y. Arctic sea ice melt pond fraction in 2000–2021 derived by dynamic pixel spectral unmixing of MODIS images. ISPRS J. Photogramm. Remote Sens. 2023, 197, 181–198. [Google Scholar] [CrossRef]
- Willmes, S.; Heinemann, G. Pan-Arctic lead detection from MODIS thermal infrared imagery. Ann. Glaciol. 2015, 56, 29–37. [Google Scholar] [CrossRef]
- Nicolaus, M.; Perovich, D.K.; Spreen, G.; Granskog, M.A.; von Albedyll, L.; Angelopoulos, M.; Anhaus, P.; Arndt, S.; Belter, H.J.; Bessonov, V.; et al. Overview of the MODAiC expedition: Snow and sea ice. Elem. Sci. Anthr. 2022, 10, 000046. [Google Scholar] [CrossRef]
- Hunke, E.C.; Lipscomb, W.H.; Turner, A.K.; Jeffery, N.; Elliott, S. CICE: The Los Alamos Sea Ice Model Documentation and Software User’s Manual Version 5.1; Technical Report; Los Alamos National Laboratory: Los Alamos, NM, USA, 2015; Volume 675, p. 500. [Google Scholar]
- Briegleb, P.; Light, B. A Delta-Eddington Mutiple Scattering Parameterization for Solar Radiation in the Sea Ice Component of the Community Climate System Model; University Corporation for Atmospheric Research: Beijing, China, 2007. [Google Scholar] [CrossRef]
- Shettle, E.P.; Weinman, J.A. The Transfer of Solar Irradiance Through Inhomogeneous Turbid Atmospheres Evaluated by Eddington’s Approximation. J. Atmos. Sci. 1970, 27, 1048–1055. [Google Scholar] [CrossRef]
- Wiscombe, W.J.; Warren, S.G. A model for the spectral albedo of snow. I: Pure snow. J. Atmos. Sci. 1980, 37, 2712–2733. [Google Scholar] [CrossRef]
- Flanner, M.G.; Zender, C.S. Snowpack radiative heating: Influence on Tibetan Plateau climate. Geophys. Res. Lett. 2005, 32, L06501. [Google Scholar] [CrossRef]
- Wang, Z.; Zeng, X.; Barlage, M.; Dickinson, R.E.; Gao, F.; Schaaf, C.B. Using MODIS BRDF and albedo data to evaluate global model land surface albedo. J. Hydrometeorol. 2005, 5, 3–14. [Google Scholar] [CrossRef]
- Riggs, A.G.; Hall, D.K.; Ackerman, A.S. Sea Ice Extent and Classification Mapping with the Moderate Resolution Imaging Spectroradiometer Airborne Simulator. Remote Sens. Environ. 1999, 68, 152–163. [Google Scholar] [CrossRef]
- Vermote, E.; Wolfe, R. MYD09GA MODIS/Aqua Surface Reflectance Daily L2G Global 1 km and 500 m SIN Grid V006; NASA EOSDIS LP DAAC: Sioux Falls, SD, USA, 2015. [Google Scholar] [CrossRef]
- Main-Knorn, M.; Pflug, B.; Louis, J.; Debaecker, V.; Müller-Wilm, U.; Gascon, F. Sen2Cor for Sentinel-2. Image Signal Process. Remote Sens. XXIII SPIE 2017, 10427, 37–48. [Google Scholar] [CrossRef]
- Simmons, A. ERA-Interim: New ECMWF reanalysis products from 1989 onwards. ECMWF Newslett. 2006, 110, 26–35. [Google Scholar] [CrossRef]
- Perovich, D.K.; Richter-Menge, J.A.; Elder, B.; Claffey, K.; Polashenski, C. Observing and Understanding Climate Change: Monitoring the Mass Balance, Motion, and Thickness of Arctic Sea Ice; Cold Regions Research and Engineering Laboratory: Hanover, PA, USA, 2017; Available online: https://imb-crrel-dartmouth.org (accessed on 18 May 2023).
- Blanchard-Wrigglesworth, E.; Webster, M.; Farrell, S.; Bitz, C. Reconstruction of snow on Arctic sea ice. J. Geophys. Res. Ocean. 2018, 123, 3588–3602. [Google Scholar] [CrossRef]
- Lei, R.; Cheng, B.; Hoppmann, M.; Zuo, G. Auxiliary Data from SIMBA-Type Sea Ice Mass Balance Buoy 2019T67; PANGAEA: Bremen, Germany, 2021. [Google Scholar] [CrossRef]
- Shunlin, L. Narrowband to broadband conversions of land surface albedo I: Algorithms. Remote Sens. Environ. 2001, 76, 213–238. [Google Scholar] [CrossRef]
- Stroeve, J.; Box, J.; Gao, F.; Liang, S.; Nolin, A.; Schaaf, C. Accuracy assessment of the MODIS 16-day snow albedo product: Comparisons with Greenland in situ measurements. Remote Sens. Environ. 2005, 94, 46–60. [Google Scholar] [CrossRef]
- Naegeli, K.; Damm, A.; Huss, M.; Wulf, H.; Schaepman, M.; Hoelzle, M. Cross-Comparison of Albedo Products for Glacier Surfaces Derived from Airborne and Satellite (Sentinel-2 and Landsat 8) Optical Data. Remote Sens. 2017, 9, 110. [Google Scholar] [CrossRef]
- Jäkel, E.; Stapf, J.; Wendisch, M.; Nicolaus, M.; Dorn, W.; Rinke, A. Validation of the sea ice surface albedo scheme of the regional climate model HIRHAM–NAOSIM using aircraft measurements during the ACLOUD/PASCAL campaigns. Cryosphere 2019, 13, 1695–1708. [Google Scholar] [CrossRef]
- Warren, S.G. Optical properties of snow. Rev. Geophys. Space Phys. 1982, 20, 67–89. [Google Scholar] [CrossRef]
- Kim, J.G.; Hunke, E.C.; Lipscomb, W.H. Sensitivity analysis and parameter tuning scheme for global sea-ice modeling. Ocean Model. 2006, 14, 61–80. [Google Scholar] [CrossRef]
- Tang, Z.; Wang, X.; Deng, G.; Wang, X.; Jiang, Z.; Sang, G. Spatiotemporal variation of snowline altitude at the end of melting season across High Mountain Asia, using MODIS snow cover product. Adv. Space Res. 2020, 66, 2629–2645. [Google Scholar] [CrossRef]
- Tang, Z.; Deng, G.; Hu, G.; Zhang, H.; Pan, H.; Sang, G. Satellite observed spatiotemporal variability of snow cover and snow phenology over High Mountain Asia from 2002 to 2021. J. Hydrol. 2022, 613, 128438. [Google Scholar] [CrossRef]
- Li, X.; Jing, Y.; Shen, H.; Zhang, L. The recent developments in cloud removal approaches of MODIS snow cover product. Hydrol. Earth Syst. Sci. 2019, 23, 2401–2416. [Google Scholar] [CrossRef]
- Hao, X.; Huang, G.; Zheng, Z.; Sun, X.; Ji, W.; Zhao, H.; Wang, J.; Li, H.; Wang, X. Development and validation of a new MODIS snow-cover-extent product over China. Hydrol. Earth Syst. Sci. 2022, 26, 1937–1952. [Google Scholar] [CrossRef]
Figure 1.
Flow chart of the proposed inversion method.

Figure 2.
Conceptual scheme of surface-albedo–cloud interaction.

Figure 3.
Data match between buoy observations and S-2 data provided on the 10 m resolution grid (shown with rectangular cells). IMB data within a grid cell are considered to contribute equally to the value of the grid cell (outlined in thick black).
Figure 3.
Data match between buoy observations and S-2 data provided on the 10 m resolution grid (shown with rectangular cells). IMB data within a grid cell are considered to contribute equally to the value of the grid cell (outlined in thick black).

Figure 4.
Bias of the snow surface albedo (contour) caused by the change from cloudy to overcast sky as a function of snow depth (horizontal axis), ice thickness (vertical axis), ice surface temperature (t) and solar zenith (z).
Figure 4.
Bias of the snow surface albedo (contour) caused by the change from cloudy to overcast sky as a function of snow depth (horizontal axis), ice thickness (vertical axis), ice surface temperature (t) and solar zenith (z).

Figure 5.
The uncertainty of the simulated snow albedo computed using biased standard deviation estimation with respect to the mean values of snow surface temperature, solar zenith and ice thickness.
Figure 5.
The uncertainty of the simulated snow albedo computed using biased standard deviation estimation with respect to the mean values of snow surface temperature, solar zenith and ice thickness.

Figure 6.
Top left: the change in snow albedo with respect to snow depth and different grain sizes, simulated with Delta-Eddington solar radiation transfer model; top right: the change in snow albedo with respect to snow depth and different grain sizes, simulated with observation-fitted simplified albedo scheme; bottom left: comparison of the Delta-Eddington estimation snow depth and in situ observation; bottom right: comparison of the simplified albedo scheme estimation snow depth and in situ observation.
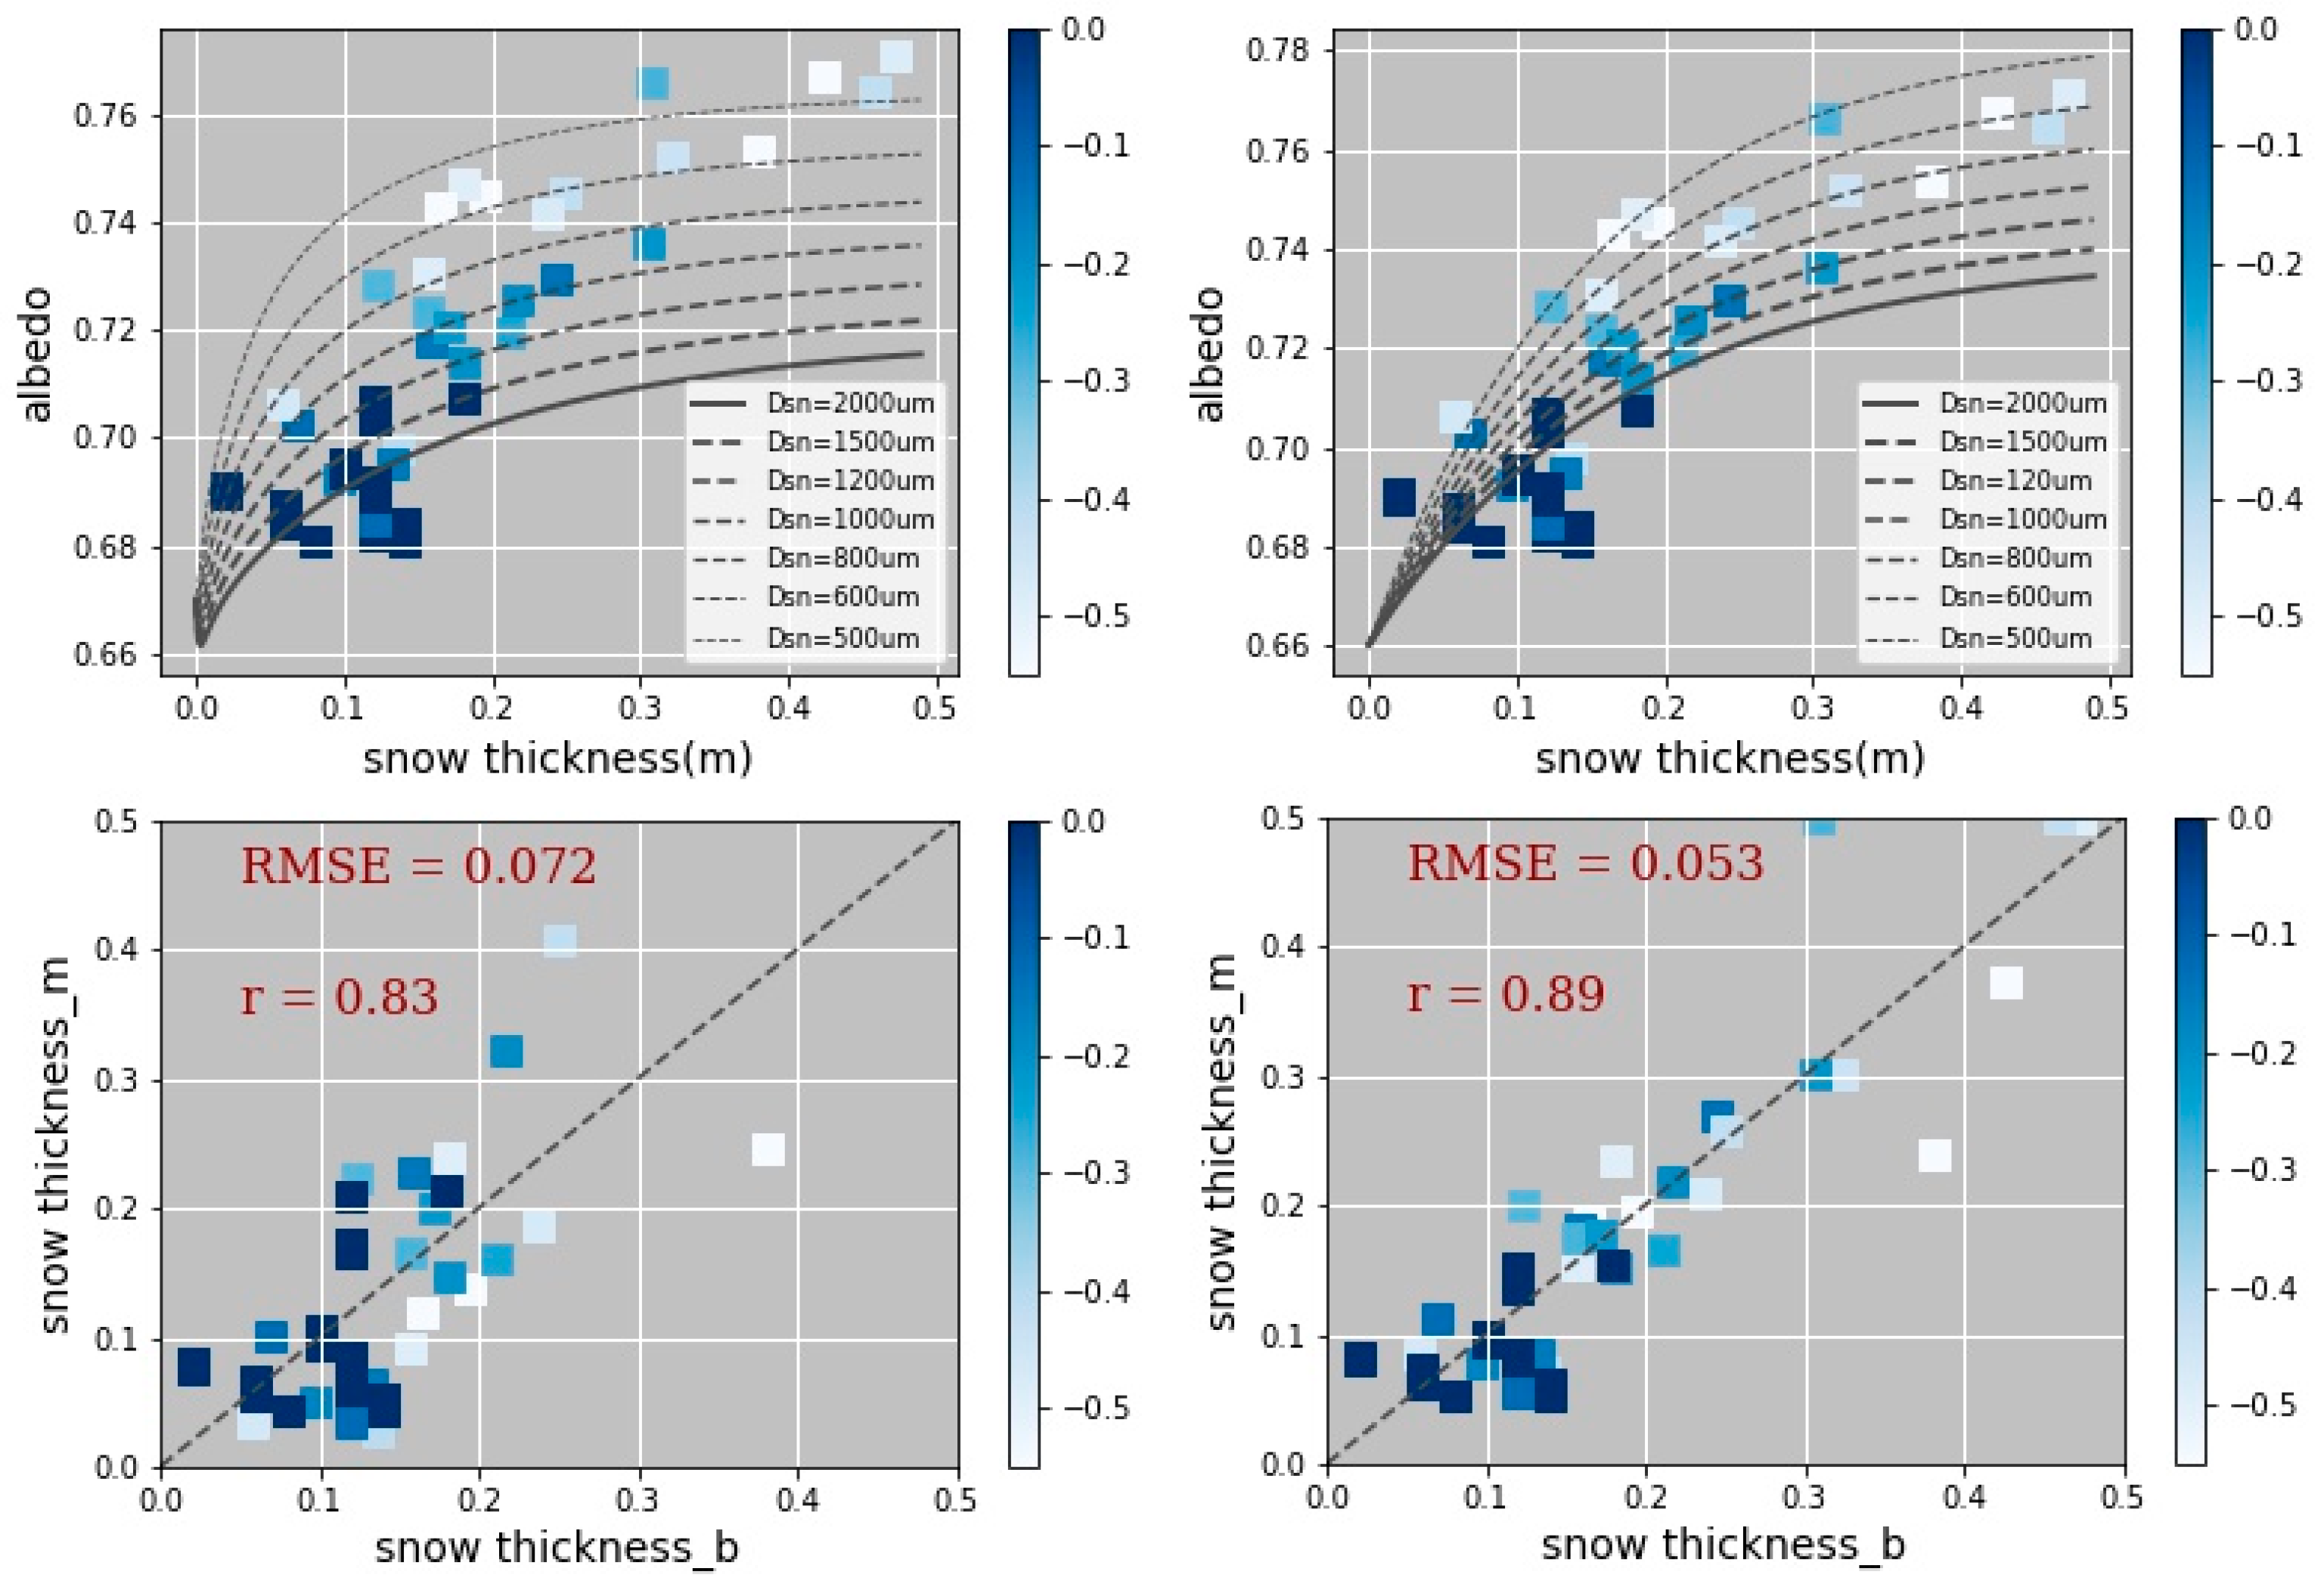
Figure 7.
The histogram of the differences of satellite-derived snow depth minus buoy-derived snow depth and the PDF of snow depth; the blue bar indicates differences of the Delta-Eddington, the yellow bar is the simplified albedo scheme and the black line is the PDF of the buoy-observed snow depth.

Figure 8.
(a) PDF of the buoy-observed snow depth; (b) PDF of the buoy-observed ice thickness.

Table 1.
Coefficients for narrowband to broadband conversions over snow/ice surfaces.
| Coefficients | ||||||||
|---|---|---|---|---|---|---|---|---|
| The wavelength range of MODIS bands () | (Offset) | (0.62–0.67) | (0.84–0.87) | (0.46–0.48) | (0.54–0.56) | (1.23–1.25) | (1.63–1.65) | (2.11–2.15) |
| Snow/ice | −0.0093 | 0.1574 | 0.2789 | 0.3829 | 0.0000 | 0.1131 | 0.0000 | 0.0694 |
| The central wavelength of Sentinel-2 bands () | (Offset) | 0.490 | 0.560 | 0.665 | 0.842 | 0.865 | 1.610 | 2.190 |
| Snow/ice | −0.0018 | 0.356 | 0.0000 | 0.130 | 0.373 | 0.0000 | 0.085 | 0.072 |
Table 2.
Correlation coefficient and RMSE using different methods and sensors.
| Correlation Coefficient/RMSE | Modis | S-2 |
|---|---|---|
| Delta-Eddington model | 0.77/0.15 | 0.85/0.063 |
| Simplified snow albedo scheme | 0.81/0.084 | 0.91/0.049 |
Disclaimer/Publisher’s Note: The statements, opinions and data contained in all publications are solely those of the individual author(s) and contributor(s) and not of MDPI and/or the editor(s). MDPI and/or the editor(s) disclaim responsibility for any injury to people or property resulting from any ideas, methods, instructions or products referred to in the content. |
© 2023 by the authors. Licensee MDPI, Basel, Switzerland. This article is an open access article distributed under the terms and conditions of the Creative Commons Attribution (CC BY) license (https://creativecommons.org/licenses/by/4.0/).
Share and Cite
MDPI and ACS Style
Wang, M.; Oppelt, N. Estimating Early Summer Snow Depth on Sea Ice Using a Radiative Transfer Model and Optical Satellite Data. Remote Sens. 2023, 15, 5016. https://doi.org/10.3390/rs15205016
AMA Style
Wang M, Oppelt N. Estimating Early Summer Snow Depth on Sea Ice Using a Radiative Transfer Model and Optical Satellite Data. Remote Sensing. 2023; 15(20):5016. https://doi.org/10.3390/rs15205016
Chicago/Turabian StyleWang, Mingfeng, and Natascha Oppelt. 2023. "Estimating Early Summer Snow Depth on Sea Ice Using a Radiative Transfer Model and Optical Satellite Data" Remote Sensing 15, no. 20: 5016. https://doi.org/10.3390/rs15205016
Note that from the first issue of 2016, this journal uses article numbers instead of page numbers. See further details here.