
Spatio-Temporal Characteristics of Ice–Snow Freezing and Its Impact on Subtropical Forest Fires in China

1
School of Geography and Planning, Nanning Normal University, Nanning 530001, China
2
State Key Laboratory of Resources and Environmental Information System, Institute of Geographic Sciences and Natural Resources Research, Chinese Academy of Sciences, Beijing 100101, China
3
School of Natural Resources and Surveying, Nanning Normal University, Nanning 530001, China
*
Author to whom correspondence should be addressed.
Remote Sens. 2023, 15(21), 5118; https://doi.org/10.3390/rs15215118
Submission received: 31 August 2023
/
Revised: 20 October 2023
/
Accepted: 24 October 2023
/
Published: 26 October 2023
(This article belongs to the Special Issue Deforestation Detection with Deep Learning from Multispectral and Hyperspectral Satellite Images)
Abstract
:Ice–snow freezing may disrupt the growth condition and structure of forest vegetation, increasing combustible loads and thus triggering forest fires. China’s subtropical regions are rich in forest resources, but are often disturbed by ice–snow freezing, especially due to climate change. Clarifying the responsive areas and times of forest fires to ice-snow freezing in this region is of vital importance for local forest fire management. In this study, meteorological data from 2001 to 2019 were used to extract the precipitation and its duration during the freezing period in order to analyze the freezing condition of forest vegetation in subtropical China. To improve the accuracy of identifying forest fires, we extracted forest fire information year-by-year and month-by-month based on the moderate resolution imaging spectroradiometer (MODIS) active fire data (MOD14A2) using the enhanced vegetation index (EVI), and analyzed the forest fire clustering characteristics in the region using the Moran’s Index. Then, correlation analysis between forest fires and freezing precipitation was utilized to explore the responsive areas and periods of forest fires caused by ice–snow freezing. Our analysis shows the following: (1) during the period of 2001–2019, the ice–snow freezing of forest vegetation was more serious in Hunan, Jiangxi, Hubei, and Anhui provinces; (2) forest fires in subtropical China have shown a significant downward trend since 2008 and their degree of clustering has been reduced from 0.44 to 0.29; (3) forest fires in Hunan, Jiangxi, and Fujian provinces are greatly affected by ice–snow freezing, and their correlation coefficients are as high as 0.25, 0.25, and 0.32, respectively; and (4) heavy ice–snow freezing can increase forest combustibles and affect forest fire behavior in February and March. This research is valuable for forest fire management in subtropical China and could also provide a reference for other regions.
1. Introduction
Forest fires are a kind of natural disaster that are sudden, destructive, and difficult to control, posing a serious danger to forest ecosystems and the safety of human lives [1,2]. Due to their high frequency, prolonged duration, and extensive impact, forest fires have become an international problem that cannot be ignored in recent years [3,4]. According to statistics, the number of forest fires in North America exceeds 139,000 per year, with a burned area of 4,200,000 hectares [5]. In 2019, the Amazon rainforest fires continued to burn for more than 21 days, affecting an area of more than 1 million hectares. These forest fires impacted thousands of families in Bolivia and caused severe damage to the local ecosystem, with potentially significant consequences for both local and global climates [6]. Large-scale mountain fires broke out in Australia in September 2019, affecting an area of more than 10 million hectares and resulting in the loss of at least 33 human lives and approximately 1 billion animals [7]. China is also facing more severe problems pertaining to forest fire prevention and control. Between 2002 and 2017, a total of 97,253 forest fires occurred in China, causing damage to forest-covered areas that exceeded 1.4 million hectares [8].
The occurrence of forest fires is influenced by a variety of factors, including climate change, human activities, combustible loads, and forest resource management [9]. Among these, climate change is a crucial natural factor that affects changes in forest fires. It primarily affects forest fires in two ways. On the one hand, climate change can alter the dryness of combustible materials through changes in temperature, precipitation, and evapotranspiration, which, in turn, affects forest fire behavior [10,11,12]. For example, Rocio et al. investigated the relationship between climate change and forest fires in central Chile and found a significant positive correlation between the maximum air temperature and the forest-burned area [10]. Zachary et al. examined the behavior of forest fires in summer in the Western United States and observed that a reduction in precipitation in summer led to an increase in forest-burned area [11]. On the other hand, climate change can also modify forest fire behavior by affecting vegetation growth and structure, resulting in changes in combustible loads [13,14]. For instance, Katinka et al. studied forest dieback in Southwestern Australia and discovered that experimental plots had significantly higher combustible loads than control plots [13].
As one of the climatic extremes, ice–snow freezing primarily alters forest fire behavior by increasing fuel loadings. For example, through field surveys, Sargis et al. found that fuel loadings of pine wood increased by 40 tons/ha during the 1998 ice–snow freezing in Northeastern New York, USA, which increased the probability of local forest fires [15]. Bragg et al. concluded that forest litter caused by ice–snow freezing would rapidly dry out without human intervention, thereby increasing fire risk [16]. Harrington suggests that the increase in forest fuels caused by ice–snow freezing will significantly enhance the intensity and spread of forest fires [17]. Currently, most studies have focused on changes in forest fuel loadings and fire behavior associated with a single ice–snow freezing event. However, few studies have explored changes in forest fires using the long time series of ice–snow freezing, which somewhat limits the scope of research results.
Since the 20th century, significant global warming has led to a marked increase in the intensity and frequency of extreme and unusual weather events, posing a serious challenge to forest ecosystems [18]. Abnormal climate events such as ice–snow freezing will trigger changes in forest vegetation types and combustible loads, which, in turn, will increase the probability of forest fires [19,20]. China’s subtropical regions are rich in forest resources and have experienced frequent freezing rain and snowstorms in recent years due to the impact of climate anomalies [21,22,23]. According to incomplete statistics, more than 100,000 hectares of forest land in Southern China is affected in varying degrees by ice–snow freezing disturbances every year [24]. Therefore, comprehending the responsive characteristics of forest fires following ice–snow freezing in subtropical China is of great significance for local forest resource management and protection.
In this study, we aim to explore whether ice–snow freezing affects forest fires in subtropical China. For this purpose, we first extract precipitation events and their duration during the freezing period and identify the forest-damaged areas using MODIS time series. On this basis, the spatio-temporal characteristics of both freezing changes and forest-damaged areas are analyzed using the Moran’s index, and some coincidences between them are observed. Then, the impacts of ice–snow freezing on forest fires are investigated through correlation analysis, and a weak correlation between them is found. These findings suggest that ice–snow freezing has some effect on forest fires, but the effect does not seem to be significant.
The manuscript is organized as follows. In Section 2 and Section 3, the study area, data sources and preprocessing, and study method are described separately. In Section 4, we analyze the spatio-temporal pattern of ice–snow freezing and forest fire distribution patterns during 2001–2019, respectively. In Section 5, we discuss the impact of ice–snow freezing on forest fires from a spatio-temporal perspective. The main conclusions are summarized in Section 6.
2. Study Area and Datasets
2.1. Study Area
In this paper, we have selected Hunan, Hubei, Guangdong, Guangxi, Jiangxi, Fujian, Zhejiang, Anhui, and Guizhou provinces as the study area, as shown in Figure 1. The study area covers the hilly areas in the southern part of China, accounting for about 16.65% of the national land area. This area is rich in forest resources, dominated by broad-leaved evergreen forests and evergreen coniferous forests, with extensive plantations of fir, bamboo, horsetail pine, and other plantation forests [25]. According to statistics, the forest covers an area of 84 million hectares, with a forest coverage rate exceeding 50%, making it one of the three major forested regions in China [26]. Specifically, the forest coverage rate in Zhejiang, Jiangxi, Guangdong, Guangxi, and Fujian exceeds 60%, and Fujian Province has the highest forest coverage rate in the country, reaching 65.95%.
2.2. Data Sources and Preprocessing
The data used in this paper include four types: moderate resolution imaging spectroradiometer (MODIS) data, meteorological station observation data, land cover data, and digital elevation model (DEM) data.
MODIS is capable of repeating observations for the entire Earth’s surface in 1–2 days and provides free access to 36 bands of observation data and their derived data products. In this study, we selected vegetation index products MOD13Q1 and fire mask products MOD14A2 to extract information regarding forest fires. The MOD13Q1 product provides a vegetation index (VI) value at a per pixel level, which consists of two primary vegetation layers: (1) normalized difference vegetation index (NDVI) and enhanced vegetation index (EVI). Compared to NDVI, EVI has the ability to reduce variations in canopy background and maintain sensitivity under dense vegetation conditions, making it more suitable for detecting forest vegetation [27]. Furthermore, EVI also incorporates the blue band to mitigate residual atmospheric contamination caused by smoke and sub-pixel thin clouds [28], which is especially important in regions with frequent cloud cover, such as subtropical China. Therefore, we selected EVI to identify forest-damaged areas in this paper. The MOD14A2 dataset provides 8-day fire mask composites at 1 km resolution, featuring the maximum value of the individual pixel classes over the compositing period.
According to Table 1, MODIS/EVI provides 16 days of synthetic data that is aimed at mitigating the effects of cloudiness. However, data are still missing from the MODIS/EVI dataset due to cloud interference [29]. Consequently, preprocessing of MODIS/EVI dataset is necessary before further analysis. To assess the utility of EVI data from 2001 to 2019 and distinguish between valid and invalid values, we utilize the QA data from MOD13Q1 product. This QA data is stored as a 16-bit binary file, with the “0–1” bits used to evaluate the quality of the vegetation index and the “2–5” bits used to assess the validity of the vegetation index, as shown in Table 2.
In this paper, a “0” value in the “0–1” bit, based on QA, is regarded as the valid value. If the QA data has a value of “1” in the “0–1” bit, further assessment of validity is required using the “2–5” bit. As illustrated in Figure 2, it is observed that when the usefulness value based on the “2–5” bit is less than or equal to two, the red region does not cover all valid EVI values. However, when the usefulness value based on the “2–5” bit is less than or equal to 8, the red region encompasses some of the invalid EVI values. Therefore, we consider the vegetation indexes with validity values less than or equal to four as valid, and the rest as invalid values.
The land cover data consist of 30 m annual land cover data released by Prof. Xin Huang’s team in China [30]. These data were utilized to extract the forest cover information and restore MODIS/EVI in the study area. This dataset was produced based on a large number of stable samples and 335,709 Landsat images on the google earth engine, which were derived from the China Land Use/Cover Dataset (CLUD) and visual interpretation samples were obtained from satellite time series data, Google Earth, and Google Maps. There are nine land cover types in this dataset: cropland, forest, shrub, grassland, water body, ice/snow, wasteland, constructed land, and wetland. Through the analysis of 5463 visual interpretations, an overall accuracy of 79.31% was achieved. Furthermore, the 30 m spatial resolution and its long time series spanning from 1990 to 2019 have been widely adopted in various studies [31]. Notably, in this paper, we have merged shrubs into the forest category.
The meteorological station observation data were obtained from the China Meteorological Data Service Center. These data include the daily average temperature data and daily average precipitation data for the months of December through February. They were used for calculating precipitation and duration during the freezing period in each year. The DEM (digital elevation model) data were derived from Shuttle Radar Topography Mission (SRTM), which were jointly surveyed by the National Aeronautics and Space Administration (NASA) and the National Mapping Agency (NIMA) of the Department of Defense. The acquired radar image data were processed for more than two years to create DEM data with a spatial resolution of 30 m. This dataset serves as a vital resource for analysis of terrain, watershed assessment, and feature identification, and is capable of reflecting local topographic features at a specific resolution [32]. In this paper, DEM data was utilized for the spatial discretization of the meteorological station data.
In this study, meteorological station data were employed to represent ice–snow freezing characterized by continuous low-temperature precipitation. We utilized professional meteorological interpolation software (ANUSPLIN v4.2) in conjunction with DEM data to perform spatial discretization of meteorological station data with a spatial resolution of 250 m. The land cover data used in this paper originally possessed a spatial resolution of 30 m, and it was resampled to 250 m to maintain consistency with the resolution of MODIS/EVI vegetation index and other datasets. In addition, MOD14A2, which originally had a spatial resolution of 1000 m, was also resampled to 250 m using bilinear interpolation.
3. Study Methods
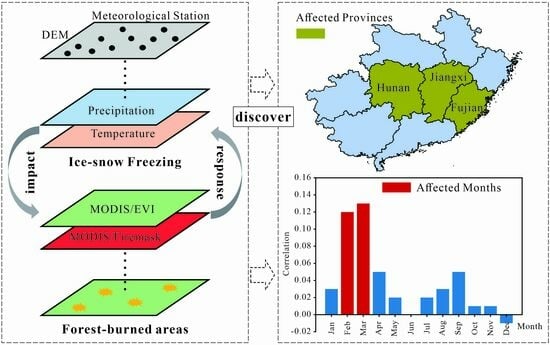
The general framework of this study can be divided into three parts (Figure 3): (1) spatio-temporal characteristics of ice–snow freezing; (2) spatio-temporal characteristics of forest fire; and (3) exploring the impact of ice–snow freezing on forest fires.
3.1. MODIS/EVI Patching Algorithm
Due to overcast weather conditions, the satellite sensors were unable to effectively capture vegetation information in areas obscured by clouds, thereby leading to anomalous values in the vegetation index within those regions [33]. Roughly, the effectiveness of the vegetation index in the study area is approximately 55%, with significant variations across different seasons. Notably, the validity of MODIS/EVI was lower during the summer period, occasionally dropping below 30% in some periods. Many studies have applied spatio-temporal filtering algorithms to fill in missing vegetation index data using the TIMESAT v3.2 software platform [34]. However, this method often introduces distortions to the vegetation index, particularly affecting the accuracy of damaged forest vegetation assessment [35].
In order to ensure the accuracy of identifying forest-burned areas, we constructed the model for patching MODIS/EVI vegetation index by combining the Gaussian function and the spectral similarity of features and adopted the sliding window mode to patch the vegetation index pixel-by-pixel. As shown in Figure 4, this process is divided into three main steps: (1) assessing the validity of the pixels in the sliding window; (2) assigning weights to the valid pixels in the sliding window; and (3) calculating the relationship between the vegetation indexes of the reference image and the image to be patched, in order to patch the vegetation indexes of the target pixels.
In this paper, we assessed the validity of each element in the sliding window, primarily considering the following points: (1) Considering that the vegetation index of the same land cover type is similar, we judged whether the land cover type of each element is the same as that of the target element within the sliding window. If their land cover types are the same, the element will be regarded as valid. (2) According to the OA file, the validity of MODIS/EVI from the reference image and unpatched image for the same element will be judged. If their MODIS/EVI for the same element are valid, the element will be regarded as valid. Subsequently, the validity window is shown as Figure 5, where “1” represents valid and “0” represents invalid.
For the weight assignment of the elements within the sliding window, we used a Gaussian function to construct a Gaussian window of the same size as the sliding window. And then, the elements from the Gaussian window and validity were dot-multiplied, thereby completing the weight assignment for the valid elements within the sliding window. Considering a window of size 3 × 3 as an example, the center element in the sliding window is the target element, and no weights need to be assigned to it. In the Gaussian window, elements near the center have higher weight values than other elements, indicating spatial similarity. Thus, different elements are assigned different weight values, as is shown in Figure 5.
After the weights of the effective elements within the sliding window are assigned, the numerical relationship between MODIS/EVI from reference image and from unpatched image is calculated pixel-by-pixel, as shown in Formula (1). Simultaneously, combining the final weights, the MODIS/EVI image is repaired through a linear-weighted sum method, as shown in Formula (2).
where indicates MODIS/EVI of the target element from the unpatched image, indicates MODIS/EVI of the other element from the unpatched image in the sliding window, indicates MODIS/EVI of the target element from the reference image, indicates MODIS/EVI of other element from the reference image in the sliding window, and indicates the weight of valid elements in the sliding window. The size of the sliding window will affect the effectiveness of patching the MODIS/EVI image [36]. If the size is too small, patching MODIS/EVI will be less effective; and if the size is too large, patching MODIS/EVI may become too time consuming. Therefore, selecting the appropriate size for the sliding window is important for patching the MODIS/EVI image. In this study, we patched the MODIS/EVI image using a sliding window of 7 × 7 based on the experimental evaluation.
3.2. Freezing Information Extraction
The duration and precipitation during ice–snow freezing are two important indicators of ice–snow disasters. And the freezing criterion is a key step for extracting the aforementioned indicators. The number of freezing days and the total precipitation during freezing period were extracted year-by-year according to the freezing criterion announced by the China National Meteorological Administration in 2008 (the average daily temperature is lower than 2 °C, and the precipitation on the same day is more than 0 mm). Since the original meteorological data are station data, they need to be spatially discretized into raster data. In this paper, daily precipitation and average daily temperature were interpolated with a spatial resolution of 250 m, using the spline function method in ANUSPLIN v4.2 software.
ANUSPLIN is a specialized software for surface fitting of climatic data, designed by the Australian scientist Hutchinson and is based on thin disk spline theory [37]. The method is capable of automatically determining model coefficients and can smoothly handle more than two-dimensional samples, introducing multiple influences as covariates [38]. The theoretical formula is as follows:
where is the value of the meteorological element to be interpolated for the space; is the independent variable, which is the value of the air factor of the known stations around the location ; is the unknown smooth factor associated with ; is the independent covariate, which is the elevation considered in this study; is the independent covariate coefficient; and is the random error. The values of and are obtained with least squares calculation.
3.3. Extraction of Forest-Burned Areas
MOD14A2 is a fire point-monitoring product derived from MODIS satellites with nine types of pixels, which is widely used in various types of forest fire studies [39]. Among them, the pixel values 7, 8, and 9 indicate low-probability fires, medium-probability fires, and high-probability fires, respectively. Although it can be used to extract forest-burned areas, the results are not reliable [40]. Therefore, MOD14A2 products cannot be directly considered as burned areas.
The method for identifying forest fire trails primarily relies on comparing the spectral characteristics or spectral indexes of vegetation before and after a fire event occurs [41]. However, other natural disasters can also lead to changes in the spectral characteristics of forest vegetation, potentially impacting forest fire extraction [42]. In this regard, there is a need for a high-temperature mask to differentiate between forest damage caused by fire and other disturbances. MOD14A2 product is employed to capture the temperature anomaly information by monitoring the satellite transit and thereby obtaining the time of occurrence and spatial location of fire points. Therefore, in this study, MOD14A2 products were utilized as high-temperature mask data, and then, the forest fire information was extracted by comparing the changes in vegetation indexes before and after the occurrence of fire points, as shown in Formula (4).
where represents the vegetation index before forest fire, and represents the vegetation index after forest fire.
Studies have been conducted to evaluate the accuracy of fire point from MOD14A2 using Landsat image data and have found that extracting forest-burned area is optimal only when high-probability fires are considered [43]. Therefore, only the high-probability fires within MOD14A2 dataset are regarded as fire mask data in this study, and the forest-burned areas were extracted using Formula (4). Referring to the forest-burned area published by the China State Forestry Administration (Table A1), we adjust the value of to extract forest-burned areas with different periods and provinces, which fluctuates from 0.6 to 0.9. In addition, the MOD14A2 data, which has an 8-day temporal resolution, was merged into a 16-day period to match the temporal resolution of MOD13Q1 data.
3.4. Spatial Autocorrelation Analysis
Spatial autocorrelation analysis can analyze the spatial geographic correlation and clustering on forest fires [44]. This model includes two types of analysis: global autocorrelation (global Moran’s I) and local autocorrelation (Anselin local Moran’s I). In this study, this model was used to analyze forest fires in subtropical China.
3.4.1. Global Autocorrelation Analysis
The global Moran’s I can reflect the clustering degree of forest fire in subtropical China, and its formula is as follows:
where is the global Moran’s I; , , and represent the number of samples, the -th sample, and the -th sample, respectively; is the spatial weight matrix (adjacent = 1, non-adjacent = 0); and , , and are forest-burned areas of the -th county, forest-burned areas of the -th county, and the average of the whole region of forest-burned areas, respectively.
3.4.2. Local Autocorrelation Analysis
The Anselin local Moran’s I can distinguish the types of forest fire clusters in each county, and its formula is as follows:
where is the Anselin local Moran’s I; , , , and represent the number of sample counties, the forest-burned areas of the -th county, the forest-burned areas of the -th county, and the average of the whole region of forest-burned areas, respectively; is the spatial weighting matrix, and is the sample variance.
3.5. Forest Fire Response to Ice–Snow Freezing
The correlation coefficient can reflect the correlated degree between two variables and can be used to measure the closeness of the correlation between variables [45]. In this study, the correlation coefficient method was utilized to investigate the effect of ice–snow freezing on forest fires, and its formula is as follows:
In the Formula (7), is the correlation coefficient, is the covariance of variables and , is the variance of variable , and is the variance of variable Y. In this study, precipitation during freezing period and damaged area caused by forest fire were set as variables and , respectively.
4. Results
4.1. Spatial and Temporal Pattern of Ice–Snow Freezing
The precipitation during and duration of ice–snow freezing are two important reference indicators [46,47]. To objectively reflect the extent of forest vegetation freezing in the study area, we counted the number of ice–snow freezing days and the precipitation for forest-covered areas in each province year-by-year. According to Figure 6, forest vegetation in the study area was most severely impacted by ice–snow freezing in 2008, with the longest duration of freezing and the highest recorded precipitation. Comparing the freezing duration in each province, it was found that the forest vegetation in Hubei, Hunan, Jiangxi, and Guizhou provinces in the center of the study area suffered from freezing for a longer time. Forest vegetation in Guangxi and Guangdong provinces, which are located close to the coast, experienced shorter periods of ice–snow freezing. The entire study area shows a spatial distribution pattern of cold weather in the north and milder weather in the south. According to statistics, the freezing duration in all provinces reached its maximum in 2008. In particular, the average freezing duration for forest vegetation in Hunan, Hubei, and Jiangxi exceeded 4 days.
Similar to the spatial and temporal distributions of freezing duration, the precipitation during the ice–snow freezing period for forest vegetation in the study area from 2001 to 2019 peaked in 2008. In addition, the freezing precipitation in 2005 and 2011 were also at a higher level. Comparing the freezing precipitation for forest-covered areas in each province, Anhui, Hunan, and Jiangxi provinces had significantly more freezing precipitation than the other provinces. Specifically, Anhui province, located in the northernmost part of the study area, consistently maintained a higher level of freezing precipitation for many consecutive years. However, in the southern part of the study area, Fujian, Guangdong, and Guangxi provinces had less precipitation during the ice–snow freezing period, especially in Guangdong province, where it was less than 1/40 of that of Anhui province. The overall spatial distribution of freezing precipitation in the study area was greater in the north than in the south and more in the west than in the east.
Furthermore, we have compiled freezing indicators for forested areas in each county from 2001 to 2019. As depicted in Figure 7, Guizhou Province exhibits an extended freezing period, with more than one-third of its counties experiencing freezing durations surpassing 200 days. The freezing duration in forest-covered areas in Hunan, Hubei, and Anhui provinces is mainly in the range of 100–200 days at the county level. In contrast, counties in Guangdong, Guangxi, and Fujian provinces maintained consistently low levels in terms of both freezing duration and precipitation. Especially in the Guangdong Province, nearly all counties have a freezing duration of less than 25 days and a freezing precipitation of less than 50 mm.
4.2. Forest Fire Distribution Patterns during 2001–2019
Based on the MOD14A2 fire mask product, we conducted a comparative analysis of EVI before and after fire damage during the period from 2001 to 2019 to extract the forest fire information in the study area. As illustrated in Figure 8, it could be seen that Hunan province had the highest incidence of forest fires in subtropical China from 2001 to 2019, resulting in forest-damaged areas caused by fires as high as 106,087 ha. Forest fires in Fujian, Jiangxi, and Zhejiang provinces also exceeded 40,000 hectares, with 66,600 ha, 49,556.2 ha, and 43,631.2 ha, respectively. Anhui province, located in the northern part of the study area, has the smallest forest-damaged areas caused by fires, totaling less than 5800 ha over the past two decades. Hubei province, also located in the northern part of the study area, has less than 13,000 hectares of forest fires, which is low in terms of area damaged by fire. In addition, Guangdong and Guangxi provinces, located in the southern part of the study area, have less than 34,000 hectares of area damaged by forest fires, which is also low in terms of area damaged by fire. Analyzed from the perspective of spatial distribution, forest-damaged areas caused by fire in the subtropical region of China show a spatial pattern of higher incidence in the central areas and lower incidence on both sides.
To explore the clustering pattern of forest fires in the study area at the county level, the global Moran’s I for forest fires was calculated in four time periods, 2001–2005, 2006–2010, 2011–2015, and 2016–2019. The results were 0.44, 0.50, 0.33, and 0.29, respectively, and all of them passed the p value significance test. In terms of temporal variation, the global Moran’s I showed an increasing trend from 2001 to 2010, indicating a rise in the spatial clustering of forest fires during this time period. However, during the period 2011–2019, the Moran’s I showed a decreasing trend, indicating a decrease in the spatial clustering of forest fires in the study area. This trend may be directly related to the significant reduction in the forest-damaged areas by fires after 2009.
By analyzing the forest fire hotspots during the time period depicted in Figure 9, where the red color indicates the locations with the highest incidence of forest fires, it was found that the hotspots of forest fires in the period of 2001–2005 were mainly located in the Luoxiao Mountains on the border between Hunan Province and Jiangxi Province. Additionally, Fujian Province also had more forest fire hotspots. This can be attributed to the fact that Hunan, Jiangxi, and Fujian provinces had the most forest fires during this period. From 2006 to 2010, Hunan, Jiangxi, and Fujian provinces remained the hotspots for forest fires. Simultaneously, a significant increase in the number of forest fire hotspots in Guizhou Province led to an expansion of forest-damaged areas. During the years 2011–2015, Hunan and Fujian provinces still remained prominent forest fire hotspots. However, the number of forest fire hotspots in Guizhou and Jiangxi provinces began to decline around the same time. In the period from 2016 to 2019, the forest fire hotspots in Hunan and Fujian provinces began to decline. Conversely, there was an increase in forest fire hotspots in Guangxi Province.
In this study, the forest-damaged areas for each province were examined year-by-year and month-by-month, as shown in Figure 10 and Figure A1. Forest-damaged areas caused by fires in various provinces mainly occurred in winter. The period from October to March represents one with high incidence of forest fires in subtropical China, especially in February. Conversely, the probability of forest fires occurring in the summer is significantly lower than in the winter. It is obvious that forest fires show seasonal and climatic characteristics in subtropical China. To further investigate how weather conditions in different months impact the inter-annual pattern of forest fire occurrence, we analyzed precipitation, temperature, relative humidity, and the number of forest fires in different months, as shown in Figure 11. Despite the high summer temperatures in the study area, there is more precipitation during summer, making the number of forest fires in summer much lower than that in winter. Moist air conditions will reduce or mitigate the potential for forest fires to some extent [48]. These observations suggest that summer temperature affects forest fires to a much lesser extent than precipitation in subtropical China. In contrast, cold winters with low precipitation and relatively dry air conditions create favorable conditions for forest fires [49]. As indicated in Figure 11A, winter precipitation is less than one-third of that in summer, further suggesting that precipitation has a greater effect on forest fires compared to temperature.
The forest-damaged area caused by fire in February was as high as 120,558 hectares during the years 2001–2019, which is much higher than that in other months, as shown in Figure 10A. However, February does not exhibit the driest atmospheric conditions according to Figure 11. Compared to January and December, the precipitation in February is slightly higher. This phenomenon can be attributed to the dry winter climate and human activities. Forest fires in this region can be triggered by either human slash-and-burn agriculture or firecrackers [50,51]. In subtropical China, human activities in forest-covered areas will increase every February when people prepare for the upcoming agricultural season. At the same time, the likelihood of forest fires will also escalate. In addition, the precipitation in the study area remains at a lower level from October to February, as shown in Figure 11A. During this period, forest combustibles will slowly accumulate, further increasing the likelihood of forest fires. The combination of these factors makes the number of damaged areas due to forest fires in February much higher than that in other months.
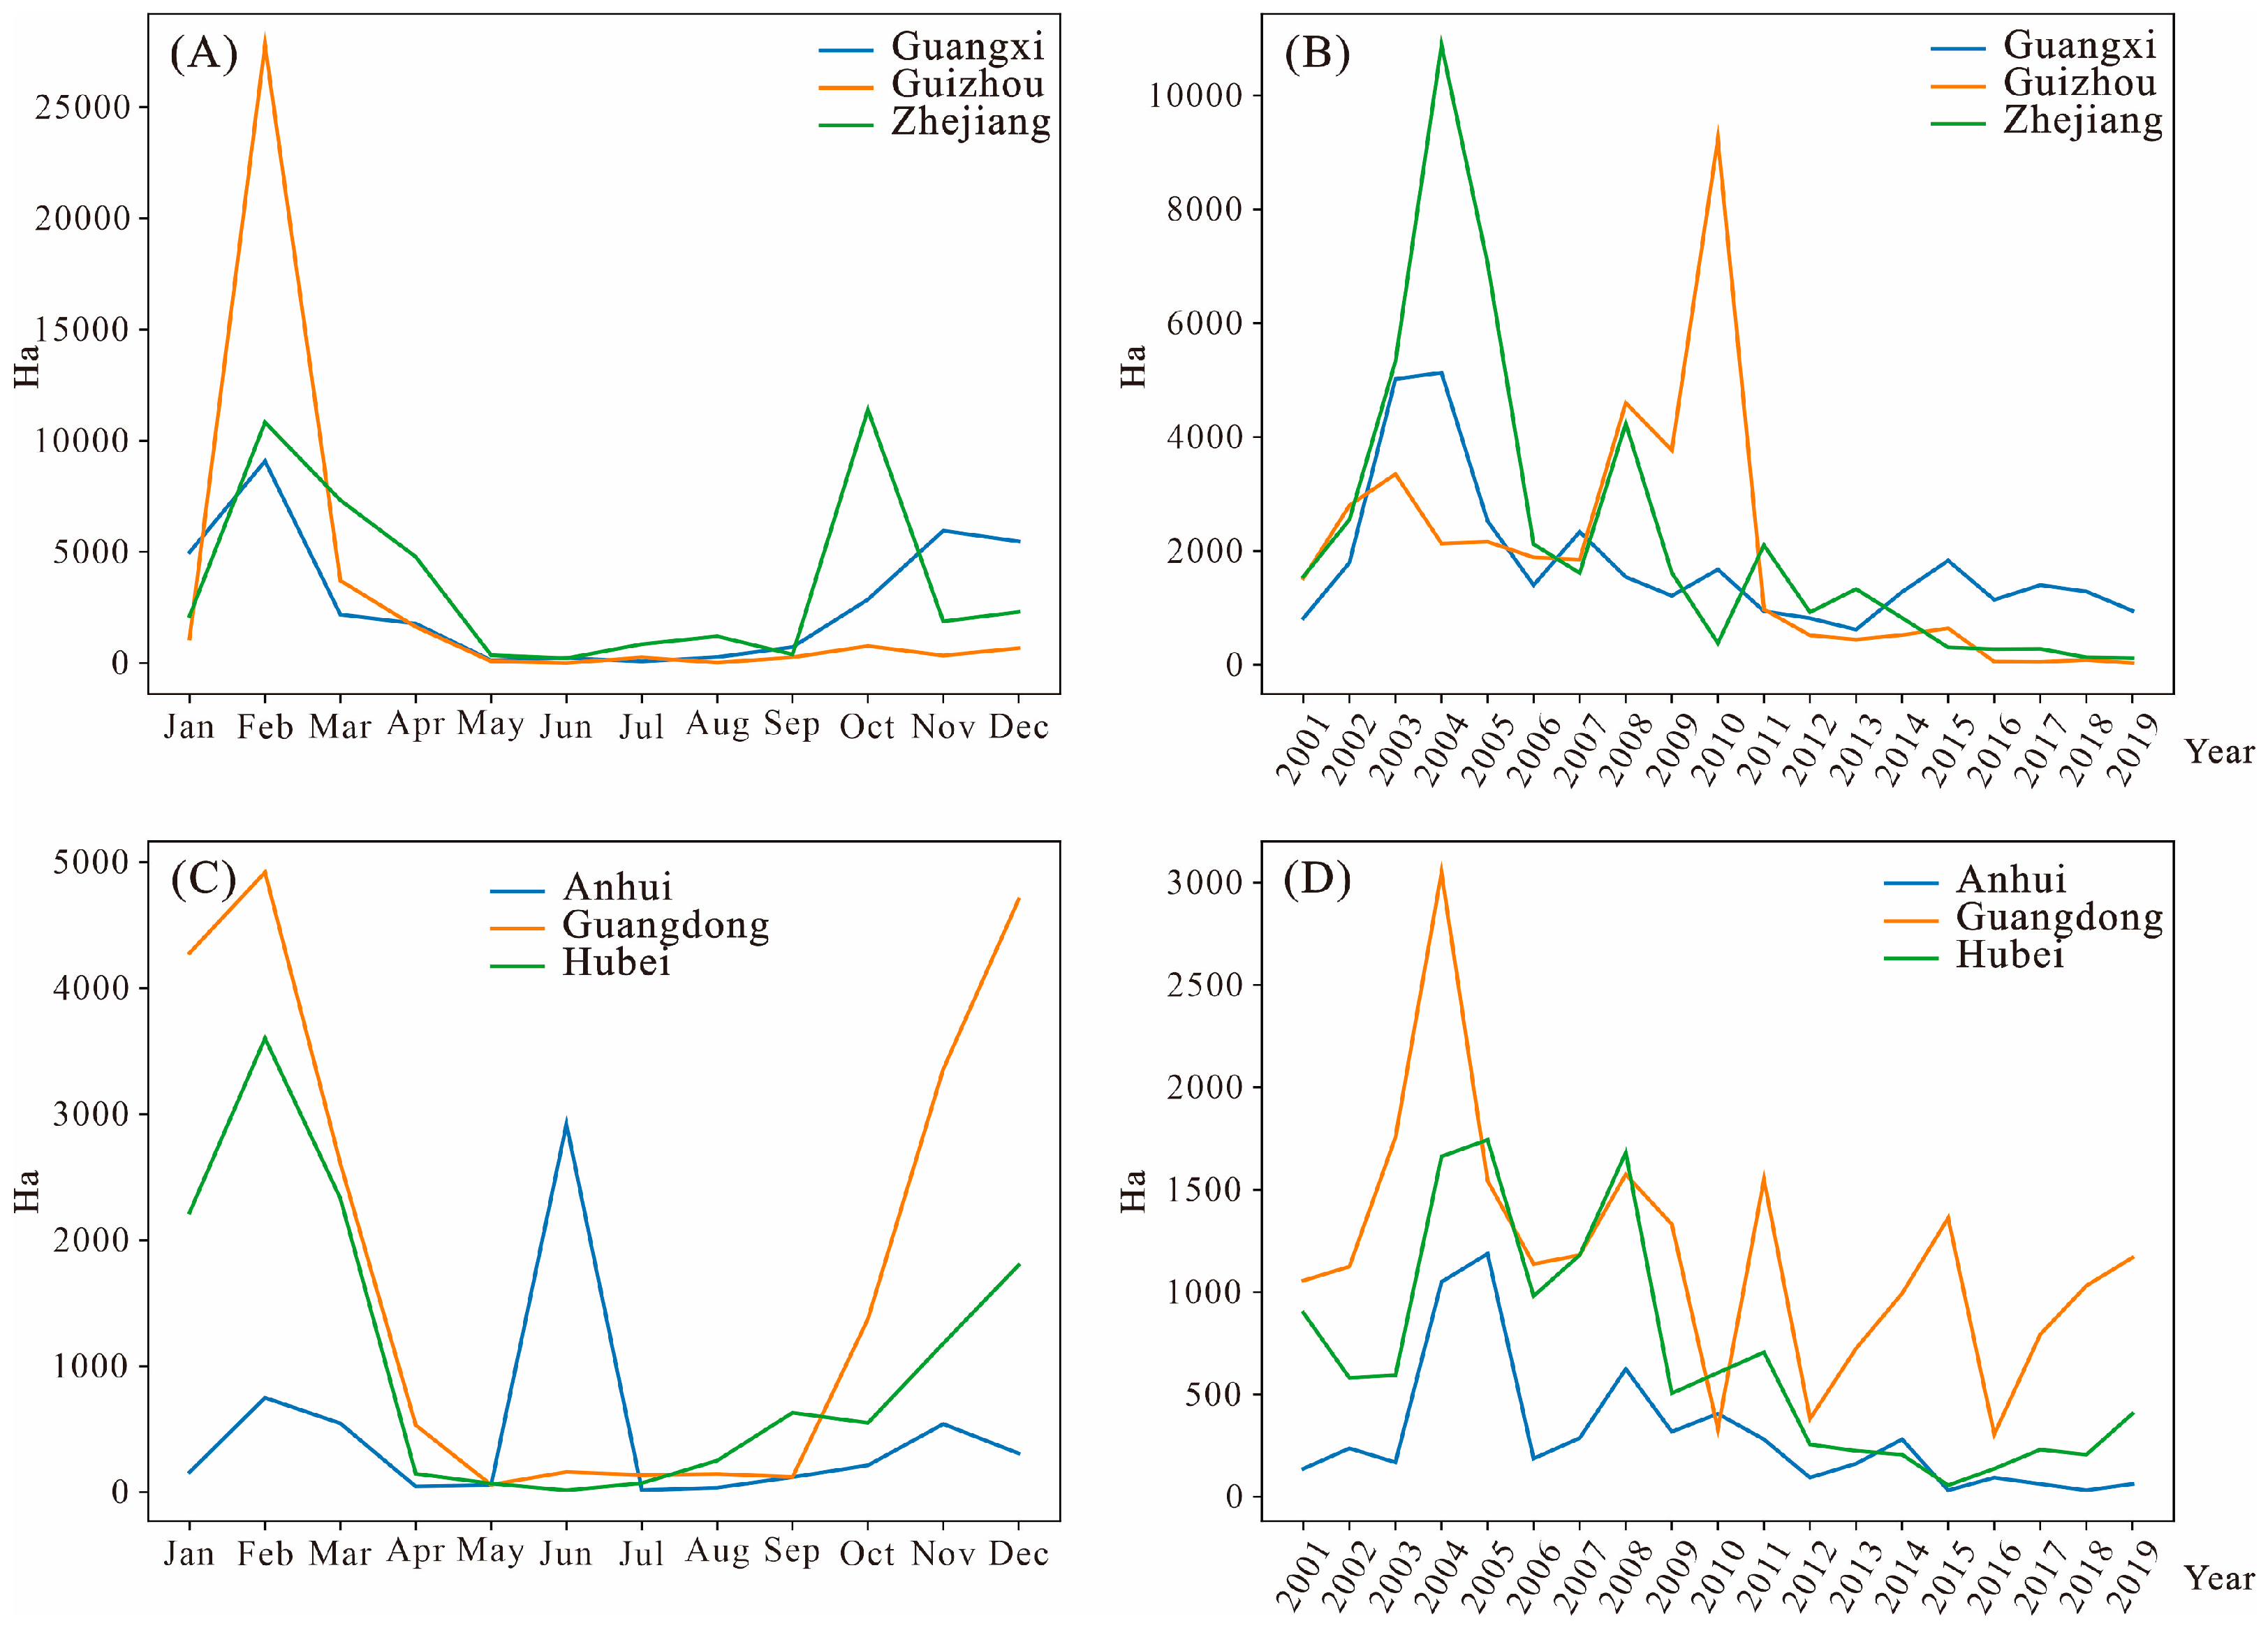
After analyzing the inter-annual changes in forest-damaged areas caused by fires in each province, an obvious trend for forest fires in subtropical China until 2008 was not observed. There were substantial fluctuations in forest fires between neighboring years. According to Figure 10C, it is noted that forest-damaged area caused by fire in the study area was the highest in 2004 during the 2001–2019 period, up to 250 ha. In addition, the second-highest incidence of forest fires was in 2008. Since then, forest fires have shown a clear downward trend and have remained low since 2011. This phenomenon may stem from the fact that local governments have increased their efforts to manage forest fires in recent years [52]. Comparing the inter-annual changes of forest fires in each province, it is found that the forest-damaged areas caused by fires in Fujian, Guangdong, Guangxi, Jiangxi, and Zhejiang provinces reached their peak in 2004; the forest-damaged areas caused by fires in Anhui and Hubei provinces reached their peak in 2005; the forest-damaged areas caused by fires in Guizhou province reached their peak in 2010; and the forest-damaged areas caused by fires in Hunan province reached their peak in 2008.
5. Discussion
5.1. Spatial Impact of Ice–Snow Freezing on Forest Fires in Subtropical China
Taking the forest-covered area of counties as the basic unit, the forest-damaged areas caused by fires and the freezing precipitation in each county during 2001–2019 were assessed, and the correlation coefficients of the two were calculated. As depicted in Figure 12, there is a positive correlation between the forest-damaged area caused by fire and its precipitation during the ice–snow freezing period in most provinces. When analyzed along with Figure 8, it is found that the correlation coefficients for forest-damaged areas and freezing precipitation in Hunan, Jiangxi, and Fujian, where forest fires are most serious, are higher than those in other provinces. The correlation coefficient for Fujian Province is as high as 0.32, while those for Hunan and Jiangxi provinces also reach 0.25. This phenomenon initially indicated that ice–snow freezing can have a certain impact on forest fires in the aforementioned regions. Xu et al. and Wang et al. conducted a survey on and studied forest fires in the Hunan Province in 2008 and found that heavy freezing rain and snow can increase the susceptibility to fire of flammable materials such as dead wood of forest vegetation, and this can easily ignite forest fires if these materials not cleared on time [53,54]. Jiangxi and Hunan provinces were the most severely affected by forest ice–snow freezing in 2008 [22]. This analysis suggests that ice–snow freezing affects forest fire behavior by increasing forest fuel loadings. In 2008, the forest-damaged area caused by fire in the Hunan province reached 18,150 hectares, significantly higher than in other years, as shown in Table 3. Although the forest-damaged area caused by fire in the Jiangxi province was not the highest in 2008, it was still much higher than that in other years. These data show that heavy ice–snow freezing can increase the likelihood of starting forest fires, while minor ice–snow freezing has little impact.
In this paper, the study area encompasses a total of nine provinces, and not all of them are affected by ice–snow freezing in terms of forest fires. Anhui, Hubei, and Guizhou provinces also experienced severe ice–snow freezing, but the correlation between their forest fires and ice–snow freezing was weak. Especially in the Guizhou province, the correlation coefficient between forest fires and ice–snow freezing was negative, contrasting the observations made for Hunan and Fujian provinces. This is mainly due to the fact that Anhui and Hubei are geographically closer to Northern China and exhibit both temperate and subtropical monsoon climates [55]. Their unique climate makes their forest vegetation more cold resistant [56]. In contrast, Jiangxi, Hunan, and Fujian have large plantations of artificial forests (e.g., bamboo, eucalyptus, etc.), which are less cold resistant. Therefore, although Anhui experienced a slightly higher freezing precipitation than Hunan in 2008, its forest-damaged area caused by ice–snow freezing was lower than that of Hunan province [21]. This observation also underscores the difference in cold resistance of forest vegetation present in different geographic environments. Similarly, Guizhou province, located on the Yunnan–Guizhou Plateau, has a cold climate and also boasts highly cold-resistant forest vegetation. When forest vegetation is more cold-resistant, ice–snow damage to forest vegetation will be reduced, resulting in fewer fuel loadings. Moreover, Guangdong and Guangxi are located in the southernmost part of subtropical China, where the climate is warmer and more humid, making forest vegetation less affected by ice–snow freezing. This also accounts for the low correlation between forest fires and ice–snow freezing in Guangxi and Guangdong provinces. Although the correlation between forest fires and ice–snow freezing varies significantly by province, an interesting phenomenon can be found by comparing forest fires in 2008 with the adjoining years in each province. The forest-damaged area caused by fire in all provinces except the Guangxi province peaked in 2008, according to the statistics in Table 4. These data once again indicate that severe ice–snow freezing for forest vegetation can increase the likelihood of forest fires.
In conclusion, heavy ice–snow freezing can increase the probability of forest fires to a certain extent in Hunan, Jiangxi, and Fujian provinces. Due to differences in geography and forest vegetation’s resistance to cold, ice–snow freezing has a weak effect on forest fires in Guizhou, Hubei, Zhejiang, and Anhui provinces. Few severe ice–snow freezing episodes have been observed in Guangxi and Guangdong province, resulting in a weak correlation with forest fires.
5.2. Temporal Impact of Ice–Snow Freezing on Forest Fires in Subtropical China
In order to explore the temporal impact of ice–snow freezing on forest fires, we regarded county as the basic unit, we assessed the freezing precipitation in Jiangxi and Hunan provinces year-by-year and the forest-damaged area caused by fire month-by-month and then calculated the correlation coefficients between the two. As shown in Figure 13, the correlation between freezing precipitation and forest fires in every month is low. Among them, correlation coefficient passes the significance test only in January, February, March, and April. Moreover, the correlation coefficients of 0.12 and 0.13 are observed for February and March, respectively, and are significantly higher than those in other months. This evidence implies that while ice–snow freezing can affect forest fires, their role is not significant. This is mainly related to the fact that forest fire is a natural disaster affected by both natural and anthropogenic factors, which are characterized by quick emergence and are influenced by many factors [57,58]. In addition to ice–snow freezing, high temperatures and drought in summer and storms in winter increase the possibility of forest fire occurrence by increasing the combustible load of a forest [9,59,60]. In addition, forest fire behavior is closely related to human activities [58], and cold winds in winter can increase forest-damaged areas by accelerating fire spread and increasing combustible loads [61]. The compounding effect of these factors may diminish the significance of the impact of ice–snow freezing on forest fires.
According to Figure 13, we observed that some counties experienced low precipitation and high forest fires during the freezing period in February and March. This was primarily attributed to the dry winter climate and human activities in the region. In order to more effectively demonstrate that ice–snow freezing can affect forest fires in February and March, this study assessed freezing precipitation and forest-damaged areas caused by fire during the same time period in 2007 and 2008. Compared to February 2007, Jiangxi and Hunan exhibited an increase in forest fires in 60 counties, a decrease in forest fires in 12 counties, and no significant change in forest fires in 146 counties in February 2008. Similarly, when compared to March 2007, Jiangxi and Hunan exhibited an increase in forest fires in 52 counties, a decrease in forest fires in 1 county, and no significant change in forest fires in 146 counties in March 2008. This indicates that forest fires increased significantly in approximately one-quarter of the counties in Hunan and Jiangxi provinces in February-March 2008. Furthermore, since the freezing precipitation considered in this study occurred from December to February each year, with its effects primarily concentrated in February and March of the following year, the other periods were almost unaffected. These data demonstrate that heavy ice–snow freezing can increase the likelihood of forest fires in the short term, which aligns with the findings of Wang et al. [62].
Generally, the freezing period begins in late December and ends in mid- to late January of the following year in subtropical China [63]. During this period, forest vegetation is vulnerable to damage from heavy ice–snow freezing. When ice–snow melts, fallen trees and broken branches gradually turn into forest combustibles, thereby increasing the likelihood of forest fires. According to the experimental results of this study, freezing precipitation has a relatively higher impact on forest fires in February and March. Based on these findings, we can infer that forest fires will be exacerbated within 1–2 months after the outbreak of heavy ice-snow freezing.
It is evident that the ice–snow freezing conditions in the study area were also more severe in 2011, but the forest fires were not as serious, as shown in Figure 6 and Figure 10. This is mainly due to the fact that subtropical China experienced a 50-year mega ice storm in 2008, which caused great damage to the local forest vegetation [64]. In contrast, the ice–snow freezing in 2011, which had a reduced freezing duration and precipitation, likely caused less damage to the local forest vegetation and did not result in a significant increase in forest fuel loadings. A comparison of forest fires in 2008 and 2011 reveals that the likelihood of forest fires increases only when freezing precipitation is higher and causes obvious damage to forest vegetation. In contrast, forest fires are not affected by low levels of ice–snow freezing that does not cause physiological and mechanical damages (e.g., fallen trees and broken tops) to a forest.
Based on the above analysis, we can observe that heavy ice–snow freezing can increase the risk of forest fires, especially in February and March. Hunan, Jiangxi, and Fujian provinces are the most serious areas for forest fires in subtropical China. These areas also exhibit a higher potential for forest fires indirectly caused by ice–snow freezing. Therefore, the Forestry Department should monitor forest fires in Hunan, Jiangxi, and Fujian provinces during critical time periods, especially in February and March.
6. Conclusions
In this study, we delved into the impact of ice–snow freezing on forest fires in subtropical China. Based on the analysis of MODIS time series from 2001 to 2019, we found that forest vegetation in Hunan, Jiangxi, Hubei, and Anhui provinces experienced significant damages from ice–snow freezing. Intense ice–snow freezing, to some extent, influenced the characteristics of forest fires in Fujian, Jiangxi, and Hunan provinces. In February and March, the accumulation of ice–snow freezing exerted relatively notable impacts on forest fires due to the increase in the forest combustibles. However, such impact may not be definitive given the weak correlation between ice–snow freezing and forest fires. However, the above findings provide evidence that ice–snow freezing affects forest fires, holding a significant value in forest fire management and control in subtropical areas. This study may serve as a reference for discussions on the causes of forest fires and related studies. Moreover, the methodology for forest fire extraction can provide a technical benchmark for studies on the spatio-temporal distribution of forest fires.
Author Contributions
X.W. drafted the manuscript and was responsible for data preparation, experiment, and analysis. X.G. participated in data collection. Y.W. was responsible for research design and analysis and designed and reviewed the manuscript. H.J. and P.W. validated the experimental results. All authors contributed to the editing and reviewing of the manuscript. All authors have read and agreed to the published version of the manuscript.
Funding
This research was funded by the Guangxi Science and Technology Base and Talent Specialization (grant number: 2022AC21098), a grant from State Key Laboratory of Resources and Environmental Information System (grant number: OFLREIS202207), Strategic Priority Research Program (Class A) of the Chinese Academy of Sciences (grant number: XDA23090503), and Middle-aged and Young Teachers’ Basic Ability Promotion Project of Guangxi (grant number: 2022KY0382).
Data Availability Statement
MODIS/EVI, MOD14A2, and DEM data were obtained from Google Earth Engine (GEE) platform; meteorological station data: http://www.nmic.cn/dataService/cdcindex/datacode/A.0012.0001.S011/show_value/normal.html; land cover data was obtained from Pixel Information Expert Engine (PIE-Engine) platform.
Acknowledgments
The authors wish to appreciate all researchers, assistants, and participants for their effort in the study.
Conflicts of Interest
The authors declare no conflict of interest.
Appendix A

Table A1.
Official published data on forest fires in subtropical China, 2001–2019.
| Year | Zhejiang | Anhui | Fujian | Jiangxi | Hubei | Hunan | Guangdong | Gaungxi | Guizhou |
|---|---|---|---|---|---|---|---|---|---|
| 2001 | 1498.40 | 133.70 | 2413.10 | 2161.70 | 845.60 | 1628.70 | 964.90 | 756.80 | 1452.00 |
| 2002 | 2479.80 | 229.40 | 4938.90 | 2034.40 | 538.40 | 3423.00 | 1023.00 | 1713.10 | 2727.70 |
| 2003 | 5257.90 | 150.50 | 4634.40 | 6408.20 | 570.60 | 9088.80 | 1633.10 | 4807.30 | 3250.70 |
| 2004 | 10,838.90 | 1047.90 | 13,589.80 | 12,711.20 | 1618.30 | 15,852.80 | 2886.20 | 4997.60 | 2040.60 |
| 2005 | 6945.00 | 1169.00 | 3429.00 | 4627.00 | 1709.00 | 12,931.00 | 1419.00 | 2467.00 | 2045.00 |
| 2006 | 2066.80 | 173.00 | 1316.40 | 1073.00 | 943.40 | 4988.70 | 1038.90 | 1344.70 | 1848.90 |
| 2007 | 1567.00 | 277.00 | 2119.00 | 2054.00 | 1117.00 | 8004.00 | 1125.00 | 2274.00 | 1779.00 |
| 2008 | 4040.00 | 579.00 | 7967.00 | 6934.00 | 1605.00 | 17,781.00 | 1452.00 | 1420.00 | 4440.00 |
| 2009 | 1580.00 | 311.00 | 11,011.00 | 3300.00 | 473.00 | 10,110.00 | 1269.00 | 1190.00 | 3702.00 |
| 2010 | 361.00 | 393.00 | 1449.00 | 729.00 | 589.00 | 4893.00 | 304.00 | 1600.00 | 9102.00 |
| 2011 | 2090.00 | 255.00 | 6503.00 | 1435.00 | 677.00 | 3605.00 | 1476.00 | 883.00 | 910.00 |
| 2012 | 906.00 | 86.00 | 700.00 | 412.00 | 236.00 | 4653.00 | 361.00 | 780.00 | 502.00 |
| 2013 | 1271.00 | 158.00 | 1373.00 | 751.00 | 215.00 | 2824.00 | 679.00 | 594.00 | 411.00 |
| 2014 | 786.00 | 265.00 | 1145.00 | 1579.00 | 185.00 | 1935.00 | 930.00 | 1241.00 | 488.00 |
| 2015 | 301.00 | 5.00 | 1416.00 | 335.00 | 29.00 | 285.00 | 1300.00 | 1769.00 | 607.00 |
| 2016 | 261.00 | 76.00 | 221.00 | 190.00 | 117.00 | 316.00 | 287.00 | 1090.00 | 37.00 |
| 2017 | 251.00 | 47.00 | 319.00 | 707.00 | 217.00 | 961.00 | 733.00 | 1351.00 | 42.00 |
| 2018 | 117.18 | 17.20 | 577.53 | 478.67 | 194.16 | 649.06 | 969.45 | 1232.52 | 74.84 |
| 2019 | 115.54 | 42.35 | 478.67 | 489.14 | 385.86 | 864.90 | 1118.58 | 918.03 | 18.79 |
Figure A1.
The distribution of forest fires in different provinces. (A) shows forest-damaged areas caused by fires for Guangxi, Guizhou, and Zhejiang Provinces, categorized by month; (B) shows forest-damaged areas caused by fires for Guangxi, Guizhou, and Zhejiang Provinces, categorized by year; (C) shows forest-damaged areas caused by fires for Anhui, Guangdong, and Hubei Provinces, categorized by month; (D) shows forest-damaged areas caused by fires for Anhui, Guangdong, and Hubei Provinces, categorized by year.
References
- Seidl, R.; Thom, D.; Kautz, M.; Dario, M.B.; Peltoniemi, M.; Vacchiano, G.; Wild, J.; Ascoli, D.; Per, M.; Honkaniemi, J.; et al. Forest disturbances under climate change. Nat. Clim. Change 2017, 7, 395–402. [Google Scholar] [CrossRef]
- Anderegg, W.R.L.; Trugman, A.T.; Badgley, G.; Anderson, C.M.; Bartuska, A.; Ciais, P.; Cullenward, D.; Field, C.; Freeman, J.; Geotz, S.J.; et al. Climate-driven risks to the climate mitigation potential of forests. Science 2020, 368, eaaz7005. [Google Scholar] [CrossRef]
- Abatzoglou, J.T.; Williams, A.P. Impact of anthropogenic climate change on wildfire across western US forests. Proc. Natl. Acad. Sci. USA 2016, 113, 11770–11775. [Google Scholar] [CrossRef] [PubMed]
- Williams, A.P.; Abatzoglou, J.T.; Gershunov, A.; Janin, G.M.; Bishp, D.A.; Balch, J.K.; Lettenmaier, D.P. Observed impacts of anthropogenic climate change on wildfire in California. Earth’s Future 2019, 7, 892–910. [Google Scholar] [CrossRef]
- Halofsky, J.E.; Peterson, D.L.; Harvey, B.J. Changing wildfire, changing forests: The effects of climate change on fire regimes and vegetation in the Pacific Northwest, USA. Fire Ecol. 2020, 16, 4. [Google Scholar] [CrossRef]
- Heinrich, V.H.A.; Dalagnol, R.; Cassol, H.L.G.; Rosan, T.M.; Almeida, C.T.; Junior, C.H.L.; Campanharo, W.A.; House, J.I.; Sitch, S.; Hales, T.C.; et al. Large carbon sink potential of secondary forests in the Brazilian Amazon to mitigate climate change. Nat. Commun. 2021, 12, 1785. [Google Scholar] [CrossRef]
- Canadell, J.G.; Meyer, C.P.; Cook, G.D.; Dowdy, A.; Briggs, P.R.; Knauer, J.; Pepler, A.; Haverd, V. Multi-decadal increase of forest burned area in Australia is linked to climate change. Nat. Commun. 2021, 12, 6921. [Google Scholar] [CrossRef]
- Shao, Y.; Wang, Z.; Feng, Z.; Yang, X.; Zheng, J.; Ma, T. Assessment of China’s forest fire occurrence with deep learning, geographic information and multisource data. J. For. Res. 2023, 34, 963–976. [Google Scholar] [CrossRef]
- Boer, M.M.; Resco’de, D.V.; Bradstock, R.A. Unprecedented burn area of Australian mega forest fires. Nat. Clim. Change 2020, 10, 171–172. [Google Scholar] [CrossRef]
- Urrutia-Jalabert, R.; González, M.E.; González-Reyes, Á.; Antonio, L.; Rene, G. Climate variability and forest fires in central and south-central Chile. Ecosphere 2018, 9, e02171. [Google Scholar] [CrossRef]
- Holden, Z.A.; Swanson, A.; Luce, C.H.; Jolly, W.M.; Maneta, M.; Oyler, J.W.; Warren, D.A.; Parsons, R.; Affleck, D. Decreasing fire season precipitation increased recent western US forest wildfire activity. Proc. Natl. Acad. Sci. USA 2018, 115, E8349–E8357. [Google Scholar] [CrossRef]
- Xu, R.; Lin, H.; Lu, K.; Cao, L.; Liu, Y. A forest fire detection system based on ensemble learning. Forests 2021, 12, 217. [Google Scholar] [CrossRef]
- Ruthrof, K.X.; Fontaine, J.B.; Matusick, G.; Breshears, D.D.; Law, D.J.; Powell, S.; Hardy, G. How drought-induced forest die-off alters microclimate and increases fuel loadings and fire potentials. Int. J. Wildland Fire 2016, 25, 819–830. [Google Scholar] [CrossRef]
- Page, Y.L.; Morton, D.; Hartin, C.; Bond-Lamberty, B.; Pereira, J.M.C.; Hurtt, G.; Asrar, G. Synergy between land use and climate change increases future fire risk in Amazon forests. Earth Syst. Dynam. 2017, 8, 1237–1246. [Google Scholar] [CrossRef]
- Sargis, G.; Adams, K. Effects of an ice storm on fuel loadings and potential fire behavior in a pine barren of northeastern New York. Sci. Discipulorum 2004, 1, 17–25. [Google Scholar]
- Bragg, D.C.; Shelton, M.G.; Zeide, B. Impacts and management implications of ice storms on forests in the southern United States. For. Ecol. Manag. 2003, 186, 99–123. [Google Scholar] [CrossRef]
- Harrington, T.B. Long-term effects of thinning and woody control on longleaf pine plantation development, understory abundance, and tree damage from an ice storm. For. Ecol. Manag. 2020, 459, 117846. [Google Scholar] [CrossRef]
- Trotsiuk, V.; Hartig, F.; Cailleret, M.; Babst, F.; Forrester, D.; Baltensweiler, A.; Buchmann, N.; Bugmann, H.; Gessler, A.; Gharun, M.; et al. Assessing the response of forest productivity to climate extremes in Switzerland using model–data fusion. Glob. Change Biol. 2020, 26, 2463–2476. [Google Scholar] [CrossRef]
- Contosta, A.R.; Casson, N.J.; Garlick, S.; Nelson, S.J.; Ayres, M.P. Northern forest winters have lost cold, snowy conditions that are important for ecosystems and human communities. Ecol. Appl. 2019, 29, e01974. [Google Scholar] [CrossRef]
- Chen, F.; Feng, H.; Xue, L.; Pan, L.; Xu, P.; Liu, B. Impact of ice-snow damage on nutrient distribution of a Cunninghamia lanceolata woodland. J. For. Res. 2010, 21, 207–212. [Google Scholar] [CrossRef]
- Wang, X.; Yang, F.; Gao, X.; Wang, W.; Zha, X. Evaluation of forest damaged area and severity caused by ice-snow frozen disasters over southern China with remote sensing. Chin. Geogr. Sci. 2019, 29, 405–416. [Google Scholar] [CrossRef]
- Shao, Q.; Huang, L.; Liu, J.; Li, J. Analysis of forest damage caused by the snow and ice chaos along a transect across southern China in spring 2008. J. Geogr. Sci. 2011, 21, 219–234. [Google Scholar] [CrossRef]
- Liu, F.; Yang, Z.; Zhang, G. Canopy gap characteristics and spatial patterns in a subtropical forest of South China after ice storm damage. J. Mt. Sci.-Engl. 2020, 17, 1942–1958. [Google Scholar] [CrossRef]
- Guo, J.; Cui, J.; Wu, N.; Zhang, Y.; Wang, J.; Xiang, H.; Hu, B.; Zhou, Y. Ice storm damage to oak forests in subtropical China. For. Ecosyst. 2023, 13, 100119. [Google Scholar] [CrossRef]
- Tang, X.; Xia, M.; Pérez-Cruzado, C.; Guan, F.; Fan, S. Spatial distribution of soil organic carbon stock in Moso bamboo forests in subtropical China. Sci. Rep. 2017, 7, 42640. [Google Scholar] [CrossRef]
- Yao, X.; Yu, K.; Deng, Y.; Zeng, Q.; Lai, Z.; Liu, J. Spatial distribution of soil organic carbon stocks in Masson pine (Pinus massoniana) forests in subtropical China. Catena 2019, 178, 189–198. [Google Scholar] [CrossRef]
- Sarmah, S.; Jia, G.; Zhang, A.; Singha, M. Assessing seasonal trends and variability of vegetation growth from NDVI3g, MODIS NDVI and EVI over South Asia. Remote Sens. Lett. 2018, 9, 1195–1204. [Google Scholar] [CrossRef]
- Zhang, J.; Xiao, J.; Tong, X.; Zhang, J.; Meng, P.; Li, J.; Liu, P.; Yu, P. NIRv and SIF better estimate phenology than NDVI and EVI: Effects of spring and autumn phenology on ecosystem production of planted forests. Agric. For. Meteorol. 2022, 315, 819–836. [Google Scholar] [CrossRef]
- Kong, D.; Zhang, Y.; Gu, X.; Wang, D. A robust method for reconstructing global MODIS EVI time series on the Google Earth Engine. ISPRS J. Photogramm. 2019, 155, 13–24. [Google Scholar] [CrossRef]
- Yang, J.; Huang, X. The 30 m annual land cover dataset and its dynamics in China from 1990 to 2019. Earth Syst. Sci. Data 2021, 13, 3907–3925. [Google Scholar] [CrossRef]
- Liu, Y.; Yuan, X.; Li, J.; Qian, K.; Yan, W.; Yang, X.; Ma, X. Trade-offs and synergistic relationships of ecosystem services under land use change in Xinjiang from 1990 to 2020: A Bayesian network analysis. Sci. Total Environ. 2023, 858, 160015. [Google Scholar] [CrossRef]
- Su, Y.; Guo, Q. A practical method for SRTM DEM correction over vegetated mountain areas. ISPRS J. Photogramm. 2014, 87, 216–228. [Google Scholar] [CrossRef]
- Schroeder, W.; Csiszar, I.; Morisette, J. Quantifying the impact of cloud obscuration on remote sensing of active fires in the Brazilian Amazon. Remote Sens. Environ. 2008, 112, 456–470. [Google Scholar] [CrossRef]
- Jönsson, P.; Eklundh, L. TIMESAT—A program for analyzing time-series of satellite sensor data. Comput. Geosci. 2004, 30, 833–845. [Google Scholar] [CrossRef]
- Li, L.; Friedl, M.A.; Xin, Q.; Gray, J.; Pan, Y.; Frolking, S. Mapping crop cycles in China using MODIS-EVI time series. Remote Sens. 2014, 6, 2473–2493. [Google Scholar] [CrossRef]
- Ghassemian, H. A review of remote sensing image fusion methods. Inf. Fusion 2016, 32, 75–89. [Google Scholar] [CrossRef]
- Guo, B.; Zhang, J.; Meng, X.; Xu, T.; Song, Y. Long-term spatio-temporal precipitation variations in China with precipitation surface interpolated by ANUSPLIN. Sci. Rep. 2020, 10, 81. [Google Scholar] [CrossRef]
- Tan, J.; Xie, X.; Zuo, J.; Xing, X.; Liu, B.; Xia, Q.; Zhang, Y. Coupling random forest and inverse distance weighting to generate climate surfaces of precipitation and temperature with multiple-covariates. J. Hydrol. 2021, 598, 126270. [Google Scholar] [CrossRef]
- Chu, T.; Guo, X. Compositing MODIS time series for reconstructing burned areas in the taiga–steppe transition zone of northern Mongolia. Int. J. Wildland Fire 2015, 24, 419–432. [Google Scholar] [CrossRef]
- Hardtke, L.A.; Blanco, P.D.; Valle, H.F.; Metternicht, G.I.; Sione, W.F. Semi-automated mapping of burned areas in semi-arid ecosystems using MODIS time-series imagery. Int. J. Appl. Earth Obs. 2015, 38, 25–35. [Google Scholar] [CrossRef]
- Michael, Y.; Helman, D.; Glickman, O.; Gabay, D.; Brenner, S.; Lensky, I.M. Forecasting fire risk with machine learning and dynamic information derived from satellite vegetation index time-series. Sci. Total Environ. 2021, 764, 142844. [Google Scholar] [CrossRef]
- Gao, L.; Wang, X.; Johnson, B.A.; Tian, Q.; Wang, Y.; Verrelst, J.; Mu, X.; Gu, X. Remote sensing algorithms for estimation of fractional vegetation cover using pure vegetation index values: A review. ISPRS J. Photogramm. 2020, 159, 364–377. [Google Scholar] [CrossRef]
- Deng, Y.; Wang, M.; Yousefpour, R.; Hanewinkel, M. Abiotic disturbances affect forest short-term vegetation cover and phenology in Southwest China. Ecol. Indic. 2021, 124, 107393. [Google Scholar] [CrossRef]
- Lim, C.H.; Kim, Y.S.; Won, M.; Kim, S.J.; Lee, W.K. Can satellite-based data substitute for surveyed data to predict the spatial probability of forest fire? A geostatistical approach to forest fire in the Republic of Korea. Geomat. Nat. Haz. Risk 2019, 10, 719–739. [Google Scholar] [CrossRef]
- Tariq, A.; Shu, H.; Siddiqui, S.; Mousa, B.G.; Munir, I.; Nasri, A.; Waqas, H.; Lu, L.; Baqa, M.F. Forest fire monitoring using spatial-statistical and Geo-spatial analysis of factors determining forest fire in Margalla Hills, Islamabad, Pakistan. Geomat. Nat. Haz. Risk 2021, 12, 1212–1233. [Google Scholar] [CrossRef]
- Liu, M.; Feng, F.; Cai, T.; Tang, S. Soil microbial community response differently to the frequency and strength of freeze–thaw events in a Larix gmelinii Forest in the Daxing’an mountains, China. Front. Microbiol. 2020, 11, 1164. [Google Scholar] [CrossRef] [PubMed]
- Watanabe, T.; Tateno, R.; Imada, S.; Fukuzawa, K.; Isobe, K.; Urakawa, R.; Oda, T.; Hosokawa, N.; Sasai, T.; Hishi, T.; et al. The effect of a freeze–thaw cycle on dissolved nitrogen dynamics and its relation to dissolved organic matter and soil microbial biomass in the soil of a northern hardwood forest. Biogeochemistry 2019, 142, 319–338. [Google Scholar] [CrossRef]
- Fang, K.; Yao, Q.; Guo, Z.; Zheng, B.; Du, J.; Qi, F.; Yan, P.; Li, J.; Ou, T.; Liu, J.; et al. ENSO modulates wildfire activity in China. Nat. Commun. 2021, 12, 1764. [Google Scholar] [CrossRef]
- Liu, Z.; Ballantyne, A.P.; Cooper, L.A. Increases in land surface temperature in response to fire in Siberian boreal forests and their attribution to biophysical processes. Geophys. Res. Lett. 2018, 45, 6485–6494. [Google Scholar] [CrossRef]
- Michetti, M.; Pinar, M. Forest fires across Italian regions and implications for climate change: A panel data analysis. Environ. Resour. Econ. 2019, 72, 207–246. [Google Scholar] [CrossRef]
- Çolak, E.; Sunar, F. Evaluation of forest fire risk in the Mediterranean Turkish forests: A case study of Menderes region, Izmir. Int. J. Disaster Risk Reduct. 2020, 45, 101479. [Google Scholar] [CrossRef]
- Xiong, Q.; Luo, X.; Liang, P.; Xiao, Y.; Xiao, Q.; Sun, H.; Pan, K.; Wang, L.; Li, L.; Pan, X. Fire from policy, human interventions, or biophysical factors? Temporal–spatial patterns of forest fire in southwestern China. For. Ecol. Manag. 2020, 474, 118381. [Google Scholar] [CrossRef]
- Xu, X.K. Effect of freeze-thaw disturbance on soil C and N dynamics and GHG fluxes of East Asia forests: Review and future perspectives. Soil Sci. Plant Nutr. 2022, 68, 15–26. [Google Scholar] [CrossRef]
- Wang, M.Y.; Shu, L.F.; Zhao, F.J.; Wang, Q.H.; Yan, H.; Dai, X.A.; Tian, X.R. Quantity analysis of forest fuel under the impacts of snow damage in South of China-Case study in Hunan Province. Sci. Silvae Sin. 2008, 44, 69–74. (In Chinese) [Google Scholar]
- Liu, C.; Chen, L.; Tang, W.; Peng, S.; Li, M.; Deng, N.; Chen, Y. Predicting potential distribution and evaluating suitable soil condition of oil tea Camellia in China. Forests 2018, 9, 487. [Google Scholar] [CrossRef]
- Zhang, S.; Xiao, J.; Xu, Q. Regional precipitation variations during Heinrich events and Dansgaard-Oeschger cycles in the northern margin of the East Asian summer monsoon region. Quat. Sci. Rev. 2022, 278, 107380. [Google Scholar] [CrossRef]
- Pourghasemi, H.R.; Gayen, A.; Lasaponara, R.; Tiefenbacher, J.P. Application of learning vector quantization and different machine learning techniques to assessing forest fire influence factors and spatial modelling. Environ. Res. 2020, 184, 109321. [Google Scholar] [CrossRef]
- Hu, T.; Zhao, B.; Li, F.; Dou, X.; Hu, H.; Sun, L. Effects of fire on soil respiration and its components in a Dahurian larch (Larix gmelinii) forest in northeast China: Implications for forest ecosystem carbon cycling. Geoderma 2021, 402, 115273. [Google Scholar] [CrossRef]
- Senf, C.; Buras, A.; Zang, C.S.; Ramming, A.; Seidl, R. Excess forest mortality is consistently linked to drought cross Europe. Nat. Commun. 2020, 11, 6200. [Google Scholar] [CrossRef]
- Sevinc, V.; Kucuk, O.; Goltas, M. A Bayesian network model for prediction and analysis of possible forest fire causes. For. Ecol Manag. 2020, 457, 117723. [Google Scholar] [CrossRef]
- Chiodi, A.M.; Larkin, N.S.; Varner, J.M. An analysis of Southeastern US prescribed burn weather windows: Seasonal variability and EI Niño associations. Int. J. Wildland Fire. 2018, 27, 176–189. [Google Scholar] [CrossRef]
- Wang, M.; Shu, L.; Wang, Q.; Zhao, F.; Tian, X.; Yan, H.; Du, J. Forest fire occurrence in short term under the impacts of snow damage in south China—Case study in Hunan Province. Sci. Silvae Sin. 2008, 44, 64–68. (In Chinese) [Google Scholar]
- Peng, J.B.; Bueh, C.; Xie, Z.W. Extensive cold-precipitation-freezing events in southern China and their circulation characteristics. Adv. Atmos. Sci. 2021, 38, 81–97. [Google Scholar] [CrossRef]
- Zheng, Y.; Yang, Q.; Xu, M.; Chi, Y.; Shen, R.; Li, P.; Dai, H. Responses of Pinus massoniana and Pinus taeda to freezing in temperate forests in central China. Scand. J. For. Res. 2012, 27, 520–531. [Google Scholar] [CrossRef]
Figure 1.
Forest distribution in subtropical China.
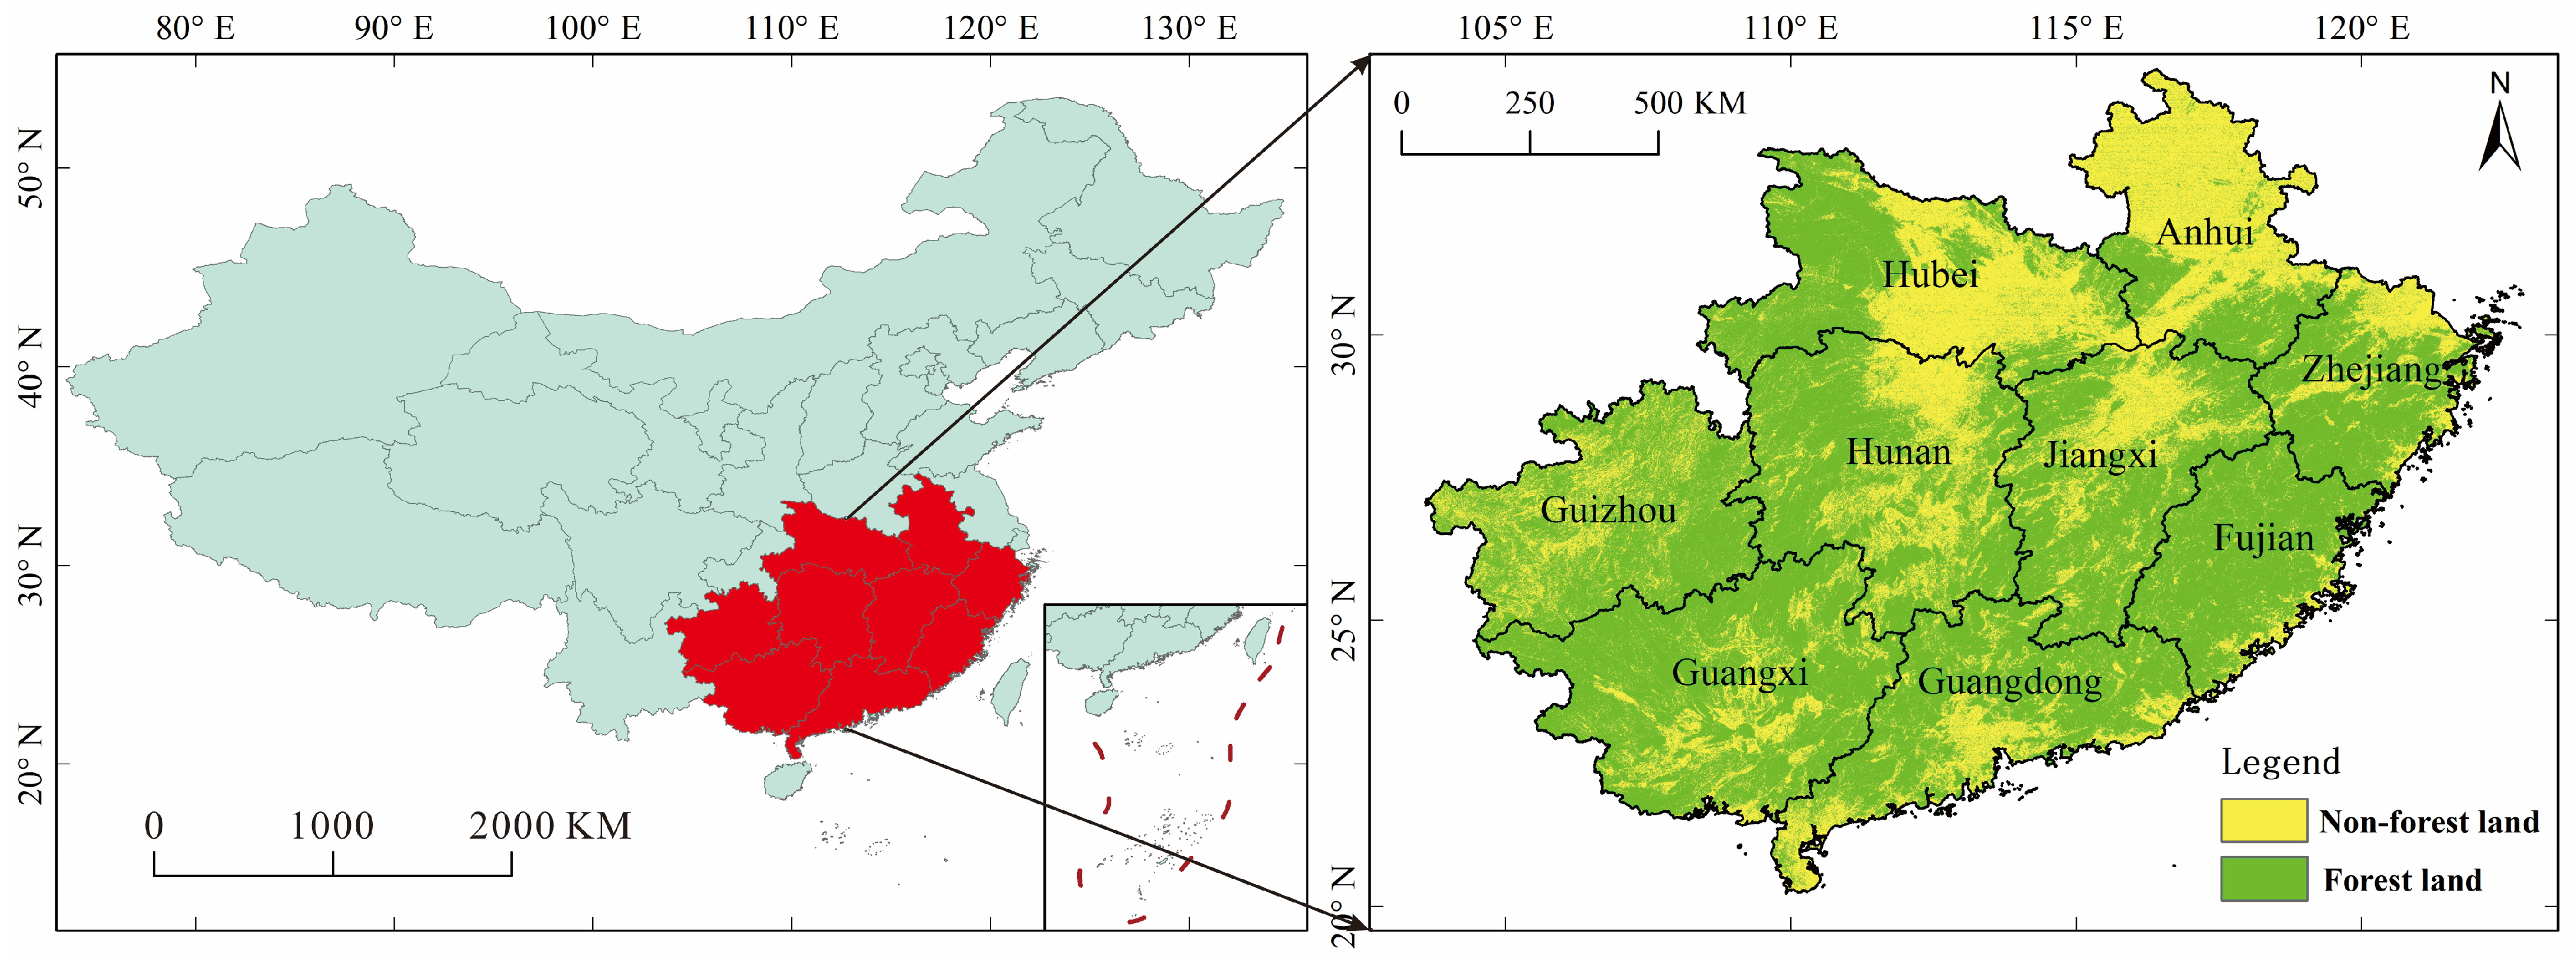
Figure 2.
Comparison of usefulness of vegetation index. In this figure, red represents valid areas. (A) represents EVI image, (B) represents the effectiveness of validity values of less than or equal to 2, (C) represents the effectiveness of validity values of less than or equal to 4, and (D) represents the effectiveness of validity values of less than or equal to 8.
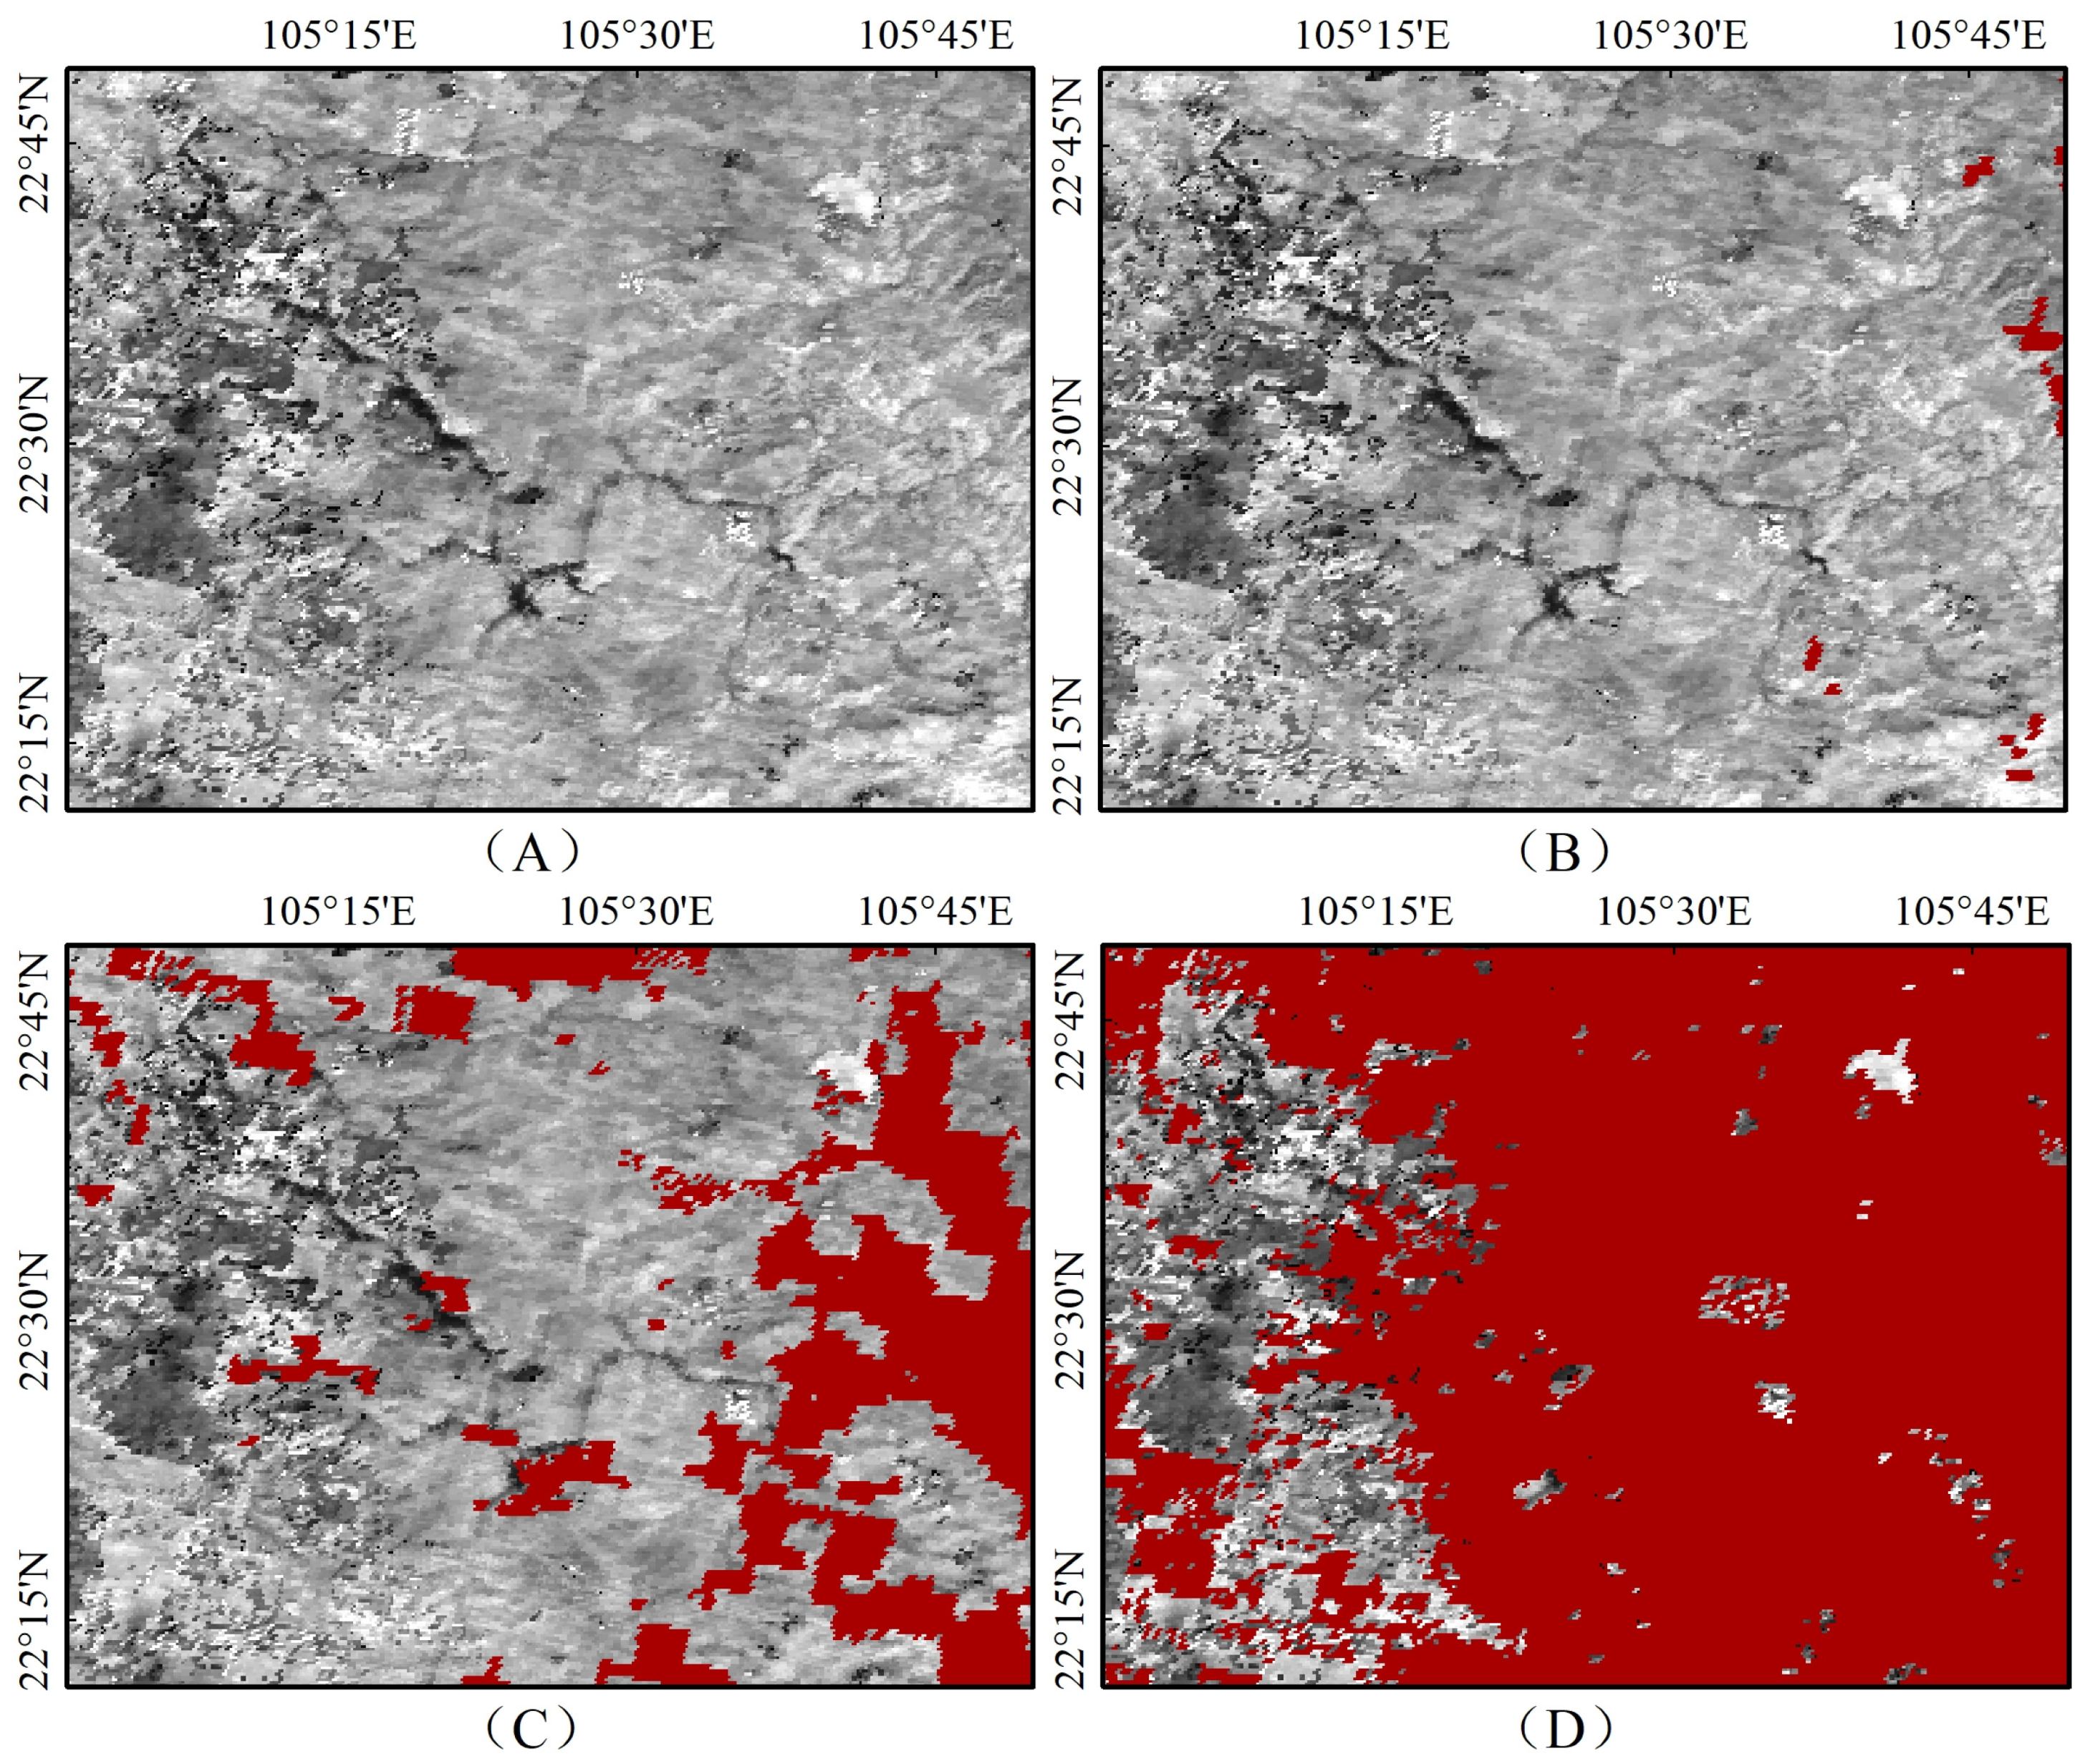
Figure 3.
The overall workflow of this study.
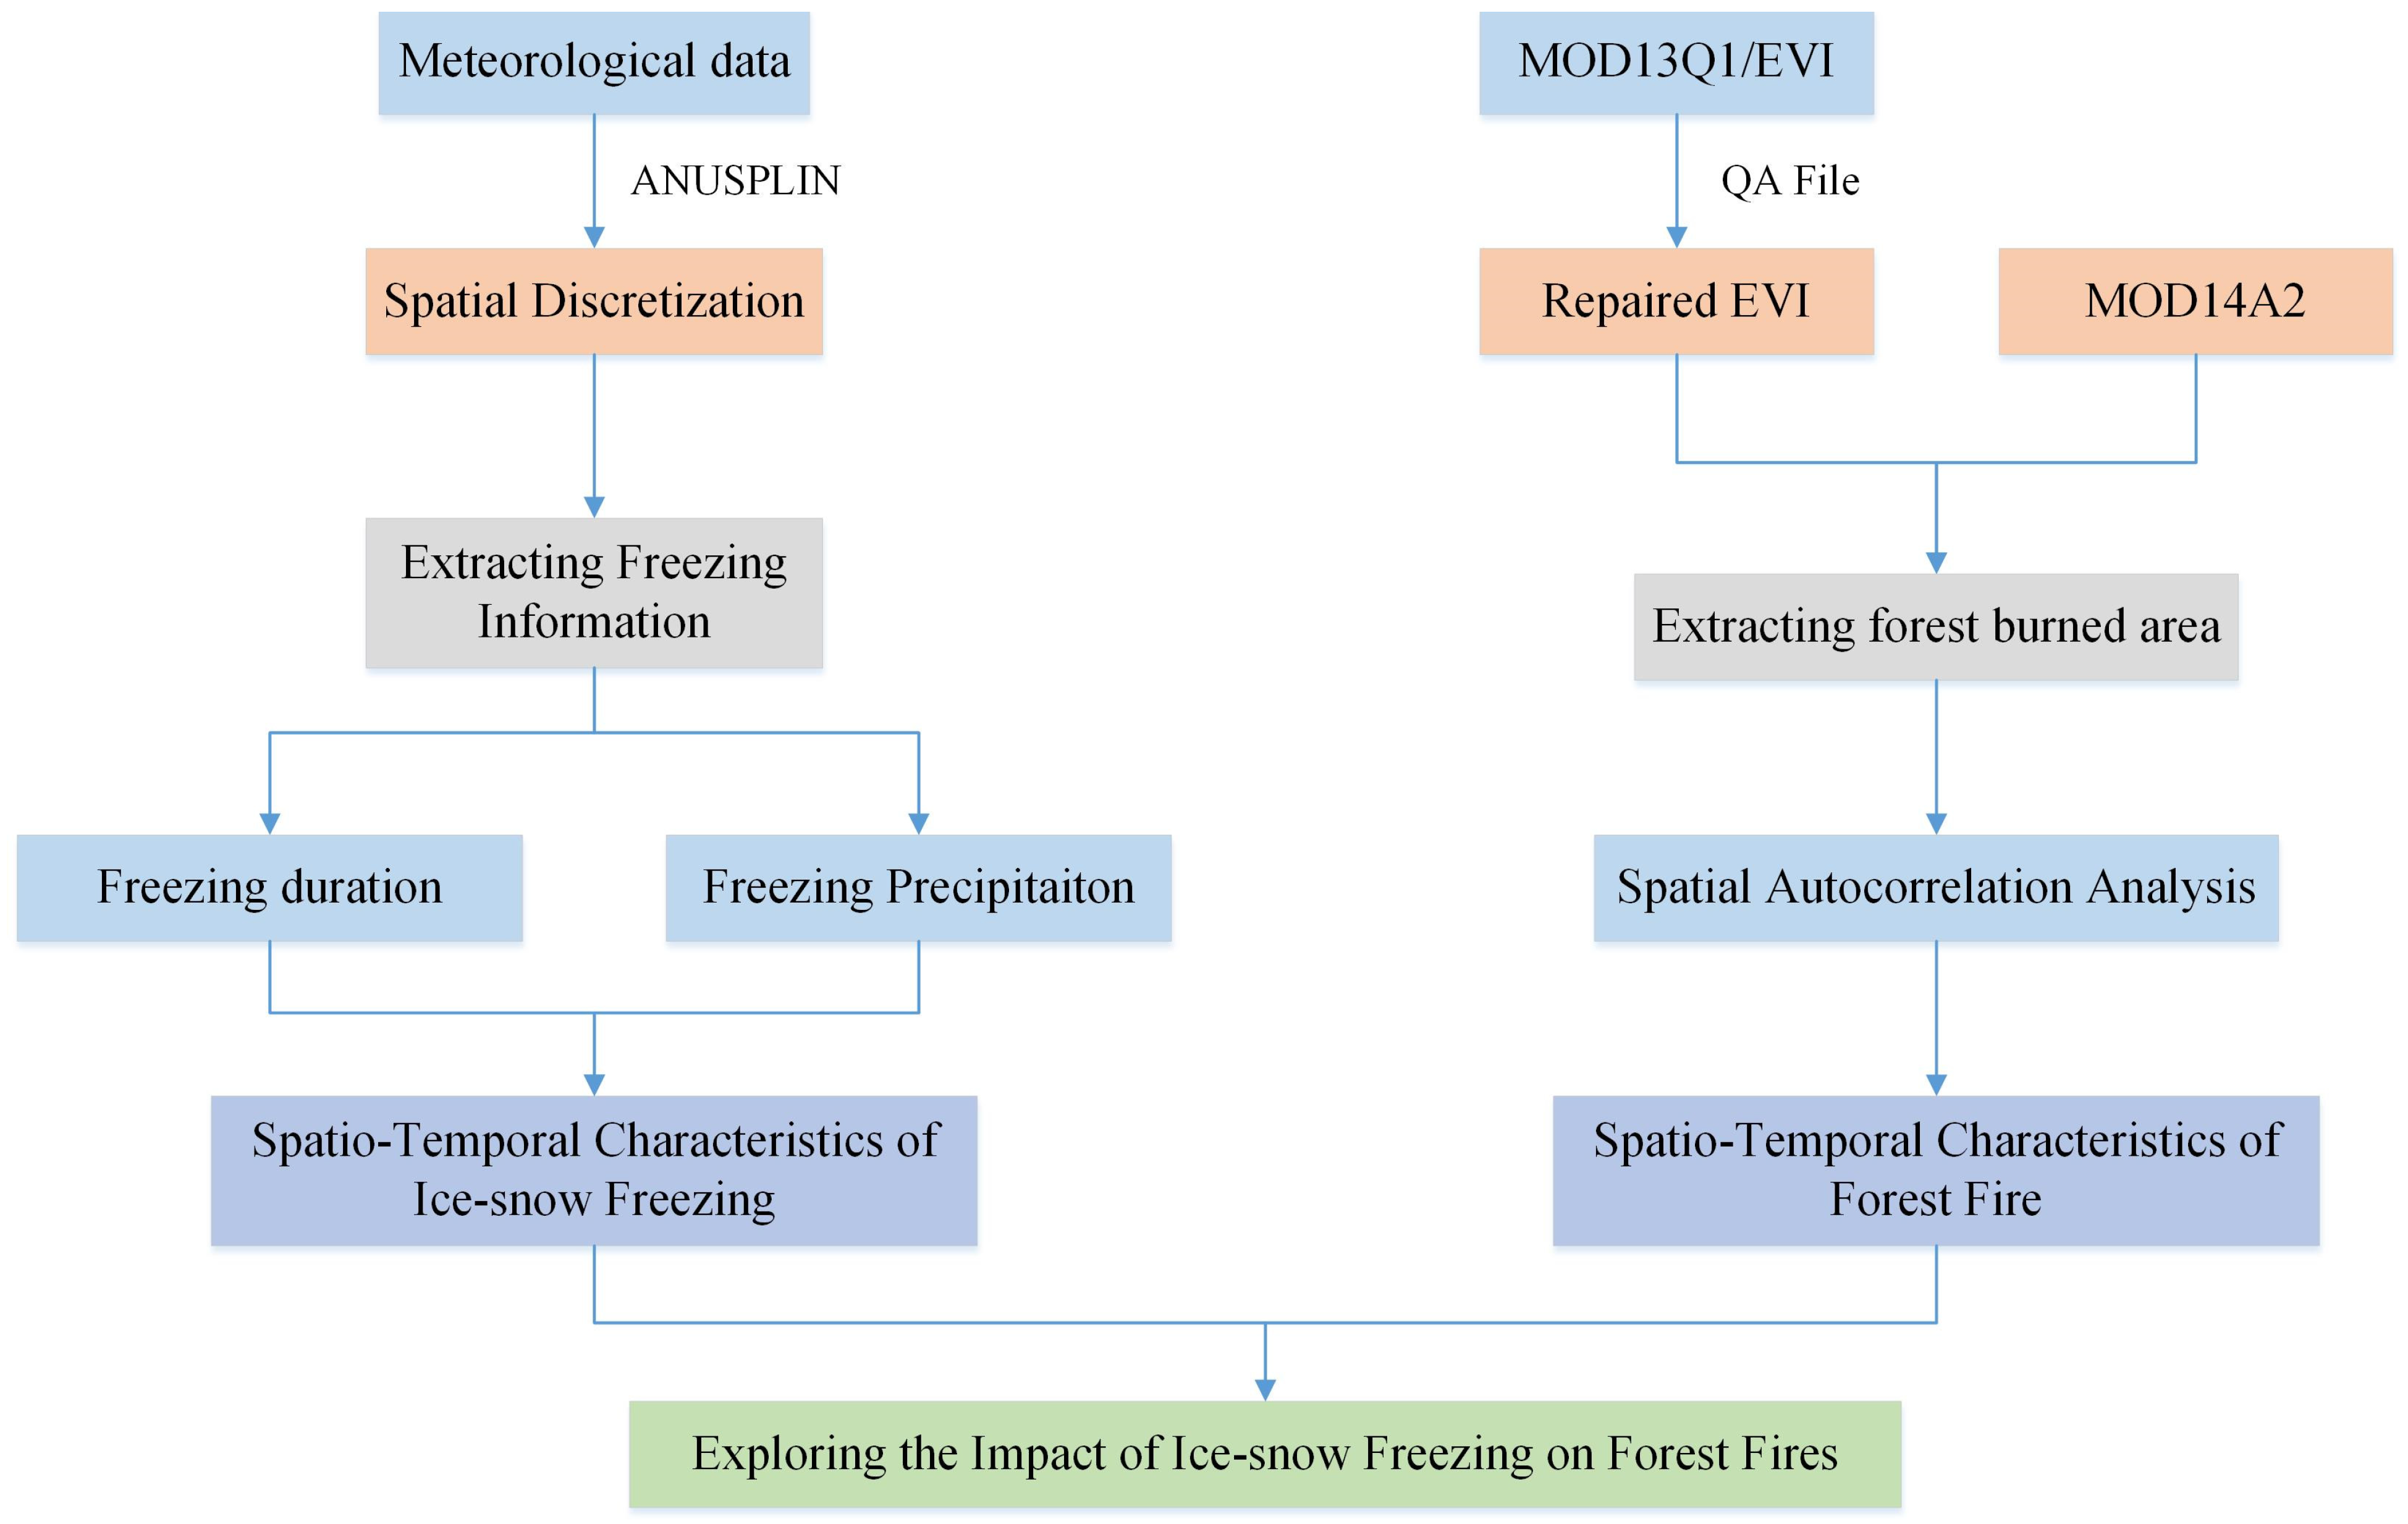
Figure 4.
The process of patching MODIS/EVI.
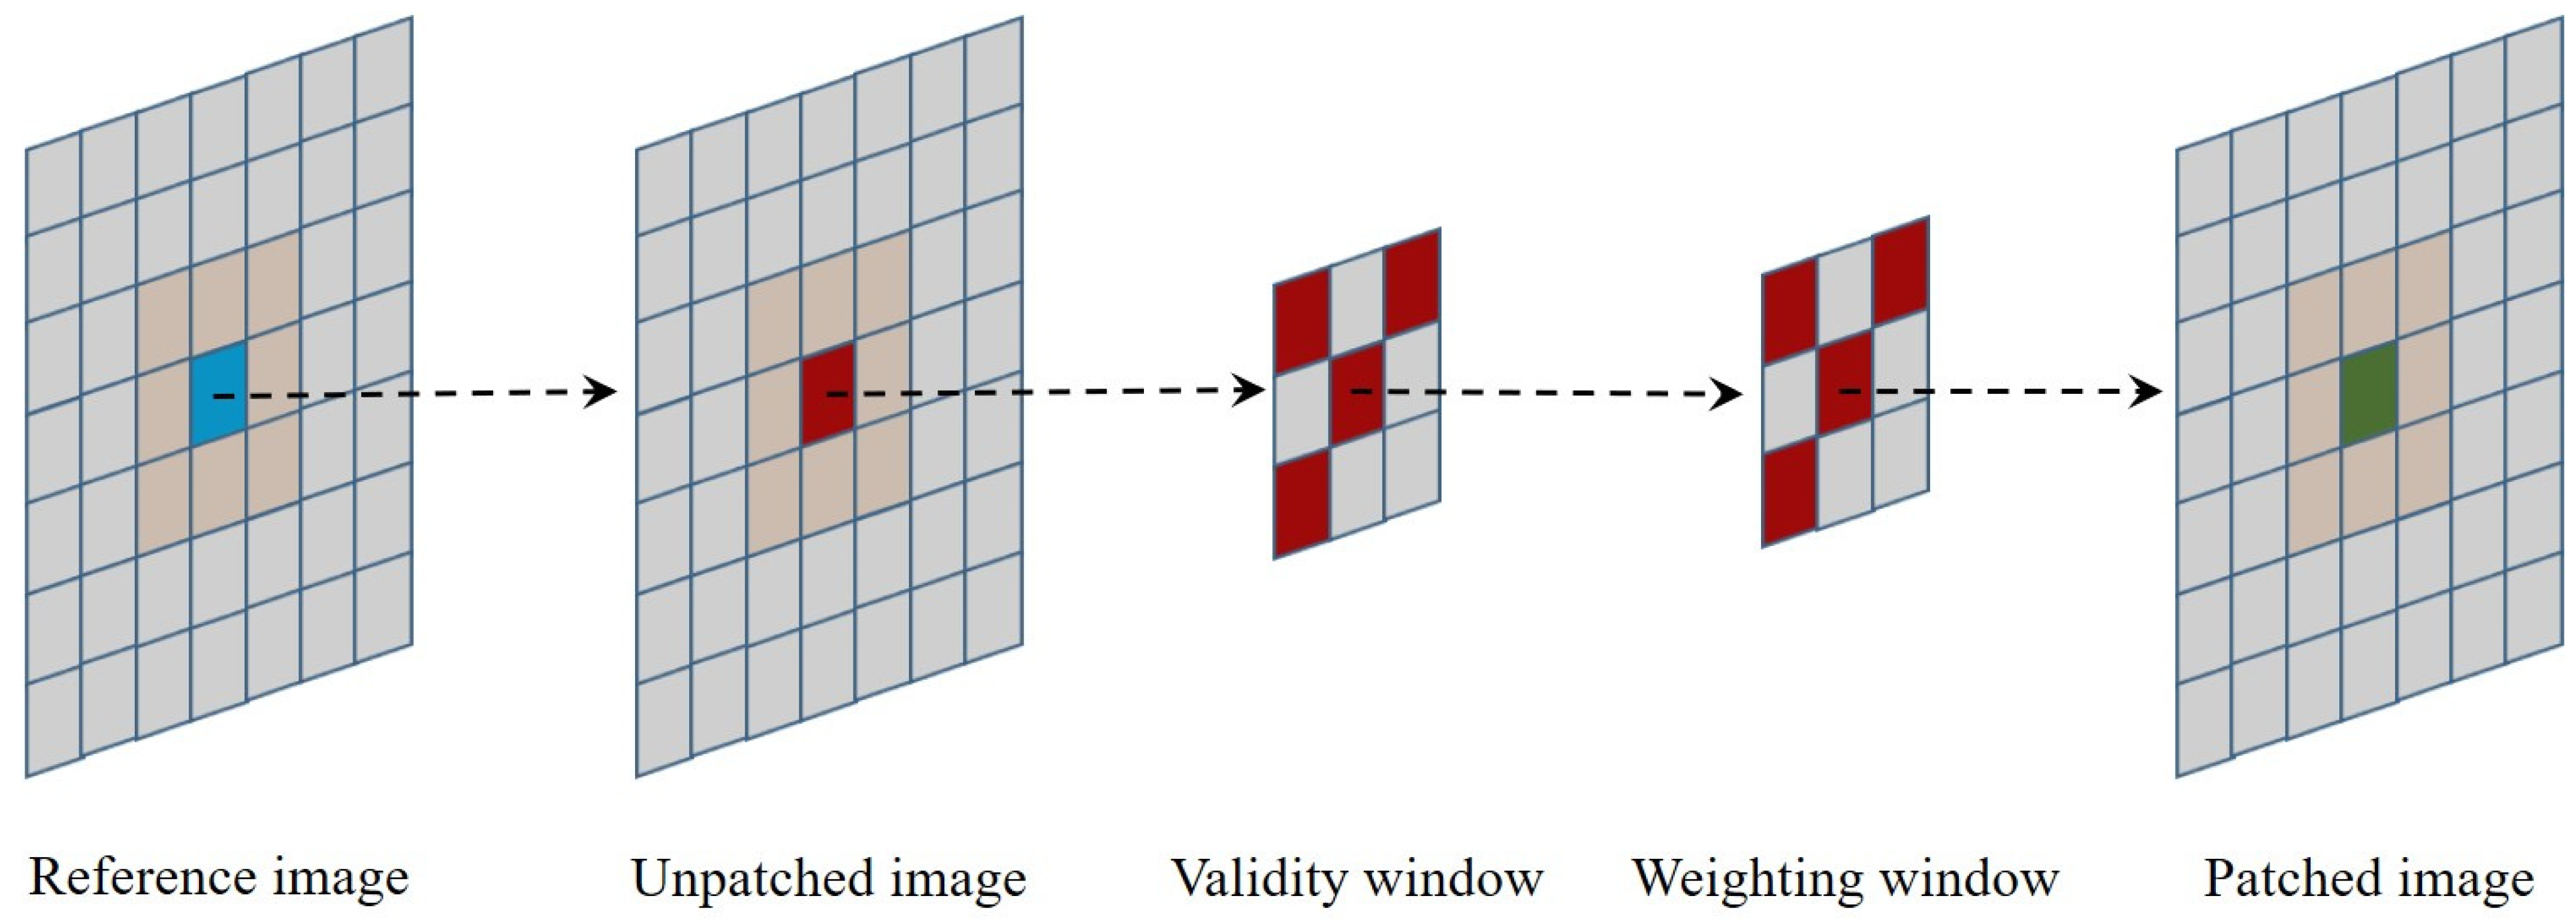
Figure 5.
The workflow of weight assignment.
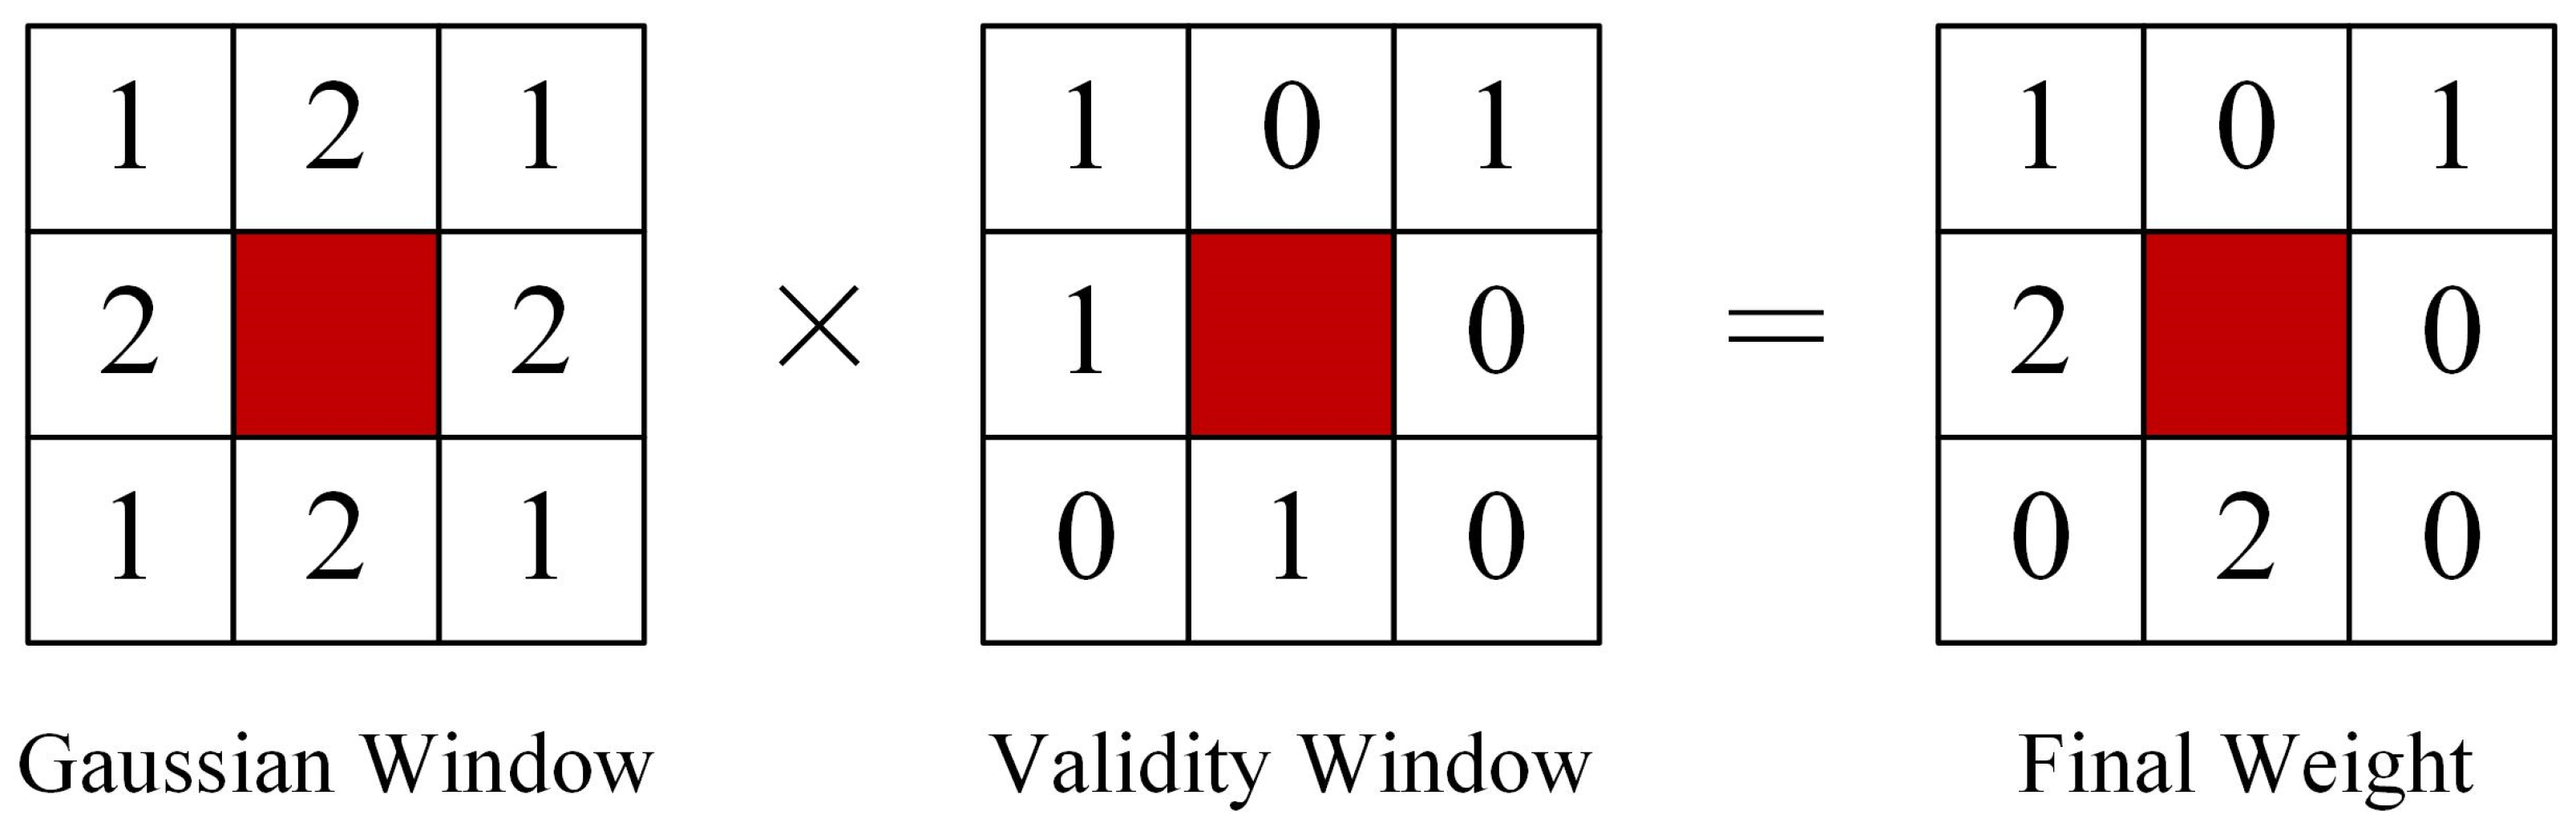
Figure 6.
Freezing statistics for forest vegetation in each province. (A) shows the average duration of freezing for forest-covered areas in the study area; (B) shows the average duration of freezing for forest-covered areas in each province; (C) shows the average precipitation of freezing for forest-covered areas in the study area; and (D) shows the average precipitation of freezing for forest-covered areas in each province.
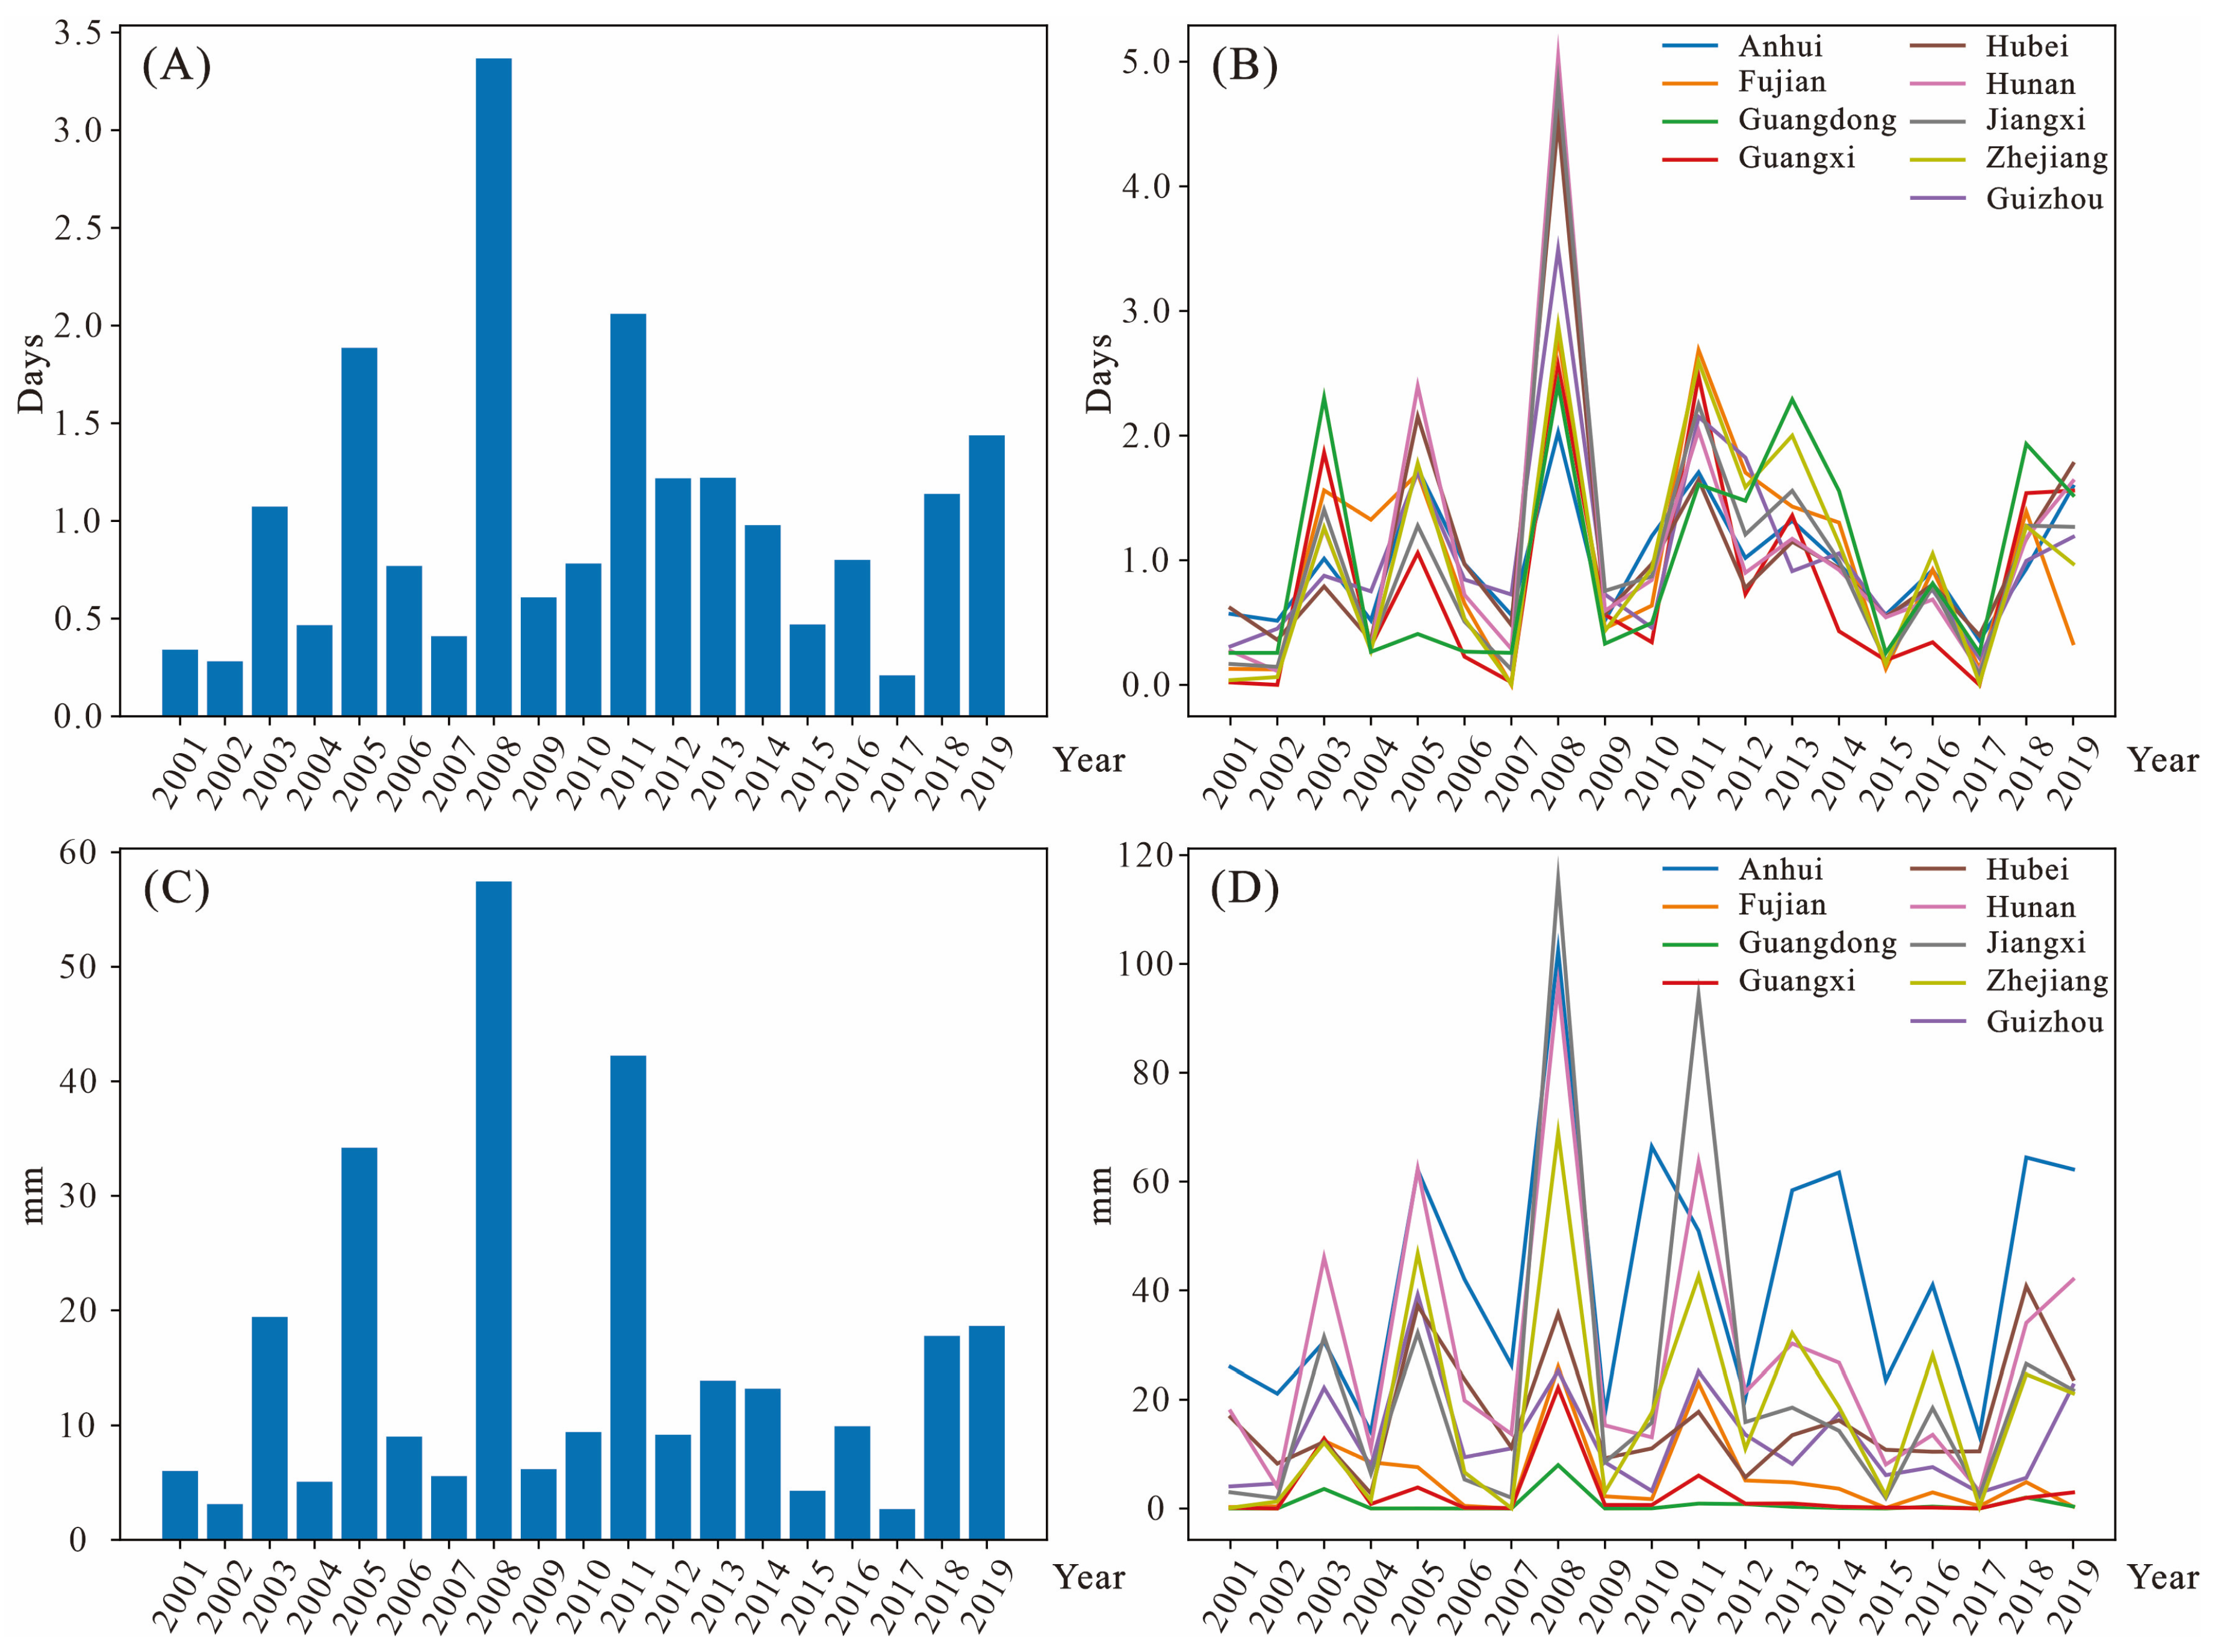
Figure 7.
Freezing statistics for forest vegetation in each county. (A) shows the average duration of freezing for forest-covered areas in each county during 2001–2019; (B) shows the average precipitation of freezing for forest-covered areas in each county during 2001–2019.
Figure 7.
Freezing statistics for forest vegetation in each county. (A) shows the average duration of freezing for forest-covered areas in each county during 2001–2019; (B) shows the average precipitation of freezing for forest-covered areas in each county during 2001–2019.
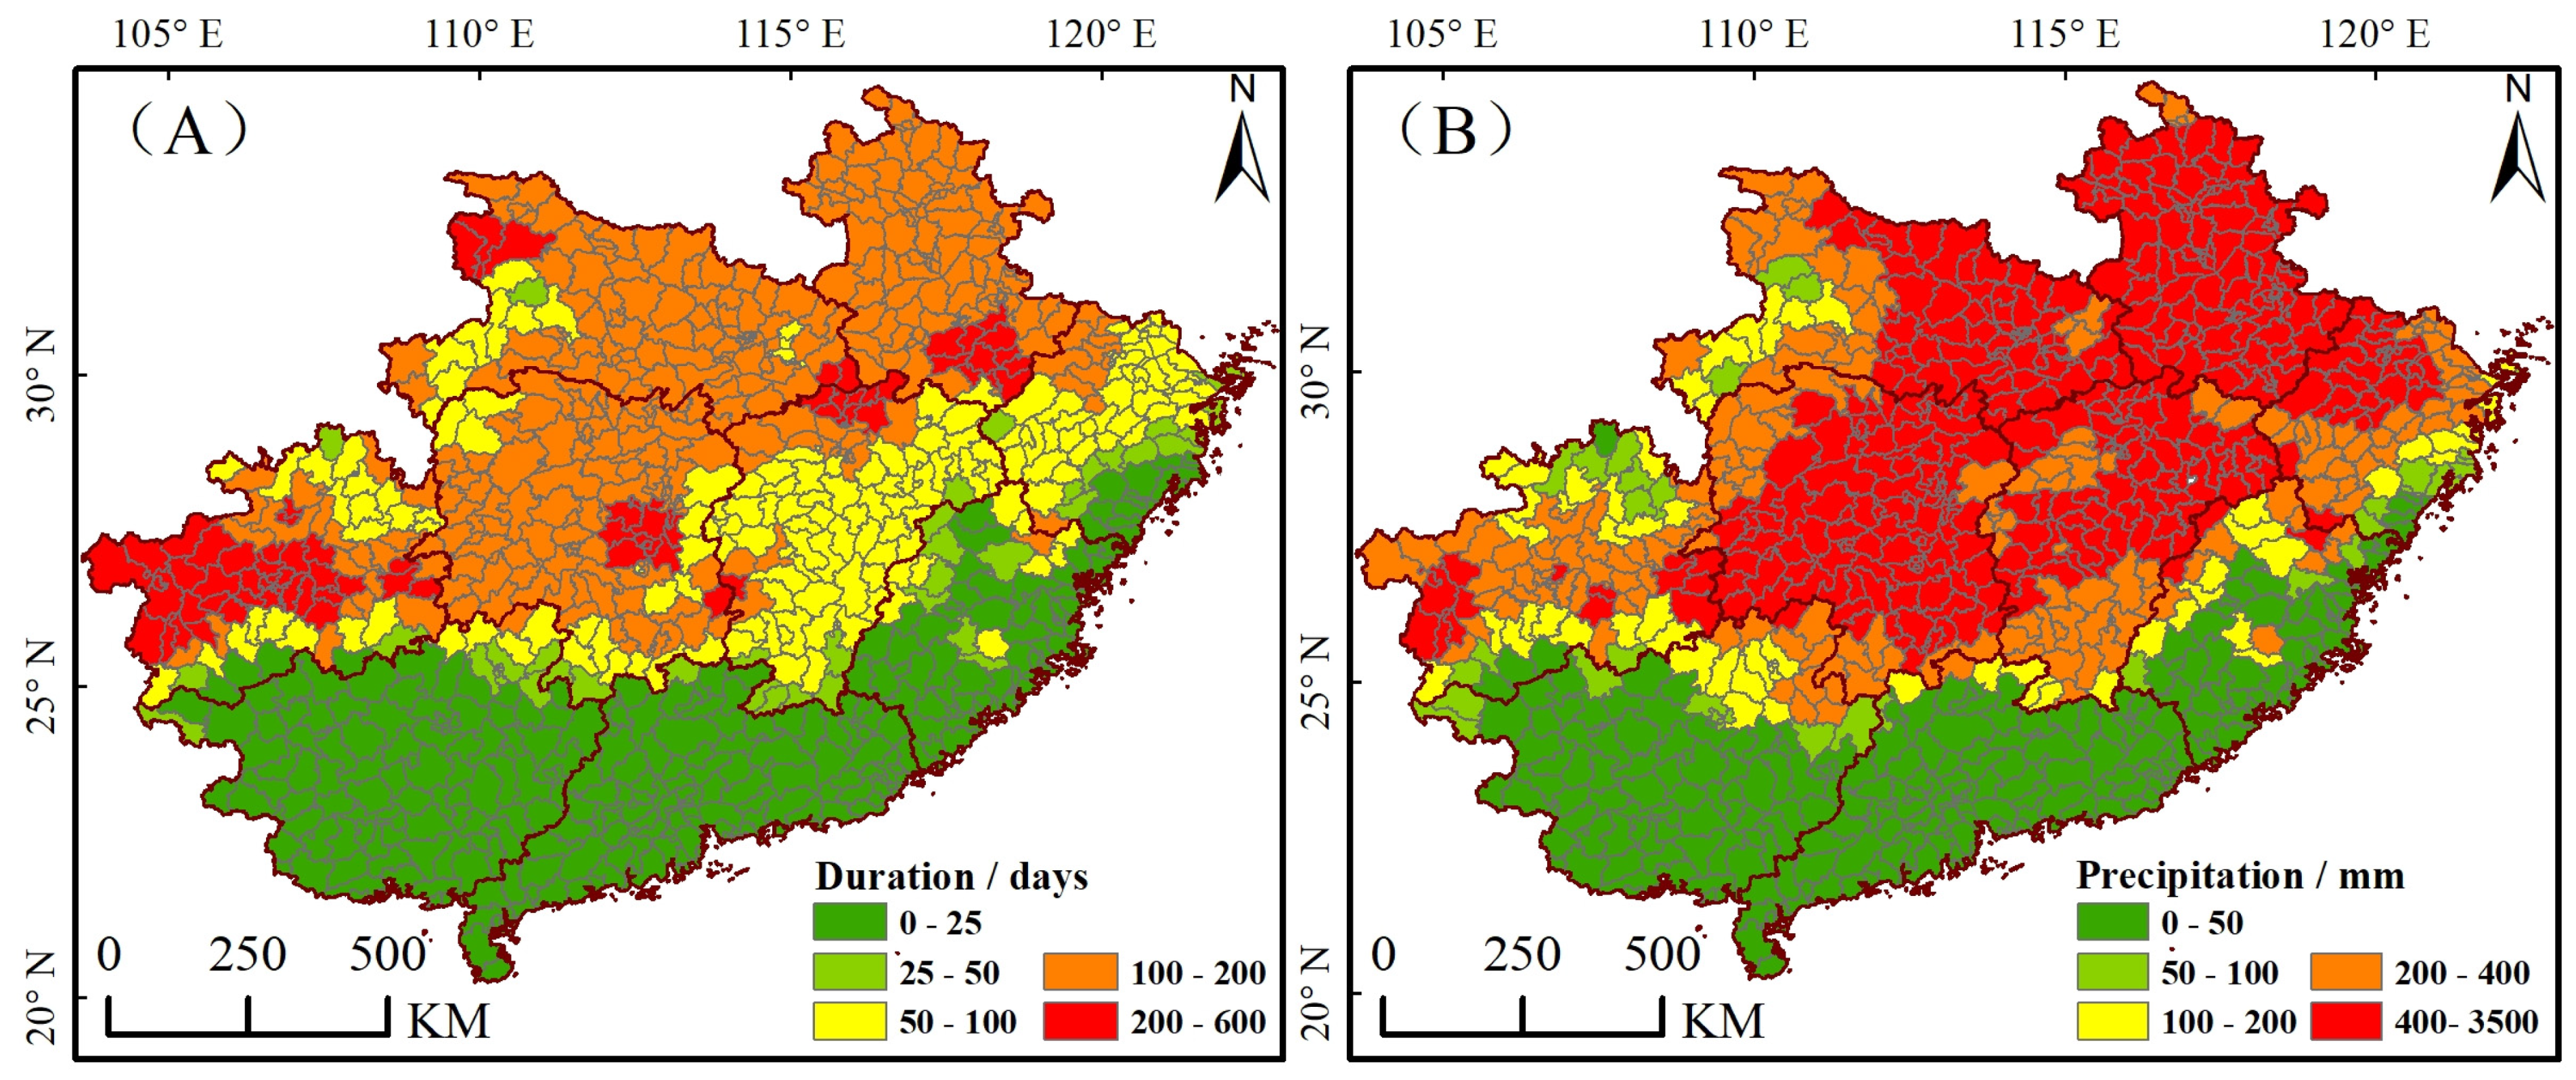
Figure 8.
Spatial distribution of forest fires in subtropical China, 2001–2019.
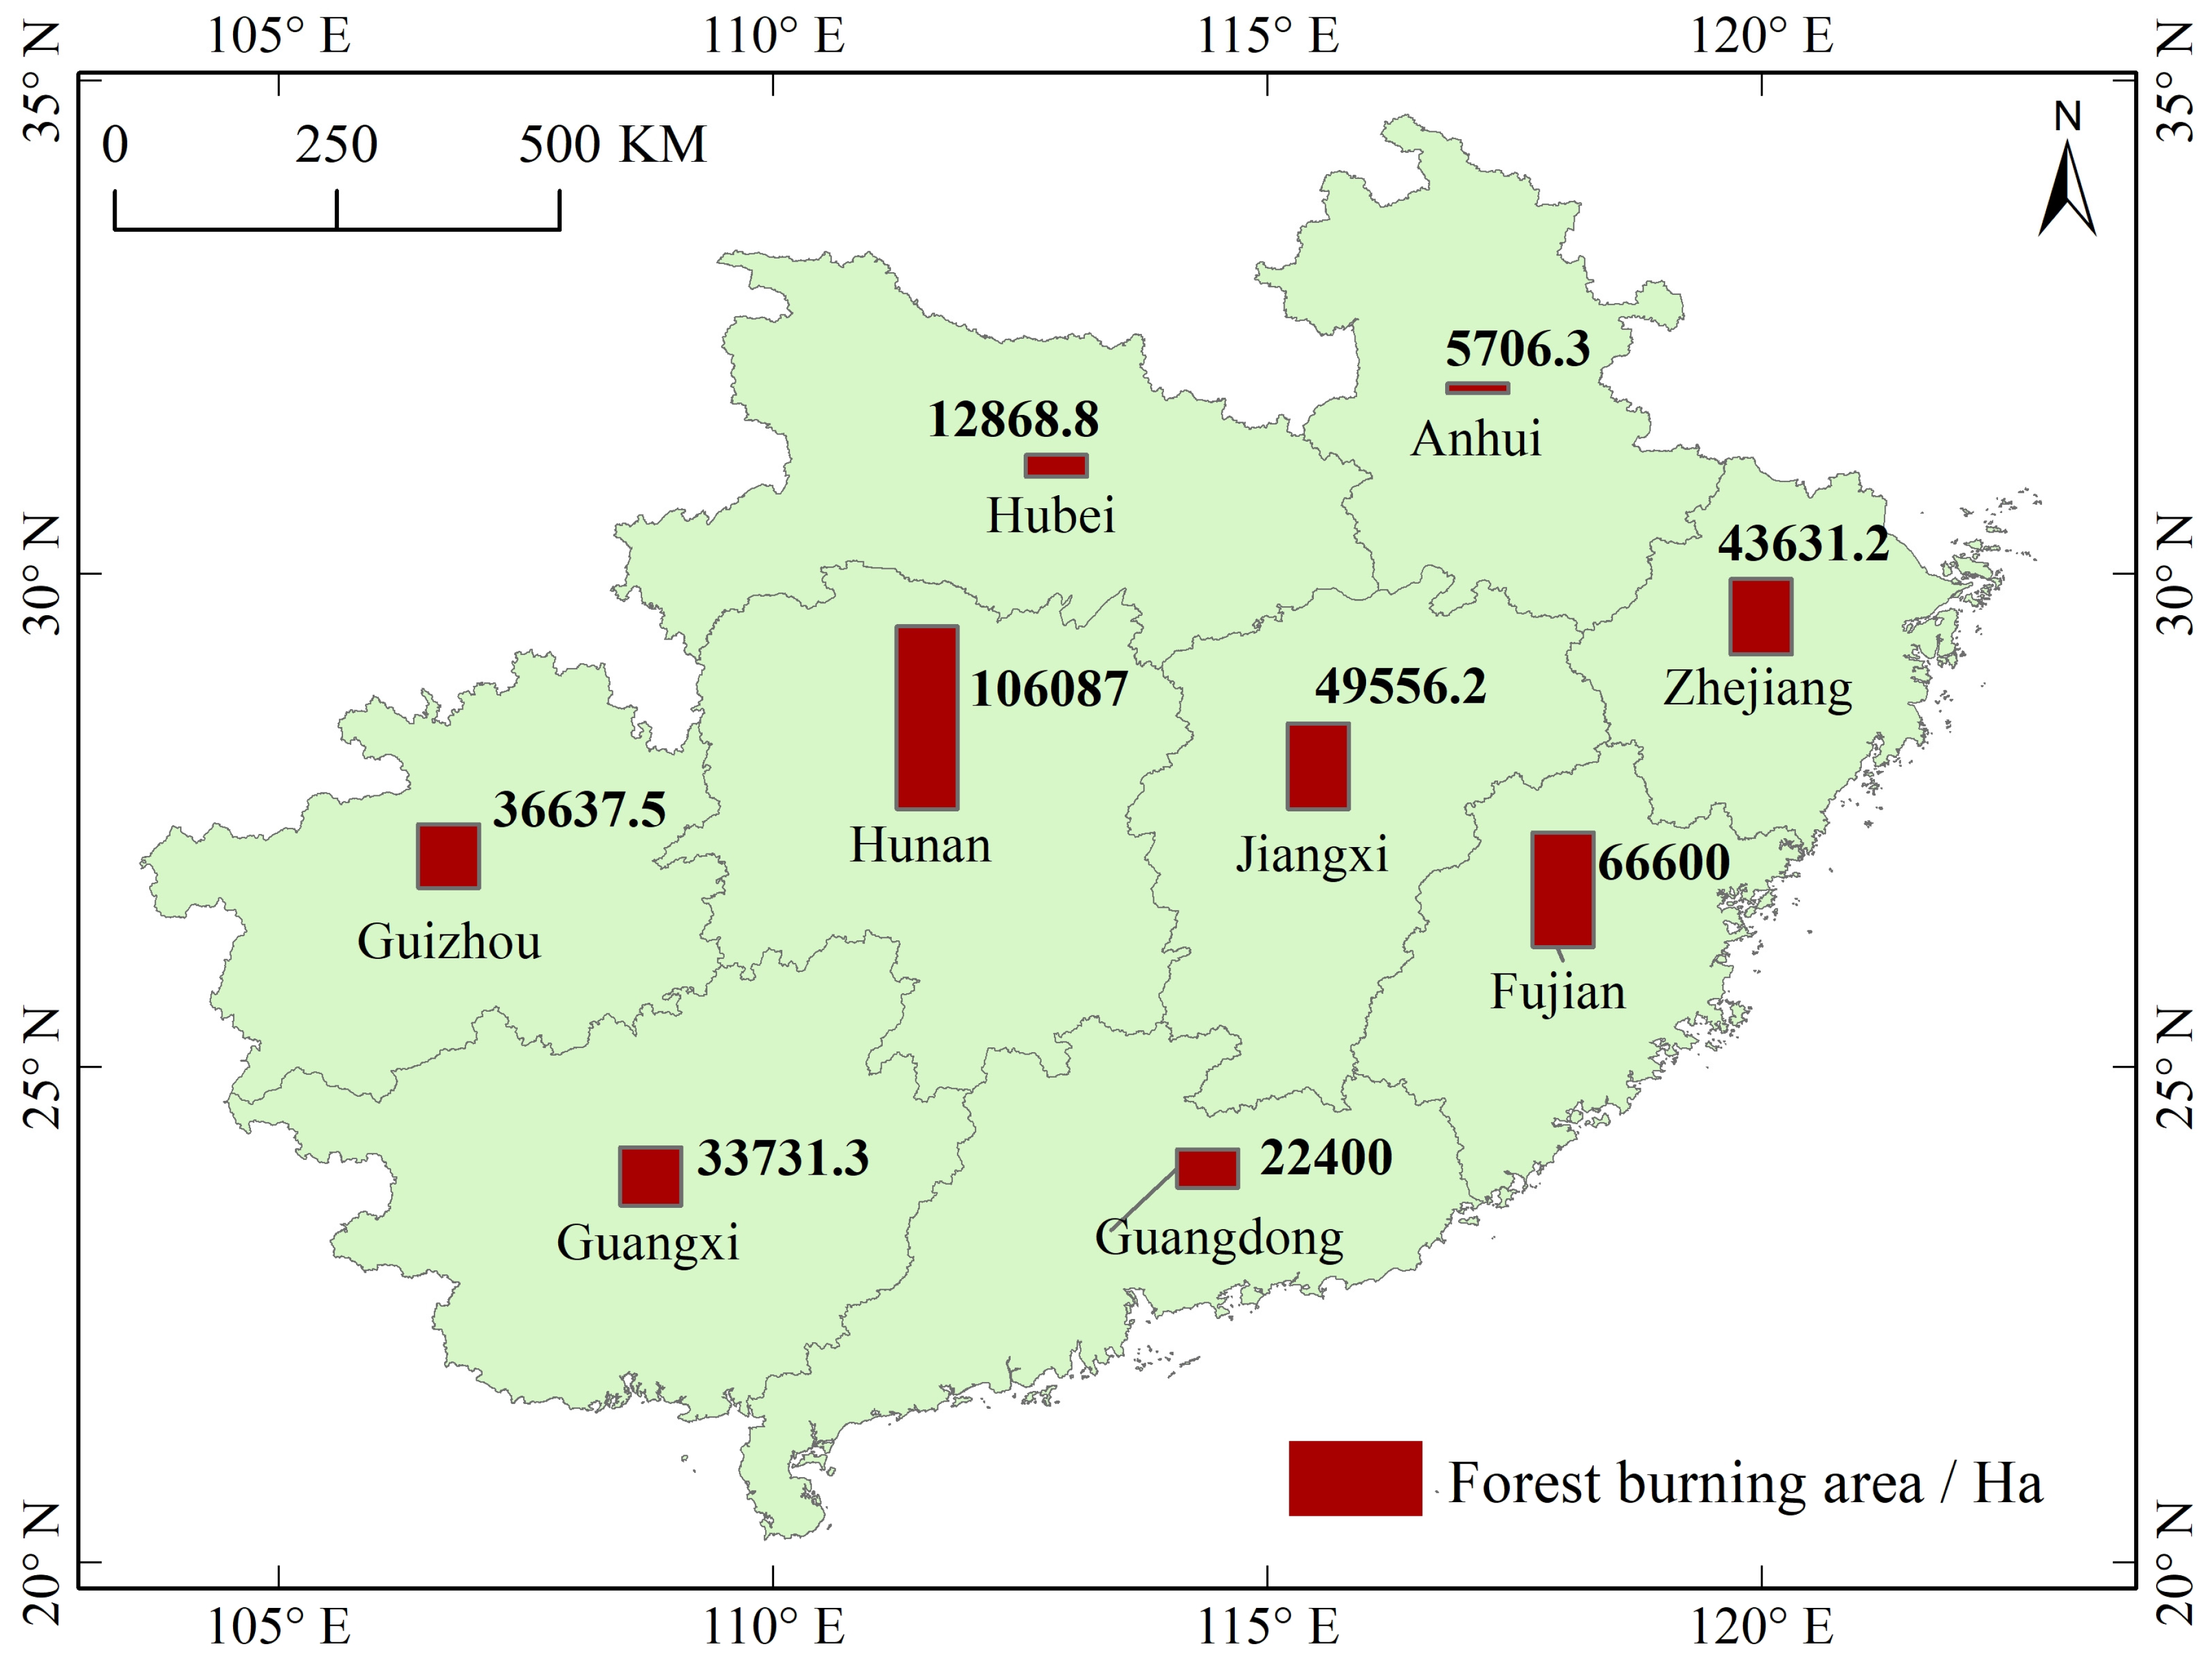
Figure 9.
LISA clustering map of forest fires in the study area.
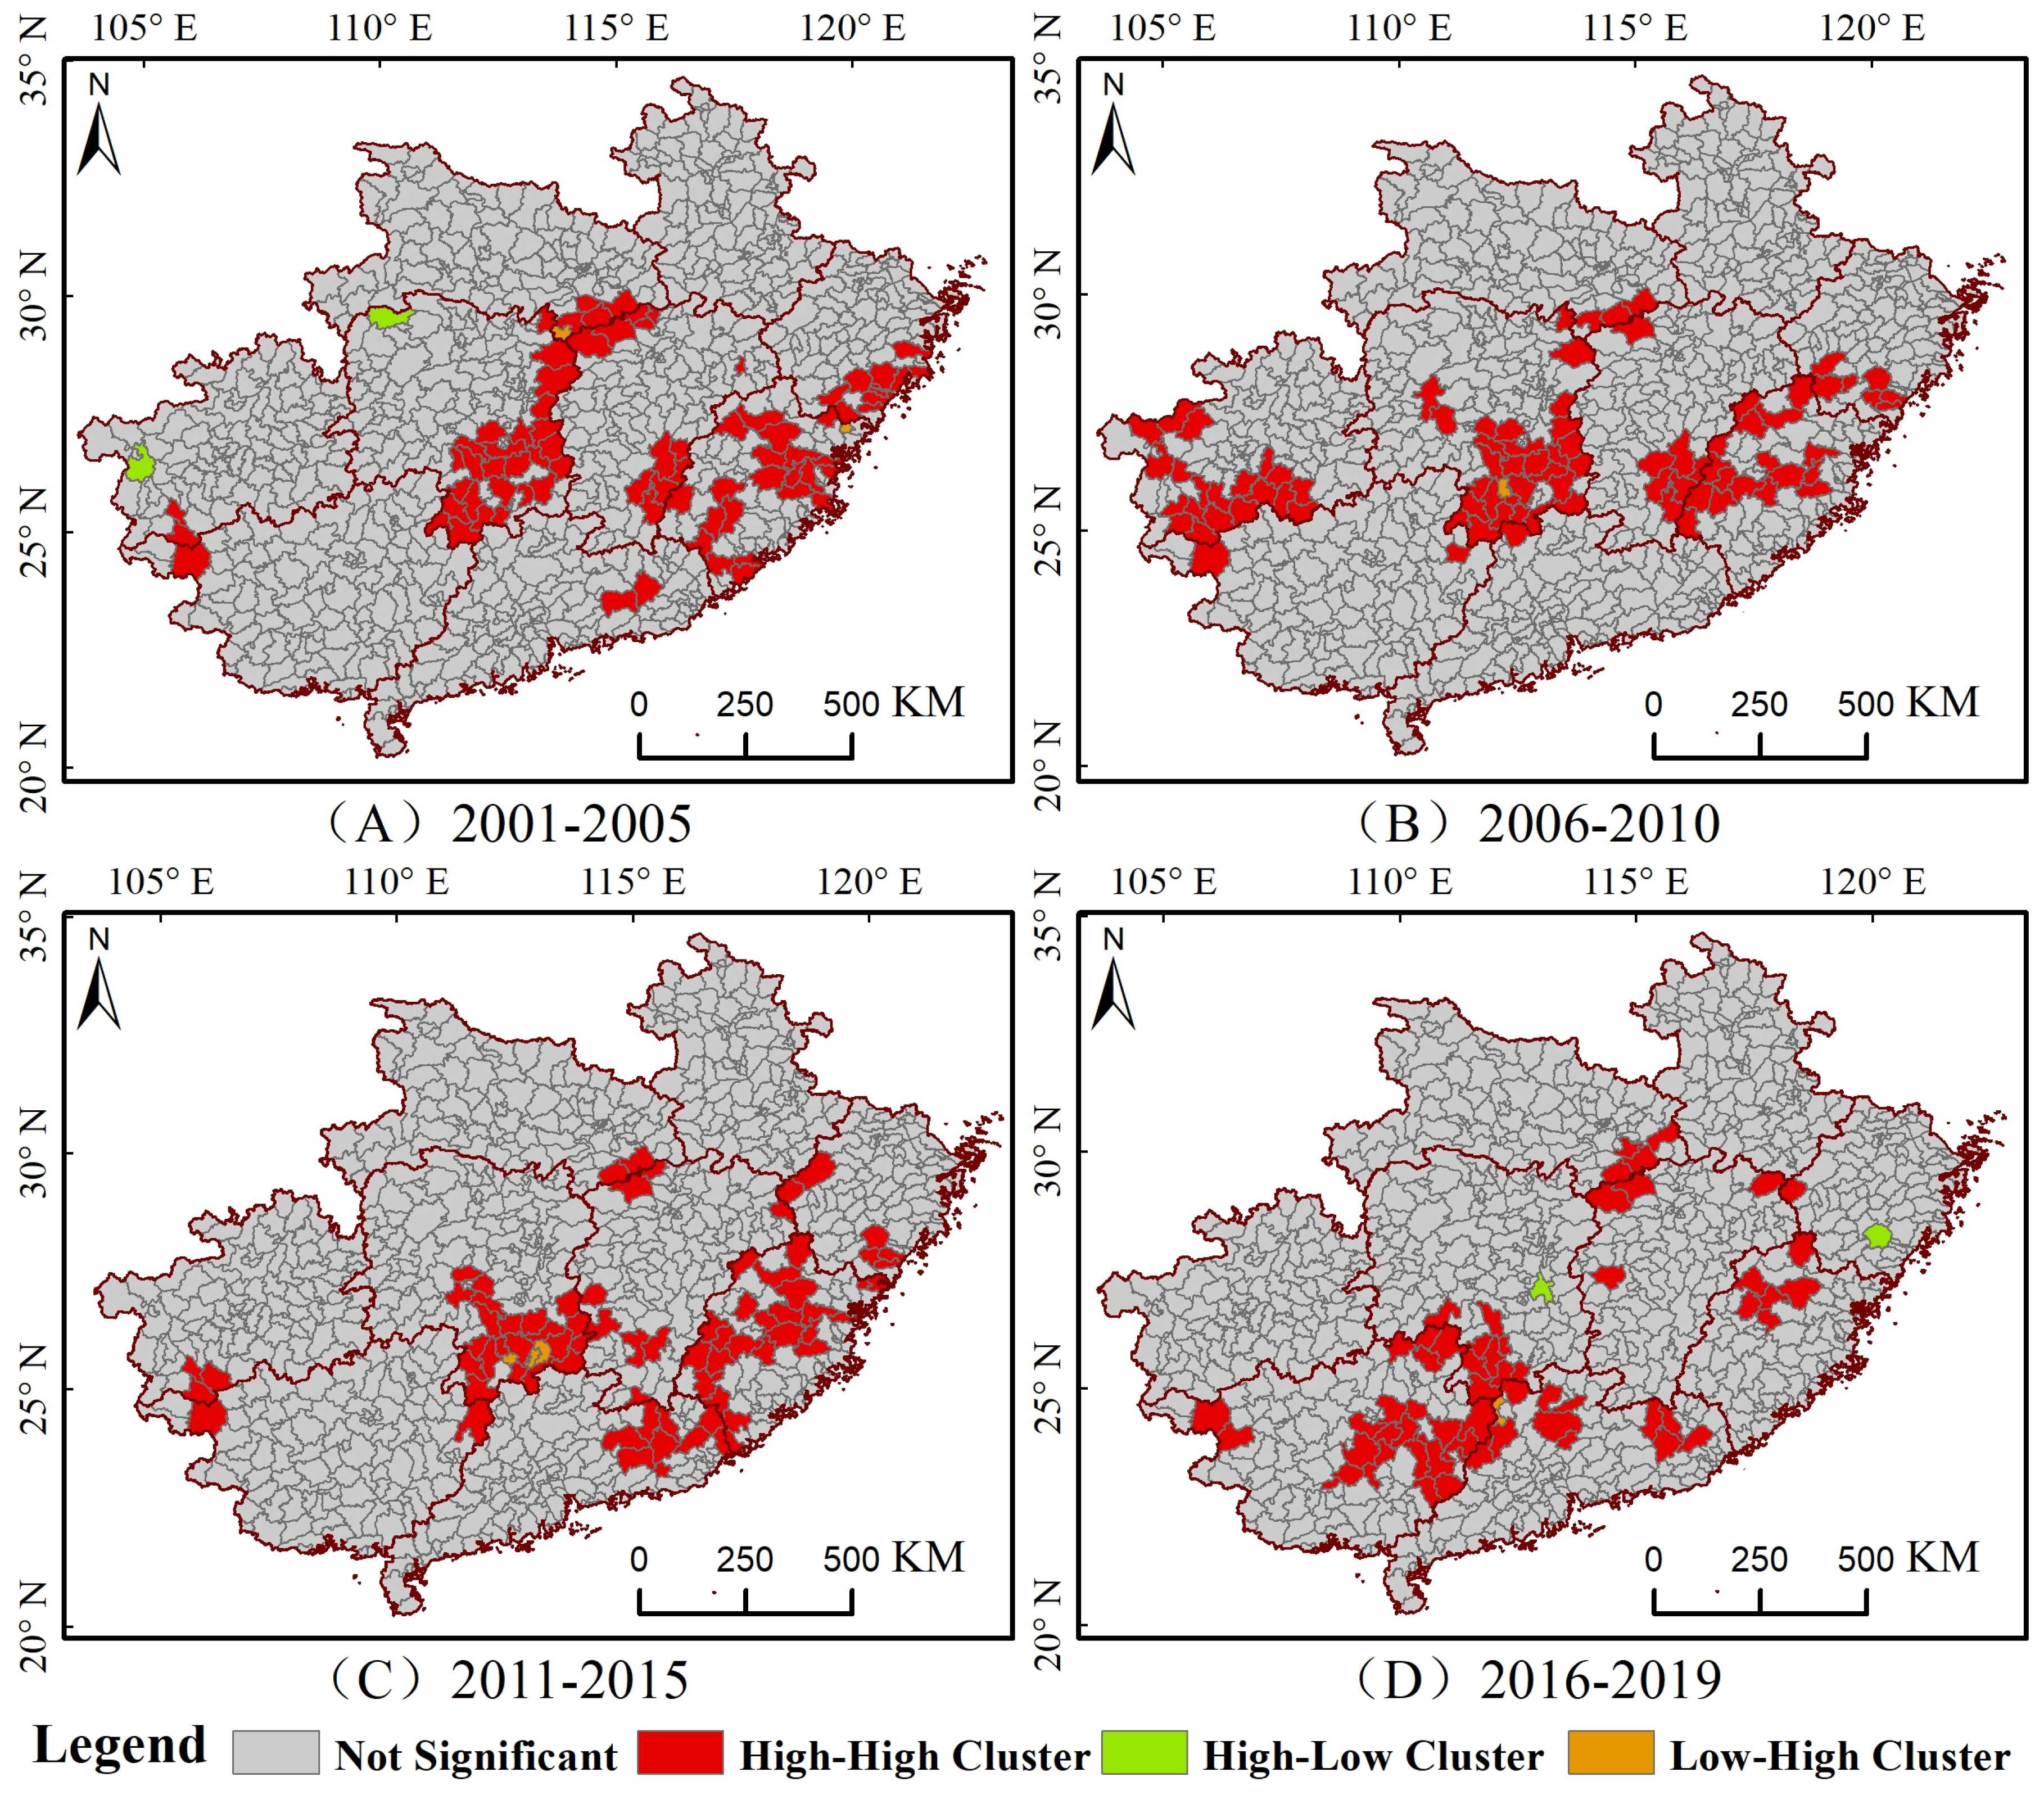
Figure 10.
Spatial and temporal distributions of forest fires in the study area, 2001–2019. (A) shows forest-damaged areas caused by fires for the study area, categorized by month; (B) shows forest-damaged areas caused by fires for each province, categorized by month; (C) shows forest-damaged areas caused by fires for the study area, categorized by year; and (D) shows forest-damaged areas caused by fires for each province, categorized by month.

Figure 11.
The statistics on precipitation, air temperature, relative humidity, and the number of forest fires under different time periods in subtropical China from 2001 to 2019. (A) shows precipitation categorized by month for the study area; (B) shows air temperature categorized by month for the study area; (C) shows relative humidity categorized by month for the study area; and (D) shows fire numbers categorized by month for the study area.
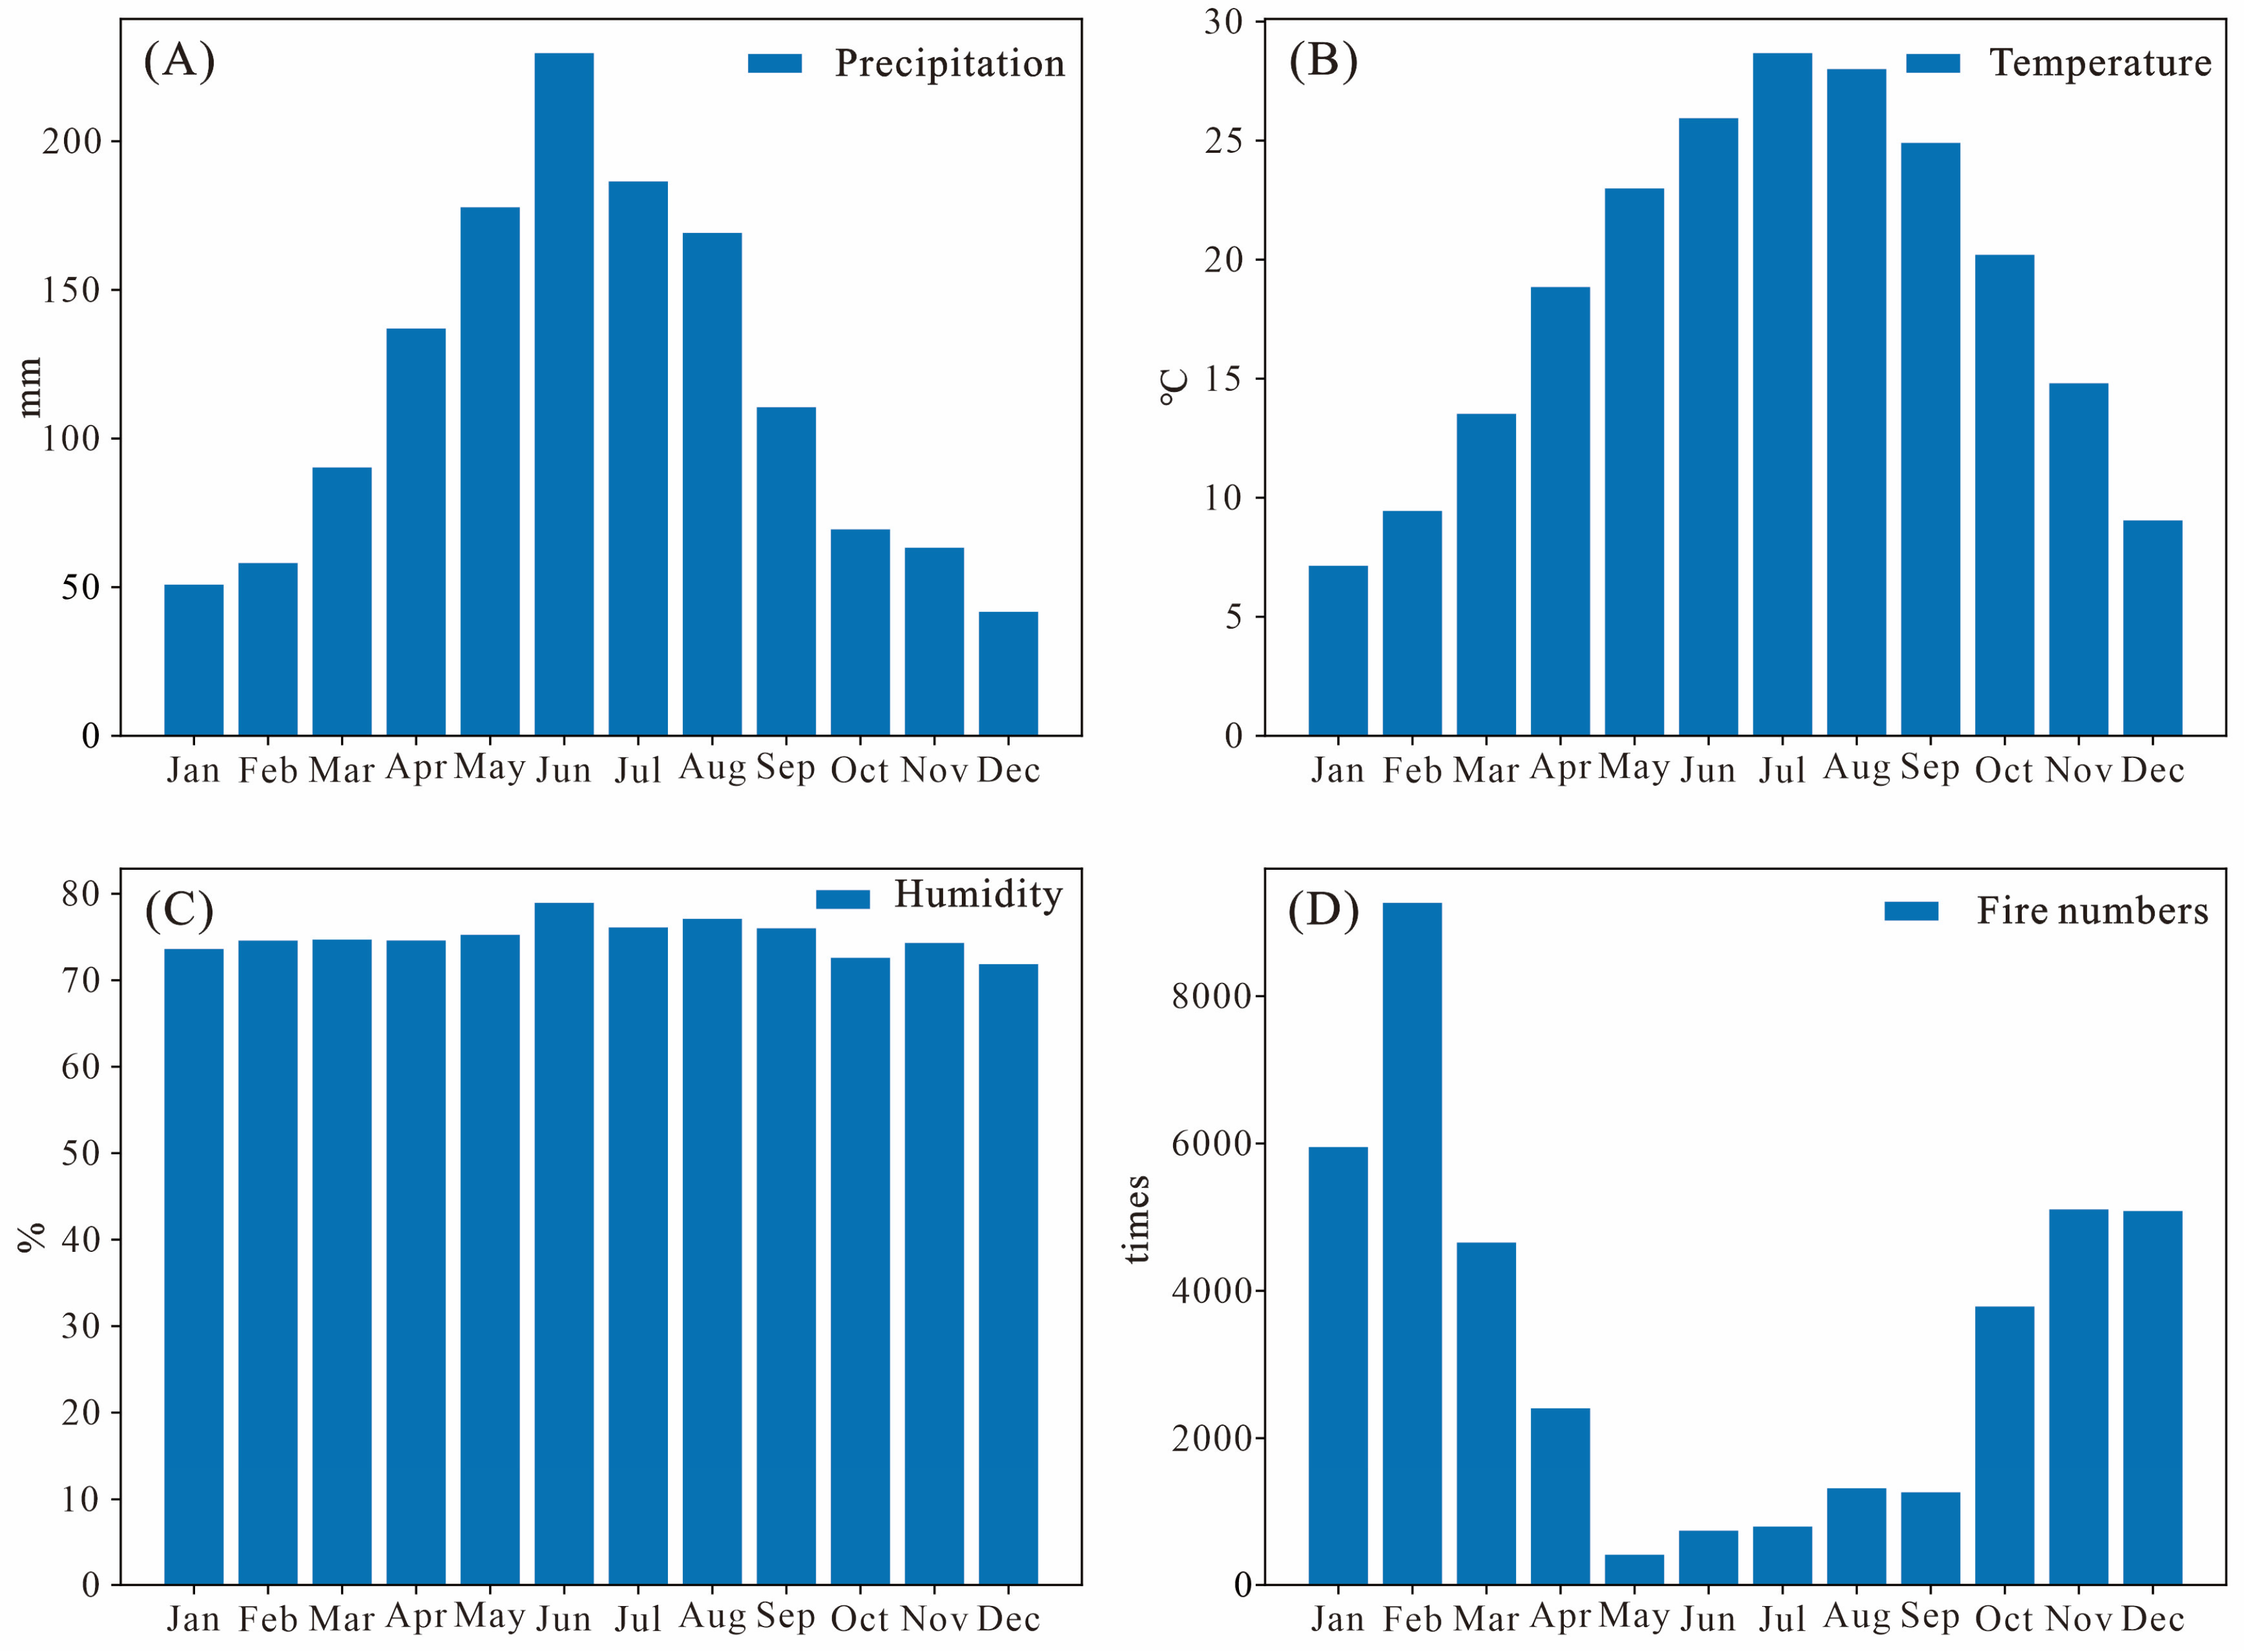
Figure 12.
Correlation between forest fires and freezing precipitation in each province, 2001–2019. The horizontal axis represents the forest-damaged areas caused by fires in each county during the period 2001–2019; the vertical axis represents the amount of freezing precipitation for the forest-covered area in each county during the same period.
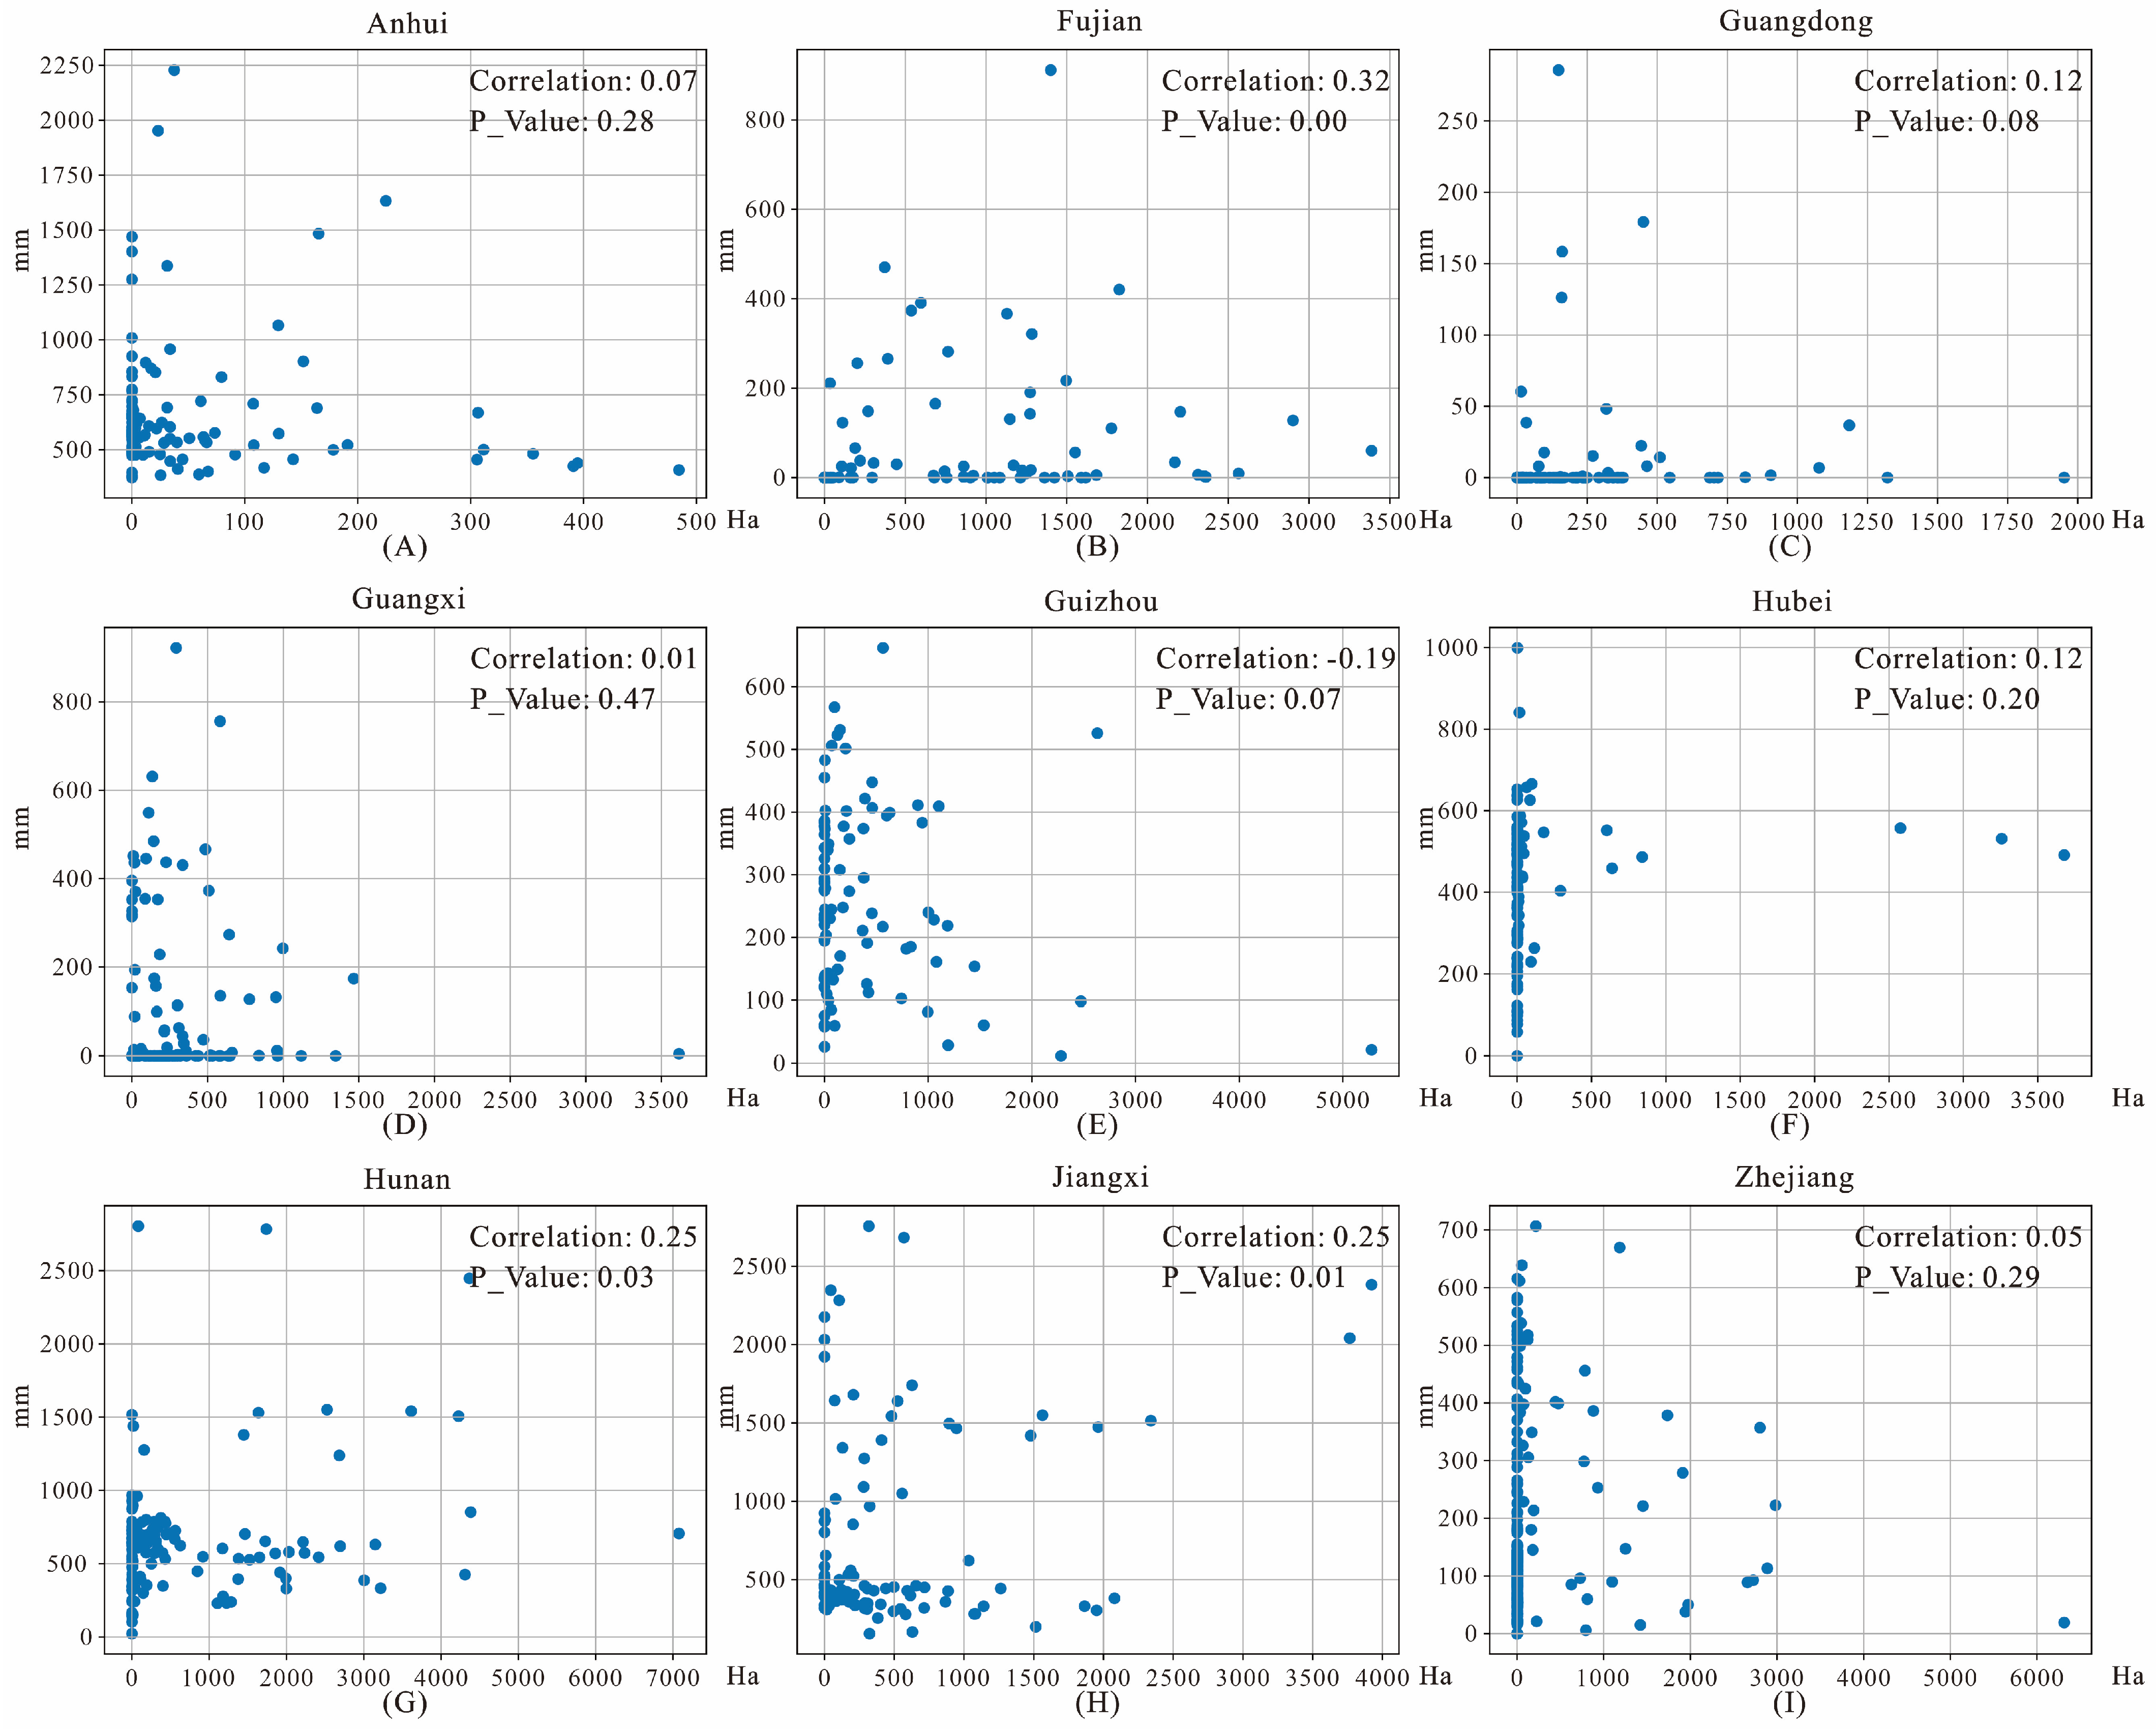
Figure 13.
Correlation between forest fires and freezing precipitation on a month scale for Hunan and Jiangxi provinces, 2001–2019. The horizontal axis represents the forest-damaged areas caused by fires for each county in every year during the period 2001–2019; the vertical axis represents the amount of freezing precipitation for the forest-covered area for each county in every year during the same period.
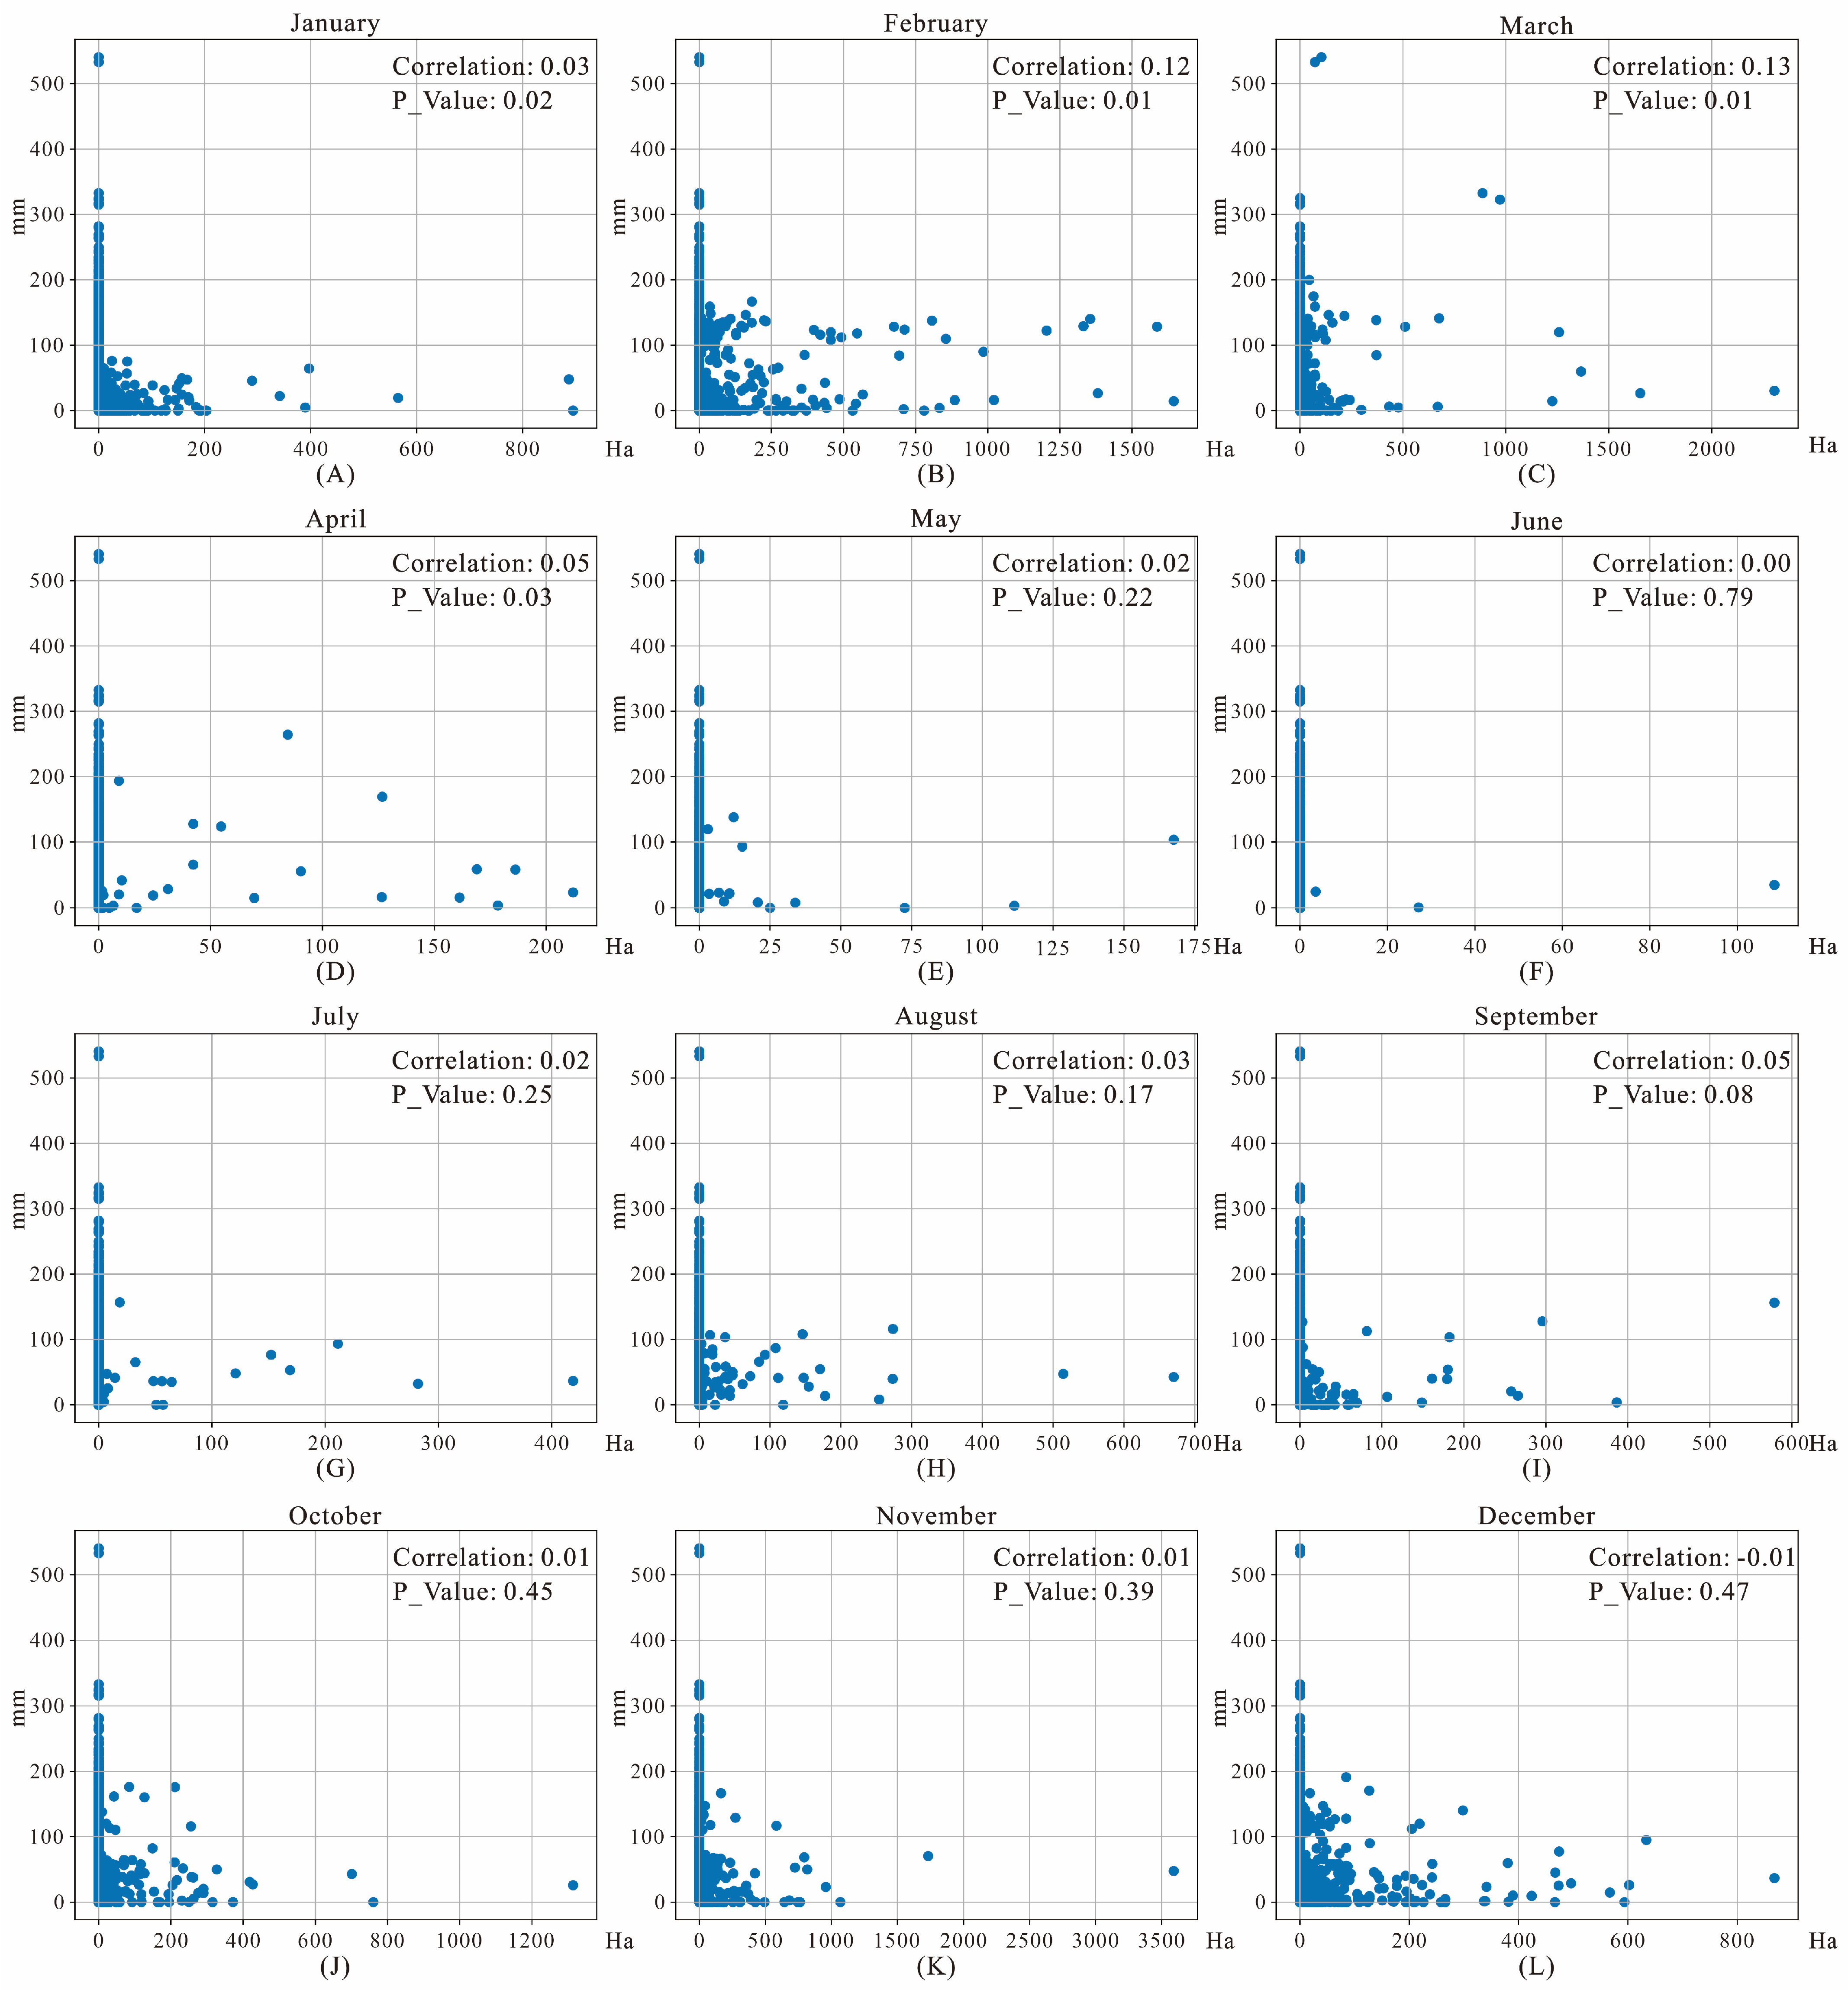
Table 1.
Detailed information of research data.
| Dataset | Time Scale | Spatio-Temporal Resolution |
|---|---|---|
| MOD13Q1 | 2001–2019 | 250 m/16 d |
| MOD14A2 | 2001–2019 | 1000 m/8 d |
| Meteorological station | 2000–2019 | -- |
| Land cover | 2001–2019 | 30 m |
| DEM | -- | 30 m |
Table 2.
Numerical judgment of the effectiveness of vegetation index.
| Bits 0–1: VI Quality | Bits 2–5: VI Usefulness | ||
|---|---|---|---|
| 0: VI produced with good quality | 0: Highest quality | 8: Decreasing quality | 13: Quality so low that it is not useful |
| 1: VI produced, but check other QA | 1: Lower quality | 9: Decreasing quality | 14: L1B data faulty |
| 2: Pixel produced, but most probably cloudy | 2: Decreasing quality | 10: Decreasing quality | 15: Not useful due to any other reason/not processed |
| 3: Pixel not produced due to other reasons than clouds | 4: Decreasing quality | 12: Lowest quality | |
Table 3.
Statistics on the forest-damaged area caused by fire in Hunan and Jiangxi provinces, 2001–2019.
Table 3.
Statistics on the forest-damaged area caused by fire in Hunan and Jiangxi provinces, 2001–2019.
| Year | Hunan | Jiangxi | Year | Hunan | Jiangxi |
|---|---|---|---|---|---|
| 2001 | 1681.25 | 2200.00 | 2011 | 3650.00 | 1456.25 |
| 2002 | 3518.75 | 2056.25 | 2012 | 4693.74 | 431.25 |
| 2003 | 9200.00 | 6468.75 | 2013 | 2862.50 | 775.00 |
| 2004 | 15,925.00 | 12,787.49 | 2014 | 1981.25 | 1637.50 |
| 2005 | 13,012.49 | 4681.25 | 2015 | 306.25 | 356.25 |
| 2006 | 5025.00 | 1106.25 | 2016 | 331.25 | 200.00 |
| 2007 | 8050.00 | 2106.25 | 2017 | 987.50 | 731.25 |
| 2008 | 18,150.00 | 7431.25 | 2018 | 675.00 | 506.25 |
| 2009 | 10,193.75 | 3350.00 | 2019 | 887.50 | 518.75 |
| 2010 | 4956.25 | 756.25 |
Table 4.
Statistics on the forest-damaged area caused by fire in subtropical China from 2006–2010.
| Province | 2006 | 2007 | 2008 | 2009 | 2010 |
|---|---|---|---|---|---|
| Anhui | 187.50 | 287.50 | 625.00 | 318.75 | 406.25 |
| Fujian | 1325.00 | 2137.50 | 8012.50 | 11,050.00 | 1468.75 |
| Guangdong | 1137.50 | 1181.25 | 1575.00 | 1331.25 | 331.25 |
| Guangxi | 1400.00 | 2337.50 | 1543.75 | 1212.50 | 1675.00 |
| Guizhou | 1887.50 | 1850.00 | 4600.00 | 3768.75 | 9237.50 |
| Hubei | 981.25 | 1181.25 | 1681.25 | 506.25 | 606.25 |
| Hunan | 5025.00 | 8050.00 | 18,150.00 | 10,193.75 | 4956.25 |
| Jiangxi | 1106.25 | 2106.25 | 7431.25 | 3350.00 | 756.25 |
| Zhejiang | 2118.76 | 1612.50 | 4237.50 | 1618.75 | 381.25 |
Disclaimer/Publisher’s Note: The statements, opinions and data contained in all publications are solely those of the individual author(s) and contributor(s) and not of MDPI and/or the editor(s). MDPI and/or the editor(s) disclaim responsibility for any injury to people or property resulting from any ideas, methods, instructions or products referred to in the content. |
© 2023 by the authors. Licensee MDPI, Basel, Switzerland. This article is an open access article distributed under the terms and conditions of the Creative Commons Attribution (CC BY) license (https://creativecommons.org/licenses/by/4.0/).
Share and Cite
MDPI and ACS Style
Wang, X.; Gao, X.; Wu, Y.; Jiang, H.; Wang, P. Spatio-Temporal Characteristics of Ice–Snow Freezing and Its Impact on Subtropical Forest Fires in China. Remote Sens. 2023, 15, 5118. https://doi.org/10.3390/rs15215118
AMA Style
Wang X, Gao X, Wu Y, Jiang H, Wang P. Spatio-Temporal Characteristics of Ice–Snow Freezing and Its Impact on Subtropical Forest Fires in China. Remote Sensing. 2023; 15(21):5118. https://doi.org/10.3390/rs15215118
Chicago/Turabian StyleWang, Xuecheng, Xing Gao, Yuming Wu, Hou Jiang, and Peng Wang. 2023. "Spatio-Temporal Characteristics of Ice–Snow Freezing and Its Impact on Subtropical Forest Fires in China" Remote Sensing 15, no. 21: 5118. https://doi.org/10.3390/rs15215118
Note that from the first issue of 2016, this journal uses article numbers instead of page numbers. See further details here.