Article

IPCONV: Convolution with Multiple Different Kernels for Point Cloud Semantic Segmentation

1
School of Geosciences and Info-Physics, Central South University, Changsha 410075, China
2
National Engineering Research Center of High-Speed Railway Construction Technology, Changsha 410075, China
*
Author to whom correspondence should be addressed.
Remote Sens. 2023, 15(21), 5136; https://doi.org/10.3390/rs15215136
Submission received: 4 September 2023 / Revised: 19 October 2023 / Accepted: 23 October 2023 / Published: 27 October 2023

Abstract

:
The segmentation of airborne laser scanning (ALS) point clouds remains a challenge in remote sensing and photogrammetry. Deep learning methods, such as KPCONV, have proven effective on various datasets. However, the rigid convolutional kernel strategy of KPCONV limits its potential use for 3D object segmentation due to its uniform approach. To address this issue, we propose an Integrated Point Convolution (IPCONV) based on KPCONV, which utilizes two different convolution kernel point generation strategies, one cylindrical and one a spherical cone, for more efficient learning of point cloud data features. We propose a customizable Multi-Shape Neighborhood System (MSNS) to balance the relationship between these convolution kernel point generations. Experiments on the ISPRS benchmark dataset, LASDU dataset, and DFC2019 dataset demonstrate the validity of our method.

1. Introduction

Point clouds provide precise 3D geometric information. They are used in digital twin cities [1,2], railways [3], cultural heritage [4], power line extraction and reconstruction [5], and autonomous driving [6]. However, they lack semantic information, hindering machine comprehension and usage. High-precision semantic segmentation is necessary for many applications.
Supervised machine learning methods like SVM [7] and Random Forest [8] are often used in early point cloud segmentation research and rely on hand-crafted features to extract low-dimensional data. However, with the increase in GPU computing power, deep learning methods have become more common in recent years for processing point cloud data and tackling complex semantic segmentation tasks [9].
Convolution is an important branch in the field of 3D deep learning, known for its advantages of weight sharing and local perception [10]. The deep learning method KPCONV [11] extends convolution to 3D point cloud processing, achieving competitive results. It uses convolution kernel points with fixed spatial generation, calculates the weight matrix through the kernel function, and performs calculations with points in the spherical neighborhood. KPCONV bypasses the problem of direct, high-complexity regular grid convolution by obtaining points in the spherical neighborhood through Poisson disks or random points to reduce operational complexity.
However, recognizing objects in 3D scenes can be challenging due to their complexity. For instance, buildings often have multiple sides and facades, while streets look flat. Additionally, trees have a tall vertical structure and a large crown. The rigid convolutional kernel point strategy of KPCONV inhibits its potential to recognize buildings, trees, and other objects from point clouds. For example, when dealing with large-scale airborne laser scanning (ALS) data, planar structures with multiple sides and facades are often present in the point cloud data of buildings, roads, and other similar categories, while structures with one side larger than the others, such as a spherical cone, are typically found in vegetation data. The convolution kernel used by KPCONV employs a system composed of attraction and repulsion and indiscriminately considers the characteristics of local neighborhood points. Pursuing more detailed semantic segmentation effects may slightly constrain the network effect due to this characteristic.
Based on the larger variance of ALS point cloud coordinates in the XY plane than along the Z-axis, LGENet [12] created a hybrid 2D and 3D convolutional module using the original KPCONV convolution. Similar to the principle of LGENet, with a better disparity in its 3D structure, the cylindrical convolutional kernel generation solves the inconsistency between the XY and Z planes often found in buildings and roads. Furthermore, the dataset often contains vegetation, and those features can be further explored. The spherical cone convolution kernel generation is designed to improve the recognition accuracy of trees and shrubs.
Optimizing the effectiveness of a network involves judiciously leveraging the diverse capabilities of convolutional kernels, a facet that often remains untapped when employing only a single kernel per downsampling layer. Drawing inspiration from the domain of image analysis, where many convolution kernels prove invaluable for robust feature extraction, we recognize the potential of a richer kernel ensemble. Building upon the conceptual foundation of KPCONV, we introduce a novel and streamlined architecture called Integrated Point Convolution (IPCONV), fusing multiple computational elements to enhance network performance.
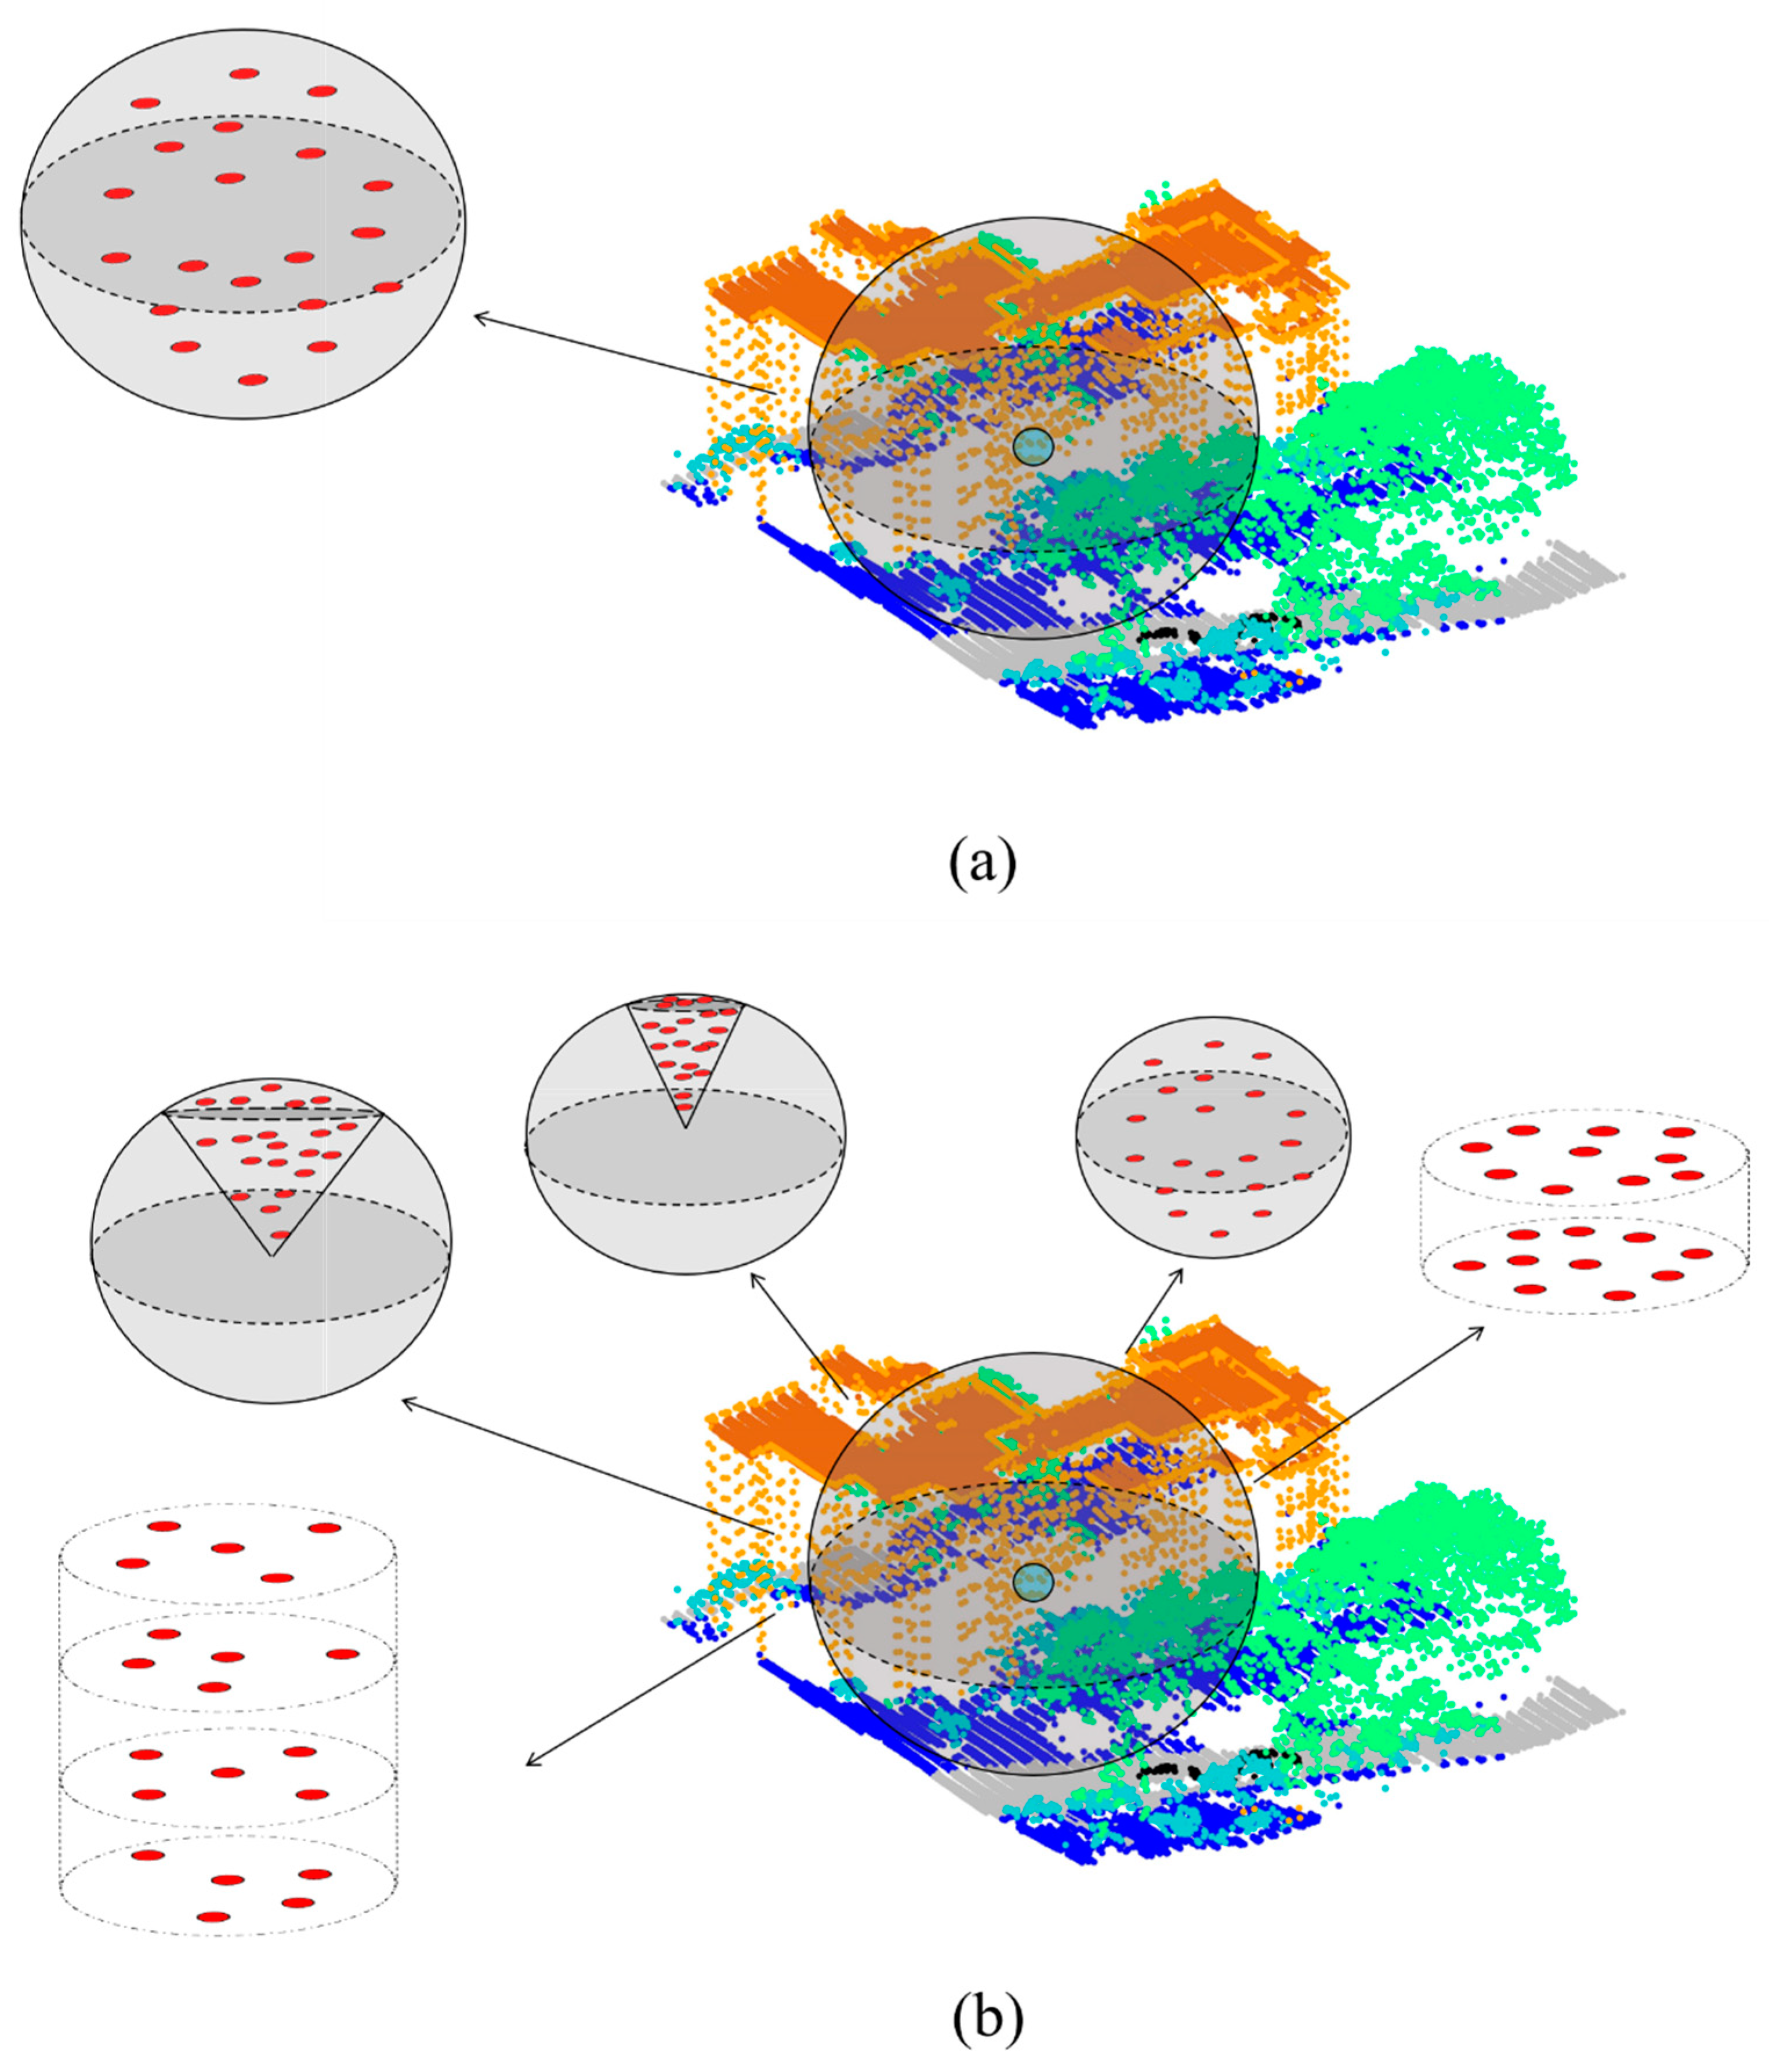
We introduce the Multi-Shape Neighborhood System (MSNS) during the downsampling phase. This sophisticated construct synergizes the insights derived from two distinct convolution kernel types: cylindrical and spherical cone kernels. The resultant hybrid kernel framework is illustrated in Figure 1, juxtaposing the novel IPCONV with the traditional KPCONV, wherein IPCONV replaces the conventional single-layer spherical convolution kernels with an array of different convolution kernels. The significant contributions of this work are as follows:
(1)
Innovative Kernel Generation Methodology: Our study pioneers the development of two distinct methodologies for generating cylindrical convolution kernel points and spherical cone kernel points. Our proposed network optimally captures idiosyncrasies in ground object characteristics by meticulously tuning these parameters, enhancing feature learning.
(2)
Enhanced Local Category Differentiation: Addressing the need for precise discrimination between local categories, we introduce the MSNS. This system effectively concatenates knowledge acquired through diverse convolutional kernel point generation methods, elevating the proficiency of feature learning. This approach enhances the discernment capabilities of the network and augments its grasp on complex local features.
(3)
Benchmark Validation: The efficacy of our proposed model is demonstrated through comprehensive evaluations on multiple 3D benchmark datasets. Comparisons with established baseline methods consistently highlight the progress achieved. Specifically, on the ISPRS Vaihingen 3D dataset [13], our model achieves an impressive Avg.F1 score of 70.7%, with a corresponding overall accuracy (OA) index of 84.5%. Performance on the LASDU dataset [14] further underscores the prowess of our model, with an Avg.F1 score of 75.67% and an OA of 86.66%. On the DFC 2019 dataset [15], our model attains a remarkable Avg.F1 score of 87.9%, and OA score of 97.1%.
In essence, our work, IPCONV, builds upon the KP-FCNN architecture of KPCONV and harnesses the combined potential of various convolutional kernels and kernel generation methodologies. The network significantly enhances feature learning, local categorization, and benchmark performance. This study thereby contributes substantively to the domain of 3D benchmark dataset analysis and serves as a testament to the efficacy of our proposed IPCONV model.

2. Related Work

There are three main categories for 3D point cloud semantic segmentation using deep learning: projection-based, voxel-based, and point-based networks.

2.1. Projection-Based Networks

Initially, researchers used multi-view methods to classify point clouds. A projection-based method uses a 2D Convolutional Neural Network (CNN). Multi-view CNN (MVCNN) [16] pioneered using virtual cameras to render different 2D views is used to recognize 3D models. However, MAX-POOLING may cause a loss of detail, and multi-resolution filtering is employed to improve performance [17]. MHBN [18] works from the perspective of a patches-to-patches similarity measurement to preserve more details during projection. In addition to 2D CNN, a 2D Fully Convolutional Network (FCN) can accept input images of any size for semantic segmentation. After projecting a point cloud onto a 2D image, FCN networks can segment the image with high accuracy and low inference time [19].
Besides 2D CNN and 2D FCN variants, other works have incorporated concepts from different research fields [20,21]. MVTN [20] uses differentiable rendering to identify optimal viewpoints for 3D shape recognition through regression, while 2D&3DHNet [21] fuses 3D global and 2D local Hough features from CNN to improve classification accuracy.

2.2. Voxel-Based Networks

Voxelization is a pivotal transformation method, converting intricate point cloud data into a structured voxel grid format for subsequent processing through a 3D CNN and related techniques. Of the early adopters, VoxNet [22] utilized voxelization to handle point clouds, yet memory constraints posed a challenge. Consequently, various networks have emerged to enhance its computational efficiency and model efficacy [23,24,25,26,27,28,29]. In the pursuit of optimizing 3D data memory utilization, ingenious data structure algorithms have been harnessed to translate data into a sparse framework. OctNet [24] employs an octree, MVKd-net [25] employs a kd-tree, and EVBS constructs voxels using a binary octree. While conventional voxel representation using Boolean occupancy information falls short in efficiently encapsulating sparsely distributed points, VV-Net [26] introduces an innovative approach. They advocate for radial basis functions (RBF) to calculate a local, continuous representation within each voxel, overcoming the challenge of compactly representing sparsely scattered points.
However, the challenge of identifying small-sized objects escalates with sparse distribution. In the context of outdoor driving scenes, implementing cylindrical partitioning via 3D convolutional neural networks has been instrumental in overcoming sparsity and fluctuations in density [27]. To tackle the intricate task of learning from sparsely distributed points and encapsulating contextual details, SVASeg [28] has harnessed attention mechanisms. D-Net [29] has introduced an innovative density-based voxelization procedure to enhance the situation on a parallel front. This approach entails assigning each voxel a density value that properly characterizes the distribution of points within its designated location.

2.3. Point-Based Networks

While projection-based and voxel-based networks necessitate feature extraction or data transformation to adapt point cloud data into structured formats, point-based networks stand out for their capacity to directly handle irregular point cloud data. These networks possess the unique ability to perform feature extraction and processing directly on individual points. Notably, the introduction of PointNet [30] marked a milestone in this realm by enabling the direct processing of irregular point clouds, sidestepping the need for voxelization or two-dimensional conversion. PointNet retains the crucial permutation invariance of input points. Following the lead of PointNet, subsequent methodologies have emerged [31,32,33,34,35]. Parallel to this, graph convolution-based networks, including DGCNN [36] and other variants [37,38,39,40,41,42], have focused on autonomously assigning weights between points. The landscape also includes attention-based networks [43,44,45,46,47,48,49,50,51], which play a pivotal role in point-based networks by encoding point cloud positions directly or indirectly.
Inspired by the 2D FCN [19], which handles local correlations in densely represented data, 3D PointCNN [52] tackles the weighting of the input features associated with the points and the permutation of the points into a latent and potentially canonical order by employing an X-transformation. A-CNN [53] introduces Annular Convolutional as a solution to the issue of insufficient local information extraction observed in PointNet. This method leverages hand-crafted rings to encode local structures. ConvPoint [54] extends the principles of discrete convolutional neural networks (CNNs) to point cloud processing by replacing discrete kernels with continuous ones. DPC [55] innovates dilated point convolutions to tackle the receptive field constraint, effectively enlarging the receptive field size of point convolutions. Pointconvformer [56] combines point convolution with a transformer, which is a deep learning model architecture [9] that uses self-attention mechanisms to capture dependencies between elements in a sequence of tasks, harnessing the advantages of transformers in conjunction with convolutional methods.

3. Method

In this section, we outline our approach, beginning with two novel convolution kernel point generation strategies and introducing the fundamental principles of convolution in Section 3.1. These strategies encompass cylindrical convolution kernel point generation and spherical cone kernel point generation, aligned with the KPCONV-based convolution rules. Subsequently, Section 3.2 describes the MSNS, while Section 3.3 illustrates the comprehensive network architecture.

3.1. Convolution Kernel Point Generation

We propose a novel approach for distributing convolution kernel points to enhance the efficacy of capturing point cloud features. Departing from the rigid convolution generation operator of the traditional KPCONV, which optimizes kernel point spacing within a designated sphere by applying an attractive potential at the center of the sphere to prevent divergence (as shown in Figure 2a), we propose two supplementary strategies: cylindrical convolution kernel point generation and spherical cone convolution kernel point generation. These methods serve as a valuable augmentation to the original KPCONV, designed to broaden its capabilities.

3.1.1. Cylindrical Convolution Kernel Point Generation

The cylindrical convolution kernel point generation strategy proves highly effective in enhancing the discernment of planar and flat structures featuring multiple height layers, such as buildings, as depicted in Figure 2b. This strategy unfolds in two distinct phases.
Initially, a plane is established parallel to the base of the cylinder. The intersection between this plane and the cylinder creates a circle. By subsequently moving the plane along the cylindrical axis, adhering to a predetermined step, a series of M circles akin to the initial one is generated. The position of each plane, denoted as Z ( i ) , is calculated using Equation (1).
Z ( i ) = Z m i n + ( Z m a x Z m i n ) i / ( M + 1 ) , i = 1 , 2 , , M
where Z m i n and Z m a x represent opposite values, with their absolute magnitudes equating to half the cylindrical height.
In the subsequent phase, a specified number of kernel points is extracted for each derived circle through Equation (2). These kernel points adopt a 2D version of the initial KPCONV, a technique employed to enhance the comprehension of planar entities [12]. The kernel points show a clear tendency to avoid each other, ensuring a level of separation while also possessing an attraction that draws them within a certain radius. The formulation for generating the 2D KPCONV is outlined in Equations (3) and (4).
{ x ˜ j ( x , y , z ) | x ˜ j ( z ) = Z ( i ) , j = 1 , 2 , , G } N i c y c l i n d e r
E 2 D t o t = n < G ( x ˜ n ( x , y ) 2 + G n 1 x ˜ g ( x , y ) x ˜ n ( x , y ) )
{ x ˜ j ( x , y , z ) | x ˜ j ( x ) 2 + x ˜ j ( y ) 2 < r 2 , j = 1 , 2 , , G } N i c y c l i n d e r
where the radius of the cylinder is denoted as r , the number of kernel points x ˜ j ( x , y , z ) per layer is G , N c y c l i n d e r signifies the overall count of kernel points, the kernel points for each layer are represented by N i c y c l i n d e r , and E 2 D t o t represents the combined constraint that encompasses both repulsion and attraction effects.
Finally, akin to KPCONV, the kernel points N i c y c l i n d e r at each layer undergo random rotations around the Z-axis and are subject to random coordinate offsets.

3.1.2. Spherical Cone Convolution Kernel Point Generation

While cylindrical convolution kernel point generation excels in distributing points across height multilayers with plane symmetry, it may fall short in recognizing objects that do not fit this assumption, like trees. Trees often exhibit significant size discrepancies between their canopy and trunk regions, resulting in sparse trunk point representation. To address this, we propose the spherical cone convolution kernel point generation.
Spherical convolutional kernel point generation closely resembles the spherical cone approach. Additionally, the parameters can be adjusted to yield a dual spherical cone or accommodate a versatile complement within the spherical neighborhood, as described earlier. This configuration offers substantial flexibility to suit various scenarios.
Firstly, an initial set of candidate points N i n i t sphericalcone is randomly generated within a sphere.
Secondly, as depicted in Figure 3, a line segment is traced from a point on the surface of the sphere to the center of the sphere, forming an angle of θ with the Z-axis. A spherical cone is formed by rotating this line segment around the Z-axis. This spherical cone can be represented as { x ˜ i ( X , Y , Z ) | i < S } N i n i t sphericalcone , as indicated below:
{ x ˜ i ( Z ) x ˜ i ( X ) 2 + x ˜ i ( Y ) 2 > t a n ( π / 2 θ ) |   i = 1 , 2 , , S }  
where θ signifies the threshold angle between a point and the Z -axis, S stands for the kernel points located within the spherical cone, and x ˜ i ( X , Y , Z ) denotes the positions of kernel points.
Furthermore, Equation (5) incorporates a range of parameters that have been strategically devised to enhance the versatility of the convolution process. These parameters offer multiple configurations, such as concatenating them to derive dual-volume kernel points in the “both-side” mode and modifying the direction of the inequality to generate reverse points in the “complementary” mode. This adaptability allows the convolution process to cater to diverse scenarios and requirements.
Lastly, the resulting convolution kernel points x ˜ j are randomly selected to fulfill the specified count as the definitive kernel points. Analogous to KPCONV, these kernel points undergo random 3D rotations and are subject to random coordinate offsets to complete the process.
The point cloud generation process associated with spherical cone convolution yields denser results than cylindrical forms, closely mirroring the morphology of the tree. This convolutional kernel point generation relies on the concept of a sphere neighborhood. As illustrated in Figure 3, its base mode is instrumental in capturing tree features. This nuanced convolutional kernel point generation is anticipated to unlock additional layers of point cloud feature information.

3.1.3. Convolution Rules Based on KPCONV

After kernel point generation, the convolution process is the same as for KPCONV. The convolution procedure C o n v ( p , P , F , N ) for a given point p can be delineated as follows:
C o n v ( p , P , F , N ) = i = 1 P N u m { j = 1 N [ h ( p i p , x j ˜ ) W j ] f i }
here, N signifies the previously acquired convolution kernel points, with their positions denoted as x ˜ . The points within the spherical neighborhood are represented as p i from P R P N u m × 3 , and their point features f i are represented as F R P N u m × D 1 .
The convolution commences by selecting an arbitrary neighboring point p i , then iterating through each kernel point x j ˜ to calculate the positional weight h ( p i p , x j ˜ ) . This involves subtracting the normalized position of the specific point p from the neighboring point p i . Subsequently, the weights for each kernel point are obtained by multiplying the positional weights h ( p i p , x j ˜ ) with the feature weight mapping matrix { W j | j < N } R D i n × D o u t , where the input dimension of the feature mapping matrix is D i n and the output dimension is D o u t , and the weight for neighborhood point p i is obtained by summing the weights of each kernel point. The outcome of multiplying the weight obtained from p i with the corresponding feature f i serves as the convolution feature of the neighboring point p i . The convolutional features of all neighboring points for a particular point p are aggregated to derive the final convolutional feature, which becomes the output feature for that specific point.
IPCONV builds upon the KP-FCNN framework and employs cylindrical convolution kernel point generation and spherical cone convolution kernel point generation for generating kernel points. These kernel points, utilizing geometric relationships between kernel points and the neighboring point p i through Equation (6) of the convolution rules, impact the efficacy of the feature learning process for each particular point p.

3.2. Multi-Shape Neighborhood System

After the preceding convolution process, we employ a singular convolution operator for downsampling to learn neighborhood points. Building upon these convolution kernels, we focus on refining convolutional intricacies by creating a highly adaptable MSNS. Our aim with the MSNS is to augment the features of the convolution kernels, mitigating the potential imbalance inherent in employing a solitary convolution kernel for a given category. To achieve this, we incorporate diverse convolutional kernel point generation methods for each layer, including cylindrical convolution and spherical cone point generation. The accumulated knowledge from these distinct convolution patterns results in F c y c l i n d e r and F sphericalcone representing the acquired features. Subsequently, the MSNS process involves dimensionality reduction and feature concatenation. Illustrated in Figure 4, our proposed MSNS integrates multiple convolutional kernels of varying types, fostering enriched feature learning.
Before feeding the network with data, the MSNS initially applies a batch normalization and ReLU layer to the original features D i n .
Next, features are learned through the generated cylindrical and spherical convolutional kernels, designated as { F i c y c l i n d e r | i = 1 , 2 , , N c y c l i n d e r } and { F i sphericalcone | i = 1 , 2 , , N sphericalcone } ,   respectively . These features are concatenated to yield F c o n c a t d i y , expressed as:
F c o n c a t d i y = F i c y c l i n d e r   F 2 c y c l i n d e r   F 3 c y c l i n d e r   F 4 c y c l i n d e r   F 1 S p h e r i c a l c o n e   F 2 S p h e r i c a l c o n e
F c o n c a t d i y is normalized, resulting in a dimensionality reduction denoted as D o u t . Concurrently, the processed total network features D o u t are integrated with the input network features. This integration entails combining the input network features with the processed total network features D o u t to establish short-circuit connections, thereby finalizing the module.

3.3. Network Architecture

The fundamental network structure utilized in this study is KP-FCNN, wherein the conventional KPCONV module is substituted with the MSNS. Figure 5 provides a visual depiction, highlighting that IPCONV predominantly enriches the feature learning process during downsampling. The network framework is an amalgamation of distinct elements, encompassing upsampling paired with feature concatenation, 1D convolution, skip link, the MSNS module, and the Strided Multi-Shape Neighborhood System module (Strided MSNS).
The encoder consists of 5 convolutional layers. IPCONV uses the MSNS module and the Strided MSNS module for all convolutional blocks for each layer. The MSNS module keeps both the input and output feature dimensions and points the same. The Strided MSNS can be likened to image stride convolution grounded in KPCONV, where the output feature dimension D o u t is twice as large as the input dimension D i n , and the output number of points S o u t is fewer than the input point count S i n .
In the decoder, nearest neighbor upsampling is used to obtain the final point-by-point features. There are four skip links that pass intermediate features from the encoder to the decoder. These features are concatenated using the upsampled features and point-by-point features, then passed through a 1D convolution block.

4. Experiments

4.1. Dataset

We conducted experiments on the ISPRS Vaihingen 3D Semantic Labeling benchmark dataset. This dataset encompasses an ALS point cloud collected using the Leica ALS50 system from an altitude of 500 m over Vaihingen, Germany, in August 2008. The dataset comprises nine categories: powerline, low vegetation, impervious surfaces, car, fence/hedge, roof, facade, shrub, and tree. Each point is characterized by five features: X, Y, Z, intensity, and return number. The dataset includes training and test sets, containing 53,876 points and 411,722 points, respectively. Refer to Figure 6 for an illustration.
In order to ascertain the applicability of the method on diverse datasets, we employ the LASDU dataset [14] to further validate our experimental results. This dataset originates from an ALS point cloud collection using the Leica ALS70 system at approximately 1200 m over the Heihe River Basin in Northwest China, in 2012. The dataset is categorized into five classes: buildings, trees, low vegetation, artifacts, and unclassified points. The dataset comprises around 3.12 million labeled points. As depicted in Figure 7, the labeled point cloud of the survey area is partitioned into four sections, containing approximately 770,000, 590,000, 1.13 million, and 620,000 points, respectively. Specifically, Section 2 and Section 3 serve as the training set, while Section 1 and Section 4 function as the test set.
Furthermore, we extend our exploration to the IEEE Geoscience and Remote Sensing Society (GRSS) Data Fusion Contest in 2019 (DFC2019) [20]. The DFC data include XYZ data, intensity, and echo number. The study areas cover Jacksonville, Florida, and Omaha, Nebraska, in the United States. The dataset encompasses five point cloud tag categories: ground, high vegetation, building, water, and bridge deck. We follow the evaluation method proposed by Wen [57], utilizing 100 tiles for training and 10 for testing.

4.2. Evaluation Metrics

We employ two metrics, namely Overall Accuracy (OA) and mean F1 score, to assess the effectiveness of the proposed method. Specifically, OA represents the correctness of point cloud segmentations in the test dataset, and the F1 score is the harmonic mean of Precision and Recall for each category, mathematically defined as:
O A = ( T P + T N ) / ( T P + T N + F P + F N )
P r e c i s i o n = T P / ( T P + F P )
R e c a l l = T P / ( T P + F N )
F 1   S c o r e = 2 × ( P r e c i s i o n × R e c a l l ) / ( P r e c i s i o n + R e c a l l )
here T P signifies true positives, T N is the true negatives, F P represents false positives, and F N denotes false negatives.

4.3. Model Hyperparameters

For the ISPRS benchmark dataset, the hyperparameters of the experiment are set as follows: a batch size of 2, an input sphere radius of 12.0 m. Grid sampling is a sampling method involves assigning points to their respective regular voxel grid, we set the first grid sampling parameter G 0 as 0.2 m. Then, their grid sampling parameters G i for the other 4 convolutional layers are defined as { G i = G i 1 2 | i = 2 , 3 , 4 , 5 } . The convolution radius is 2.5 times the grid size in the corresponding layer. The aggregation function of “sum” is employed, which signifies the aggregation of features by adding them together. No additional preprocessing is necessary for training. The original KPCONV employed 12–15 kernels, whereas we expanded the number to 20 to enhance geometric feature perception. In Figure 8, the point surface density of the three datasets is shown, indicating the variations in surface density among the different point cloud datasets. These chosen parameters can effectively handle the diverse point densities and are used in all experiments.
Regarding the number of MSNS cores, considering memory consumption, a cautious recommendation of 4–8 is proposed. For the ISPRS benchmark dataset, four cylindrical convolution kernels and two spherical cone convolution kernels are utilized within the MSNS, as detailed in Table 1 and Table 2. This configuration enables practical feature processing. These MSNS parameters are applied across the ISPRS benchmark, LASDU, and DFC 2019 datasets in this study. Note that all experiments are conducted on the same machine with an Intel [email protected] CPU with 32GB RAM and a GPU card with 16GB memory, using the Python programming language.

5. Results

5.1. Semantic Segmentation Results for the ISPRS Benchmark Dataset

The error plot depicting the ISPRS prediction data is shown in Figure 9, affirming the commendable performance of IPCONV on this dataset. Figure 10 provides a comprehensive view of the overall semantic segmentation outcomes for the entire dataset and localized portions. Notably, satisfactory results for the roof and facade categories are attained, facilitated by the targeted cylindrical convolution kernel point generation strategy. The tree category receives notable benefits from the spherical cone convolution kernel point generation design. The synergistic integration of these strategies culminates in favorable outcomes across the entire dataset.
Figure 11 provides a comparison with the baseline methods. The first and second rows highlight the superior differentiation of IPCONV between building and roof categories, attributed to the cylindrical convolutional kernel point strategy. This strategy leverages layered cylindrical convolutional kernel points with distinct height differences for improved discrimination. In the third row, the efficacy of the spherical cone convolutional kernel point strategy is evident, enhancing tree feature recognition, especially in cases of shrub–tree confusion. The combined performances underscore the effectiveness of IPCONV and demonstrate the potential of the MSNS-generated convolutional kernel strategy for feature-specific recognition, particularly in mapping contexts.
Table 3 offers a comparison of the performance of our model with state-of-the-art ISPRS benchmark models, including LUH [58], WhuY4 [59], RIT_1 [60], alsNet [61], A-XCRF [62], D-FCN [57], LGENet [12], RFFS-Net [63], and KPCONV [12].
Among these, LGENet incorporates SegECC, an attention strategy, and a hybrid 2D3D convolution strategy into the KPCONV framework. Our method performs comparably to LGENet in terms of OA, slightly trailing WhuY4 with an OA of 84.5%. Our approach offers a more straightforward architecture, achieving a comparable OA performance to LGENet. However, the current mF1 metric performance of our network is lower than that of LGENet and RFFS-Net. This discrepancy can be attributed to our selective use of the MSNS, which focuses more on specific categories like roofs and trees, potentially neglecting others like power and shrub.
Our approach shows superior results when comparing our method to the benchmark KPCONV, with an improvement in OA by 2.8% compared to KPCONV. Its performance in identifying objects in categories such as power, shrub, and vehicles is relatively inferior due to the focus of IPCONV on categories like buildings and trees. The high similarity in height between shrubs and low vegetation may have caused confusion, and the explanation for misclassification of vehicles is that they are typically slightly higher than the street level in aerial data, which can cause misclassification. Sparse points in the point cloud data for power lines may be missed by the network. However, apart from these categories, the proposed method has significantly improved the accuracy of tree, roof, and other categories, as well as the overall accuracy of the dataset.

5.2. Semantic Segmentation Results on the LASDU Dataset

Comparing the performance of IPCONV with various networks such as PointNet++ [31], PointCNN [52], DensePoint [64], DGCNN [36], PosPool [65], HDA-PointNet++ [66], PointConv [67], VD-LAB [68], RFFS-Net [63], and KPCONV [12], as detailed in Table 4, reveals that the results in this study lag slightly behind VD-LAB and RFFS-Net. Nonetheless, notable achievements are recorded in specific categories, such as buildings and artifacts. This success underscores the effective role played by the distinct convolution kernel point generation strategies—cylindrical and spherical cone—along with the parallelization strategy.
Compared with the KPCONV benchmark experiments, the performance of IPCONV on the LASDU dataset is improved, elevating the OA to 86.66% (a 2.95% enhancement) and mF1 to 75.67% (a 4.2% improvement). Figure 12 visually illustrates the precision of IPCONV in the semantic segmentation results for the LASDU dataset, particularly in the previously mentioned categories of buildings and artifacts.

5.3. Semantic Segmentation Results on the DFC Dataset

Table 5 presents a comparison of test results, including PointNet++ [31], PointSIFT [32], PointCNN [52], D-FCN [57], DANCE-NET [69], PointConv [67], RFFS-Net [63], and KPCONV [12]. These results highlight the performance of the approach presented in this paper, achieving a leading OA of 97.1% and a mF1 of 87.9%. Notably, the mF1 score is slightly lower than that of RFFS-Net. Additionally, the benchmark experiment results are provided, showing that our OA surpasses KPCONV by 2.6% and mF1 by 5.5%, showcasing the effectiveness of our strategy across all benchmark network categories. Figure 13 visually underscores the enhanced ability of IPCONV to differentiate features like buildings, bridges, and water, compared to baseline (KPCONV) results.

6. Ablation Study

In this section, we discuss the impact of different convolutional kernel point generation methods and the MSNS on the ISPRS benchmark dataset.

6.1. Effect of Difference Convolution Kernel Point Generation

This section evaluates the impact of difference convolution kernel point generation methods when implemented individually within the same type. Table 6 presents the results, demonstrating the efficacy of single cylindrical convolution generation and single spherical cone convolution kernel point generation over the baseline network.
For single cylindrical convolution generation, an Avg.F1 of 69.5% and an OA of 83.8% are achieved. Similarly, for single spherical cone convolution kernel point generation, the Avg.F1 is 69.4%, and the OA is 83.9%, both showing improvements.
Compared to the benchmark KPCONV, single cylindrical convolution generation focuses on enhancing the accuracy of the facade, impervious surfaces, and low vegetation categories, with F1 scores improved by 1.8%, 3.6%, and 3.5%, respectively. However, accuracy for the fence/hedge category decreases by 9.0%, possibly due to the insensitivity of the network to short, linear geometries like fences/hedges. Slight decreases in the accuracy of the tree, power, and car categories are attributed to the multilayer generation of kernel points in cylindrical convolutional generation struggling to learn narrow or low features in height space layers during feature recognition.
For single spherical cone convolution kernel generation, the F1 scores for low vegetation, fence/hedge, shrub, and tree improve by 2.7% compared to the benchmark network KPCONV. Notably, the strategy improves vegetation features while maintaining overall category accuracy. However, recognition accuracy for power decreases by 21.1%, likely due to the scarcity of power line categories leading to more misclassifications.
This study highlights the strengths of spherical cone convolution kernel generation for tree features and cylindrical convolution kernel generation for features extending along the XY plane, showcasing promising results.

6.2. Effect of the MSNS

An examination of the impact of the MSNS is presented in Table 7, where the baseline for the ablation study is KPCONV. Various combinations of the original rigid convolution kernels are designed to showcase the effectiveness of the parallel algorithm in contrast to the vanilla version consisting of six rigid KPCONV convolution kernels.
Experimental results reveal that the accuracy has been moderately improved, reaching 83.9%. However, the extent of the improvement is limited, suggesting that the undifferentiated spherical convolutional kernel point generation approach encounters constraints in processing our point cloud data. Notably, its recognition accuracy for the “power” category is higher, achieving a 67.5% in F1 score. Nonetheless, the OA performance in other feature categories remains average. Nevertheless, the OA still demonstrates an enhancement of approximately 2.2% compared to a single cylindrical convolutional generation.
Meanwhile, an investigation was conducted by incorporating multiple instances of cylindrical convolution kernel point generations to analyze their impact on the results. As the cylindrical convolution kernel point generation is designed to specifically address building features, and given that the majority of categories in the ISPRS benchmark dataset pertain to buildings, commendable outcomes were achieved. With an Avg.F1 reaching 69.8% and an OA reaching 84.3%, it demonstrates promising performance, particularly on the roof, facade, and shrub categories. Nonetheless, it fell slightly short of the performance achieved by a single spherical cone convolution.
The parallel spherical cone convolution kernel point generation attained an OA result of 84.3%. However, we noted a slight decline in Avg.F1, indicating that it slightly underperforms compared to parallel cylindrical convolution kernel point generation in terms of overall accuracy. However, it achieved an impressive 82.9% classification accuracy on tree features, while the results for low vegetation and shrub categories were less effective than anticipated.
Ultimately, by considering various combinations of cylindrical convolution kernel point generations and spherical cone convolution kernel point generations, specifically focusing on building and tree categories, the optimal combination was selected from these permutations to achieve the current noteworthy semantic segmentation outcomes.

7. Conclusions

We have introduced IPCONV, a straightforward yet highly effective deep learning network tailored for semantic segmentation tasks on point cloud data, particularly in urban settings. Our proposed IPCONV demonstrates a superior performance compared to the KPCONV baseline, showcasing its enhanced capabilities in processing urban datasets. One of the key innovations is the integration of the MSNS, which empowers each convolution layer to incorporate a variety of convolution kernels through customizable configurations. This flexibility allows us to tailor the kernel combination according to specific feature recognition needs, such as using cylindrical convolution kernel point generation for architectural categories and spherical cone convolution kernel point generation for tree categories. The simplicity and straightforwardness of the MSNS parameters facilitate easy integration and experimentation.
The advantages of IPCONV are comprehensively validated through ablation experiments conducted on the ISPRS benchmark dataset. IPCONV showcases an improved OA and an average F1 score of 70.7% over the KPCONV baseline. Furthermore, compared to the LGENet strategy, which is also an enhancement based on KPCONV, IPCONV achieves a similar performance while offering a simpler approach, with an OA index of around 84.5%. Additionally, the efficacy of IPCONV is further demonstrated through evaluations of the LASDU and DFC 2019 datasets.
In the future, we hope to design a more practical network framework for point cloud semantic segmentation tasks. At the same time, we also need to consider the effectiveness of the model for large-scale point cloud datasets to improve network performance. We attempt a feature screening strategy to accomplish feature selection and reduce the dependence on unnecessary features.

Author Contributions

Conceptualization, R.Z., S.C. and X.W.; methodology, R.Z. and S.C.; software, R.Z. and X.W.; validation, R.Z., X.W. and S.C.; formal analysis, R.Z. and S.C.; investigation, R.Z. and X.W.; resources, S.C. and Y.Z.; data curation, X.W. and S.C.; writing—original draft preparation, R.Z.; writing—review and editing, Y.Z., S.C., X.W. and R.Z.; visualization, R.Z., S.C. and X.W.; supervision, Y.Z.; project administration, Y.Z.; funding acquisition, Y.Z. All authors have read and agreed to the published version of the manuscript.

Funding

This work was partially supported by the National Natural Science Foundation of China, under Grant 42171440, Major S&T Program of Hunan Province, under the Grant 2020GK1023, and the Science and Technology Research and Development Program Project of China Railway Group Limited (Major Special Project), under the Grant 2021-Special-08.

Data Availability Statement

Data used in this work are available in the different benchmarks described in the paper. We greatly appreciate the official organizations and individual teams for providing these datasets. The ISPRS Vaihingen 3D Dataset [13] can be obtained through the following link: https://www.isprs.org/education/benchmarks/UrbanSemLab/. The DFC Dataset [15] can be downloaded from the link: https://ieee-dataport.org/open-access/data-fusion-contest-2019-dfc2019. Additionally, the LASDU Dataset [14] is available upon request from the corresponding author.

Conflicts of Interest

The authors declare no conflict of interest.

References

  1. Shahat, E.; Hyun, C.T.; Yeom, C. City digital twin potentials: A review and research agenda. Sustainability 2021, 13, 3386. [Google Scholar] [CrossRef]
  2. Sommer, M.; Stjepandić, J.; Stobrawa, S.; Von Soden, M. Automatic generation of digital twin based on scanning and object recognition. In Transdisciplinary Engineering for Complex Socio-Technical Systems; IOS Press: Amsterdam, The Netherlands, 2019; Volume 7, pp. 645–654. [Google Scholar] [CrossRef]
  3. Lamas, D.; Soilán, M.; Grandío, J.; Riveiro, B. Automatic point cloud semantic segmentation of complex railway environments. Remote Sens. 2021, 13, 2332. [Google Scholar] [CrossRef]
  4. Pierdicca, R.; Paolanti, M.; Matrone, F.; Martini, M.; Morbidoni, C.; Malinverni, E.S.; Frontoni, E.; Lingua, A.M. Point cloud semantic segmentation using a deep learning framework for cultural heritage. Remote Sens. 2020, 12, 1005. [Google Scholar] [CrossRef]
  5. Munir, N.; Awrangjeb, M.; Stantic, B. Power Line Extraction and Reconstruction Methods from Laser Scanning Data: A Literature Review. Remote Sens. 2023, 15, 973. [Google Scholar] [CrossRef]
  6. Pulikkaseril, C.; Lam, S. Laser eyes for driverless cars: The road to automotive LIDAR. In Proceedings of the 2019 Optical Fiber Communications Conference and Exhibition (OFC), San Diego, CA, USA, 3–7 March 2019; pp. 1–4. [Google Scholar]
  7. Zhang, J.; Lin, X.; Ning, X. SVM-based classification of segmented airborne LiDAR point clouds in urban areas. Remote Sens. 2013, 5, 3749–3775. [Google Scholar] [CrossRef]
  8. Ni, H.; Lin, X.; Zhang, J. Classification of ALS point cloud with improved point cloud segmentation and random forests. Remote Sens. 2017, 9, 288. [Google Scholar] [CrossRef]
  9. Guo, Y.; Wang, H.; Hu, Q.; Liu, H.; Liu, L.; Bennamoun, M. Deep learning for 3d point clouds: A survey. IEEE Trans. Pattern Anal. Mach. Intell. 2020, 43, 4338. [Google Scholar] [CrossRef]
  10. Bello, S.A.; Yu, S.; Wang, C.; Adam, J.M.; Li, J. Deep learning on 3D point clouds. Remote Sens. 2020, 12, 1729. [Google Scholar] [CrossRef]
  11. Thomas, H.; Qi, C.R.; Deschaud, J.E.; Marcotegui, B.; Goulette, F.; Guibas, L.J. Kpconv: Flexible and deformable convolution for point clouds. In Proceedings of the IEEE/CVF International Conference on Computer Vision, Seoul, Republic of Korea, 27 October–2 November 2019; pp. 6411–6420. [Google Scholar]
  12. Lin, Y.; Vosselman, G.; Cao, Y.; Yang, M.Y. Local and global encoder network for semantic segmentation of Airborne laser scanning point clouds. ISPRS J. Photogramm. Remote Sens. 2021, 176, 151–168. [Google Scholar] [CrossRef]
  13. Rottensteiner, F.; Sohn, G.; Jung, J.; Gerke, M.; Baillard, C.; Benitez, S.; Breitkopf, U. The isprs benchmark on urban object classification and 3d building reconstruction. ISPRS Ann. Photogramm. Remote Sens. Spat. Inf. Sci. 2012, I-3, 293–298. [Google Scholar] [CrossRef]
  14. Ye, Z.; Xu, Y.; Huang, R.; Tong, X.; Li, X.; Liu, X.; Luan, K.; Hoegner, L.; Stilla, U. LASDU: A large-scale aerial lidar dataset for semantic labeling in dense urban areas. ISPRS Int. J. Geo-Inf. 2020, 9, 450. [Google Scholar] [CrossRef]
  15. Bosch, M.; Foster, K.; Christie, G.; Wang, S.; Hager, G.D.; Brown, M. Semantic stereo for incidental satellite images. In Proceedings of the 2019 IEEE Winter Conference on Applications of Computer Vision (WACV), Waikoloa, HI, USA, 7–11 January 2019; pp. 1524–1532. [Google Scholar]
  16. Su, H.; Maji, S.; Kalogerakis, E.; Learned-Miller, E. Multi-view convolutional neural networks for 3d shape recognition. In Proceedings of the IEEE International Conference on Computer Vision, Santiago, Chile, 7–13 December 2015; pp. 945–953. [Google Scholar]
  17. Ma, C.; Guo, Y.; Yang, J.; An, W. Learning Multi-View Representation with LSTM for 3-D Shape Recognition and Retrieval. IEEE Trans. Multimed. 2019, 21, 1169–1182. [Google Scholar] [CrossRef]
  18. Yu, T.; Meng, J.; Yuan, J. Multi-view harmonized bilinear network for 3d object recognition. In Proceedings of the IEEE Conference on Computer Vision and Pattern Recognition, Salt Lake City, UT, USA, 18–23 June 2018; pp. 186–194. [Google Scholar]
  19. Maset, E.; Padova, B.; Fusiello, A. Efficient large-scale airborne LiDAR data classification via fully convolutional network. Int. Arch. Photogramm. Remote Sens. Spat. Inf. Sci. 2020, 43, 527. [Google Scholar] [CrossRef]
  20. Hamdi, A.; Giancola, S.; Ghanem, B. Mvtn: Multi-view transformation network for 3d shape recognition. In Proceedings of the IEEE/CVF International Conference on Computer Vision, Montreal, QC, Canada, 10–17 October 2021; pp. 1–11. [Google Scholar] [CrossRef]
  21. Song, W.; Li, D.; Sun, S.; Zhang, L.; Xin, Y.; Sung, Y.; Choi, R. 2D&3DHNet for 3D object classification in LiDAR point cloud. Remote Sens. 2022, 14, 3146. [Google Scholar] [CrossRef]
  22. Qi, C.R.; Su, H.; Nießner, M.; Dai, A.; Yan, M.; Guibas, L.J. Volumetric and multi-view cnns for object classification on 3d data. In Proceedings of the IEEE Conference on Computer Vision and Pattern Recognition, Las Vegas, NV, USA, 27–30 June 2016; pp. 5648–5656. [Google Scholar]
  23. Riegler, G.; Osman Ulusoy, A.; Geiger, A. Octnet: Learning deep 3d representations at high resolutions. In Proceedings of the IEEE Conference on Computer Vision and Pattern Recognition, Honolulu, HI, USA, 21–26 July 2017; pp. 3577–3586. [Google Scholar]
  24. Klokov, R.; Lempitsky, V. Escape from cells: Deep kd-networks for the recognition of 3d point cloud models. In Proceedings of the IEEE International Conference on Computer Vision, Honolulu, HI, USA, 21–26 July 2017; pp. 863–872. [Google Scholar]
  25. Huang, M.; Wei, P.; Liu, X. An efficient encoding voxel-based segmentation (EVBS) algorithm based on fast adjacent voxel search for point cloud plane segmentation. Remote Sens. 2019, 11, 2727. [Google Scholar] [CrossRef]
  26. Meng, H.Y.; Gao, L.; Lai, Y.K.; Manocha, D. Vv-net: Voxel vae net with group convolutions for point cloud segmentation. In Proceedings of the IEEE/CVF International Conference on Computer Vision, Seoul, Republic of Korea, 27 October–2 November 2019; pp. 8500–8508. [Google Scholar]
  27. Zhu, X.; Zhou, H.; Wang, T.; Hong, F.; Li, W.; Ma, Y.; Li, H.; Yang, R.; Lin, D. Cylindrical and asymmetrical 3d convolution networks for lidar-based perception. IEEE Trans. Pattern Anal. Mach. Intell. 2021, 44, 6807. [Google Scholar] [CrossRef] [PubMed]
  28. Zhao, L.; Xu, S.; Liu, L.; Ming, D.; Tao, W. SVASeg: Sparse voxel-based attention for 3D LiDAR point cloud semantic segmentation. Remote Sens. 2022, 14, 4471. [Google Scholar] [CrossRef]
  29. Zaboli, M.; Rastiveis, H.; Hosseiny, B.; Shokri, D.; Sarasua, W.A.; Homayouni, S. D-Net: A Density-Based Convolutional Neural Network for Mobile LiDAR Point Clouds Classification in Urban Areas. Remote Sens. 2023, 15, 2317. [Google Scholar] [CrossRef]
  30. Qi, C.R.; Su, H.; Mo, K.; Guibas, L.J. Pointnet: Deep learning on point sets for 3d classification and segmentation. In Proceedings of the IEEE Conference on Computer Vision and Pattern Recognition, Honolulu, HI, USA, 21–26 July 2017; pp. 652–660. [Google Scholar]
  31. Qi, C.R.; Yi, L.; Su, H.; Guibas, L.J. Pointnet++: Deep hierarchical feature learning on point sets in a metric space. Adv. Neural Inf. Process. Syst. 2017, 30, 5105–5114. [Google Scholar] [CrossRef]
  32. Jiang, M.Y.; Wu, Y.R.; Zhao, T.Q.; Zhao, Z.L.; Lu, C.W. Pointsift: A sift-like network module for 3d point cloud semantic segmentation. arXiv 2018, arXiv:1807.00652. [Google Scholar] [CrossRef]
  33. Zhao, H.; Jiang, L.; Fu, C.W.; Jia, J. Pointweb: Enhancing local neighborhood features for point cloud processing. In Proceedings of the IEEE/CVF Conference on Computer Vision and Pattern Recognition, Long Beach, CA, USA, 15–20 June 2019; pp. 5565–5573. [Google Scholar]
  34. Hu, Q.; Yang, B.; Xie, L.; Rosa, S.; Guo, Y.; Wang, Z.; Trigoni, N.; Markham, A. Randla-net: Efficient semantic segmentation of large-scale point clouds. In Proceedings of the IEEE/CVF Conference on Computer Vision and Pattern Recognition, Seattle, WA, USA, 13–19 June 2020; pp. 11108–11117. [Google Scholar]
  35. Yin, F.; Huang, Z.; Chen, T.; Luo, G.; Yu, G.; Fu, B. Dcnet: Large-scale point cloud semantic segmentation with discriminative and efficient feature aggregation. IEEE Trans. Circuits Syst. Video Technol. 2023, 33, 4083–4095. [Google Scholar] [CrossRef]
  36. Wang, Y.; Sun, Y.; Liu, Z.; Sarma, S.E.; Bronstein, M.M.; Solomon, J.M. Dynamic graph cnn for learning on point clouds. ACM Trans. Graph. Tog 2019, 38, 1–12. [Google Scholar] [CrossRef]
  37. Zhang, K.; Hao, M.; Wang, J.; de Silva, C.W.; Fu, C. Linked dynamic graph cnn: Learning on point cloud via linking hierarchical features. arXiv 2019, arXiv:1904.10014. [Google Scholar] [CrossRef]
  38. Xu, Q.; Zhou, Y.; Wang, W.; Qi, C.R.; Anguelov, D. Spg: Unsupervised domain adaptation for 3d object detection via semantic point generation. In Proceedings of the IEEE/CVF International Conference on Computer Vision, Montreal, QC, Canada, 10–17 October 2021; pp. 15446–15456. [Google Scholar]
  39. Zhou, H.; Feng, Y.; Fang, M.; Wei, M.; Qin, J.; Lu, T. Adaptive graph convolution for point cloud analysis. In Proceedings of the IEEE/CVF International Conference on Computer Vision, Montreal, QC, Canada, 10–17 October 2021; pp. 4965–4974. [Google Scholar]
  40. Wang, L.; Huang, Y.; Hou, Y.; Zhang, S.; Shan, J. Graph attention convolution for point cloud semantic segmentation. In Proceedings of the IEEE/CVF Conference on Computer Vision and Pattern Recognition, Long Beach, CA, USA, 15–20 June 2019; pp. 10296–10305. [Google Scholar]
  41. Huang, C.Q.; Jiang, F.; Huang, Q.H.; Wang, X.Z.; Han, Z.M.; Huang, W.Y. Dual-graph attention convolution network for 3-D point cloud classification. IEEE Trans. Neural Netw. Learn. Syst. 2022, 99, 1–13. [Google Scholar] [CrossRef]
  42. Tran, A.T.; Le, H.S.; Kwon, O.J.; Lee, S.H.; Kwon, K.R. General Local Graph Attention in Large-scale Point Cloud Segmentation. In Proceedings of the 2023 IEEE International Conference on Consumer Electronics (ICCE), Las Vegas, NV, USA, 6–8 January 2023; pp. 1–4. [Google Scholar]
  43. Zhao, H.; Jiang, L.; Jia, J.; Torr, P.H.; Koltun, V. Point transformer. In Proceedings of the IEEE/CVF International Conference on Computer Vision, Montreal, QC, Canada, 10–17 October 2021; pp. 16259–16268. [Google Scholar]
  44. Engel, N.; Belagiannis, V.; Dietmayer, K. Point transformer. IEEE Access 2021, 9, 134826–134840. [Google Scholar] [CrossRef]
  45. Guo, M.H.; Cai, J.X.; Liu, Z.N.; Mu, T.J.; Martin, R.R.; Hu, S.M. Pct: Point cloud transformer. Comput. Vis. Media 2021, 7, 187–199. [Google Scholar] [CrossRef]
  46. Yu, X.; Tang, L.; Rao, Y.; Huang, T.; Zhou, J.; Lu, J. Point-bert: Pre-training 3d point cloud transformers with masked point modeling. In Proceedings of the IEEE/CVF Conference on Computer Vision and Pattern Recognition, New Orleans, LA, USA, 18–24 June 2022; pp. 19313–19322. [Google Scholar]
  47. Hui, L.; Yang, H.; Cheng, M.; Xie, J.; Yang, J. Pyramid point cloud transformer for large-scale place recognition. In Proceedings of the IEEE/CVF International Conference on Computer Vision, Montreal, QC, Canada, 10–17 October 2021; pp. 6098–6107. [Google Scholar]
  48. Li, Y.; Lin, Q.; Zhang, Z.; Zhang, L.; Chen, D.; Shuang, F. MFNet: Multi-level feature extraction and fusion network for large-scale point cloud classification. Remote Sens. 2022, 14, 5707. [Google Scholar] [CrossRef]
  49. Lu, D.; Xie, Q.; Gao, K.; Xu, L.; Li, J. 3DCTN: 3D convolution-transformer network for point cloud classification. IEEE Trans. Intell. Transp. Syst. 2022, 23, 24854–24865. [Google Scholar] [CrossRef]
  50. Lai, X.; Liu, J.; Jiang, L.; Wang, L.; Zhao, H.; Liu, S.; Qi, X.; Jia, J. Stratified transformer for 3d point cloud segmentation. In Proceedings of the IEEE/CVF Conference on Computer Vision and Pattern Recognition, New Orleans, LA, USA, 18–24 June 2022; pp. 8500–8509. [Google Scholar]
  51. Yang, Y.Q.; Guo, Y.X.; Xiong, J.Y.; Liu, Y.; Pan, H.; Wang, P.S.; Tong, X.; Guo, B. Swin3D: A Pretrained Transformer Backbone for 3D Indoor Scene Understanding. arXiv 2023, arXiv:2304.06906. [Google Scholar] [CrossRef]
  52. Li, Y.; Bu, R.; Sun, M.; Wu, W.; Di, X.; Chen, B. Pointcnn: Convolution on x-transformed points. Adv. Neural Inf. Process. Syst. 2018, 31, 820–830. [Google Scholar]
  53. Komarichev, A.; Zhong, Z.; Hua, J. A-cnn: Annularly convolutional neural networks on point clouds. In Proceedings of the IEEE/CVF Conference on Computer Vision and Pattern Recognition, Long Beach, CA, USA, 15–20 June 2019; pp. 7421–7430. [Google Scholar]
  54. Boulch, A. ConvPoint: Continuous convolutions for point cloud processing. Comput. Graph. 2020, 88, 24–34. [Google Scholar] [CrossRef]
  55. Engelmann, F.; Kontogianni, T.; Leibe, B. Dilated point convolutions: On the receptive field size of point convolutions on 3d point clouds. In Proceedings of the 2020 IEEE International Conference on Robotics and Automation (ICRA), Paris, France, 31 May–31 August 2020; pp. 9463–9469. [Google Scholar]
  56. Wu, W.; Fuxin, L.; Shan, Q. Pointconvformer: Revenge of the point-based convolution. In Proceedings of the IEEE/CVF Conference on Computer Vision and Pattern Recognition, Vancouver, BC, Canada, 18–22 June 2023; pp. 21802–21813. [Google Scholar]
  57. Wen, C.; Yang, L.; Li, X.; Peng, L.; Chi, T. Directionally constrained fully convolutional neural network for airborne LiDAR point cloud classification. ISPRS J. Photogramm. Remote Sens. 2020, 162, 50–62. [Google Scholar] [CrossRef]
  58. Niemeyer, J.; Rottensteiner, F.; Soergel, U. Contextual classification of lidar data and building object detection in urban areas. ISPRS J. Photogramm. Remote Sens. 2014, 87, 152–165. [Google Scholar] [CrossRef]
  59. Yang, Z.; Tan, B.; Pei, H.; Jiang, W. Segmentation and multi-scale convolutional neural network-based classification of airborne laser scanner data. Sensors 2018, 18, 3347. [Google Scholar] [CrossRef]
  60. Yousefhussien, M.; Kelbe, D.J.; Ientilucci, E.J.; Salvaggio, C. A multi-scale fully convolutional network for semantic labeling of 3D point clouds. ISPRS J. Photogramm. Remote Sens. 2018, 143, 191–204. [Google Scholar] [CrossRef]
  61. Winiwarter, L.; Mandlburger, G.; Schmohl, S.; Pfeifer, N. Classification of ALS point clouds using end-to-end deep learning. PFG–J. Photogramm. Remote Sens. Geoinf. Sci. 2019, 87, 75–90. [Google Scholar] [CrossRef]
  62. Arief, H.A.A.; Indahl, U.G.; Strand, G.H.; Tveite, H. Addressing overfitting on point cloud classification using Atrous XCRF. ISPRS J. Photogramm. Remote Sens. 2019, 155, 90–101. [Google Scholar] [CrossRef]
  63. Mao, Y.; Chen, K.; Diao, W.; Sun, X.; Lu, X.; Fu, K.; Weinmann, M. Beyond single receptive field: A receptive field fusion-and-stratification network for airborne laser scanning point cloud classification. ISPRS J. Photogramm. Remote Sens. 2022, 188, 45–61. [Google Scholar] [CrossRef]
  64. Liu, Y.; Fan, B.; Meng, G.; Lu, J.; Xiang, S.; Pan, C. Densepoint: Learning densely contextual representation for efficient point cloud processing. In Proceedings of the IEEE/CVF International Conference on Computer Vision, Seoul, Republic of Korea, 27 October–2 November 2019; pp. 5239–5248. [Google Scholar]
  65. Liu, Z.; Hu, H.; Cao, Y.; Zhang, Z.; Tong, X. A closer look at local aggregation operators in point cloud analysis. In Proceedings of the Computer Vision–ECCV 2020: 16th European Conference, Glasgow, UK, 23–28 August 2020; pp. 326–342. [Google Scholar]
  66. Huang, R.; Xu, Y.; Hong, D.; Yao, W.; Ghamisi, P.; Stilla, U. Deep point embedding for urban classification using ALS point clouds: A new perspective from local to global. ISPRS J. Photogramm. Remote Sens. 2020, 163, 62–81. [Google Scholar] [CrossRef]
  67. Wu, W.; Qi, Z.; Fuxin, L. Pointconv: Deep convolutional networks on 3d point clouds. In Proceedings of the IEEE/CVF Conference on Computer Vision and Pattern Recognition, Long Beach, CA, USA, 15–20 June 2019; pp. 9621–9630. [Google Scholar]
  68. Li, J.; Weinmann, M.; Sun, X.; Diao, W.; Feng, Y.; Hinz, S.; Fu, K. VD-LAB: A view-decoupled network with local-global aggregation bridge for airborne laser scanning point cloud classification. ISPRS J. Photogramm. Remote Sens. 2022, 186, 19–33. [Google Scholar] [CrossRef]
  69. Li, X.; Wang, L.; Wang, M.; Wen, C.; Fang, Y. DANCE-NET: Density-aware convolution networks with context encoding for airborne LiDAR point cloud classification. ISPRS J. Photogramm. Remote Sens. 2020, 166, 128–139. [Google Scholar] [CrossRef]
Figure 1. Integrated Point Convolution avoids one single physical understanding. (a) KPCONV; (b) IPCONV.
Remotesensing 15 05136 g001
Figure 2. Kernel points generation. (a) KPCONV: convolution kernel points generated with an attractive potential at the sphere’s center to prevent divergence; (b) cylindrical: convolution kernel points distributed cylindrically for enhanced feature capture; (c) spherical cone: convolution kernel points distributed in a spherical cone pattern for improved feature extraction.
Remotesensing 15 05136 g002
Figure 3. Generation of spherical cone kernel points.
Remotesensing 15 05136 g003
Figure 4. The convolution parallelization strategy of IPCONV. N is the sum of cylindrical convolution kernels N c y c l i n d e r and spherical convolution kernels N sphericalcone . Roman numerals such as I, II signify the individual cylindrical convolution kernel or spherical cone convolution kernel. Optional blocks: shortcut max pooling (1) is only needed for strided KPCONV.
Remotesensing 15 05136 g004
Figure 5. The network of integrated point convolution. S 0 > S 1 > S 2 > S 3 > S 4 signify point numbers.
Remotesensing 15 05136 g005
Figure 6. An overview of the ISPRS benchmark dataset. The left: the training set. The right: the test set.
Remotesensing 15 05136 g006
Figure 7. Covered areas and separate sections of the LASDU dataset. Upper right corner: Section 1, upper left corner: Section 2, lower left corner: Section 3, and lower right corner: Section 4.
Remotesensing 15 05136 g007
Figure 8. The percentage point count of point cloud surface density for the ISPRS benchmark dataset, LASDU dataset, and DFC2019 dataset is estimated within a radius of 2.5 m.
Remotesensing 15 05136 g008
Figure 9. Error map of IPCONV on the ISPRS benchmark dataset.
Remotesensing 15 05136 g009
Figure 10. The semantic segmentation results achieved by our IPCONV on the ISPRS benchmark dataset. The enlarged area shows the good discriminative ability of our network for categories such as building, tree, and roof.
Remotesensing 15 05136 g010
Figure 11. The semantic segmentation results achieved by our IPCONV on the ISPRS benchmark dataset. The left column is the real label, the middle column is the forecast result of Baseline (KPCONV), and the right column is the forecast result of IPCONV.
Remotesensing 15 05136 g011
Figure 12. The semantic segmentation results achieved by our IPCONV on the LASDU dataset. The enlarged regions show excellent semantic segmentation performance in areas with complex demands.
Remotesensing 15 05136 g012
Figure 13. The semantic segmentation results achieved by our IPCONV on the DFC 2019 dataset. The left column is the real label, the middle column is the forecast result of Baseline (KPCONV), and the right column is the forecast result of IPCONV.
Remotesensing 15 05136 g013
Table 1. Four cylindrical convolution kernel point generation parameters. On the first line, we give the different convolution kernel point generation parameters, which are order (Number), cylinder height (H), and multilayer layers (M).
NumberHM
182
242
321
421
Table 2. Two spherical cone convolution kernel point generation parameters. On the first line, we give the different convolution kernel point generation parameters: order (Number) and angle ( θ ).
Number θ
545
660
Table 3. Quantitative comparisons between our IPCONV and other models on the ISPRS benchmark dataset. The F1 scores for different classes are shown in the first nine columns, and the average F1 score and the OA are shown in the last two columns.
MethodPowerLow VegImp SurfCarFenceRoofFacadeShrubTreeAvg.F1OA
LUH [58]59.6 77.5 91.1 73.1 34.0 94.2 56.3 46.6 83.1 68.4 81.6
WhuY4 [59]42.5 82.791.4 74.7 53.794.3 53.1 47.9 82.8 69.2 84.9
RIT_1 [60]37.5 77.9 91.5 73.4 18.0 94.0 49.3 45.9 82.5 63.3 81.6
alsNet [61]70.1 80.5 90.2 45.7 7.6 93.1 47.3 34.7 74.5 60.4 80.6
A-XCRF [62]63.0 82.6 91.974.9 39.9 94.5 59.3 50.782.7 71.1 85.0
D-FCN [57]70.480.2 91.4 78.1 37.0 93.0 60.5 46.0 79.4 70.7 82.2
LGENet [12]76.5 82.1 91.8 80.040.6 93.8 64.7 49.9 83.673.784.5
RFFS-Net [63]75.5 80.0 90.5 78.5 45.5 92.7 57.9 48.3 75.7 71.6 82.1
KPCONV [12]73.5 78.7 88.0 79.4 33.0 94.2 61.3 45.7 82.0 70.6 81.7
Ours66.8 82.1 91.4 74.3 36.8 94.865.242.3 82.7 70.7 84.5
Bold represents the best performance in each column.
Table 4. Quantitative comparisons between our IPCONV and other models on the LASDU dataset. The F1 scores for different classes are shown in the first nine columns, and the average F1 score and the OA are shown in the last two columns.
MethodGroundBuil.TreesLow VegArtifactsOAAvg.F1
PointNet++ [14] 87.7490.6381.9863.1731.2682.8470.96
PointCNN [68]89.392.8384.0862.7731.6585.0472.13
DensePoint [68]89.7894.7785.265.4534.1786.3173.87
DGCNN [68]90.5293.2181.5563.2637.0885.5173.12
PosPool [68]88.2593.6783.9261.0038.3483.5273.03
HAD-PointNet++ [14]88.7493.1682.2465.2436.8984.3773.25
PointConv [63]89.5794.3184.5967.5136.4185.9174.48
VD-LAB [68]91.1995.5387.2673.4944.6488.0178.42
RFFS-Net [63]90.9295.3586.8171.0144.3687.1277.69
KPCONV [68]89.1293.4383.2259.7031.8583.7171.47
IPCONV(Ours)90.4796.2685.7559.5846.3486.6675.67
Bold represents the best performance in each column.
Table 5. Quantitative comparisons between our IPCONV and other models on the DFC 2019 dataset. The F1 scores for different classes are shown in the first nine columns, and the average F1 score and the OA are shown in the last two columns.
MethodGroundTreesBuil.WaterBridgeOAAvg.F1
PointNet++ [69]98.395.879.74.407.3092.757.1
PointSIFT [69]98.697.085.546.460.494.077.6
PointCNN [69]98.797.284.944.165.393.878.0
D-FCN [57]99.198.189.945.073.095.681.0
DANCE-NET [69]99.193.987.058.383.996.884.4
PointConv [63]97.395.893.674.569.295.386.1
RFFS-Net [63]96.696.188.777.880.194.388.0
KPCONV98.597.389.587.939.595.782.4
IPCONV(Ours)98.897.592.992.158.297.187.9
Bold represents the best performance in each column.
Table 6. Ablation study on difference convolution kernel point generation. The F1 scores for different classes are shown in the first nine columns, and the average F1 score and the OA are shown in the last two columns.
MethodPowerLow VegImp SurfCarFenceRoofFacadeShrubTreeAvg.F1OA
KPCONV [12]73.578.7 88.0 79.433.0 94.2 61.3 45.7 82.0 70.6 81.7
Cylinder (1) 172.3 82.291.674.3 24.0 93.9 63.1 43.9 80.7 69.5 83.8
Spherical cone (1)52.4 81.4 90.6 76.6 37.694.3 62.1 46.682.769.4 83.9
IPCONV (6)66.8 82.1 91.4 74.3 36.8 94.865.242.3 82.770.784.5
1 the number in parentheses, e.g., (1), indicates the convolution kernels in each downsampling layer. Bold represents the best performance in each column.
Table 7. Ablation study on the effect of MSNS. The F1 scores for different classes are shown in the first nine columns, and the average F1 score and the OA are shown in the last two columns.
MethodPowerLow VegImp SurfCarFenceRoofFacadeShrubTreeAvg.F1OA
Vanilla (6) 167.581.791.562.530.094.763.541.281.568.283.9
Cylinder (6)65.281.891.172.431.594.963.245.881.969.884.3
Spherical cone (6)64.281.991.562.431.994.862.944.382.968.584.3
IPCONV (6)66.882.191.474.336.894.865.242.382.770.784.5
1 the number in parentheses, e.g., (6), indicates the convolution kernels in each downsampling layer. Bold represents the best performance in each column.
Disclaimer/Publisher’s Note: The statements, opinions and data contained in all publications are solely those of the individual author(s) and contributor(s) and not of MDPI and/or the editor(s). MDPI and/or the editor(s) disclaim responsibility for any injury to people or property resulting from any ideas, methods, instructions or products referred to in the content.

