
Phenological Changes and Their Influencing Factors under the Joint Action of Water and Temperature in Northeast Asia


1
College of Geography and Ocean Sciences, Yanbian University, Yanji 133002, China
2
Tumen River Basin Wetland Ecosystem Field Scientific Research and Observation Station, Yanji 133002, China
3
Jilin Provincial International Joint Research Center of Tumen River Basin Wetland and Ecology, Yanji 133002, China
*
Author to whom correspondence should be addressed.
Remote Sens. 2023, 15(22), 5298; https://doi.org/10.3390/rs15225298
Submission received: 6 September 2023
/
Revised: 3 November 2023
/
Accepted: 6 November 2023
/
Published: 9 November 2023
(This article belongs to the Special Issue Biomass Remote Sensing in Forest Landscapes II)
Abstract
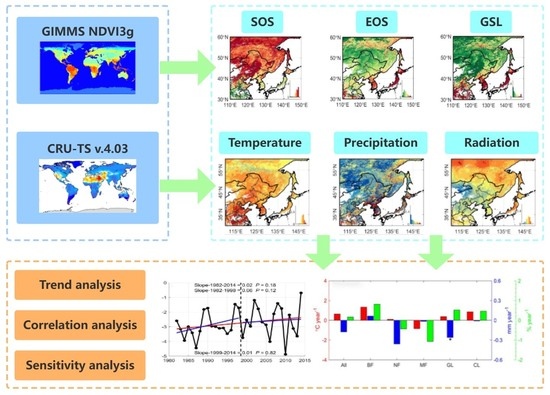
:Phenology is an important indicator for how plants will respond to environmental changes and is closely related to biomass production. Due to global warming and the emergence of intermittent warming, vegetation in northeast Asia is undergoing drastic changes. Understanding vegetation phenology and its response to climate change is of great significance to understanding the changes in the sustainable development of ecosystems. Based on Global Inventory Modelling and Mapping Studies (GIMMS), normalized difference vegetation index (NDVI)3g data, and the mean value of phenological results extracted by five methods, combined with climatic data, this study analyzed the temporal changes in phenology and the responses to climatic factors of five vegetation types of broad-leaved, needle-leaf, mixed forests, grassland, and cultivated land in northeast Asia over 33 years (1982–2014). The results showed that, during the intermittent warming period (1999–2014), the start of the growing season (SOS) advancement (Julian days) trend of all vegetation types decreased. During 1982–2014, the average temperature sensitivity of the SOS was 1.5 d/°C. The correlation between the SOS and the pre-season temperature is significant in northeast Asia, while the correlation between the EOS and the pre-season precipitation is greater than that between temperature and radiation. The impact of radiation changes on the SOS is relatively small.
1. Introduction
Land surface phenology (LSP) uses time series of satellite sensor-derived vegetation indices to describe seasonal vegetation dynamics according to vegetation index time series. The long-term monitoring of LSP provides large potential for the evaluation of interactions and feedbacks between climate and vegetation. Vegetation phenology is the study of the occurrence of periodic biological events during vegetation growth [1,2]. Phenology is an important indicator of plant responses to environmental changes and is closely correlated with biomass production. The composition and phenology of plant communities have a significant impact on biomass. This highlights that phenology is a crucial regulator for biomass production under climate change. Increasing evidence shows that the timing of vegetation development depends on environmental factors to a large extent [3,4]; hence, plant phenology has received increasing attention from the public and the scientific community [5,6]. Remote sensing has played an important role in monitoring and evaluating vegetation phenology [7,8,9]. Normalized difference vegetation index (NDVI) data are widely used in the study of vegetation growth and phenology [10,11]. Early studies showed that the vegetation growth period duration in most parts of China increased significantly from 1982 to 1999 [12,13], and the vegetation growth period in the temperate zone of China was extended by 1.16 d/a, the SOS was advanced by 0.79 d/a, and the EOS was delayed by 0.37 d/a [14]. In recent years, many researchers have studied climate change as the main cause of changes in vegetation phenology [15]. Research based on the Global Inventory Modelling and Mapping Studies (GIMMS) NDVI and in situ observation data from 1982 to 2011 established that the rise in temperature promoted the advance of the SOS in the northern hemisphere, on which the effect of daytime temperature was the most significant [16]. Further research based on GIMMS NDVI data established that the EOS in the temperate zone of northern China was delayed by 0.12 ± 0.01 d/a on average over the past 30 y, and the temperature in the first two months of the season had a significant positive correlation with the EOS in most regions [17].
Compared to the warming in the second half of the 20th century, the global average surface temperature during 1998–2013 had a smaller warming range. Although it is not a “real” gap in the strictest sense, the Intergovernmental Panel on Climate Change (IPCC) has called it the “global warming gap” [18,19], and the change in the relationship between vegetation phenology and climatic factors during the warming gap will also be the focus of attention. Liu Ke et al. (2018) used GIMMS NDVI3g data [20] to extract the vegetation phenology of the desert steppe transition zone in the northern hemisphere and established that the EOS showed an advancement trend at a rate of 0.41 d/a from 1998 to 2012, which shortened the vegetation growing season length (GSL). Fu et al. (2016) [21] believe that the long-term linear trend might mask short-term phenological changes, and their research in 2015 also confirmed that the significant response of the seven mid-latitude tree species in Europe to climate warming decreased during 1999–2013 [22]. Wang et al., 2019 [8] used GIMMS NDVI and FLUXNET records to check the phenological trend before and during the occurrence of the warming discontinuity in the northern hemisphere. The results showed that, during the warming discontinuity, the phenological change rate slowed down; however, Wang et al. (2017) used in situ observation of the leaves of seven major European tree species to analyze the temporal changes in temperature sensitivity within a scale of 10 y [23]. The results showed that the development of tree SOS science will slow in the future; however, the temperature sensitivity change in the warming scenario is still undetermined. Therefore, changes in vegetation phenology and its sensitivity to climatic factors during the intermittent warming period are still worth considering. Currently, many scholars have carried out relevant research on the response of different vegetation types to climate change in different regions of the world [8,9,16]; however, there is little research on vegetation phenology in cross-border areas. At present, there are many Earth observation products which play an important role in the research of LSP. This study considers northeast Asia as its research area, which involves many countries and regions and has diverse vegetation types, which will provide a scientific basis for the protection and sustainable development of vegetation ecosystems in China and other countries.
Therefore, this study was based on Wang et al. (2019)’s use of GIMMS NDVI3g data to extract the average value of the results of the five methods of vegetation phenology in the northern hemisphere [24]. The linear regression method was used to analyze the change trend of phenology, and the partial correlation analysis method was used to estimate the impact of pre-season climatic variables on the SOS and EOS, to reveal the impact of average temperature, precipitation, and other climatic factors on vegetation phenology in northeast Asia.
2. Materials and Methods
2.1. Study Area
Northeast Asia is a geographical concept. The study area is part of northeast Asia and north China (30–60°N, 110–150°E) (Figure 1a), including northeast and north China, Japan, the Korean Peninsula, eastern Mongolia, and far-east Russia, with a large latitudinal and longitudinal span, and involving more countries than in previous studies. Northeast Asia experiences heat changes characterized by subtropical, temperate, and frigid zones from south to north, and humidity differences characterized by humid, semi-humid, semi-arid, and arid zones from east to west, forming a unique vegetation distribution pattern. It is a relatively complete natural and economic geographical region and is a sensitive area for global change research. According to the GLC2000 vegetation coverage data provided by the Global Land Cover Project (Fritz et al., 2003; Roy et al., 2003; Bartholomé et al., 2005) [25,26,27], northeast Asia is mainly comprised of forests (57.25%), arable land (25.22%), and grassland (17.52%). This dataset was obtained from https://forobs.jrc.ec.europa.eu/glc2000 (accessed on 8 January 2021). Conforming to the arid area divided according to the standard of the United Nations Environment Programme, the forest in the study area is mainly distributed in the semi-humid and humid zones; the cultivated land is mainly distributed in the northeast region of China, which is planted with an annual corn crop, and North China, which is planted with biannual crops of winter wheat and summer corn; and the grassland is mainly distributed in the arid area (Figure 1b).
2.2. Data Source and Preprocessing
2.2.1. Phenology Dataset
The GIMMS NDVI3g dataset is the latest version of global vegetation index change data [28] released by the National Aeronautics and Space Administration (NASA) of the United States of America. It was obtained using an AVHRR (Advanced Very-High-Resolution Radiometer) sensor carried by the NOAA (National Oceanic and Atmospheric Administration) satellite. After correction, it can minimize volcanic aerosols and solar altitude angles, and global vegetation data affected by sensor errors and offsets can provide higher-quality data for phenology research at middle and high latitudes (https://climatedataguide.ucar.edu/climate-data/ndvi-normalized-difference-vegetation-index-3rd-generation-nasagfsc-gimms, accessed on 20 September 2020). The dataset is in the ENVI (The Environment for Visualizing Images) standard format, projected as ALBers, with a temporal resolution of 15 d and a spatial resolution of 0.083°. Currently, there are many methods to extract vegetation phenology from the NDVI time series, such as the threshold method [29,30], change-point detection method [31], and hybrid algorithms [32,33]. However, the correlation between phenological dates extracted using different methods is poor, and there is great uncertainty [34,35]. Based on this, we used Wang et al. (2019) to analyze the spatiotemporal distribution characteristics of vegetation phenology and analyses of correlation and sensitivity with climate data in northeast Asia using the mean of five common phenology extraction methods (http://data.globalecology.unh.edu/data/GIMMS_NDVI3g_Phenology, accessed on 20 September 2020). In this study, the Julian Day conversion method was used to convert the date of phenological phenomena from year to year into the actual number of days from 1 January, and the time series of phenological periods of all species were obtained.
2.2.2. Climate Data
To evaluate the relationship between vegetation phenology and pre-season climatic variables, we used the CRU-TS v.4.03 climate dataset, which is a set of monthly meteorological element datasets produced by the Climate Research Group of the University of East Anglia. This is a global grid dataset [36] based on data from more than 4000 meteorological stations around the world, with a spatial resolution of 0.5 × 0.5°, including monthly data of temperature, precipitation, and cloud cover, which can be obtained from the climate research group of the Tyndall Center (https://crudata.uea.ac.uk/cru/data/hrg/, accessed on 8 January 2021) [37]. As the CRU dataset lacked solar radiation data during the study period, it was replaced with cloud cover (Piao et al., 2015) [10].
2.2.3. Vegetation Distribution Data
The vegetation type data come from the GLC2000 dataset jointly developed by the European Union’s Joint Research Centre Space Application Institute and research institutions in more than 30 countries and regions around the world (https://forobs.jrc.ec.europa.eu/glc2000, accessed on 8 January 2021), and the dataset was downloaded and used to extract the vegetation types of northeast Asia.
2.2.4. Aridity Data
The dry–wet partition data is a part of the “CRU CL 2.0 Global Climate Dataset” prepared by the Climate Research Department of the University of East Anglia, United Kingdom. It is in grid form and has a resolution of 10 arc/min. The dataset is available from https://crudata.uea.ac.uk/~timm/grid/CRU_CL_2_0.html, accessed on 8 January 2021.
2.3. Methods
2.3.1. Trend Analysis
To analyze the changes in phenology before and after the intermittent period of temperature warming, we calculated the change trend of phenology during three time periods, namely, 1982–1998, 1999–2014, and 1982–2014. In this study, the univariate linear regression model [38] with pixel as the unit was used to calculate the spatiotemporal variation trend of phenology in different time periods, where confidence was 95% and p-value (significance level) equaled 0.05. For each pixel, the linear regression equation is given by Equation (1).
where SLOPE represents the change trend of phenology, i represents the serial number of a year, Pi represents the phenology value of a year, n is the year, positive or negative slope value represents the delay or delay trend of phenology during the study period, and a coefficient of zero represents no change in phenology during the study period.
2.3.2. Correlation Analysis of Phenology Data and Climatic Factors
To understand the potential impact of climatic driving factors on phenological changes, we conducted a partial correlation analysis of the phenological period (SOS and EOS) and each driving factor in the early growth season (pre-season). On the basis of controlling other driving factors, we analyzed the essential law of the single climatic factor driving phenological change. The formula for the partial correlation analysis is shown in Equation (2):
where rxyz represents the partial correlation coefficient between x and y after the variable z is fixed; rxy represents the relationship between variable x and variable y; ryz represents the correlation coefficient between variable y and variable z; and rxz represents the correlation coefficient between variable x and variable z. We used “t” to test the significance of the partial correlation coefficient, where p < 0.05, indicating a significant trend of change, and its statistical formula is shown in Equation (3):
where n represents the number of observation variables, m represents the order of partial correlation, and the simple correlation coefficient can be considered as the order 0 partial correlation, excluding a variable as the order partial correlation.
2.3.3. Determination of Pre-Season Duration
For the calculation of the pre-season duration of the three climatic factors (temperature, precipitation, and radiation) in the early growth season, we refer to the methods of Piao, Fu, and others [10,22]. For example, when calculating the pre-season duration of the influence of temperature on SOS, we first calculate the month of SOS during 1982–2014 pixel by pixel, and then calculate the current, previous, and first two months, and the partial correlation coefficient between the temperature of the first K months and the SOS. The fixed variables were total precipitation and total solar radiation during the corresponding time period. Finally, the time range with the highest correlation (i.e., the maximum absolute value of the partial correlation coefficient) was used as the pre-season duration of the SOS to obtain the final partial correlation coefficient between the SOS and pre-season temperature. When calculating the pre-season duration with the greatest impact of precipitation on SOS, the fixed variables were set as temperature and radiation. When calculating the pre-season duration with the greatest impact of radiation on the SOS, two variables were fixed: temperature and precipitation. Similarly, to determine the pre-season duration with the greatest impact of the three climatic factors on EOS, the same method was applied, with the significance level set at 95%.
2.3.4. Sensitivity of Phenology to Climatic Factors
To quantify the impact of climate-driving factors on phenology, we took the duration of pre-season climatic factors in the period 1982–2014 as the climate-driving factor of each pixel to carry out multiple linear regressions [10] to calculate the sensitivity of phenology to climatic factors, and the coefficient of multiple regression represents the sensitivity of climatic factors.
3. Results
3.1. Spatial Patterns of the Vegetation Phenological Phase
Based on the mean values of the five methods, we established that the SOS, EOS, and GSL in northeast Asia displayed relatively obvious zonal distribution characteristics (Figure 2). Most of the SOS is concentrated in the days 110–130 of the year (DOY) (from the middle of April to the first 10 d of May), showing the distribution characteristic of gradually becoming later from south to north. Regional differences in the SOS of the cultivated land are evident. The SOS of cultivated land distributed in the south was between 90 and 100 DOY, while the SOS of cultivated land distributed in the central area was approximately 125 DOY later. Over the entire time period, the earliest SOS of broad-leaved forest was day 114, and the latest SOS of grassland was 123 DOY, with a difference of nine days (Figure S1).
The spatial distribution of the EOS also presents zonal distribution characteristics. The EOS in low-latitude areas occurs later, and the EOS in high-latitude areas occurs earlier. The EOS in the study areas was mainly concentrated at 280–300 DOY (from mid-October to late October). The EOS occurred earlier in the inland area north of 40°N in the study area, at approximately 270–280 DOY. However, in the coastal areas south of 40°N (Republic of Korea, Japan, and other coastal areas), it occurred later, at approximately 310–320 DOY (Figure 2b). The difference in the EOS between the different vegetation types was minimal. The difference in the EOS between the earliest grassland and the latest broad-leaved forest was only seven days.
However, affected by the spatial distribution of the SOS and EOS, the GSL in northeast Asia also presents a zonal distribution pattern that gradually shortens from south to north, and the spatial difference in GSL is large. In the area south of 40°N in the study area (in Japan, Republic of Korea, and Shanxi, Henan, Anhui, and Jiangsu in China), the SOS occurred earlier, and the EOS occurred later; hence, the GSL in this area was the longest at approximately 195 d. However, the GSL north of 40°N (Russia, Mongolia, Liaoning, Jilin, Heilongjiang, and Inner Mongolia in China) was relatively short, approximately 165 d, and the GSL difference between the two regions was approximately 45 d (Figure 2c). The vegetation types with longer GSLs are mainly broad-leaved forests in coastal areas and cultivated land in the southern areas.
3.2. Spatial and Temporal Trends of the Phenological Phase
On the regional scale, the SOS and EOS in northeast Asia have advanced in the past 33 y (−0.09 d/a, −0.04 d/a), respectively; however, not significantly (Figure S2). In the intermittent period of warming, the advancement rate of the vegetation SOS was significantly reduced, nearly 92% lower than that in the previous period. During this period, the change in the EOS was also large, the EOS changed from delayed (0.08 d/a) to advanced (−0.49 d/a) during the intermittent warming period, and the advancement rate of the EOS was higher than that of the SOS in the early warming period. Affected by the SOS and EOS, the GSL increased at a rate of 0.37 d/a in the early stage and decreased at a rate of −0.40 d/a in the intermittent period of warming. To understand the changes in the phenology of different vegetation types before and after the intermittent period of climate warming, we compared and analyzed the changes in the phenology of different vegetation types. The results showed that, during the intermittent warming period, the advancement rate of the SOS of all vegetation types decreased, and that of the broad-leaved forest decreased the most (broad-leaved forest, 0.36 d/a; needle-leaf forest, 0.03 d/a; mixed forest, 0.05 d/a; grassland, 0.13 d/a; and cultivated land, 0.32 d/a). The change in the EOS for different vegetation types differed remarkably, especially in needle-leaf forests. The needle-leaf forest was delayed at a rate of 0.11 d/a during the early stage, and advanced at a rate of −0.78 d/a during the intermittent period of warming. This is also the main reason for the advancement of the EOS over the entire study area at the regional scale.
As shown in Figure 3, on a spatial scale, the vegetation phenology changed greatly in northeast Asia during 1982–2014. The proportion of the SOS showing a significant advancement trend in the three periods was 42.1% (1982–2014), 17.1% (1982–1998), and 18.1% (1999–2014), and the advancement rate was −0.43 d/a, −1.17 d/a, and −0.92 d/a, respectively. The proportion of significant delay of the SOS was 20.1% (1982–2014), 5.6% (1982–1998), and 6.6% (1999–2014), and the delay rate was 0.43 d/a, 0.91 d/a, and 1.32 d/a, respectively (Figure 3). The proportion of advanced SOS trends in different vegetation types also differed. Among them, the largest proportion of advancement trend of broad-leaved forest was 86.8% in the early stage of intermittent warming, and the largest proportion of delay in the intermittent warming period was 49.3% (Figure S3), with the largest change occurring around 1998. Although the difference in the area ratio of the SOS in the three periods was minimal, the change rate of the advancement and delay before and after the intermittent warming period was large.
The EOS shows distinct changes in both time and space scales. On the time scale, the proportion of the EOS showing a significant delay trend in the three periods was 51.9% (1982–2014), 16.1% (1982–1998), and 12.8% (1999–2014), and the delay rate was 0.37 d/a, 0.72 d/a, and 1.07 d/a, respectively. The proportion of the EOS that was significantly advanced was 52.9% (1982–2014), 11.9% (1982–1998), and 31.1% (1999–2014), and the rate of the EOS was −0.75 d/a, −0.61 d/a, and −2.21 d/a, respectively (Figure 3). In the past 33 y, the change trend of EOS has been largely delayed (0.26 d/a, 71.5%), while in far-eastern Russia north of 56°N (Sakha and far-eastern Russia north of Khabarovsk), it has been significantly advanced (−0.47 d/a, 28.5%). In addition, for example, the EOS of the broad-leaved forest in the inland region between 50 and 55°N and the Republic of Korea (northern Inner Mongolia and northern Heilongjiang in China, and Republic of Korea) was significantly delayed in the early stage, but not in the later stage (Figure 3e,h). In addition, the EOS of cultivated land in Shanxi and Shandong Province in China has been continuously and significantly delayed in the later period. This spatiotemporal difference in the change trends of the SOS and EOS determines the spatiotemporal distribution of the change trend of the GSL in the entire study area. In the region south of 56°N in northeast Asia (except the region north of Sakha and Khabarovsk in Russia), the GSL in this region has become longer (0.47 d/a, 71.4%) due to the advancement of the SOS and the delay of the EOS, while in the northern region, the GSL showed a decreasing trend (−0.5 d/a, 28.6%).
Compared with the overall trend of the SOS in different regions, the advancement trend of broad-leaved forests was the most evident during 1982–1998, accounting for 86.8%, and the delayed trend was the most evident during 1999–2014, accounting for 49.3% (Figure S3a). The delayed trend of the EOS in various types of broad-leaved forests was the most evident during 1982–1998 and 1999–2014, with 67.3%, and the advancement trend of needle-leaf forests was the most evident during 1999–2014, accounting for 51.8% (Figure S3b). During the period of 1999–2014, the delayed trend of the GLS in all regions was between 30 and 50%, and during the period of 1982–1998, the advancement trend of the GLS in all regions was between 65 and 85% (Figure S3c).
3.3. Phenology Phase Response to Climate Change
3.3.1. Variation Trend of Phenology Phase Pre-Season Duration
The results show that the pre-season temperature duration of the SOS during 1982–2014 was generally between 0 and 1 month, and the pre-season precipitation and radiation duration was mostly between 0 and 3 months (Figure S4b,d,f). However, it is worth noting that, during the intermittent warming period, the duration of the pre-season temperature expanded from 0 to 4 months, mainly in northeast China and the coastal area of the Okhotsk Sea (Figure S4m,n).
The pre-season temperature and radiation duration of the EOS during 1982–2014 ranged from 0 to 5 months, and the pre-season precipitation duration mainly ranged from 0 to 2 months (Figure S5b,d,f). The duration of the pre-season temperature in the needle-leaf-forest distribution zone in far-eastern Russia (Sakha and far eastern Russia north of Khabarovsk) was the longest, reaching 4–5 months, and its spatial distribution was consistent with the EOS distribution pattern (Figure S5a). However, the duration of the pre-season temperature in the region extended to the first six months (Figure S5m) during the intermittent warming period, which indicates that the EOS in the region may be greatly affected by the summer temperature and is greatly affected by the summer high temperature during the intermittent warming period.
To compare the changes in pre-season climatic factors and vegetation phenology, we analyzed the change trends of pre-season climatic factors in different periods. The pre-season temperature of the SOS varied significantly before and after the warming interval. The pre-season temperature increased during 1982–1998 (0.06 °C/a), and the increasing trend of the pre-season temperature slowed during 1999–2014 (0.01 °C/a) (Figure S6a), which may have led to changes in the sensitivity of the SOS to climatic factors before and after the warming interval. On a spatial scale, the spatiotemporal variation in SOS is consistent with that of the pre-season temperature, indicating that the pre-season temperature plays an important role in regulating the SOS of vegetation in northeast Asia.
The spatial distribution of the EOS was consistent with the distribution of the pre-season precipitation. Although the EOS pre-season precipitation changed slightly between 1982 and 2014, it changed significantly before and after the warming interval. The pre-season precipitation decreased at a rate of 0.48 mm/a in the early stage of warming discontinuity; however, it increased at a rate of 2.18 mm/a overall during the warming discontinuity. The pre-season solar radiation of the EOS varied significantly before and after the warming interval. The pre-season solar radiation of the EOS decreased during 1982–1998 (−0.06 W/m2/a), and the decreasing trend of the pre-season solar radiation turned into an increasing trend during 1999–2014 (0.12 W/m2/a) (Figure S6f).
The change trends of the SOS and EOS pre-season climatic factors in different time periods in northeast Asia show obvious changes in time and space scales. On the time scale, the proportion of the SOS pre-season precipitation showed a significant delay trend during the three periods of 13.6%, 19.5%, and 0.2%, respectively, whereas the proportion of the SOS pre-season precipitation showed a significant advancement trend of 2.5%, 0.6%, and 1.3%, respectively (Figure 4b,e,h).
3.3.2. Correlation Analysis between Phenological Period and Climatic Factors
We assessed whether the change in phenology in northeast Asia was driven by an abiotic environment. First, according to the partial correlation coefficient between phenology and the pre-season climatic driving factors (temperature, precipitation, and radiation), it was established that the pre-season temperature was the most important driving force for the advancement of the forest SOS in northeast Asia at the regional scale. During the entire time period, the advancement of the SOS in northeast Asia was mainly affected by the temperature. Although the influence of the temperature on the SOS differed for different vegetation types, the SOS of all vegetation types was negatively correlated with the temperature. The SOS advanced with an increase in temperature and reached a significant level (Figure S7a). However, in the near-term (1999–2014), the impact of the temperature on forest vegetation has become stronger, the impact on cultivated land and grassland has become weaker, and the significance level over the entire region has decreased (Figure S7c).
To understand the SOS relative contribution rate of pre-season climatic factors of different vegetation types during different periods on a spatial scale, we analyzed the partial correlation of climatic factors pixel by pixel, and compared the size of the partial correlation coefficient of the SOS and climatic factors (Figures S7 and S8).
During 1982–2014, there was a significant negative correlation between the SOS and the pre-season temperature of 61% in the studied regions (p < 0.05) (Figure 5a). The response of the vegetation SOS to the pre-season temperature was relatively strong in the early stage of the warming discontinuity (Figure 5k), while the limiting effect of the temperature was significantly weakened in the warming discontinuity, and the limiting effect of the precipitation and radiation was enhanced (Figure 5l) and mainly reflected in the areas where forests are distributed. The relationship between the pre-season precipitation and the SOS is related to the spatial distribution of the dry and wet areas. In wet areas, the SOS was positively correlated with the pre-season precipitation. The SOS was delayed with an increase in precipitation; however, in arid and semi-arid areas, it was negatively correlated. The SOS advanced with an increase in precipitation (Figure 5d–f).
The spatial difference in the response of the cultivated-land SOS to climatic factors was also large. In particular, the change in the SOS of cultivated land in arid and humid areas was not consistent with the restrictions of climatic factors. For example, the SOS of cultivated land in arid areas (the three northeastern provinces of China; Liaoning, Jilin, and Heilongjiang) was mainly restricted by the pre-season radiation; however, before and after the warming interval, the correlation changed from positive to negative; that is, the decrease in pre-season radiation in the early period caused a delay in the SOS, while the decrease in pre-season radiation in the recent period caused the advancement of the SOS, although this was not significant. However, the SOS of cultivated land in humid areas (north China; Beijing, Tianjin, Hebei, Shanxi, and northwestern Shandong) was restricted by the temperature [39], and the increase in the pre-season temperature caused the advancement of the SOS, which was particularly significant in the early stage. However, in the near future, cultivated land will be restricted by pre-season precipitation and temperatures. The decrease in the pre-season temperature and the increase in precipitation caused a delay in the SOS in this area.
The analyzed grasslands are mainly distributed in Mongolia and Inner Mongolia in the west of the study area, and the climate control factors of grasslands display great spatial heterogeneity. Mongolia is restricted by precipitation, and the increase in the pre-season precipitation causes the advancement of the SOS; however, in the near future, the decrease in the pre-season precipitation in this region will cause a delay in the SOS. The Inner Mongolia region of China was limited by radiation and temperature, and the increase in the pre-season temperature and radiation caused the advancement of the SOS. In the near future, this region is expected to be restricted by precipitation. The pre-season precipitation in the region is increasing, which has promoted the advancement of the SOS [40,41].
The climate-limiting factors of the EOS are relatively complex, showing a weak correlation with climatic factors over the entire time period; however, precipitation had a greater impact than that of temperature and radiation. Grassland and needle-leaf forests were the most affected by precipitation, with a high level of significance. Broad-leaved forests and cultivated land were significantly affected by solar radiation (Figure S7). There were significant differences in different vegetation types, which lead to spatial heterogeneity.
The change in the EOS’s climate-limiting factors was evident during different time periods. In the early stage of the warming discontinuity, the temperature in northeast Asia was positively correlated with the EOS; that is, the increase in temperature delayed the EOS, while in the warming discontinuity, the temperature was negatively correlated with the EOS. There was a significant negative correlation between precipitation and the EOS during the intermittent warming period; that is, an increase in precipitation led to the advancement of the EOS, which was more significant in needle-leaf forests and grasslands. However, the influence of the temperature on EOS advancement was more significant in the broad-leaved forests in the cross-border area between China and the Democratic People’s Republic of Korea (DPRK) (Figure 6k). Using the same method, we established that precipitation had the most extensive impact on the EOS in the entire region, followed by temperature, which remained unchanged during different time periods.
3.3.3. Sensitivity Analysis of Phenology to Climatic Factors
Temperature is an indicator of the SOS in northeast Asia. During 1982–2014, the SOS advanced by 1.5 d on average for every 1 °C increase in temperature. However, in the cultivated land of North China (Beijing, Tianjin, Hebei, Shanxi, and northwestern Shandong) and the broad-leaved forest of central Japan (central, northeastern, Kanto, and Hokkaido regions of Japan), the temperature increased by 1 °C, and the SOS occurred 3–4 days earlier (Figure S8a). The average sensitivity of the pre-season precipitation (0.0593 d/mm) and solar radiation (0.061 d/%) in the entire region was less than 0.1 d, and the impact on the SOS was minimal (Figure S8b,c). However, in arid and semi-arid areas (grasslands in Inner Mongolia), every 1 mm increase in precipitation causes an SOS advancement of 0.6 d, with distinct changes, and for every 1 mm decrease in precipitation in needle-leaf-forest distribution areas in humid areas, the SOS was approximately 0.5 d ahead of schedule.
During two time periods, the sensitivity of the pre-season temperature to the SOS changed from two days ahead of time to 1.2 d for every 1 °C rise in temperature, and the impact intensity decreased. The sensitivity of broad-leaved forests decreased from 3 d to 2 d, while that of cultivated land decreased from 3 d to 1 d. The sensitivity of grassland also decreased by 1 d/°C, which may be related to its temperature requirements, while the change in needle-leaf forest and mixed forest was not evident, (Figure 7). During each period, the sensitivity of spring phenology to temperature was the highest; however, they were negatively correlated. The sensitivity of spring phenology to precipitation was negatively correlated during each period, with a change value of less than 1 d/a. The sensitivity of spring phenology to solar radiation was the lowest (Figure S9a,c,e).
From the mean values of the EOS and temperature, precipitation, and solar radiation sensitivity in northeast Asia, it can be determined that the EOS was delayed by 0.2 d for every 1 °C increase in the pre-season temperature in the entire region, the EOS was 0.1 d earlier for every 1 mm increase in the pre-season precipitation, and the impact of the solar radiation was less than 0.1 d. In the Republic of Korea and northern Japan (the central, northeastern, Kanto, and Hokkaido regions of Republic of Korea and Japan), the EOS was delayed by 2–3 d for every 1 °C rise in the pre-season temperature. However, in the coastal areas of Russia (the far-eastern region of Russia in the north of Sakha and Khabarovsk) north of 55°N, the EOS advanced by 2–3 days for every 1 °C rise in the pre-season temperature (Figure S10a). In this region, the EOS advanced by 1–2 days for every 1 mm increase in the pre-season precipitation (Figure S10b). For different vegetation types, the EOS of broad-leaved forests was delayed by approximately 1 d for every 1 °C increase in the pre-season temperature, and other vegetation types changed slightly (Figure S7). In the early stage of warming discontinuity, the EOS of all vegetation was delayed for every 1 °C increase in the pre-season temperature, and the EOS of broad-leaved forest and mixed forest was delayed by 2 d and 2.5 d, respectively. However, during the intermittent warming period, the EOS of all vegetation changed from delayed to advanced, and the EOS of mixed forest and cultivated land changed the most. The pre-season temperature increased by 1 °C 3.2 d and 3 d earlier, respectively. The effect of changes in the pre-season precipitation and radiation on the EOS was only prominent in some parts of northeast Asia. The autumn phenology had a negative correlation with temperature during 1999–2014 and a positive correlation with temperature during 1982–1998 (Figure S9b). In general, the sensitivity of autumn phenology to precipitation was the lowest, less than 0.2 d/a (Figure S9d).
4. Discussion
4.1. Spatial and Temporal Trends of Phenological Phase
According to the spatial and temporal distribution of the SOS, the SOS of cultivated land in the mid-latitude region occurred later than that of other vegetation types. The difference between the SOS of cultivated land in the south and that of cultivated land in the middle was nearly 40 days, which was mainly caused by the different species types cultivated in the two regions (Figure 2a). The SOS caused by high temperature and humidity began earlier in humid areas mainly cultivating winter wheat, corn, cotton, and other crops. The cultivated land in the central part of the study area is distributed in semi-arid and semi-humid areas, mainly cultivating spring corn, rice, and spring wheat, and drought caused the late start of the SOS in the cultivated land in this area.
On a regional scale, both the SOS and EOS in northeast Asia have advanced in the past 33 y (0.09 d/a and 0.04 d/a, respectively); however, not significantly (Figure S2). It is worth noting that the vegetation phenology in northeast Asia changed greatly in the early stages of the warming discontinuities (1982–1998 and 1999–2014) [42,43]. It can be seen that, before and after the intermittent warming period, the climate had a greater impact on vegetation phenology in northeast Asia.
However, since the SOS changed in the opposite direction between 1982–1998 and 1999–2014, the advancement and delay trends offset each other. Therefore, the overall change over the past 33 y is not obvious. For example, the SOS of the needle-leaf forest in the inland region of far-eastern Russia (Sakha region of Russia) was slightly delayed during 1982–1998 (Figure 3d), while the SOS was significantly advanced during 1999–2014 (Figure 3g). For example, for the cultivated land vegetation in the southwest humid area of the study area and the broad-leaved forest vegetation in the eastern part of northeast China (the eastern part of Liaoning, Jilin, and Heilongjiang in China), Japan, the Republic of Korea, and other coastal areas, the SOS was advanced during 1982–1999 (Figure 3d) and delayed during 1999–2014 (Figure 3g). The SOS for all vegetation types showed a distinct trend of advancement before and after the intermittent warming period. However, the broad-leaved forest showed a trend of delaying the SOS over a large area during the intermittent warming period. The regions where the SOS was delayed were mainly Heilongjiang Province in China and in the DPRK.
Before and after the intermittent warming period, the advancement and delay transformation of different vegetation types was not significant; however, the degree of change was significantly different (Figure S3). Especially during the intermittent period of warming, the EOS advancement rate was three times higher than that of the previous period, which was mainly caused by the needle-leaf forest in far-eastern Russia.
4.2. Response of Phenology Phase to Climate Change
The results show that the duration of the pre-season temperature of the SOS from 1982 to 2014 was between 0 and 1 month, and the duration of the pre-season precipitation and radiation was between 0 and 4 months (Figure 4b,d,f). However, it is worth noting that, during the intermittent warming period, the duration of the pre-season temperature was extended mainly in the northeast of China and the coastal areas of the Okhotsk Sea (Figure 4m,n). This may be due to the temperature drop during this period, which led to the need for a longer accumulated temperature of the SOS in this region to ensure the temperature required for vegetation growth [44].
To understand the SOS’s relative contribution rate of pre-season climatic factors in different periods and different vegetation types on a spatial scale, we analyzed the partial correlation of climatic factors on a pixel-by-pixel basis, and compared the size of the partial correlation coefficient of the SOS and climatic factors (Figure 5). We established that the spatial difference of the forest as a result of the pre-season temperature was also large; for example, in the needle-leaf forest in the inland region of the far east of Russia (Sakha region of Russia), the main limiting factors for the delay of the SOS during the period of 1982–1998 were temperature and precipitation. The increase in water and heat caused a delay in the SOS in the needle-leaf forest, which was restricted by radiation during the period of 1999–2014. The reduction in radiation resulted in the advancement of vegetation phenology. Another example is broad-leaved forests distributed in the eastern part of northeast China, the DPRK, and Japan (Liaoning, Jilin, the coastal areas of the Okhotsk Sea in Heilongjiang in China, and in Russia). The SOS was restricted by the pre-season temperature [45]. The increase in the pre-season temperature during 1982–1998 caused advancement of the SOS (Figure 5b), and a decrease in the pre-season temperature during 1999–2014 caused a delay in the SOS (Figure 5c).
The spatial difference in the SOS in cultivated land with respect to climatic factors is also large. Cultivated land is jointly limited by the pre-season precipitation and temperature. The decrease in the pre-season temperature and the increase in precipitation caused a delay in the SOS in this area. This phenomenon is due to differences in crop maturity, crop type, and dry and wet areas cultivated in the two regions [46,47].
The climate-limiting factors of the EOS are relatively complex. In the humid area north of 55°N (the coastal area of the Sea of Okhotsk north of Sakha and Khabarovsk in Russia), the EOS is subject to the joint limitation of the pre-season precipitation and temperature. High temperatures and precipitation inhibit the growth of vegetation [14], causing the EOS to occur significantly ahead of time, and this inhibition effect grows increasingly stronger, which is also the main reason that the EOS in the entire study area is not significantly advanced (Figure 6a,d). South of 55° (the inland area of the Okhotsk Sea, in Amur, Khabarovsk, Yevery, and Primary’ye in Russia), the effect of the increase in the pre-season temperature on forest vegetation and the decrease of the pre-season precipitation in the semi-humid area caused the delay of the EOS. In the humid area of Heilongjiang Province, China, the forest EOS was mainly limited by the precipitation, and a reduction in precipitation caused a delay (Figure 3b). In arid and semi-arid areas, the EOS of cultivated land and grassland was limited by pre-season temperatures and precipitation [17]. However, it is worth noting that the EOS in the humid forest of the Korean Peninsula was mainly affected by the temperature, and an increase in the temperature caused a delay in the EOS [44] (Figure 6a).
The study area is located in a complex environment with medium-high latitude terrain. Vegetation phenology is not only affected by the factors that have been considered but is also related to altitude, latitude, and human activity. Currently, the frequent occurrence of extreme climatic events has a significant impact on global and regional carbon cycles [6], which also have a significant impact on vegetation phenology. This will also have a significant impact on biomass. These factors should be considered in future research to further understand vegetation phenology change mechanisms and explore phenology–biomass interactions under climate change. Although the GIMMS NDVI3g dataset used in this study has advantages over a large time span, its spatial resolution has certain shortcomings. The combination of measured phenological and high-resolution data can be used to analyze the dynamic changes in phenology in a more detailed way and explore phenology–biomass interactions under climate change, which will be the focus of our future research.
5. Conclusions
The phenological period displays zonal distribution characteristics. The SOS was gradually delayed from south to north and concentrated at 110–130 d. The EOS shows an advancement fluctuation trend and is concentrated at 280–300 d. The GSL gradually shortened from south to north and lasted between 160 and 180 d. On the time scale, the SOS and EOS in northeast Asia have advanced (0.09 d/a and 0.04 d/a, respectively) over the past 33 y; however, not significantly. In the early stage of the warming discontinuity, the SOS of all vegetation showed a trend of advancement, and the EOS showed a trend of delay. The change in vegetation phenology during the intermittent warming period was an important reason for the non-significant change in phenology over the entire time period.
The correlation between the SOS and pre-season temperature in northeast Asia was significant (p < 0.05), and broad-leaved forests (0.64) were the most affected by temperature. The correlation between the EOS and pre-season precipitation was greater than that between temperature and radiation, and was more significant in grassland (0.41) vegetation types. According to the average value of sensitivity, the SOS was 1.5 d ahead of schedule for each 1 °C rise in temperature; the EOS was delayed by 0.2 d. The EOS was 0.13 d ahead of schedule for every 1 mm increase in precipitation. The change in solar radiation had little impact on the SOS of vegetation in northeast Asia, and the EOS increased with an increase in solar radiation in the broad-leaved-forest distribution area. Over different time periods, during the intermittent warming period, the advancement of the SOS decreased with an increase in temperature, and the impact of precipitation and solar radiation was minimal. With an increase in temperature, the EOS occurred ahead of time during this period, and an increase in precipitation also caused the EOS to occur ahead of time. The understanding obtained from the results of this study is expected to improve the performance of terrestrial ecosystem models by including climate-driving factors to simulate the production of ecosystems and provide a scientific basis for the simulation of vegetation growth under future climate change.
Supplementary Materials
The following supporting information can be downloaded at: https://www.mdpi.com/article/10.3390/rs15225298/s1, Figure S1: Phenological phase annual average value of different vegetation types during different time periods in northeast Asia; Figure S2: Trends of different vegetation types in northeast Asia (the black line represents the annual sequence of vegetation phenology from 1982–2014, the red line represents the trend of inter-annual variation from 1982–2014, and the blue line represents 1982–2014. The inter-annual change trends in 1998 and 1999–2014, (a,d,g,j,m,p) all represent vegetation, broad-leaved forest, needle-leaf forest, mixed inter-annual changes in spring phenology of forest, grassland and cultivated land; and (b,e,h,k,n,q) all represent vegetation, broad-leaved forest, needle-leaf forest, and mixed forest. The inter-annual changes of autumn phenology of grassland and cultivated land; (c,f,i,l,o,r) all represent vegetation, broad-leaved forest, needle-leaf forest, mixed forest, and inter-annual variation of growing season duration of the grassland and cultivated land); Figure S3: Statistical percentages of (a) SOS, (b) EOS, and (c) GSL advancement and delay of different vegetation types between 1982–1998 and 1999–2014. Figure S4: SOS preseason temperature duration and probability distribution before and after warming periods; (a,g,m) represent the spatial distribution patterns of pre-season temperature duration; (b,h,n) represent the probability distribution histograms of pre-season temperature; (c,i,o) represent the spatial distribution patterns of pre-season precipitation duration; (d,j,p) represent the histograms of pre-season radiation probability distribution; (e,k,q) represent the spatial distribution patterns of pre-season temperature duration; and (f,l,r) represent the probability distribution histograms of pre-season temperature; Figure S5: EOS preseason temperature duration and probability distribution before and after warming periods; (a,g,m) represent the spatial distribution patterns of pre-season temperature duration; (b,h,n) represent the probability distribution histograms of pre-season temperature; (c,i,o) represent the spatial distribution patterns of pre-season precipitation duration; (d,j,p) represent the histograms of pre-season radiation probability distribution; (e,k,q) represent the spatial distribution patterns of pre-season temperature duration; and (f,l,r) represent the probability distribution histograms of pre-season temperature.; Figure S6: The inter-annual change trend of pre-season climatic factors in different time periods in northeast Asia. (The black line represents the annual sequence of vegetation phenology from 1982–2014, the red line represents the trend of inter-annual change from 1982–2014, and the blue line represents the trend of inter-annual change from 1982–1998 and 1999–2014; (a–c) represent the inter-annual variation trends of temperature, precipitation and solar radiation before the spring phenology; (d–f) represent the inter-annual variation trends of temperature, precipitation and solar radiation before autumn phenology); Figure S7: Statistical map of partial correlation coefficients of spring (autumn) phenology and climatic factors of different vegetation types during different time periods in northeast Asia ((a): 1982–2014; (b): 1982–1998; (c): 1999–2014; (d): 1982–2014; (e): 1982–998; (f): 1999–2014).; Figure S8: Spatial distribution map of spring phenology sensitivity to climate change in northeast Asia ((a–c) represent the sensitivity of spring phenology and pre-season temperature, precipitation and solar radiation from 1982–2014 respectively; (d–f) from 1982–1998; and (g–i) represent 1999–2014; Figure S9: Statistical charts of the mean sensitivity of climate change of different vegetation types in spring and autumn phenology during different time periods in northeast Asia; (a,c,e) represent the sensitivity of spring phenology and pre-season temperature, precipitation and solar radiation, respectively; (b,d,f) represent the sensitivity of autumn phenology and pre-season temperature, precipitation and solar radiation, respectively; Figure S10: Spatial distribution map of autumn phenology sensitivity to climate change in northeast Asia ((a–c) represent the sensitivity of autumn phenology and pre-season temperature, precipitation and solar radiation from 1982–2014 respectively; (d–f) represent 1982–1998; (g–i) represent 1999–2014).
Author Contributions
Conceptualization, J.W., S.M. and Z.X; methodology, J.W., S.M. and Z.X.; software, J.W.; validation, J.W. and S.M.; formal analysis, J.W. and S.M.; investigation, J.W. and S.M.; resources, Z.X.; data curation, J.W. and S.M.; writing—original draft preparation, J.W. and S.M.; writing—review and editing, J.W., S.M., Z.X. and W.Z.; visualization, J.W. and S.M.; supervision, J.W., S.M., Z.X. and W.Z.; project administration, Z.X.; funding acquisition, Z.X. All authors have read and agreed to the published version of the manuscript.
Funding
This study was supported by Supported by National Natural Science Foundation of China (grant number: 41977401), Jilin Provincial Natural Science Foundation (grant number: 20200201044JC), National Natural Science Foundation of China (grant number: 31500400), Jilin Provincial Key Laboratory (grant number: YDZJ202102CXJD040), Jilin International Joint Research Center (grant number: 20200802013GH).
Data Availability Statement
The data sets used in this study are publicly available. The GIMMS NDVI3g dataset is the latest version of global vegetation index change data released by the National Aeronautics and Space Administration (NASA) of the United States of America (https://climatedataguide.ucar.edu/climate-data/ndvi-normalized-difference-vegetation-index-3rd-generation-nasagfsc-gimms, accessed on 20 September 2020). we used the CRU-TS v.4.03 climate dataset, which can be obtained from the climate research group of the Tyndall Center (https://crudata.uea.ac.uk/cru/data/hrg/, accessed on 8 January 2021). The vegetation type data comes from the GLC2000 dataset jointly developed by the European Union’s Joint Research Centre Space Application Institute and research institutions in more than 30 countries and regions around the world (https://forobs.jrc.ec.europa.eu/glc2000, accessed on 8 January 2021). The dry–wet partition data is a part of the “CRU CL 2.0 Global Climate Dataset” prepared by the Climate Research Department of the University of East Anglia, United Kingdom. The dataset is available from https://crudata.uea.ac.uk/~timm/grid/CRU_CL_2_0.html, accessed on 8 January 2021.
Acknowledgments
Meanwhile, heartfelt thanks to the anonymous reviewers and the editors, whose comments and advice improve the quality of the work.
Conflicts of Interest
The authors declare no conflict of interest.
References
- Lieth, H. Phenology and Seasonality Modeling; Springer Science & Business Media: Berlin, Germany, 2013; Volume 8. [Google Scholar]
- Du, Q.; Liu, H.; Li, Y.; Xu, L.; Diloksumpun, S. The effect of phenology on the carbon exchange process in grassland and maize cropland ecosystems across a semiarid area of China. Sci. Total Environ. 2019, 695, 133868. [Google Scholar] [CrossRef] [PubMed]
- Myneni, R.B.; Keeling, C.D.; Tucker, C.J.; Asrar, G.; Nemani, R.R. Increased plant growth in the northern high latitudes from 1981 to 1991. Nature 1997, 386, 698–702. [Google Scholar] [CrossRef]
- Zhou, L.; Tucker, C.J.; Kaufmann, R.K.; Slayback, D.; Shabanov, N.V.; Myneni, R.B. Variations in northern vegetation activity inferred from satellite data of vegetation index during 1981 to 1999. J. Geophys. Res. Atmos. 2001, 106, 20069–20083. [Google Scholar] [CrossRef]
- Chen, L.; Huang, J.-G.; Ma, Q.; Hänninen, H.; Tremblay, F.; Bergeron, Y. Long-term changes in the impacts of global warming on leaf phenology of four temperate tree species. Glob. Chang. Biol. 2019, 25, 997–1004. [Google Scholar] [CrossRef]
- Piao, S.; Liu, Q.; Chen, A.; Janssens, I.A.; Fu, Y.; Dai, J.; Liu, L.; Lian, X.; Shen, M.; Zhu, X. Plant phenology and global climate change: Current progresses and challenges. Glob. Chang. Biol. 2019, 25, 1922–1940. [Google Scholar] [CrossRef]
- Chen, T.-t.; Yi, G.-h.; Zhang, T.-b.; Wang, Q.; Bie, X.-j. A method for determining vegetation growth process using remote sensing data: A case study in the Three-River Headwaters Region, China. J. Mt. Sci. 2019, 16, 2001–2014. [Google Scholar] [CrossRef]
- Wang, H.; Tetzlaff, D.; Buttle, J.; Carey, S.K.; Laudon, H.; McNamara, J.P.; Spence, C.; Soulsby, C. Climate-phenology-hydrology interactions in northern high latitudes: Assessing the value of remote sensing data in catchment ecohydrological studies. Sci. Total Environ. 2019, 656, 19–28. [Google Scholar] [CrossRef]
- Liu, Y.; Wang, J.; Dong, J.; Wang, S.; Ye, H. Variations of Vegetation Phenology Extracted from Remote Sensing Data over the Tibetan Plateau Hinterland during 2000–2014. J. Meteorol. Res. 2020, 34, 786–797. [Google Scholar] [CrossRef]
- Piao, S.; Tan, J.; Chen, A.; Fu, Y.H.; Ciais, P.; Liu, Q.; Janssens, I.A.; Vicca, S.; Zeng, Z.; Jeong, S.-J.; et al. Leaf onset in the northern hemisphere triggered by daytime temperature. Nat. Commun. 2015, 6, 6911. [Google Scholar] [CrossRef]
- Peng, S.; Piao, S.; Ciais, P.; Myneni, R.B.; Chen, A.; Chevallier, F.; Dolman, A.J.; Janssens, I.A.; Peñuelas, J.; Zhang, G.; et al. Asymmetric effects of daytime and night-time warming on Northern Hemisphere vegetation. Nature 2013, 501, 88–92. [Google Scholar] [CrossRef]
- Shen, X.; Liu, B.; Henderson, M.; Wang, L.; Wu, Z.; Wu, H.; Jiang, M.; Lu, X. Asymmetric effects of daytime and nighttime warming on spring phenology in the temperate grasslands of China. Agric. For. Meteorol. 2018, 259, 240–249. [Google Scholar] [CrossRef]
- Piao, S.; Fang, J.; Zhou, L.; Guo, Q.; Henderson, M.; Ji, W.; Li, Y.; Tao, S. Interannual variations of monthly and seasonal normalized difference vegetation index (NDVI) in China from 1982 to 1999. J. Geophys. Res. Atmos. 2003, 108, 4401. [Google Scholar] [CrossRef]
- Peng, S.S.; Chen, A.P.; Xu, L.; Cao, C.X.; Fang, J.Y.; Myneni, R.B.; Pinzon, J.E.; Tucker, C.J.; Piao, S.L. Recent change of vegetation growth trend in China. Environ. Res. Lett. 2011, 6, 044027. [Google Scholar] [CrossRef]
- Tang, H.; Li, Z.; Zhu, Z.; Chen, B.; Zhang, B.; Xin, X. Variability and climate change trend in vegetation phenology of recent decades in the Greater Khingan Mountain area, Northeastern China. Remote Sens. 2015, 7, 11914–11932. [Google Scholar] [CrossRef]
- Shen, X.; Liu, B.; Xue, Z.; Jiang, M.; Lu, X.; Zhang, Q. Spatiotemporal variation in vegetation spring phenology and its response to climate change in freshwater marshes of Northeast China. Sci. Total Environ. 2019, 666, 1169–1177. [Google Scholar] [CrossRef]
- Liu, Y.; Wu, C.; Peng, D.; Xu, S.; Gonsamo, A.; Jassal, R.S.; Altaf Arain, M.; Lu, L.; Fang, B.; Chen, J.M. Improved modeling of land surface phenology using MODIS land surface reflectance and temperature at evergreen needleleaf forests of central North America. Remote Sens. Environ. 2016, 176, 152–162. [Google Scholar] [CrossRef]
- Stocker, T.F.; Qin, D.; Plattner, G.-K.; Alexander, L.V.; Allen, S.K.; Bindoff, N.L.; Bréon, F.-M.; Church, J.A.; Cubasch, U.; Emori, S. Technical summary. In Climate Change 2013: The Physical Science Basis. Contribution of Working Group I to the Fifth Assessment Report of the Intergovernmental Panel on Climate Change; Cambridge University Press: Cambridge, UK, 2013; pp. 33–115. [Google Scholar]
- Yan, X.-H.; Boyer, T.; Trenberth, K.; Karl, T.R.; Xie, S.-P.; Nieves, V.; Tung, K.-K.; Roemmich, D. The global warming hiatus: Slowdown or redistribution? Earths Future 2016, 4, 472–482. [Google Scholar] [CrossRef]
- Liu, k.; Du, l.; Hou, j.; Hu, y.; zhu, y.; gong, f. Spatiotemporal variations of NDVI in terrestrial ecosystems in China from 1982–2012. Acta Ecol. Sin. 2018, 38, 1885–1896. [Google Scholar] [CrossRef]
- Fu, Y.H.; Piao, S.; Ciais, P.; Huang, M.; Menzel, A.; Peaucelle, M.; Peng, S.; Song, Y.; Vitasse, Y.; Zeng, Z.; et al. Long-term linear trends mask phenological shifts. Int. J. Biometeorol. 2016, 60, 1611–1613. [Google Scholar] [CrossRef]
- Fu, Y.H.; Zhao, H.; Piao, S.; Peaucelle, M.; Peng, S.; Zhou, G.; Ciais, P.; Huang, M.; Menzel, A.; Peñuelas, J.; et al. Declining global warming effects on the phenology of spring leaf unfolding. Nature 2015, 526, 104–107. [Google Scholar] [CrossRef]
- Wang, H.; Rutishauser, T.; Tao, Z.; Zhong, S.; Ge, Q.; Dai, J. Impacts of global warming on phenology of spring leaf unfolding remain stable in the long run. Int. J. Biometeorol. 2017, 61, 287–292. [Google Scholar] [CrossRef] [PubMed]
- Wang, X.; Xiao, J.; Li, X.; Cheng, G.; Ma, M.; Zhu, G.; Altaf Arain, M.; Andrew Black, T.; Jassal, R.S. No trends in spring and autumn phenology during the global warming hiatus. Nat. Commun. 2019, 10, 2389. [Google Scholar] [CrossRef] [PubMed]
- Fritz, S.; Bartholome, E.; Belward, A.; Hartley, A.; Stibig, H.-J.; Eva, H.; Mayaux, P.; Bartalev, S.; Latifovic, R.; Kolmert, S. Harmonisation, Mosaicing and Production of the Global Land Cover 2000 Database (Beta Version); EC-JRC: Brussels, Belgium, 2003. [Google Scholar]
- Roy, P.; Agrawal, S.; Joshi, P.; Shukla, Y. The Land Cover Map for Southern Asia for the Year 2000. GLC2000 Database, European Commision Joint Research Centre; European Commision Joint Research Centre: Brussels, Belgium, 2003. [Google Scholar]
- Bartholomé, E.; Belward, A.S. GLC2000: A new approach to global land cover mapping from Earth observation data. Int. J. Remote Sens. 2005, 26, 1959–1977. [Google Scholar] [CrossRef]
- Tucker, C.J.; Pinzon, J.E.; Brown, M.E.; Slayback, D.A.; Pak, E.W.; Mahoney, R.; Vermote, E.F.; El Saleous, N. An extended AVHRR 8-km NDVI dataset compatible with MODIS and SPOT vegetation NDVI data. Int. J. Remote Sens. 2005, 26, 4485–4498. [Google Scholar] [CrossRef]
- White, M.A.; De Beurs, K.M.; Didan, K.; Inouye, D.W.; Richardson, A.D.; Jensen, O.P.; O’keefe, J.; Zhang, G.; Nemani, R.R.; Van Leeuwen, W.J.D.; et al. Intercomparison, interpretation, and assessment of spring phenology in North America estimated from remote sensing for 1982–2006. Glob. Chang. Biol. 2009, 15, 2335–2359. [Google Scholar] [CrossRef]
- Cong, N.; Piao, S.; Chen, A.; Wang, X.; Lin, X.; Chen, S.; Han, S.; Zhou, G.; Zhang, X. Spring vegetation green-up date in China inferred from SPOT NDVI data: A multiple model analysis. Agric. For. Meteorol. 2012, 165, 104–113. [Google Scholar] [CrossRef]
- Zhang, X.; Friedl, M.A.; Schaaf, C.B.; Strahler, A.H.; Hodges, J.C.F.; Gao, F.; Reed, B.C.; Huete, A. Monitoring vegetation phenology using MODIS. Remote Sens. Environ. 2003, 84, 471–475. [Google Scholar] [CrossRef]
- White, M.A.; Thornton, P.E.; Running, S.W. A continental phenology model for monitoring vegetation responses to interannual climatic variability. Glob. Biogeochem. Cycles 1997, 11, 217–234. [Google Scholar] [CrossRef]
- Wu, C.; Gonsamo, A.; Gough, C.M.; Chen, J.M.; Xu, S. Modeling growing season phenology in North American forests using seasonal mean vegetation indices from MODIS. Remote Sens. Environ. 2014, 147, 79–88. [Google Scholar] [CrossRef]
- Peiyu, C.; Leiming, Z.; Shenggong, L.; Junhui, Z. Review on Vegetation Phenology Observation and Phenological Index Extractior. Adv. Earth Sci. 2016, 31, 365–376. [Google Scholar] [CrossRef]
- Linli, C.; Jun, S.; Huaqiang, D. Advances in Remote Sensing Extraction of Vegetation Phenology and Its Driving Factors. Adv. Earth Sci. 2021, 36, 9–16. [Google Scholar] [CrossRef]
- Harris, I.; Jones, P.D.; Osborn, T.J.; Lister, D.H. Updated high-resolution grids of monthly climatic observations–the CRU TS3.10 Dataset. Int. J. Climatol. 2014, 34, 623–642. [Google Scholar] [CrossRef]
- New, M.; Lister, D.; Hulme, M.; Makin, I. A high-resolution data set of surface climate over global land areas. Clim. Res. 2002, 21, 1–25. [Google Scholar] [CrossRef]
- Weatherhead, E.C.; Reinsel, G.C.; Tiao, G.C.; Meng, X.-L.; Choi, D.; Cheang, W.-K.; Keller, T.; DeLuisi, J.; Wuebbles, D.J.; Kerr, J.B.; et al. Factors affecting the detection of trends: Statistical considerations and applications to environmental data. J. Geophys. Res. Atmos. 1998, 103, 17149–17161. [Google Scholar] [CrossRef]
- Javed, T.; Li, Y.; Feng, K.; Ayantobo, O.O.; Ahmad, S.; Chen, X.; Rashid, S.; Suon, S. Monitoring responses of vegetation phenology and productivity to extreme climatic conditions using remote sensing across different sub-regions of China. Environ. Sci. Pollut. Res. 2021, 28, 3644–3659. [Google Scholar] [CrossRef] [PubMed]
- Lingtong, D.; Jing, H.; Yue, H.; Ke, L.; Xinguo, Y.; Xuejian, Z.; Yuguo, Z. Characteristics of Phenology Changes and Its Relationship with Climatic Factors in Desert/Grassland Biome Transition Zone of Northern Hemisphere During 1982–2012. Adv. Clim. Chang. Res. 2017, 13, 473–482. [Google Scholar] [CrossRef]
- Ren, S.; Yi, S.; Peichl, M.; Wang, X. Diverse Responses of Vegetation Phenology to Climate Change in Different Grasslands in Inner Mongolia during 2000–2016. Remote Sens. 2018, 10, 17. [Google Scholar] [CrossRef]
- Fyfe, J.C.; Meehl, G.A.; England, M.H.; Mann, M.E.; Santer, B.D.; Flato, G.M.; Hawkins, E.; Gillett, N.P.; Xie, S.-P.; Kosaka, Y.; et al. Making sense of the early-2000s warming slowdown. Nat. Clim. Chang. 2016, 6, 224–228. [Google Scholar] [CrossRef]
- Medhaug, I.; Stolpe, M.B.; Fischer, E.M.; Knutti, R. Reconciling controversies about the ‘global warming hiatus’. Nature 2017, 545, 41–47. [Google Scholar] [CrossRef]
- Shen, M.; Tang, Y.; Chen, J.; Zhu, X.; Zheng, Y. Influences of temperature and precipitation before the growing season on spring phenology in grasslands of the central and eastern Qinghai-Tibetan Plateau. Agric. For. Meteorol. 2011, 151, 1711–1722. [Google Scholar] [CrossRef]
- Xu, J.; Zhu, Y.; Meng, S.X.; Huang, X.; Piao, D.; Cui, G.S. Responses of Phenology by Climate Warming on Korean Peninsular in the Past Three Decades. J. Korean Chem. Soc. 2019, 10, 437–446. [Google Scholar] [CrossRef]
- Liu, F.; Chen, Y.; Shi, W.; Zhang, S.; Tao, F.; Ge, Q. Influences of agricultural phenology dynamic on land surface biophysical process and climate feedback. J. Geogr. Sci. 2017, 27, 1085–1099. [Google Scholar] [CrossRef]
- Liu, Y.; Qin, Y.; Ge, Q.; Dai, J.; Chen, Q. Reponses and sensitivities of maize phenology to climate change from 1981 to 2009 in Henan Province, China. J. Geogr. Sci. 2017, 27, 1072–1084. [Google Scholar] [CrossRef]
Figure 1.
(a) Distribution of vegetation, and (b) dry and wet regions of northeast Asia.

Figure 2.
Spatial patterns of long-term averaged (a) SOS, (b) EOS, and (c) GSL.

Figure 3.
Spatial distribution trend of SOS, EOS, and GSL during different time periods in northeast Asia (A and D represent the proportions of advanced and delayed pixels, respectively, and the black dots show the pixels with statistically significant phenological trends when p < 0.05. (a–c) represent the spatial distribution diagrams of the temporal change trends of spring and autumn phenology and growth season duration from 1982 to 2014, respectively; (d–f) represent the spring and autumn phenology and growth season duration from 1982 to 1998, respectively; (g–i) represent the spatial distribution diagrams of the temporal change trend of the spring and autumn phenology and the duration of the growing season from 1999 to 2014, respectively).

Figure 4.
The change trend of SOS and EOS pre-season climatic factors during different time periods in northeast Asia. (a–c) represent the change trend of SOS pre-season temperature, precipitation, and radiation during 1982–2014; (d–f) represent the change trend of SOS pre-season temperature, precipitation, and radiation during 1982–1998; (g–i) represent the change trend of SOS pre-season temperature, precipitation, and radiation during 1999–2014; (j–l) represent the EOS pre-season temperature, precipitation, and radiation during 1982–2014; (m–o) represent the EOS pre-season temperature, precipitation, and radiation during 1982–1998; (p–r) represent the EOS pre-season temperature, precipitation, and radiation during 1999–2014. Black dots represent significance.

Figure 5.
The spatial distribution and relative contribution diagrams of partial correlation between vegetation spring phenology and pre-season climatic factors during different time periods in northeast Asia. (a–c) represent pre-season temperatures; (d–f) represent pre-season precipitation; (g–i) represent pre-season radiation; and (j–l) represent the relative contribution of climatic factors to vegetation spring phenology during three time periods. Black dots represent significance.

Figure 6.
The spatial distribution and relative contribution diagrams of partial correlation between autumn vegetation phenology and pre-season climatic factors during different time periods in northeast Asia. (a–c) represent pre-season temperatures; (d–f) represent pre-season precipitation; (g–i) represent pre-season radiation; and (j–l) represent the relative contribution of climatic factors to spring vegetation phenology during three time periods. Black dots represent significance.

Figure 7.
Changes in the sensitivity of the SOS (EOS) to pre-season climatic factors of different vegetation types in northeast Asia before and after the warming interval. (a) Changes in the sensitivity of vegetation spring phenology to pre-season climatic factors from 1982 to 2014; (b) 1982 to 1998; and (c) 1999 to 2014. (d) Changes in the sensitivity of autumn phenology of vegetation to pre-season climatic factors from 1982 to 2014, (e) 1982 to 1998, and (f) 1999 to 2014. (Red represents temperature, blue represents precipitation, green represents solar radiation). * represents significance.

Disclaimer/Publisher’s Note: The statements, opinions and data contained in all publications are solely those of the individual author(s) and contributor(s) and not of MDPI and/or the editor(s). MDPI and/or the editor(s) disclaim responsibility for any injury to people or property resulting from any ideas, methods, instructions or products referred to in the content. |
© 2023 by the authors. Licensee MDPI, Basel, Switzerland. This article is an open access article distributed under the terms and conditions of the Creative Commons Attribution (CC BY) license (https://creativecommons.org/licenses/by/4.0/).
Share and Cite
MDPI and ACS Style
Wang, J.; Meng, S.; Zhu, W.; Xu, Z. Phenological Changes and Their Influencing Factors under the Joint Action of Water and Temperature in Northeast Asia. Remote Sens. 2023, 15, 5298. https://doi.org/10.3390/rs15225298
AMA Style
Wang J, Meng S, Zhu W, Xu Z. Phenological Changes and Their Influencing Factors under the Joint Action of Water and Temperature in Northeast Asia. Remote Sensing. 2023; 15(22):5298. https://doi.org/10.3390/rs15225298
Chicago/Turabian StyleWang, Jia, Suxin Meng, Weihong Zhu, and Zhen Xu. 2023. "Phenological Changes and Their Influencing Factors under the Joint Action of Water and Temperature in Northeast Asia" Remote Sensing 15, no. 22: 5298. https://doi.org/10.3390/rs15225298
Note that from the first issue of 2016, this journal uses article numbers instead of page numbers. See further details here.