Article

Assessing Rice Sheath Blight Disease Habitat Suitability at a Regional Scale through Multisource Data Analysis

1
College of Artificial Intelligence, Hangzhou Dianzi University, Hangzhou 310018, China
2
School of Information Engineering, Zhejiang University of Water Resources and Electric Power, Hangzhou 310018, China
*
Author to whom correspondence should be addressed.
These authors contributed equally to this work.
Remote Sens. 2023, 15(23), 5530; https://doi.org/10.3390/rs15235530
Submission received: 14 September 2023 / Revised: 5 November 2023 / Accepted: 20 November 2023 / Published: 28 November 2023

Abstract

:
Extensive occurrence of rice sheath blight has been observed in China in recent years due to agricultural practices and climatic conditions, posing a serious threat to rice production. Assessing habitat suitability for rice sheath blight at a regional scale can provide important information for disease forecasting. In this context, the present study aims to propose a regional-scale habitat suitability evaluation method for rice sheath blight in Yangzhou city using multisource data, including remote sensing data, meteorological data, and disease survey data. By combining the epidemiological characteristics of the crop disease and the Relief-F algorithm, some habitat variables from key stages were selected. The maximum entropy (Maxent) and logistic regression models were adopted and compared in constructing the disease habitat suitability assessment model. The results from the Relief-F algorithm showed that some remote sensing variables in specific temporal phases are particularly crucial for evaluating disease habitat suitability, including the MODIS products of LAI (4–20 August), FPAR (9–25 June), NDVI (12–20 August), and LST (11–27 July). Based on these remote sensing variables and meteorological features, the Maxent model yielded better accuracy than the logistic regression model, with an area under the curve (AUC) value of 0.90, overall accuracy (OA) of 0.75, and a true skill statistics (TSS) value of 0.76. Indeed, the results of the habitat suitability assessment models were consistent with the actual distribution of the disease in the study area, suggesting promising predictive capability. Therefore, it is feasible to utilize remotely sensed and meteorological variables for assessing disease habitat suitability at a regional scale. The proposed method is expected to facilitate prevention and control practices for rice sheath blight disease.

Graphical Abstract

1. Introduction

Rice sheath blight (RSB), caused by Thanatephorus cucumeris (Frank) Donk., is one of the most serious rice diseases in terms of occurrence area and damage in China, leading to significant impacts on the quality and yield of rice [1]. The occurrence and prevalence of RSB disease depend on favorable environmental conditions, such as high air temperature and humidity, as well as the suitable growth status of the host crop. The most favorable conditions for the growth of the pathogen are when the temperature reaches 28–30 °C and the relative humidity exceeds 70% [2]. Moreover, the planting density and nitrogen level of the rice plants have also been found to be associated with the disease occurrence [3,4]. The habitat suitability of crop diseases and pests provides a measure of the ecological circumstances that can satisfy the needs for their occurrence and prevalence. Therefore, the assessment of the habitat suitability is crucial for revealing the probability of disease occurrence, which, in turn, provides further insights into disease forecasting and prevention.
The habitat suitability that determines the distribution and prevalence of crop diseases and pests can be delineated by meteorological characteristics, geographical conditions, and the growth status of host crops [5,6]. Among these factors, meteorological data have been commonly used in disease forecasting due to their high availability. Gong et al. and Owusu et al. have predicted the spatial distributions of soybean and wheat blast in China using 19 bioclimatic variables derived from WorldClim [7,8]. However, meteorological data generally exhibit low resolutions and can reflect climatic conditions only at a large scale, without being able to indicate the spatial heterogeneity of the habitat conditions of crop diseases and pests [9,10]. In contrast, remote sensing data can provide more detailed and spatial continuous information on crop planting and growing status, as well as some environmental conditions, which can complement meteorological data to provide comprehensive information on habitat suitability at a regional scale [11,12]. In recent years, some attempts have been made to combine meteorological and remote sensing data for evaluating the habitat conditions of crop diseases and pests. Moara et al. integrated MODIS products, including land surface temperature (LST), enhanced vegetation index (EVI), and normalized difference vegetation index (NDVI), with precipitation data to build a forecasting model for sand flies and predict their distribution in Brazil [13]. Andreas et al. [14] integrated NDVI and LST data from Landsat-TM8 images along with air humidity data to predict the distribution of beetles within a regional ecosystem—a mountainous protected area, achieving an area under the curve (AUC) exceeding 0.7. These studies demonstrate the possibility of integrating multisource remote sensing data and meteorological data for the effective characterization of habitat information.
To eliminate redundant features before classification, and to reduce the complexity of disease forecasting models, some statistical approaches and optimization methods can be applied in the modeling to form a feature set with high sensitivity and less redundancy [15]. The Relief-F feature selection algorithm was found to be an efficient tool for selecting features, which is important for improving the performance of the learning algorithm [16]. Furthermore, it is also important to realize that the influence of the habitat features may change over time [17], but few studies have investigated the temporal effect in assessing disease habitat suitability. Therefore, to enhance the relevancy between the habitat variables and the occurrence probability of crop diseases and pests, it is necessary to consider the temporal effect in the feature selection process.
In addition to the optimized habitat features, the modeling approach is also important to develop a concise and robust habitat suitability assessment model. There are different forms of models that can potentially be applied in the habitat suitability assessment of crop diseases and pests, including statistical models, machine learning models, and ecological niche models [16,18,19]. Based on some meteorological factors, Sun et al. [20] used a stepwise regression model, backpropagation neural networks, and support-vector machines to evaluate the habitat suitability of the stripe virus in rice, which yielded corresponding accuracies of 77.35%, 93.75%, and 98.95%, respectively. Meanwhile, for ecological niche models, by employing Maxent and the Genetic Algorithm for Rule-set Prediction (GARP), Stephanie et al. [21] successfully predicted the potential distribution of the fall armyworm in invaded (Canada, United States) and native (East Asia) regions. Amanda et al. [22] developed the presence-only Maxent model for invasive cheatgrass distribution in Rocky Mountain National Park, Colorado, USA, fitted with limited data derived from the remotely sensed MODIS images, and compared with a presence–absence GLM (generalized linear model). The AUC of the Maxent model reached 0.96, which was significantly higher than that of the GLM model (0.83). This result indicates that Maxent is an appropriate model, particularly when model construction is supported by limited resources.
Unlike the habitat evaluation works at a large scale (i.e., national, continental, or even global), the disease habitat suitability assessment model at the regional scale can provide important information to facilitate disease management, early warning, and resource allocation. Currently, despite the fact that the regional-level habitat suitability assessment models for RSB disease are still lacking, the tight linkage between the habitat factors and the disease occurrence implies the possibility of combining meteorological and remote sensing data to conduct the disease habitat suitability analysis at a regional level. Here, we hypothesize that the disease habitat suitability assessment models can be driven by multisource information, including remote sensing and meteorological variables, and yield the potential distribution information of the disease at the regional scale for RSB disease. The main objectives of this study are as follows:
(1)
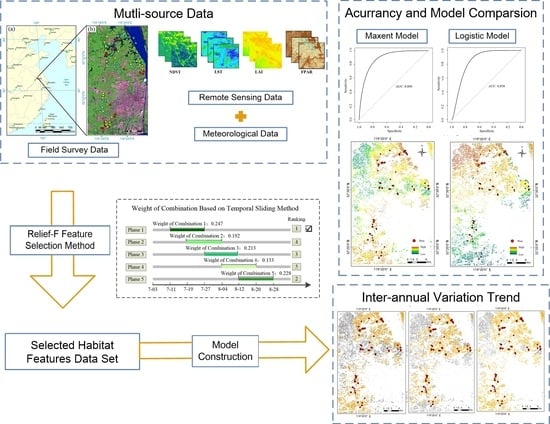
To indicate the habitat characteristics of RSB, different types of satellite remote sensing data and meteorological data are used and analyzed. The Relief-F algorithm is adopted for feature selection, and a temporal optimization method is proposed.
(2)
Based on the optimized habitat features at appropriate stages, the habitat suitability assessment model for RSB is established at the regional level. The Maxent and logistic regression models are used and compared.
(3)
With the aid of the field survey data on disease occurrence, the accuracy and effectiveness of the established models are assessed. In addition, the spatial distribution patterns of the predicted risk areas in different years (2018–2020) are analyzed.

2. Materials and Methods

2.1. Study Area

The study area was located in Yangzhou, Jiangsu Province, China (119°14′–119°30′E; 32°15′–32°41′N) (Figure 1), which is a representative rice cultivation region in the middle and lower reaches of the Yangtze River. As a major plain area in China, this region is mainly characterized by relatively high temperatures, abundant rainfall, and high humidity in summer, which is favorable for RSB disease [23,24]. Therefore, the disease is frequent in the study area, thus providing an ideal scenario for habitat suitability analysis.

2.2. Survey Data

2.2.1. Meteorological and Field Survey Data

The field disease survey was conducted in three consecutive years (2018–2020). The selected survey points were generally evenly distributed within the region (Figure 1), and the GPS coordinates were recorded at the center of each plot. In addition, information on RSB disease and phenology was recorded in each survey plot. The disease survey was conducted by an experienced investigator of plant pathology. By carefully checking the corresponding symptoms of RSB on rice leaves or stalks, the occurrence of the disease was recorded as 0 (absence) or 1 (presence). The numbers of investigated plots in the study area in 2018, 2019, and 2020 were 98, 81, and 137, respectively. The meteorological dataset included precipitation, temperature, and the minimum temperature of the coldest month for China, generated by Peng, S. (2020) [25]. The dataset was processed using a delta spatial downscaling scheme based on the global 0.5° climate dataset released by the CRU and the global high-resolution climate dataset published by WorldClim, yielding data with a spatial resolution of 1 km. Additionally, it was validated using 496 independent meteorological observation points, ensuring the credibility of the validation results. In this study, the meteorological data from June to August in 2018–2020 were used, corresponding to the period from the tillering stage to the heading stage of paddy rice. The RSB undergoes a rapid expansion within this period. The daily meteorological parameters were averaged to obtain the monthly data and were used as habitat meteorological features in constructing the habitat suitability assessment models. In addition, considering the temperature in winter also has a significant impact on the overwintering pathogen quantity, so the minimum temperature of the coldest month (January) in the winter season was also included [26].

2.2.2. Remote Sensing Data

As a form of continuous Earth observation data, satellite remote sensing data have the merits of high availability and standardization, making them valuable sources of information for assessing the habitat suitability of crop diseases and pests. Considering the sensitivity of RSB to temperature and crop growth status, the MODIS vegetation products and land surface temperature (LST) product were used as influencing factors of RSB habitat (Table 1). The MODIS LST product (MOD11A2/MYD11A2, 1 km resolution) reflects the respiration and transpiration of the rice plants, as well as the microclimatic conditions in the fields [27], which are crucial for environmental monitoring and agricultural management and reflect the thermal conditions in the rice fields. On the other hand, the MODIS vegetation products (MOD15A2, 250 m resolution) used in this study included the net primary productivity (NPP), the fraction of photosynthetically active radiation (FPAR), the leaf area index (LAI), and the NDVI. The LAI directly reflects the growth status of rice plants from jointing to maturity, while the NPP indicates the growth of rice plants and the organic matter accumulation process. Meanwhile, the FPAR represents the fraction of incident radiation above the crop canopy used for plant photosynthesis, reflecting the physiological activity of the host crop [28,29]. The NDVI is a classic vegetation index reflecting the comprehensive vigor and nutritional status of the crop plants [30]. Moreover, to extract the rice-planting area at a finer resolution, some moderate-resolution remote sensing data (i.e., Sentinel-1 and Sentinel-2 images) were also used in this study for rice mapping.

2.3. Methods

To construct a habitat suitability assessment model for RSB at the regional scale, the Relief-F method was performed on habitat features that were extracted from multisource data (i.e., remote sensing, meteorological data) to obtain the optimized features for some specific stages. Based on these features, the habitat suitability assessment model was constructed according to the Maxent and logistic regression methods. The overall flowchart of the modeling process is illustrated in Figure 2.

2.3.1. Selection of Remote Sensing Habitat Features

In this study, considering the high information redundancy of satellite remote-sensing-based RSB habitat variables and their potential impacts on the disease occurrence at different rice growth stages, the Relief-F algorithm was used to optimize the remote sensing habitat features. In addition, the sensitivity analysis was also conducted at different stages to determine the appropriate time window of features for habitat suitability assessment.
In the Relief-F algorithm’s feature selection process, a rigorous statistical analysis was employed, focusing on the correlation between features and target classes, to allocate weights. Through an examination of the variance differences between 0 and 1 samples, the algorithm can effectively discern which features play more pivotal roles in delineating the disease suitability, and these critical features were assigned higher weights [16]. This analysis aimed at identifying the most statistically significant feature combinations. In particular, given the multiple consecutive temporal remote sensing features can better reflect the continuity and cumulative effects of the habitat conditions of crop diseases, whereas the single-phase remote sensing data are prone to containing some random errors, an in-depth statistical analysis was conducted to evaluate temporal patterns and assess remote sensing habitat features within various time windows. For the FPAR, LAI, and LST data with 8-day intervals, three consecutive phases were grouped, whereas for the NDVI data with a 16-day interval, two consecutive phases were grouped. The remote sensing habitat features in different time windows were subsequently weighted and ranked, and the combinations with the highest contribution were selected as input remote sensing habitat features, as shown in Table 2.

2.3.2. Extraction of Rice-Planting Area

Prior to the modeling process, it is necessary to extract the planting area of the host crop to serve as a mask layer in the subsequent analysis. In this study, given that the study area was characterized by cloudy and rainy weather conditions, we employed a rice classification method that was previously proposed by our research group. This method features the integration of optical and microwave remote sensing data that are specifically optimized for cloudy and rainy regions [31]. The rice classification results over 2018–2020 were obtained using the Sentinel-1 and Sentinel-2 images. In this process, the accurate field parcel boundary information is obtained according to a single-phase clear-sky optical image and a multiscale image segmentation parameter optimization algorithm, providing basic units for the object-based classification using the synthetic-aperture radar (SAR) images. The SAR image time-series data were applied to capture the growing dynamics of paddy rice, thus enabling the stable and accurate extraction of the rice-planting area in a cloudy and rainy region. The detailed procedure of the method can be found in the work of Shen et al. [31]. The obtained rice classification map can be used as a mask layer for subsequent habitat analysis.

2.3.3. RSB Habitat Suitability Modeling

In this study, the Maxent and logistic regression models were used to construct the habitat suitability assessment model for RSB disease based on the optimal remote sensing and meteorological habitat features. The logistic regression model is a classic statistical model, which has the merits of simple structure and high interpretability. As a multivariate quantitative analysis method, the logistic model has been extensively applied in disease epidemiology for regression analysis of binary dependent variables. This method was used in this study to assess the relationships between habitat variables and the occurrence probability of RSB, thereby predicting the disease risk distribution in the region. In this process, the pixel values of the seven environmental variables (Table 1) were used as independent variables, whereas the presence or absence of RSB (corresponding to values of 1 or 0, respectively) in each pixel was used as a dependent variable.
The logistic regression model can be expressed by the following equation:
P = e x p ( α + β 1 X 1 + β 2 X 2 + . . . + β m X m ) 1 + e x p ( α + β 1 X 1 + β 2 X 2 + . . . + β m X m )
where P denotes the potential distribution probability, Xi denotes the habitat variable, α is a constant, and βm denotes the logistic regression coefficients. Based on the combination of the habitat variables, the spatial distribution probability map of rice sheath blight can be obtained. This nonlinear model can consider the combined influence of multiple habitat variables and generate the distribution probability of the disease under different environmental conditions.
Meanwhile, as a physical-based model, the Maxent model has a clear ecological principle and is founded on solid probability theory. The Maxent model seeks to establish a linkage between the disease occurrence and the habitat feature maps, and to generate a forecasting result of the potential disease distribution area based on the maximum entropy rule [32]. The Maxent model outputs the occurrence probability (0–100%) value. To convert this result to a binary result, the average of the minimum and maximum probability values was applied as a threshold. In this study, both methods were used and compared in modeling the habitat suitability of RSB disease. In the Maxent modeling, the “Replicates” parameter was set to 5, indicating the utilization of a fivefold cross-validation approach, with the highest receiver operating characteristic (ROC) value selected for our final predictions; the random seed was set, allocating 25% as the testing dataset while using 75% for training. Regarding the model output format, we retained the default setting as “logistic”. This output was chosen for its ease of interpretation, as it provides probability estimates between 0 and 1 for presence. Finally, the “regularization multiplier” was set to its default value of 1. The abovementioned parameters were determined by referring to some empirical settings [33,34] and were adjusted by preliminary tests.

2.3.4. Validation of the Disease Habitat Suitability Assessment Models

Based on the masked layers of optimized disease habitat features, the disease habitat suitability assessment models were established according to the logistic regression and Maxent methods, respectively. By comparing the model-forecasted results and the surveyed disease occurrence data, the performance of the models was evaluated and compared. The area under the curve (AUC), overall accuracy (OA) coefficient, and true skill statistics (TSS) value were used as validation indices. We selected 75% of the disease survey data as training data, and the remaining 25% were used as validation data.
The OA is used to evaluate the overall accuracy of a classification model, calculated by comparing the predicted results of the model with the actual observations and dividing the number of correctly classified samples by the total number of samples to obtain the accuracy rate. The true skill statistic (TSS), derived from sensitivity and specificity computed using species presence and absence data, stands out as the most pragmatic metric in model assessment [35]. The AUC is the area under the ROC curve, which is used to evaluate the performance of a model at different thresholds. The ROC curve is discretized into a series of points (TPR, FPR), where TPR represents the true positive rate and FPR represents the false positive rate [36]. The calculation formula for AUC can be written as follows:
A U C = + T P R ( F P R 1 ( t ) ) d t
where FPR represents the proportion of actual negative samples that are incorrectly classified as positive. A higher AUC value indicates that the model achieves a better balance between different TPR and FPR values, demonstrating superior classification capability.
In this study, the Maxent model was analyzed using the Maxent (v.3.4.1) software, and the logistic regression model was analyzed in Minitab18. The occurrence probability (0–100%) of RSB at each pixel and spatial scale was calculated using raster calculations. To convert the outputs of the Maxent and logistic regression models to the binary prediction (i.e., 0 indicates that the habitat is not suitable, while 1 indicates that the habitat is suitable), a threshold of 0.5 was set. This threshold is often used as the default threshold for binary classification [37,38]. Given that both algorithms are probability-based methods, to assign samples to the class with relatively higher probability, the threshold was set at the middle point between 0% and 100%. In this case, if the model output exceeded 0.5, the sample would be classified as “1” (i.e., suitable habitat) given that the positive class holds higher probability, and vice versa. The occurrence probability maps were generated using ArcGIS (v.10.7) software. Then, the OA and AUC were computed using R software (v. 4.2.1).

3. Results

3.1. Optimization of RSB Habitat Features

When analyzing the relationships between the habitat features (i.e., NDVI, FPAR, LST and LAI; for details, please see Section 2.3) and the RSB occurrence via the Relief-F algorithm, the mean monthly precipitation, LST, and LAI attained higher weights compared to the other habitat variables. In addition to the selection of habitat features, further analysis was conducted on the determination of the sensitive time windows of the features. According to the Relief-F analysis, the weights of the habitat features at multiple consecutive phases were first summed. These summed weights, corresponding to different time windows, are demonstrated in Figure 3. Eventually, for each remote sensing habitat feature, the time window with the highest value was adopted as an input variable in the subsequent modeling process, and the combination of habitat factors was selected along temporal phases in a sliding manner (Figure 4), including 4–20 August for LAI, 9–25 June for Fpar, 12–20 August for NDVI, and 11–27 July for LST.
The spatial distribution of rice fields in the region is crucial in conducting the habitat suitability assessment for RSB. Considering the data availability in the cloudy and rainy regions, in this study, the rice mapping method that we used was established based on “single-phase optical image + multiphases SAR images”, which could be stably acquired in the study area. By taking advantage of the optical and microwave remote sensing data, this method achieved overall accuracy (OA) and kappa coefficient values of 94.64% and 0.92, respectively, suggesting the planting area of the host crop can be accurately extracted in the region (Figure 5). Such a map of rice fields was then used as a background mask layer to extract all disease habitat feature layers, thereby limiting the modeling analysis to these areas and avoiding possible confusion in this process.

3.2. Evaluation of the Habitat Suitability Model for RSB

Based on the optimized habitat features (Figure 6), the habitat suitability models for RSB were established using the logistic regression and Maxent methods (Figure 7). The results showed that both types of models yielded relatively high accuracy. By observing the interannual variations in the model output parameters (Table 3), we found that the Maxent model yielded an average AUC of 0.879, significantly higher than that of the logistic model (AUC = 0.776). For the results of TSS, the average TSS for the Maxent model (0.66) was also higher than that of the logistic model (0.62). In terms of overall accuracy (OA), both models produced OA ranging between 0.7 and 0.9 over the three years. However, both models exhibited higher output accuracy in 2020. This could be attributed to the higher number of survey points and richer dataset in 2020 (n = 98, 81, and 137 for 2018, 2019, and 2020, respectively), resulting in better forecasting capacity of the models. Further analysis revealed that the inconsistency between AUC and OA might be due to the imbalance in the numbers of diseased and healthy samples in the survey data, with a higher proportion of diseased samples and a relatively small proportion of healthy samples (24%). For example, although the Maxent method had a high AUC value of 0.94 in 2019, its OA was relatively low (0.70). Therefore, in the evaluation results, there is a certain portion of incorrectly classified RSB area, indicating a likelihood of false negative error. This issue may pose a risk of inaccurate disease forecasting and may further affect proper control practices. Comparatively, the AUC is more reasonable, especially for the situation of imbalanced samples between classes, as it considers both false negatives and false positives in evaluating the model’s performance. Hence, in this study, the Maxent model, with its relatively high AUC value, is recommended for assessing the habitat suitability of RSB.

3.3. Distribution Pattern of the RSB Habitat Suitability Results

In this study, given that the disease habitat suitability assessment models are driven by spatial continuous data, the outputs of the models can reflect the spatial variation information of the habitat suitability degrees. In comparing the spatial distributions of the habitat suitability yielded from the logistic model and the Maxent model (Figure 8), the overall spatial patterns were generally consistent, showing that the habitat in the northern part is more suitable for RSB than the habitat in the southern part of the study area. Based on the model prediction, the most suitable area for RSB is located in the northwestern part of Hanjiang District, Yangzhou, along the Beijing–Hangzhou Grand Canal. Moreover, the results of the two models indicated moderate-to-high habitat suitability for RSB in areas around Pingshan Township in Yangzhou, consistent with the surveys conducted by the plant protection departments in Yangzhou over the years. By looking through the habitat variables in these areas that suffered frequent disease infection, we found that the FPAR, LAI, and LST values were relatively higher in these areas than in other areas. Such a pattern implies relatively high planting density and temperature, i.e., suitable conditions for the occurrence of RSB. Despite the fact that the meteorological conditions may be relatively similar in different parts of the region, the integration of multisource satellite remote sensing data and meteorological data can significantly enhance the ability to exhibit spatially heterogeneous information about disease habitat, achieving parcel-level disease habitat suitability assessment. Such detailed spatial information could play an important role in effective disease forecasting and control in the study area. By applying the Maxent model to the entire region in each year from 2018 to 2020, the interannual changes in habitat suitability were determined, as shown in Figure 9. According to the results, there was an increasing trend of suitable habitat areas for RSB in the southwestern part of the study area over the 2018–2020 period, particularly along the Grand Canal River in Hanjiang District. It is worth noting that the suitability for RSB substantially increased in 2020 compared to the previous two years. In this study, reasonable habitat assessment distribution results were obtained for small-scale scenarios. As shown in Figure 9, the remote sensing habitat features can exhibit the spatial differences in habitat conditions for RSB, thereby enabling the assessment of habitat suitability at the parcel level within the region.

4. Discussion

The purpose of this study was to explore the potential of combining meteorological data and multisource remote sensing data for modeling the habitat suitability of RSB. The Relief-F algorithm employed in this study is better suited to the optimization of feature sets from various candidate features that have complicated interrelations [39]. In particular, the temporal phases of the habitat features were determined according to this algorithm. In this result, a relatively high level of sensitivity was observed in mid-to-late August for LAI. Indeed, rice in the middle and lower reaches of the Yangtze River during this period is often in the jointing to heading stages. A high LAI indicates dense vegetation cover and sufficient plant nutrition, forming a favorable host condition for the occurrence of RSB. Meanwhile, for the NDVI, a trend of gradual increase in sensitivity was clearly observed from June to August. As the vegetation index mainly reflects the general biomass and vigor of rice plants, this result may be due to the NDVI product containing weak vegetation signals in the early stages yet carrying strong vegetation signals in the late stages. In addition, the FPAR showed great sensitivity during the early stages of the rice, particularly in the transplanting stage. The high emergence rates of rice and the cumulative effect of air temperature during the early growth stages can contribute to the formation of relatively large canopy populations of rice, which are associated with suitable microclimate conditions for infection with RSB. It is worth noting that the combination of multisource remote sensing and meteorological information can provide a multidimensional perspective on the habitat conditions of diseases and, thus, effectively characterize the habitat requirements of RSB [40].
In the process of habitat suitability assessment, two model methods were compared. The AUC accuracy indicator demonstrated that the Maxent model yielded higher predictive accuracy compared to the logistic model. The superiority of the Maxent model may be attributed to its ability to explore and fully utilize the information from multisource remote sensing and meteorological data. The differences in the model performance can be reflected from the assigned weights of the habitat variables. For the logistic regression model, the weights of the monthly precipitation and monthly temperature in June (i.e., the jointing stage of rice) were higher than those of the other habitat variables. In contrast, the Maxent model showed higher weights for monthly precipitation and LST in August (i.e., the heading stage of rice) than the other habitat variables. From the perspective of plant disease epidemiology, the occurrence and spread of RSB is likely to be influenced by relatively high temperature and humidity conditions in the heading stage (around August in the study area). Therefore, the selection of the habitat variables in the Maxent model is reasonable in reflecting the actual rice sheath blight onset conditions, which is beneficial for constructing a comprehensive habitat suitability assessment model.
The potential distribution of RSB predicted by the Maxent model indicated high performance of the model, as it included the current actual distribution areas for this species. For example, potential areas were found in the northwestern part of Hanjiang District, Yangzhou, along the Beijing–Hangzhou Grand Canal; this area is historically a high-risk area for RSB. The water system of the Grand Canal provides convenient irrigation conditions for the neighboring rice fields, prompting the reproduction of the RSB pathogens and providing ideal conditions for infection and disease spread in the waterlogged rice fields. The severity of RSB disease exhibited an escalating trend over the three years, with a notable upsurge in 2020 compared to the preceding two years. This surge in disease incidence is possibly linked to the gradual increase in temperature over the recent years. Data from meteorological stations in Yangzhou revealed that, in 2019, during the summer period (June to August), the average temperature reached 27.4 °C, marking an increase of 0.6 °C compared with the same period in 2018. The average temperature continued to rise in 2020, reaching 0.3 °C higher than the long-term average, and was recorded as the highest annual average temperature in nearly a decade. This change provided more ideal circumstances for the propagation and infection of the pathogen in this region.
In this study, we preliminarily validated the feasibility of integrating multisource data (i.e., satellite remote sensing and meteorological data) and models (e.g., Maxent etc.) for assessing the habitat suitability of RSB at a regional scale. However, there are still some limitations in this work. Given the complexity of the disease’s influencing factors, the features category that we used to delineate the habitat of RSB is still limited, and the spatial resolution of remote sensing data is expected to be improved. Moreover, the robustness of the model needs to be further assessed. Moreover, there is still a gap between the model output and the disease prevention decision-making process. Therefore, to deal with these limitations, further investigations are expected: (1) To expand the types of data products to achieve comprehensive disease habitat suitability assessment. For instance, some remote sensing or geographical data that reflect soil moisture and crop phenological information could be included for delineating the disease habitat characteristics. (2) In addition, some data fusion and model optimization approaches need to be explored and introduced in the modeling process to improve the reliability of the habitat suitability assessment at the regional scale. (3) The detailed spatial information of disease habitat suitability can provide an important reference that is expected to be coupled with the disease forecasting model. The disease forecasting results can be further used in the decision-making process for disease control. Therefore, some efforts are needed to further explore methods of model integration and achieve effective plant protection practices at the regional scale.

5. Conclusions

In constructing a habitat suitability assessment model for the RSB disease, the present study demonstrated the feasibility of combining multisource data such as remote sensing and meteorological data for assessing disease habitat suitability at the regional scale. The main conclusions of this study are as follows:
(1)
The habitat features of RSB can be characterized by multisource remote sensing and meteorological data. The optimal habitat features with appropriate time windows were obtained according to the Relief-F algorithm.
(2)
The best habitat suitability assessment model for RSB was established using the Maxent algorithm, with an AUC value of 0.879 and a TSS value of 0.73. The heterogeneity of habitat suitability within a region can be reflected from the output of the model, which indicates the potential distribution of RSB in the region.
(3)
The established disease habitat suitability assessment model is able to generate reasonable predictions that are highly consistent with the actual spatial and temporal variation trends of RSB disease according to the field investigation records of the disease. Such information is essential for the forecasting, control, and management of RSB disease.

Author Contributions

J.Z., H.L. and Y.T. conceptualized the idea of the study; L.Y. annotated, scrubbed, and maintained the research data; H.L. analyzed the results; J.Z. supported the project; J.Z. performed the experiments; J.Z., H.L. and L.Y. designed the methodology; J.Z. and H.L. managed the research activity; L.Y. provided the study materials and other analysis tools; H.L. developed the software; H.L., X.Z. and H.Q. led the research activity planning. H.L. produced the validation dataset; J.Z. and H.L. prepared the work for publication; H.L. wrote the manuscript; J.Z. and H.M. contributed to the revision of the manuscript. All authors have read and agreed to the published version of the manuscript.

Funding

This research was funded by the National Key R&D Program of China, grant number 2022YFD2000100; National Natural Science Foundation of China, grant number 42071420; and the Major Special Project for 2025 Scientific and Technological Innovation (Major Scientific and Technological Task Project in Ningbo City), grant number 2021Z048; and the Graduate Scientific Research Foundation of Hangzhou Dianzi University, Grant CXJJ2022151.

Data Availability Statement

Some of the data are available upon reasonable request.

Conflicts of Interest

The authors declare no conflict of interest.

References

  1. Kim, K.H.; Cho, J.; Lee, Y.H.; Lee, W. Predicting potential epidemics of rice leaf blast and sheath blight in South Korea under the RCP 4.5 and RCP 8.5 climate change scenarios using a rice disease epidemiology model, EPIRICE. Agric. For. Meteorol. 2015, 203, 191–207. [Google Scholar] [CrossRef]
  2. Savary, S.; Castilla, N.P.; Willocquet, L. Analysis of the spatiotemporal structure of rice sheath blight epidemics in a farmer’s field. Plant Pathol. 2001, 50, 53–68. [Google Scholar] [CrossRef]
  3. Castilla, N.P.; Leaño, R.M.; Elazhour, F.A. Effects of Plant Contact, Inoculation Pattern, Leaf Wetness Regime, and Nitrogen Supply on Inoculum Efficiency in Rice Sheath Blight. J. Phytopathol. 1996, 144, 187–192. [Google Scholar] [CrossRef]
  4. Yellareddygari, S.K.R.; Reddy, M.S.; Kloepper, J.W. Rice Sheath Blight: A Review of Disease and Pathogen Management Approaches. J. Plant Pathol. Microbiol. 2014, 5, 1–4. [Google Scholar]
  5. Su, P.; Liao, X.L.; Zhang, Y.; Huang, H. Influencing factors on rice sheath blight epidemics in integrated rice-duck system. J. Integr. Agric. 2012, 11, 1462–1473. [Google Scholar] [CrossRef]
  6. Shen, Y.Y.; Zhang, J.C.; Shen, D.; Tian, Y.Y.; Huang, W.J.; Yang, X.D. Research progress on habitat suitability assessment of crop diseases and pests by multi-source remote sensing information. Chin. J. Eco-Agric. 2023, 31, 1012–1025. [Google Scholar]
  7. Gong, L.J.; Li, X.F.; Wu, S.; Jiang, L.Q. Prediction of potential distribution of soybean in the frigid region in China with Maxent modeling. Ecol. Inform. 2022, 72, 101834. [Google Scholar] [CrossRef]
  8. Owusu, F.A.; Philipe, G.C.S.; Ricardo, S.S.; Paulo, A.S.J.; Marcelo, C.P.; Jonathan, O.O.; Mamoudou, S.; Sunday, E.; Christian, B. A machine learning algorithm-based approach (Maxent) for predicting invasive potential of Trioza erytreae on a global scale. Ecol. Inform. 2022, 71, 101792. [Google Scholar]
  9. Zheng, J.Z.; Wang, W.G.; Ding, Y.M.; Liu, G.D.; Xing, W.Q.; Cao, X.C.; Chen, D. Assessment of climate change impact on the water footprint in rice production: Historical simulation and future projections at two representative rice cropping sites of China. Sci. Total Environ. 2020, 709, 136190. [Google Scholar] [CrossRef]
  10. Gbogbo, A.Y.; Kouakou, B.K.; Dabo-Niang, S.; Zoueu, J.T. Predictive model for airborne insect abundance intercepted by a continuous wave Scheimpflug lidar in relation to meteorological parameters. Ecol. Inform. 2022, 68, 101528. [Google Scholar] [CrossRef]
  11. Ma, H.Q.; Huang, W.J.; Jing, Y.S.; Dong, Y.Y.; Zhang, J.C.; Nie, C.W.; Tang, C.C.; Zhao, J.L.; Huang, L.S. Wheat powdery mildew remote sensing monitoring based on the AdaBoost model and mRMR algorithm. J. Agric. Eng. 2017, 33, 162–169. [Google Scholar]
  12. Zhang, J.C.; Liu, P.; Wang, B.; Zhang, X.X.; Huang, W.J.; Wu, K.H. Analysis of spectral resolution impact in the inversion of plant physicochemical parameters based on continuous wavelet analysis. J. Infrared Millim. Waves 2018, 37, 753–760. [Google Scholar]
  13. Rodgers, M.S.M.; Bavia, M.E.; Fonseca, E.O.L.; Cova, B.O.; Silva, M.M.N.; Carneiro, D.D.M.T.; Cardim, L.L.; Malone, J.B. Ecological niche models for sand fly species and predicted distribution of Lutzomyia longipalpis (Diptera: Psychodidae) and visceral leishmaniasis in Bahia state. Env. Monit Assess. 2019, 191 (Suppl. S2), 331. [Google Scholar]
  14. Dittrich, A.; Roilo, S.; Sonnenschein, R.; Cerrato, C.; Ewald, M.; Viterbi, R.; Cord, A.F. Modelling Distributions of Rove Beetles in Mountainous Areas Using Remote Sensing Data. Remote Sens. 2020, 12, 80. [Google Scholar] [CrossRef]
  15. Hancer, E.; Xue, B.; Zhang, M.J. Differential evolution for filter feature selection based on information theory and feature ranking. Knowl.-Based Syst. 2018, 140, 103–119. [Google Scholar] [CrossRef]
  16. Urbanowicz, R.J.; Meeker, M.; La Cava, W.; Olson, R.S.; Moore, J.H. Relief-based feature selection: Introduction and review. J. Biomed. Inform. 2018, 85, 189–203. [Google Scholar] [CrossRef]
  17. Huang, W.J.; Shi, Y.; Dong, Y.Y.; Ye, H.C.; Wu, M.Q.; Cui, B.; Liu, L.Y. Progress and prospects of crop diseases and pests monitoring by remote sensing. Smart Argric. 2019, 1, 1–11. [Google Scholar]
  18. Solís-Montero, L.; Vega-Polanco, M.; Vázquez-Sánchez, M.; Suárez-Mota, M.E. Ecological niche modeling of interactions in a buzz-pollinated invasive weed. Glob. Ecol. Conserv. 2022, 39, e02279. [Google Scholar] [CrossRef]
  19. Store, R.; Jokimaki, J.A. GIS-based multi-scale approach to habitat suitability modeling. Ecol. Model. 2003, 169, 1–15. [Google Scholar] [CrossRef]
  20. Sun, S.S.; Bao, Y.X.; Lu, M.H.; Liu, W.; Xie, X.Z.; Wang, C.Z.; Liu, W.C. A comparison of models for the short-term prediction of rice stripe virus disease and its association with biological and meteorological factors. Acta Ecol. Sin. 2016, 36, 166–171. [Google Scholar] [CrossRef]
  21. Sobek-Swant, S.; Kluza, D.A.; Cuddington, K.; Lyons, D.B. Potential distribution of emerald ash borer: What can we learn from ecological niche models using Maxent and GARP? For. Ecol. Manag. 2012, 281, 23–31. [Google Scholar] [CrossRef]
  22. West, A.M.; Kumar, S.; Brown, C.S.; Stohlgren, T.J.; Bromberg, J. Field validation of an invasive species Maxent model. Ecol. Inform. 2016, 36, 126–134. [Google Scholar] [CrossRef]
  23. Zhang, L.W.; Huang, J.F.; Guo, R.F.; Li, X.X.; Sun, W.B.; Wang, X.Z. Spatio-temporal reconstruction of air temperature maps and their application to estimate rice growing season heat accumulation using multi-temporal MODIS data. J. Zhejiang Univ. 2013, 14, 144–161. [Google Scholar] [CrossRef] [PubMed]
  24. Singh, P.; Mazumdar, P.; Harikrishna, J.A.; Babu, S. Sheath blight of rice: A review and identification of priorities for future research. Planta 2019, 250, 1387–1407. [Google Scholar] [CrossRef] [PubMed]
  25. Peng, S.Z.; Ding, Y.X.; Wen, Z.M.; Chen, Y.M.; Cao, Y.; Ren, J.Y. Spatiotemporal change and trend analysis of potential evapotranspiration over the Loess Plateau of China during 2011–2100. Agric. For. Meteorol. 2017, 233, 183–194. [Google Scholar] [CrossRef]
  26. Zheng, T.; Sun, J.Q.; Shi, X.J.; Liu, D.L.; Sun, B.Y.; Deng, Y.J.; Zhang, D.L.; Liu, S.M. Evaluation of climate factors affecting the quality of red huajiao (Zanthoxylum bungeanum maxim.) based on UPLC-MS/MS and Maxent model. Food Chem. 2022, 16, 100522. [Google Scholar] [CrossRef] [PubMed]
  27. Hu, T.; Roujean, J.L.; Cao, B.; Mallick, K.; Boulet, G.; Li, H.; Xu, Z.; Du, Y.; Liu, Q. Correction for LST directionality impact on the estimation of surface upwelling longwave radiation over vegetated surfaces at the satellite scale. Remote Sens. Environ. 2023, 295, 113649. [Google Scholar] [CrossRef]
  28. Xue, S.B.; Ma, B.; Wang, C.G.; Li, Z.B. Identifying key landscape pattern indices influencing the NPP: A case study of the upper and middle reaches of the Yellow River. Ecol. Model. 2023, 484, 110457. [Google Scholar] [CrossRef]
  29. Machwitz, M.; Gessner, U.; Conrad, C.; Falk, U.; Richters, J.; Dech, S. Modelling the Gross Primary Productivity of West Africa with the Regional Biomass Model RBM+, using optimized 250m MODIS FPAR and fractional vegetation cover information. Int. J. Appl. Earth Obs. Geoinf. 2015, 43, 177–194. [Google Scholar]
  30. Caruso, G.; Palai, G.; Tozzini, L.; D’Onofrio, C.; Gucci, R. The role of LAI and leaf chlorophyll on NDVI estimated by UAV in grapevine canopies. Sci. Hortic. 2023, 322, 112398. [Google Scholar] [CrossRef]
  31. Shen, Y.; Zhang, J.; Yang, L.; Zhou, X.X.; Li, H.Z.; Zhou, X.J. A Novel Operational Rice Mapping Method Based on Multi-Source Satellite Images and Object-Oriented Classification. Agronomy 2022, 12, 3010. [Google Scholar] [CrossRef]
  32. Du, B.; Wei, J.; Lin, K.; Lu, L.; Ding, X.; Ye, H.; Huang, W.; Wang, N. Spatial and Temporal Variability of Grassland Grasshopper Habitat Suitability and Its Main Influencing Factors. Remote Sens. 2022, 14, 3910. [Google Scholar] [CrossRef]
  33. Elith, J.; Kearney, M.; Phillips, S. The art of modelling range-shifting species. Methods Ecol. Evol. 2010, 1, 330–342. [Google Scholar] [CrossRef]
  34. Mariya, S.; Robert, P. Estimating optimal complexity for ecological niche models: A jackknife approach for species with small sample sizes. Ecol. Model. 2013, 269, 9–17. [Google Scholar]
  35. Allouche, O.; Tsoar, A.; Kadmon, R. Assessing the accuracy of species distribution models: Prevalence, kappa and the true skill statistic (TSS). J. Appl. Ecol. 2006, 43, 1223–1232. [Google Scholar] [CrossRef]
  36. Lobo, J.M.; Jiménez-valverde, A.; Real, R. AUC: A Misleading Measure of the Performance of Predictive Distribution Models. Glob. Ecol. Biogeogr. 2008, 17, 145–151. [Google Scholar] [CrossRef]
  37. Christian, S.; Andres, F.; Timothy, G.G.; Adison, A.; Valeska, Y. A study on the effects of unbalanced data when fitting logistic regression models in ecology. Ecol. Indic. 2018, 85, 502–508. [Google Scholar]
  38. Cai, Q.J.; Zeng, A.C.; Su, Z.W.; Guo, F.T. Driving factors of forest fire in Zhejiang province based on Logistic regression model. J. Northwest A&F Univ. 2020, 48, 102–109. [Google Scholar]
  39. Jain, D.; Singh, V. An Efficient Hybrid Feature Selection model for Dimensionality Reduction. Procedia Comput. Sci. 2018, 132, 333–341. [Google Scholar] [CrossRef]
  40. Wu, B.F.; Meng, J.H.; Li, Q.Z. Review of overseas crop monitoring systems with remote sensing. Adv. Earth Sci. 2010, 25, 1003–1012. [Google Scholar]
Figure 1. Geographic location of the study area (a) and surveyed plots distribution (b).
Remotesensing 15 05530 g001
Figure 2. Flowchart of the methodology adopted in this study.
Remotesensing 15 05530 g002
Figure 3. Comparison of the weights attributed to the remote sensing variables (LAI, FPAR, NDVI, and LST) under different time windows.
Remotesensing 15 05530 g003
Figure 4. Conceptual scheme of time window selection for features using a temporal sliding method (The star indicates the combination of RS variables has the highest weight).
Remotesensing 15 05530 g004
Figure 5. Classification result of land features derived from the fusion of SAR and optical images.
Remotesensing 15 05530 g005
Figure 6. Spatial distributions of the remote sensing habitat variables of rice sheath blight disease in the study area, namely, FPAR (a), LAI (b), LST (c), and NDVI (d), under the optimal time window in the year 2020.
Remotesensing 15 05530 g006
Figure 7. Receiver operating characteristic curves of the disease habitat suitability evaluation models using ROC curves.
Remotesensing 15 05530 g007
Figure 8. Maps of disease habitat suitability according to the Maxent and logistic models in the study area in 2020.
Remotesensing 15 05530 g008
Figure 9. Maps of disease habitat suitability according to the Maxent model variations in the 2018–2020 period.
Remotesensing 15 05530 g009
Table 1. Representation of habitat variables of rice sheath blight.
Habitat VariableTemporal Quantity Data SourceTemporal Step
Leaf Area Index
(LAI)
12 (June–August)MOD15A28 days
Normalized Difference Vegetation Index (NDVI)6 (June–August)MOD13Q116 days
Net Primary Productivity
(NPP)
1MOD15A21 year
Fraction of Photosynthetically Active
Radiation (Fpar)
12MOD15A28 days
Monthly Average Temperature3 (June–August)The National Meteorological Administration of China1 month
Monthly Precipitation3 (June–August)The National Meteorological Administration of China1 month
The Coldest Month Temperature1The National Meteorological Administration of China1 month
Land Surface Temperature (LST)8 (July–August)MOD11A2/MYD11A28 days
Table 2. Temporal combinations of the remote sensing habitat features.
Habitat FeatureTemporal PhaseTemporal Combination
LAI;
FPAR
0609, 0617, 0625C1
0617, 0625, 0703C2
0625, 0703, 0711C3
0703, 0711, 0719C4
0711, 0719, 0727C5
0719, 0727, 0804C6
0727, 0804, 0812C7
0804, 0812, 0820C8
0812, 0820, 0828C9
NDVI0609, 0625C1
0625, 0711C2
0711, 0727C3
0727, 0812C4
0812, 0828C5
LST0711, 0719, 0727C1
0719, 0727, 0804C2
0727, 0804, 0812C3
0804, 0812, 0820C4
0812, 0820, 0828C5
Note: all of the remote sensing products are MODIS products.
Table 3. Accuracy evaluation results of the habitat suitability assessment models using AUC, OA, and TSS during the 2018–2020 period.
Years201820192020
AUCOATSSAUCOATSSAUCOATSS
Maxent0.800.810.600.940.700.620.890.750.76
Logistic0.700.770.640.780.710.590.850.810.63
Disclaimer/Publisher’s Note: The statements, opinions and data contained in all publications are solely those of the individual author(s) and contributor(s) and not of MDPI and/or the editor(s). MDPI and/or the editor(s) disclaim responsibility for any injury to people or property resulting from any ideas, methods, instructions or products referred to in the content.

