
Higher UHI Intensity, Higher Urban Temperature? A Synthetical Analysis of Urban Heat Environment in Urban Megaregion

1
Beijing-Tianjin-Hebei Urban Megaregion National Observation and Research Station for Eco-Environmental Change, Chinese Academy of Sciences, Beijing 100085, China
2
State Key Laboratory of Urban and Regional Ecology, Research Center for Eco-Environmental Sciences, Chinese Academy of Sciences, Beijing 100085, China
3
Beijing Urban Ecosystem Research Station, Research Center for Eco-Environmental Sciences, Chinese Academy of Sciences, Beijing 100085, China
4
University of Chinese Academy of Sciences, Beijing 100049, China
5
Beijing Key Laboratory of Airborne Particulate Matter Monitoring Technology, Beijing Municipal Ecological and Environmental Monitoring Center, Beijing 100048, China
*
Author to whom correspondence should be addressed.
Remote Sens. 2023, 15(24), 5696; https://doi.org/10.3390/rs15245696
Submission received: 7 October 2023
/
Revised: 5 December 2023
/
Accepted: 6 December 2023
/
Published: 12 December 2023
(This article belongs to the Section Urban Remote Sensing)
Abstract
:Urban heat islands (UHIs) aggravate urban heat stress and, therefore, exacerbate heat-related morbidity and mortality as global warming continues. Numerous studies used surface urban heat island intensity (SUHII) to quantify the change in the UHI effect and its drivers for heat mitigation. However, whether the variations in SUHII among cities can demonstrate the physical difference and fluctuation of the urban thermal environment is poorly understood. Here, we present a comparison study on the temporal trends of SUHII and LST in urban and nonurban areas in 13 cities of the Beijing–Tianjin–Hebei (BTH) megaregion in China and further identify different types of changes in SUHII based on the temporal trends of land surface temperature (LST) in urban and nonurban areas from 2000 to 2020. We also measured the effect of the changes in four socioecological factors (i.e., population density, vegetation greenness (EVI), GDP, and built-up area) on the trends of SUHII to understand the dynamic interaction between the UHI effect and socioecological development. We found the following. (1) Nine out of thirteen cities showed a significant increasing trend in SUHII, indicating that the SUHI effects have been intensified in most of the cities in the BTH megaregion. (2) The spatial pattern of summer mean SUHII and LST in urban areas varied greatly. Among the 13 cities, Beijing had the highest mean SUHII, but Handan had the highest urban temperature, which suggests that a city with stronger SUHII does not necessarily have a higher urban temperature or hazardous urban thermal environment. (3) Four types of changes in SUHII were identified in the 13 cities, which resulted from different temporal trends of LST in urban areas and nonurban areas. In particular, one type of increasing trend of SUHII in seven cities resulted from a greater warming trend (increasing LST) in urban than nonurban areas (SUHII↑1), and another type of increasing trend of SUHII in Beijing and Chengde was attributed to the warming trends (increasing LST) in urban areas and the cooling trends (decreasing LST) in nonurban areas (SUHII↑2). Meanwhile, the third type of increasing trend of SUHII in Zhangjiakou was due to a greater cooling (decreasing LST) trend in nonurban areas than in urban areas (SUHII↑3). In contrast, three cities with a decreasing trend of SUHII were caused by the increase in LST in urban and nonurban areas, but the warming trend in nonurban areas was greater than in urban areas (SUHII↓1). (4) Among the relationship between the trend of SUHII (TrendSUHII) and the changes in socioecological factors (Trendpopulation density, TrendGDP per captica, TrendEVI, and Trendbuild-up area), a significantly positive correlation between TrendSUHII and TrendEVI indicated that the change in SUHII was significantly related to an increased rate of EVI. This is mainly because increased vegetation in nonurban areas would result in lower temperatures in nonurban areas.
1. Introduction
More than half of the world’s population now lives in cities, and this proportion is set to increase to 70% by the year 2050 [1]. Urban areas are already home to the majority of the world’s population [2], contributing more than 80% of the world’s economy and generating over 75% of humanity’s carbon emissions [3]. Meanwhile, the conversion of Earth’s land surface to an urban landscape modified the urban surface energy balance and led to higher temperatures in urban areas than in their surrounding rural areas, known as the urban heat islands (UHIs) [4,5,6]. The higher temperatures in cities increase heat-related risks for urban residents [7] and energy demand [8], posing a threat to urban sustainable development. Moreover, UHIs aggravate urban heat stress and exacerbate heat-related morbidity and mortality as global warming continues [9,10]. Thus, it is vital to accurately quantify the UHI effect and its drivers for assessing the potential heat-related risks in cities.
UHI intensity (UHII), which is commonly measured by the difference in the temperature between urban and surrounding nonurban areas, is a widely used indicator to quantify the extent and magnitude of the UHI effect. Generally, the detection of UHI was categorized into two types—canopy UHI (CUHI) measured by air temperature from in situ stations [11,12] and surface UHII (SUHI) quantified by land surface temperature (LST) observed by satellite [13,14]. These two types of UHI were highly related, yet they also differed. Due to air temperature often obtained from ground-based stations with sparse and uneven distribution, the studies on the spatial pattern of CUHI were conducted at micro- or local scales [15,16], and the seasonal variation in CUHI during the daytime was more affected by background climate than SUHI [17,18]. In contrast, LST was obtained directly from a single satellite with a thermal infrared remote sensor and could extend the spatial extent at meso- or global scales. The global coverage of LST also can eliminate the criticism of setting up representative sites in urban and nonurban areas [19,20]. Therefore, SUHI intensity (SUHII) is widely used to quantify the spatiotemporal patterns of the UHI effect.
Extensive studies have shown that the SUHII significantly increased, and SUHI effects have intensified and are associated with urban expansion at city, regional, and even global scales [21,22,23,24,25,26,27,28]. The research focusing on the spatiotemporal heterogeneity of SUHII within the city revealed that more intensified UHI effects were observed in newly developed urban areas [29,30]. For instance, Wang et al. (2019) mapped urban areas developed before 2000 (old urban area, OUA) and between 2000 and 2015 (new urban area, NUA) and found that the averaged value and the increasing rate of SUHII in NUA were much higher than that in OUA. Meanwhile, numerous studies also found strong and significant diurnal and seasonal variations in UHII [21,26,31,32]. For example, most cities exhibited the highest SUHII in summer daytime [33,34,35]. Moreover, with the projected increase in severity, frequency, and duration of heat waves and ongoing urbanization globally, considerable research demonstrated that the UHII during heatwave periods was augmented and thus exacerbated the urban thermal environment [9,12,36,37]. However, it is still unclear whether the spatial pattern of UHII and its temporal change could actually reflect the condition and its change in the urban thermal environment among cities. The following questions remain unaddressed: “whether a city with a higher UHII has a higher temperature” or “whether no change in UHII can prove that the temperature is temporally stable for the city, or does a significant increasing trend in SUHII indicate the exacerbation of urban thermal environment?” In other words, these questions concern whether the direct comparison of UHII values and their trends among different cities with the same climate background can demonstrate the actual variability and fluctuation of the urban thermal environment. Therefore, answering this question is the foundation for a better understanding of UHI mechanisms to investigate the changes in the UHI effect considering the different trends of temperature in urban and rural areas and thus provides insights into UHI mitigation and climate change adaptation [14,29].
Additionally, many studies have been conducted to explore the driving factors that affect the changes in temperature in urban and rural areas, as well as the corresponding changes in UHII. One type of study focuses on the impacts of urban-induced land use and land cover (LULC) change [38,39,40]. For example, increasing impervious surfaces and decreasing vegetation cover increased urban temperature and thereby intensified the UHI effect [41,42,43,44,45]. The impacts of landscape configuration on urban temperature/warming have also attracted increasing attention [46,47,48]. These studies mainly concluded that urbanization changed the surface structure, which modified albedo, heat-storing structures, and heat conductivity over urban areas, and thus led to a modification of thermal climate. Another type of study focused on urban socioeconomic development. An increasing body of literature has shown that the UHI effect has a significant correlation with socioeconomic factors [27,49,50]. However, the relative importance of influencing factors in previous studies is inconsistent due to varied climate backgrounds and ecological contexts among cities [10,33,51,52,53]. It is highly desired to clarify the potential interaction between the UHI effect and socioeconomic factors, excluding the influence of climate background. Moreover, given that the magnitude of the UHI effect has been strongly influenced by socioeconomic dynamics with rapid urbanization, it is important to understand how the changes in socioeconomic factors affect the change rate of UHII, which could provide valuable insights for future urban heat adaptive strategies.
We tried to address three research questions: (1) Do UHII values among different cities with the same climate background compare the actual conditions of the urban thermal environment? (2) How is the change in UHII related to the change in temperature in urban and nonurban areas? Is intensified SUHII definitely caused by urban warming? (3) How does the socioecological development affect the trends of SUHII? We focused on the 13 cities in the Beijing–Tianjin–Hebei (BTH) megaregion. We first conducted a comparison study of the spatiotemporal trends of SUHII and LST among the 13 cities to understand the disparity of these two indices in characterizing the urban thermal environment. We then identified different types of changes in SUHII associated with the changes in LST in urban and nonurban areas among cities. Finally, we examined the dynamic interaction between the UHI effect and socioecological development to understand how changes in socioecological factors affect the UHI effect.
2. Materials and Methods
2.1. Study Area
We focused on Beijing–Tianjin–Hebei (BTH) megaregion, which is located on the coast of the Bohai Sea in the northeast of China (36°05′–42°40′N and 113°27′–119°53′E) and has temperate continental monsoon climate, with an annual mean temperature of ~11 °C and average annual precipitation of ~500 mm. The terrain is tilted from northwest to southeast, with the altitude decreasing from 2836 mm to −52 mm (Figure 1). Yanshan Mountains are located in the northwestern part of the region with high coverage of forest and grassland. And the southeast part of the region is dominated by plains and mostly covered with farmland. The BTH megaregion is the center of national politics, culture, and economy, including two megacities, Beijing and Tianjin, which are directly under the Center Government, and 11 prefecture-level cities in Hebei Province (Figure 1). It has undergone rapid urbanization since the 1980s and has become the biggest megalopolis region in North China, with a total area of 2.18 × 10⁴ km2 (about 2% of China), a population of 113 million (about 8% of the total population of China), and gross domestic product (GDP) of 8.4 × 10⁴ billion CNY in 2020. However, the rapid population growth and urban expansion in the BTH megaregion have changed urban thermal environment, thereby resulting in strong UHI effect and frequent heat wave events in summer [54,55,56].
2.2. Data Sources and Data Processing
2.2.1. Land Cover Data and Urban Areas Mapping
Land use and land cover (LULC) classification maps were derived from Landsat TM/OLI imagery with 30 m spatial imagery for the years 2000, 2005, 2010, 2015, and 2020. We used object-based backdating and updating approach to classify six types of land cover, including forest, grass, water, farmland, developed land, and barren land [57]. We first used an object-based approach to generate the LULC classification map from 2010 based on Landsat TM imagery of 2010 [58]. We then used the 2010 LULC as a reference map to generate the maps of 2000 and 2005 using an object-based backdating approach and generate the maps of 2015 and 2020 using an object-based updating approach. According to the object-based backdating and updating approach, we mainly conducted change detection to backdate the LULC type of Map2010 to Map2000 and 2005 and update Map2010 to Map2015 and 2020 (Figure 2). Extensive manual editing was also conducted to refine classification by referring to very high-resolution data (i.e., 2.5 m SPOT 5 imagery). More details about the approach can be found in Yu et al. (2016). The overall accuracies of LULC maps in 2000–2020 were over 90% [59].
We mapped each city into two different parts, namely urban areas and nonurban areas, based on LULC map and prefecture-level administrative boundaries map. We defined urban areas as the largest continuously built-up area within the administrative boundary of each city. In particular, we first created a fishnet with 900 m × 900 m grid based on 30 m land cover map in 2000–2020 and calculated the percentage of developed land in each fishnet for each year. We then identified the fishnet grids with a proportion of developed land that exceeded 50% of urbanized ones. Finally, we merged the spatially continuous urbanized grids of each city as urban areas, and nonurban areas were identified as other regions within the municipality of each city [60] (see the example of Beijing in Figure 3).
2.2.2. LST and EVI from MODIS Products
Land surface temperature (LST) data were obtained from Terra MODIS products (MOD11A2) with a spatial resolution of 1 km. The MOD11A2 product includes an average 8-day LST based on daily LST (MOD11A1 LST). We calculated and averaged the daytime LST (10:30 local time) for each summer (June to August) from 2000 to 2020 and finally generated 20 images of “average LST of summer day” for each year (Figure 4).
We used MODIS enhanced vegetation index (EVI) data (MOD13A2) to measure vegetation information (i.e., vegetation greenness and abundance) for the period of 2000–2020, considering its more sensitivity in the areas with high biomass and improved capability of vegetation monitoring by decoupling canopy background signal and reducing atmosphere influences [61]. The MOD13A2 product provides 16-day composite data with 1 km spatial resolution. We averaged summer EVI for each year to obtain the mean EVI of each summer from 2000 to 2020.
2.3. SUHII Calculation and Its Change Identification
Compared to model of the thermal regime of urban and rural surfaces using the surface energy budget equation [62], the intensity of SUHI was calculated as the LST difference between the urban and nonurban areas:
where SUHIIi presents the intensity of SUHI in the year i, and are the mean LST in the urban and nonurban areas for the year i, respectively. To quantify SUHII in each year from 2000 to 2020, we used urban areas mapping in 2000, 2005, 2010, and 2015 to present the urban areas in 2000–2004, 2005–2009, 2010–2014, and 2015–2020, respectively.
2.4. Potential Socioecological Impact Factors
We chose four socioecological factors of all 13 cities as the potential influences on the UHI effects. In particular, three socioeconomic factors, including population density (PD), gross domestic product (GDP) per capita, and the percentage of built-up area (BUA), were used to quantify the contribution of human activity to the UHI effect. EVI is a typical ecological factor and was used to measure the greenness and abundance of vegetation. Among them, PD and GDP per capita were collected from Statistical Yearbooks [63]. The percentage of BUA was calculated by the ratio of area of urban to total area for each city based on LULC classification maps.
2.5. Statistical Analysis
We used ordinary least squares (OLS) linear regression analysis to examine the temporal trends of SUHI, urban and nonurban LST for all 13 cities. The regression coefficient was used to estimate the annual change rate of SUHII (TrendSUHII) and LST in urban and nonurban areas. The temporal trends of four socioecological factors were also conducted (Figure 5). Pearson’s correlation analysis was conducted to measure the dominant socioecological factors affecting inter-city SUHII and urban LST. Through the significant test, we focused on the cities with significant trends of SUHII and socioecological factors during the study period, and further ran the OLS model to test the correlation of the trends of SUHII with the changes in local socioecological conditions.
3. Results
3.1. The Spatiotemporal Trends of SUHII and LST in the BTH Megaregion
3.1.1. The Spatial Pattern of SUHII and LST in the BTH Megaregion
There were large spatial variations in the mean summer SUHII of 20 years among 13 cities. The mean SUHII ranged from 1.84 °C to 5.53 °C, with a mean of 3.39 °C and a standard deviation of 0.98 °C. In particular, cities with lower SUHII were distributed in the southeast and south of the BTH megaregion. Compared to the north of BTH megaregion with high coverage of forest, the concentrated farmland distributed in the nonurban areas of the southeast and south parts led to relatively less evaporative cooling, resulting in a slight difference in the LST in urban and nonurban areas (Figure 6a). Among the 13 cities, Beijing had the highest mean SUHII, followed by Baoding and Zhangjiakou, and Cangzhou had the lowest (Figure 6a). In contrast, the cities with lower urban temperatures were distributed in the north of the BTH megaregion. The mean LST in urban areas ranged from 30.75 °C in Chengde to 35.89 °C in Handan, with a mean of 34.46 °C and a standard deviation of 1.24 °C. Rather than Beijing, Handan, which had a moderate intensity of UHI, had the highest urban surface temperature (Figure 6b). The results showed that the spatial distribution of SUHII was not consistent with that of urban LST. That is, greater UHI intensity does not necessarily mean higher urban temperature.
3.1.2. The Trends of SUHII and LST in the BTH Megaregion
The SUHI effects have intensified in most of the cities in the BTH megaregion. The result showed that nine out of the thirteen cities present a significant increasing trend in SUHII (Figure 7). The increasing rate of SUHII ranged from 0.01 °C/year in Xingtai to 0.08 °C/year in Zhangjiakou. Additionally, we found that Langfang has experienced a significant decreasing trend in SUHII from 2000 to 2020.
The results from the changes in LST in the urban area revealed that all cities, except for Zhangjiakou, have significantly increased in urban LST in the past 20 years. The change rate of urban LST ranged from −0.01 °C/year in Zhangjiakou to 0.15 °C/year in Tangshan. Geographically, the increasing rate of urban LST in the south of the BTH megaregion was much higher than that in the north (Figure 8).
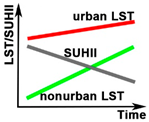
We further compared the changes in urban and nonurban LST in each city and identified four types of changes in SUHII (Table 2). In particular, more than 50% of cities (7 out of 13) present an increasing trend in SUHII attributed to warming trends in urban and nonurban areas, but the urban areas warmed at a greater rate than the nonurban areas. For example, in Tangshan, the intensified SUHII at an increasing rate of 0.06 °C/year was mainly due to a greater warming trend in urban areas (0.15 °C/year) than in nonurban areas (0.09 °C/year). Two cities, including Beijing and Chengde, showed that the SUHII increased with the warming trends in urban areas and the cooling trends in nonurban areas. In Zhangjiakou, which had the highest increasing rate in SUHII (0.08 °C/year) in the BTH megaregion, we surprisingly found that the LSTs in both the urban area and nonurban area have been declining in the last 20 years. However, the decrease rate of LST in nonurban areas (0.12 °C/year) was about triple that in urban areas (0.04 °C/year), and the different magnitude of decrease trends thereby led to a rapid increase in SUHII. Among the three cities with a decreasing trend in SUHII, we found that the decrease in the intensity of SUHI resulted from the increase in LST in urban and nonurban areas, but the warming rate in nonurban areas was greater than that in urban areas.
3.2. The Effects of Socioecological Factors on Urban Thermal Environment in the BTH Megaregion
Figure 9 showed that the mean SUHII in the summer daytime was negatively correlated with EVI but was positively correlated with population density and GDP per capita across the 13 cities in the BTH megaregion. Additionally, we found that there was no significant correlation between the mean SUHII and the percentage of BUA. These results indicated that cities that had a higher population density and high-level economic status tended to have higher SUHII. Meanwhile, higher vegetation cover led to a cooler urban environment.
We further explored the effects of the trends of the socioecological factors on SUHI effects. For the cities with significantly increasing trends of EVI, a significantly positive correlation between TrendSUHII and TrendEVI was observed, suggesting that a higher increased rate of EVI (TrendEVI > 0) would increase the rate of SUHII change. This is most evident in the cities where the change rate of LST in nonurban areas was decreasing (Figure 10a). The increased rate of population density had a significantly negative correlation to TrendSUHII (Figure 10b), while the growth of GDP per capita had a significantly positive one (Figure 10c). These results indicated that rapid economic development would result in a rapid increase in SUHI effect, while the higher increasing rate of population density was associated with a slower increasing rate of SUHII.
4. Discussion
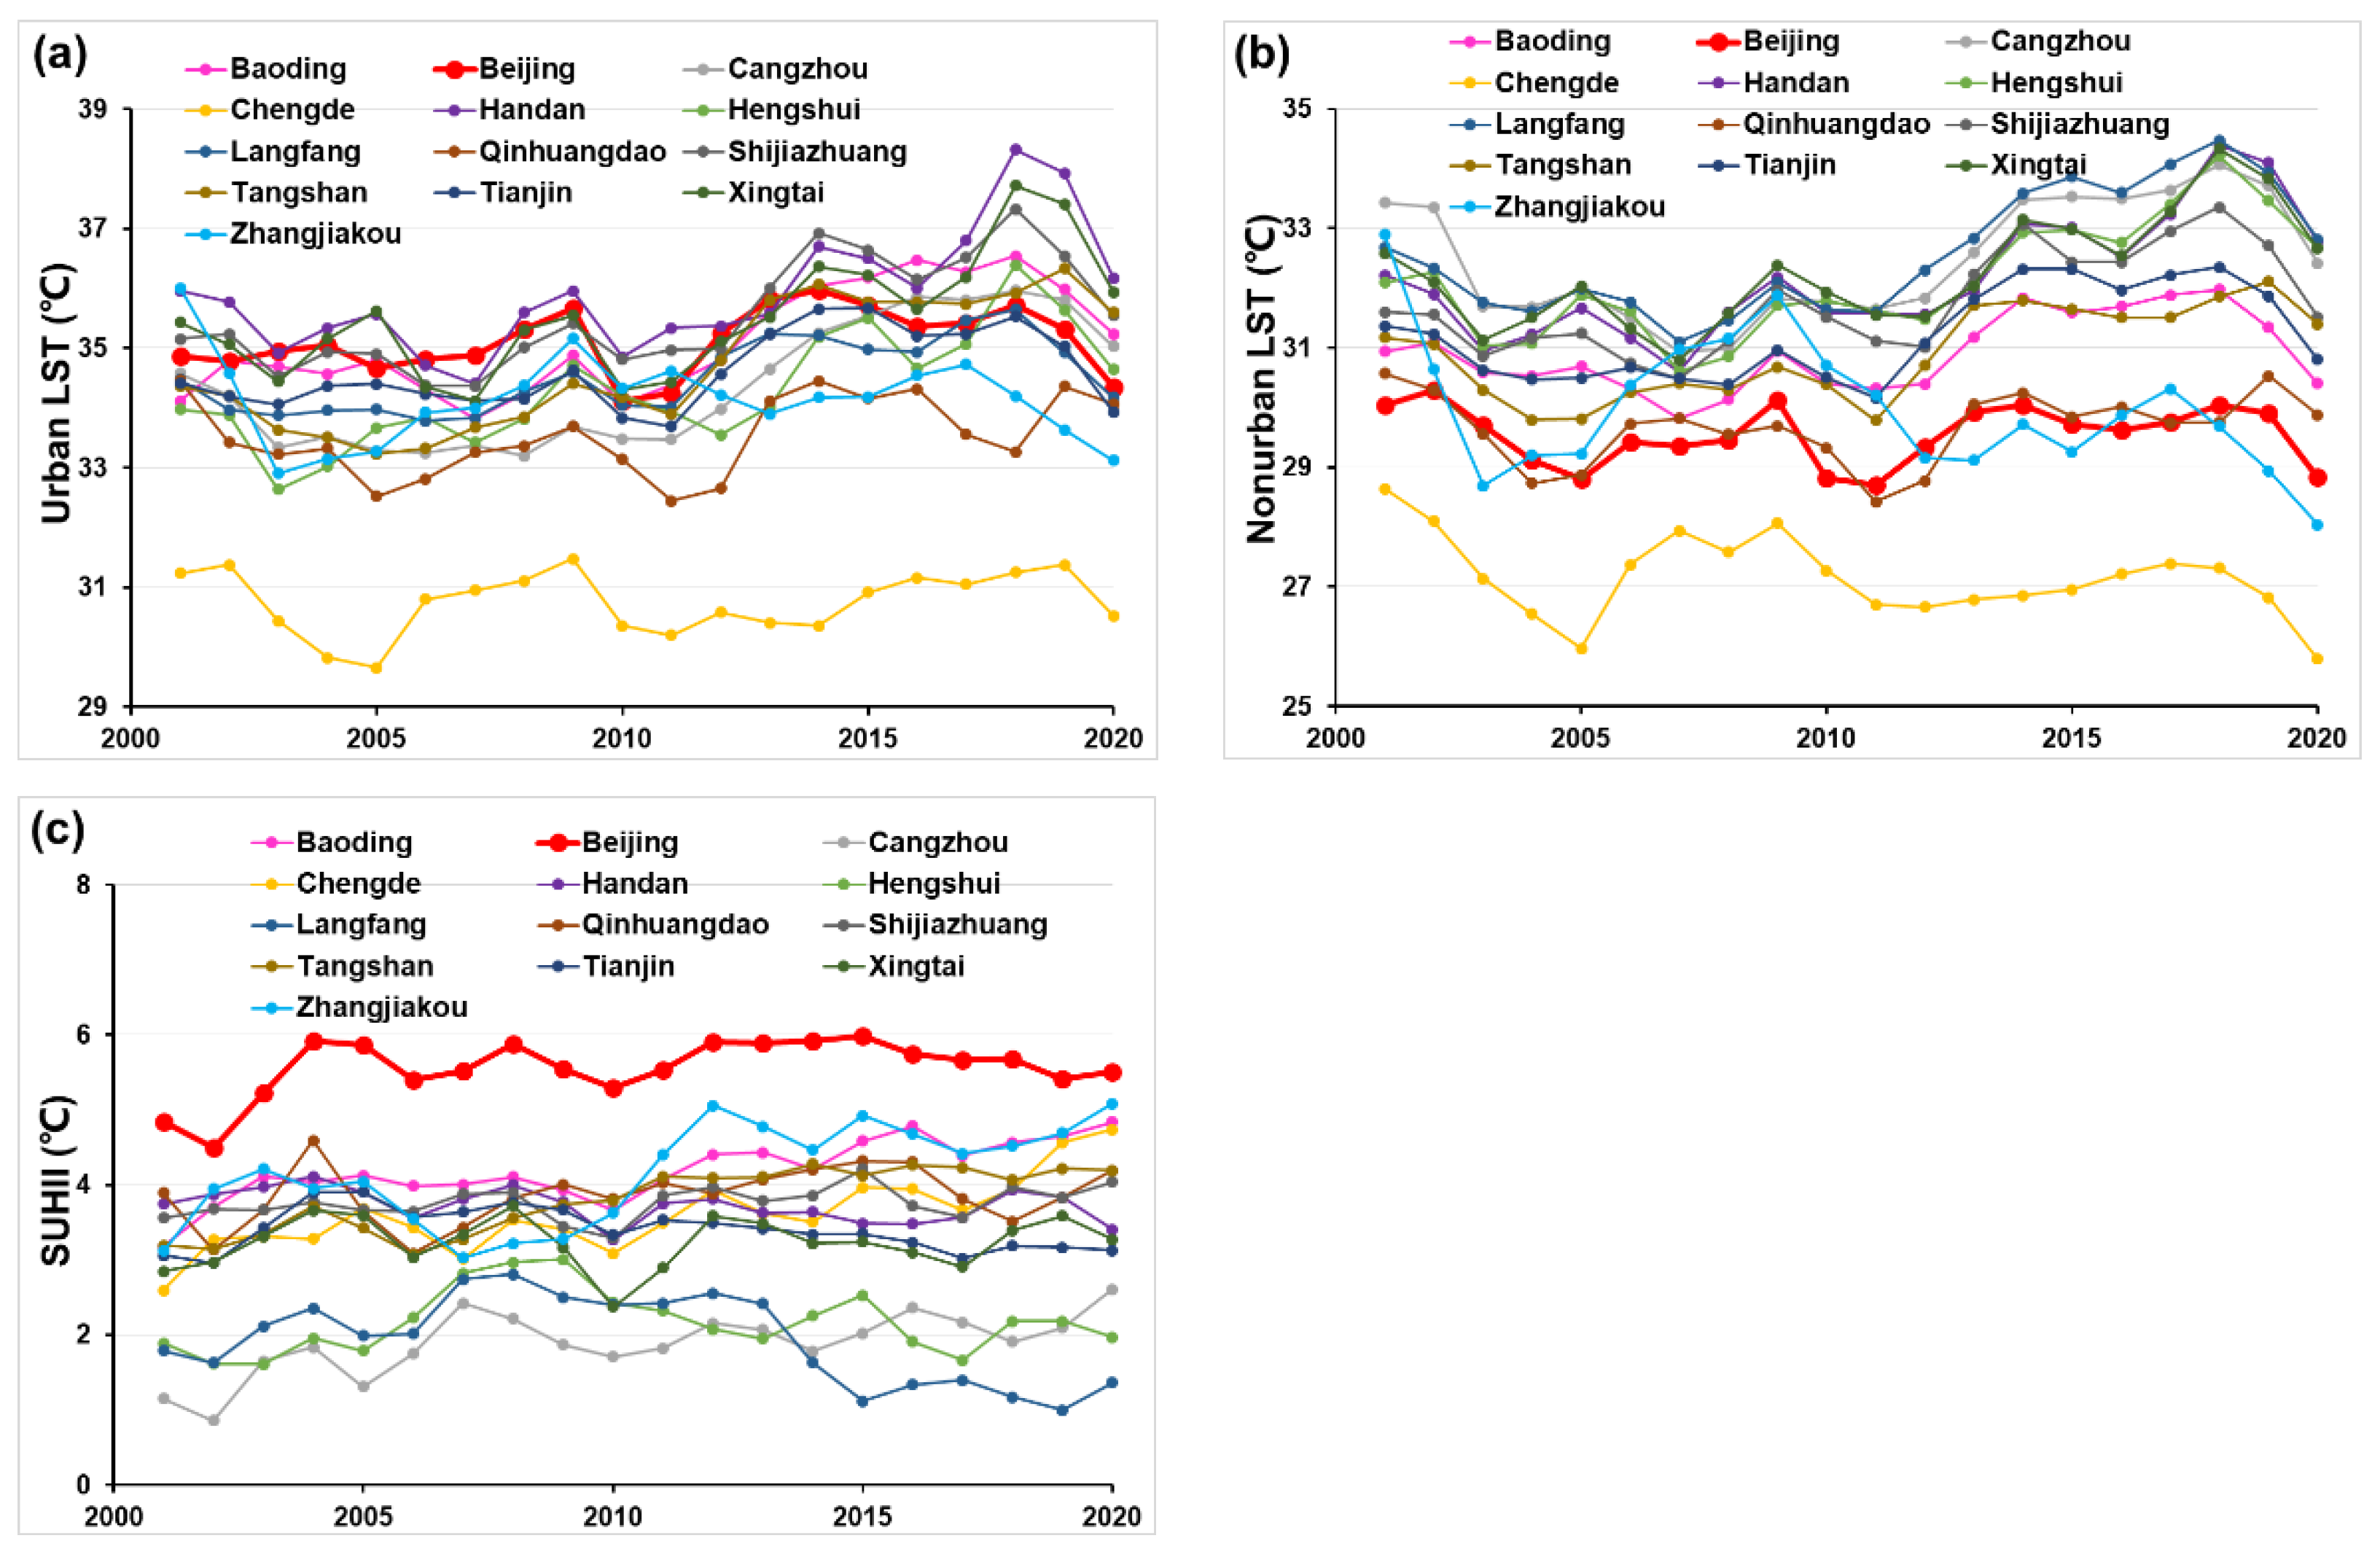
Accurately quantifying the magnitude of the UHI effect and its trend is a prerequisite for effective urban heat adaption and mitigation. SUHII is widely used to quantify the magnitude of the UHI effect by measuring the difference in temperature between the urban and surrounding areas of a single city [29,43,64,65]. Consistent with previous studies, our result showed that most cities (9 out of 13) in the BTH megaregion have faced an intensified UHI effect with a significant increase in SUHII from 2000 to 2020 [66,67]. It is worth noting that the cities which exhibit stronger SUHII do not necessarily experience higher urban temperatures or worse urban thermal environments. For example, our results showed that Beijing had the highest mean summer SUHII with 5.53 °C in all 13 cities. Conversely, we found the urban temperature in Beijing (35.17 °C) was not the highest and lower than that in Handan (35.92 °C), Shijiazhuang (35.54 °C), and Xingtai (35.53 °C). We further found that the most intensified UHI effect in Beijing was mainly because of the relatively lower temperature in nonurban areas but not due to the highest temperature in urban areas (Figure 11). This result identified the discrepancy between SUHII and urban temperature among cities to better understand the difference between intensification of the UHI effect and urban warming.
Our finding upon comparing the trend of SUHII and LST among cities indicated that the intensified SUHI does not necessarily exacerbate the urban thermal environment. For example, our result showed that urban LST in Zhangjiakou, which has the highest increase rate of SUHII, decreased with a rate of 0.04 °C/y. The inconsistency of the trends in SUHII and urban LST is mainly because of varied trends of nonurban LST among cities. Taking Zhangjiakou and Handan as an example, although the LST in urban and nonurban areas both decreased in Zhangjiakou, the much larger decreasing rate of LST in nonurban areas (0.12 °C/y) than that in urban areas (0.04 °C/y) for Zhangjiakou led to the great increase in SUHII. Instead of a cooling trend in urban areas, the decrease in SUHII in Handan is due to the warming rate in nonurban areas (0.13 °C/y) being larger than that in urban areas (0.11 °C/y). That is, the decrease in SUHII does not always imply the improvement of the urban thermal environment. This result indicated that urban heat island intensity and its trend cannot predict true urban heat [68]. Moreover, the identification of four types of SUHII change based on changes in LST in urban and nonurban areas can enhance the understanding of the dynamics and underlying mechanisms of the urban thermal environment [14,29]. For instance, our study showed that the increased SUHII in Beijing was closely associated with the cooling in nonurban areas, suggesting greening policies, such as the Million Mu Trees Campaign, increased the coverage of forests and lowered the temperature in nonurban areas and then made the difference in LST between urban and nonurban areas increases [29].
As Chinese cities have experienced rapid population and economic growth, the UHI intensity increased significantly over the past decades, which is highly related to the changes in land cover and socioeconomic driving factors [27,49,66]. Similar to previous studies, our result showed that EVI, population density, and per capita GDP were major factors contributing to UHI effects [14,27,42,69,70]. The positive correlation between SUHII and population density, and per capita GDP is mainly because the cities with high population and economic levels are more likely to replace vegetation by buildings and roads for urban development, increase energy consumption, and thus directly increase SUHII [71].
To better understand the potential interactions between SUHII change and urban socioecological system dynamics in the BTH megaregion, we further quantified the effects of the temporal trends of EVI, population density, and economic level on SUHII variability. Our analysis showed that TrendEVI has a positive relation to TrendSUHII, indicating that the higher the vegetation increased, the more rapidly the UHI intensity increased. This finding is most pronounced in the city of Zhangjiakou, Chengde, and Beijing, where the LST in nonurban areas have decreased during study periods. It was likely due to the fact that the newly increased vegetation was mostly located in nonurban areas and then greatly lower LST in nonurban areas. This is in agreement with previous research, which demonstrated that the variations of EVI in rural areas were larger than in urban areas, and rural greening contributed to the increased daytime SUHII [72]. The results underscore that rural greening was a significant driver for the increased UHI intensity, which deepens the understanding of the mechanism of UHII dynamics and provides insights into specific cities in heat mitigation strategies. Meanwhile, we also found the changes in per capita GDP and population density played an important role in affecting the change in SUHII. For example, the rapid growth of economic development continuously accelerated the increase rate of SUHII. That is, urban planners should focus on the trade-off between economic development and the urban thermal environment. Moreover, given the resource for greening is limited within cities, it is more practical to regulate the UHI effect by controlling socioeconomic factors [49].
This study also has some limitations. Given that the 13 cities are all single-core cities, we identified the largest continuously built-up area mostly located in the urban core as urban areas in this study. It is noteworthy that the scatter build-up areas beside the urban core should be classified as urban areas. Secondly, in addition to urban expansion and human activity, many environmental factors also have a significant impact on LST and SUHI intensity [73,74,75]. For example, elevation could influence vegetation growth by changing moisture and soil nutrient conditions and, therefore, affect the spatial pattern of temperature and UHI intensity [76]. It is highly desirable to emphasize the effect of the combination of nature and socioeconomics on UHI. Thirdly, some studies showed that remote sensing images measure only the surface skin temperature and that the near-surface air temperature is highly related to heat stress, human comfort, and public health. Although these types of temperatures are closely related, the measurement of UHI intensity from them is not identical quantities [19,77,78,79]. Further research that uses air temperature obtained from a dense network of in situ stations to understand the variations in urban heat islands and provide insight into urban heat adaptation and mitigation is highly desirable.
5. Conclusions
Accurately quantifying the magnitude of the UHI effect and its trend is a prerequisite to adapting and mitigating urban heat risk. Numerous studies used surface urban heat island intensity (SUHII) to quantify the change in the UHI effect and its drivers for heat mitigation. However, whether the variations in SUHII among cities can demonstrate the physical difference and fluctuation of the urban thermal environment is poorly understood. Here, we present a comparison study on the temporal trends of SUHII and LST in urban and nonurban areas in 13 cities of the BTH megaregion in China; we further identify different types of changes in SUHII from 2000 to 2020. We also measured the effect of the changes in socioecological factors on the trends of SUHII to understand the dynamic interaction between the UHI effect and socioecological development. We found the following. (1) Nine out of thirteen cities showed a significant increasing trend in SUHII, indicating that the SUHI effect has been intensified in most of the cities in the BTH megaregion. (2) The spatial pattern of summer mean SUHII and LST in urban areas varied greatly. Among the 13 cities, Beijing had the highest mean SUHII, but Handan had the highest urban temperature, which suggests that a city with stronger SUHII does not necessarily have a higher urban temperature or hazardous urban thermal environment. (3) Four types of changes in SUHII were identified in the 13 cities, which resulted from the different temporal trends of LST in urban areas and nonurban areas. (4) A significantly positive correlation between TrendSUHII and TrendEVI indicated that change in SUHII was significantly related to an increased rate of EVI. This is mainly because the increased vegetation was mostly located in nonurban areas, resulting in lower temperatures in nonurban areas. Therefore, rural greening became a significant driver for the increased UHI intensity.
Author Contributions
Conceptualization, J.W. and W.Z. (Weiqi Zhou); methodology, J.W.; software, J.W.; validation, J.W., W.Z. (Weiqi Zhou) and W.Z. (Wenhui Zhao); formal analysis, W.Z. (Wenhui Zhao); investigation, J.W.; resources, W.Z. (Weiqi Zhou); data curation, J.W.; writing—original draft preparation, J.W.; writing—review and editing, W.Z. (Weiqi Zhou) and W.Z. (Wenhui Zhao); visualization, J.W.; supervision, W.Z. (Wenhui Zhao); project administration, W.Z. (Wenhui Zhao); funding acquisition, W.Z. (Weiqi Zhou) and J.W. All authors have read and agreed to the published version of the manuscript.
Funding
This work was supported by the National Key Research Program of Research and Development (2022YFF1301100), the National Natural Science Foundation of China (Grant No. 42101093), and the Sustainable Development International Cooperation Program (NSFC-FAPESP program).
Data Availability Statement
Data are contained within the article.
Conflicts of Interest
The authors declare no conflict of interest.
References
- United Nations Publications. World Urbanization Prospects: The 2014 Revision; United Nations Department of Economics and Social Affairs, Population Division: New York, NY, USA, 2014. [Google Scholar]
- Zhou, W.; Fisher, B.; Pickett, S.T.A. Cities Are Hungry For Actionable Ecological Knowledge. Front. Ecol. Environ. 2019, 17, 135. [Google Scholar] [CrossRef]
- Seto, K.C.; Golden, J.S.; Alberti, M.; Turner, B.L., 2nd. Sustainability In An Urbanizing Planet. Proc. Natl. Acad. Sci. USA 2017, 114, 8935–8938. [Google Scholar] [CrossRef]
- Oke, T.R. The Energetic Basis Of The Urban Heat Island. Q. J. R. Meteorol. Soc. 1982, 108, 1–24. [Google Scholar] [CrossRef]
- Seto, K.C.; Fragkias, M.; Guneralp, B.; Reilly, M.K. A Meta-Analysis Of Global Urban Land Expansion. PLoS ONE 2011, 6, e23777. [Google Scholar] [CrossRef] [PubMed]
- Rizwan, A.M.; Dennis, L.Y.C.; Liu, C. A Review On The Generation, Determination And Mitigation Of Urban Heat Island. J. Environ. Sci. 2008, 20, 120–128. [Google Scholar] [CrossRef] [PubMed]
- Mora, C.; Dousset, B.; Caldwell, I.R.; Powell, F.E.; Geronimo, R.C.; Bielecki, C.R.; Counsell, C.W.; Dietrich, B.S.; Johnston, E.T.; Louis, L.V.; et al. Global Risk of Deadly Heat. Nat. Clim. Chang. 2017, 7, 501–506. [Google Scholar] [CrossRef]
- Isaac, M.; Van Vuuren, D.P. Modeling Global Residential Sector Energy Demand For Heating and Air Conditioning in the Context of Climate Change. Energy Policy 2009, 37, 507–521. [Google Scholar] [CrossRef]
- Miao, S.; Zhan, W.; Lai, J.; Li, L.; Du, H.; Wang, C.; Wang, C.; Li, J.; Huang, F.; Liu, Z.; et al. Heat Wave-Induced Augmentation of Surface Urban Heat Islands Strongly Regulated By Rural Background. Sustain. Cities Soc. 2022, 82, 103874. [Google Scholar] [CrossRef]
- Manoli, G.; Fatichi, S.; Schlapfer, M.; Yu, K.; Crowther, T.W.; Meili, N.; Burlando, P.; Katul, G.G.; Bou-Zeid, E. Magnitude of Urban Heat Islands Largely Explained By Climate And Population. Nature 2019, 573, 55–60. [Google Scholar] [CrossRef]
- Peterson, T.C. Assessment Of Urban versus Rural In Situ Surface Temperatures in the Contiguous United States: No Difference Found. J. Clim. 2003, 16, 2941–2959. [Google Scholar] [CrossRef]
- He, X.; Wang, J.; Feng, J.; Yan, Z.; Miao, S.; Zhang, Y.; Xia, J. Observational and Modeling Study of Interactions Between Urban Heat Island and Heatwave in Beijing. J. Clean. Prod. 2020, 247, 119169. [Google Scholar] [CrossRef]
- Voogt, J.A.; Oke, T.R. Thermal Remote Sensing of Urban Climates. Remote Sens. Environ. 2003, 86, 370–384. [Google Scholar] [CrossRef]
- Ren, T.; Zhou, W.; Wang, J. Beyond Intensity of Urban Heat Island Effect: A Continental Scale Analysis on Land Surface Temperature in Major Chinese Cities. Sci. Total Environ. 2021, 791, 148334. [Google Scholar] [CrossRef] [PubMed]
- Crank, P.J.; Sailor, D.J.; Ban-Weiss, G.; Taleghani, M. Evaluating the Envi-Met Microscale Model for Suitability in Analysis of Targeted Urban Heat Mitigation Strategies. Urban Clim. 2018, 26, 188–197. [Google Scholar] [CrossRef]
- Sheng, L.; Tang, X.; You, H.; Gu, Q.; Hu, H. Comparison of the Urban Heat Island Intensity Quantified by Using Air Temperature and Landsat Land Surface Temperature in Hangzhou, China. Ecol. Indic. 2017, 72, 738–746. [Google Scholar] [CrossRef]
- Hu, Y.; Hou, M.; Jia, G.; Zhao, C.; Zhen, X.; Xu, Y. Comparison of Surface and Canopy Urban Heat Islands Within Megacities of Eastern China. ISPRS J. Photogramm. Remote Sens. 2019, 156, 160–168. [Google Scholar] [CrossRef]
- Du, H.; Zhan, W.; Liu, Z.; Li, J.; Li, L.; Lai, J.; Miao, S.; Huang, F.; Wang, C.; Wang, C.; et al. Simultaneous Investigation of Surface and Canopy Urban Heat Islands over Global Cities. ISPRS J. Photogramm. Remote Sens. 2021, 181, 67–83. [Google Scholar] [CrossRef]
- Venter, Z.S.; Chakraborty, T.; Lee, X.J.S.A. Crowdsourced Air Temperatures Contrast Satellite Measures of the Urban Heat Island and Its Mechanisms. Sci. Adv. 2021, 7, eabb9569. [Google Scholar] [CrossRef]
- Stewart, I.D. A Systematic Review and Scientific Critique of Methodology in Modern Urban Heat Island Literature. Int. J. Climatol. 2011, 31, 200–217. [Google Scholar] [CrossRef]
- Wang, J.; Huang, B.; Fu, D.; Atkinson, P. Spatiotemporal Variation in Surface Urban Heat Island Intensity and Associated Determinants Across Major Chinese Cities. Remote Sens. 2015, 7, 3670–3689. [Google Scholar] [CrossRef]
- Streutker, D.R. A Remote Sensing Study of the Urban Heat Island of Houston, Texas. Int. J. Remote Sens. 2002, 23, 2595–2608. [Google Scholar] [CrossRef]
- Tomlinson, C.J.; Chapman, L.; Thornes, J.E.; Baker, C.J. Derivation of Birmingham’s Summer Surface Urban Heat Island From Modis Satellite Images. Int. J. Climatol. 2012, 32, 214–224. [Google Scholar] [CrossRef]
- Chen, X.-L.; Zhao, H.-M.; Li, P.-X.; Yin, Z.-Y. Remote Sensing Image-Based Analysis of the Relationship Between Urban Heat Island and Land Use/Cover Changes. Remote Sens. Environ. 2006, 104, 133–146. [Google Scholar] [CrossRef]
- Li, H.; Zhou, Y.; Li, X.; Meng, L.; Wang, X.; Wu, S.; Sodoudi, S. A New Method to Quantify Surface Urban Heat Island Intensity. Sci. Total Environ. 2018, 624, 262–272. [Google Scholar] [CrossRef] [PubMed]
- Sun, Y.; Gao, C.; Li, J.; Wang, R.; Liu, J. Evaluating Urban Heat Island Intensity and Its Associated Determinants of Towns and Cities Continuum in the Yangtze River Delta Urban Agglomerations. Sustain. Cities Soc. 2019, 50, 101659. [Google Scholar] [CrossRef]
- Liu, Y.; Fang, X.; Xu, Y.; Zhang, S.; Luan, Q. Assessment of Surface Urban Heat Island Across China’s Three Main Urban Agglomerations. Theor. Appl. Climatol. 2017, 133, 473–488. [Google Scholar] [CrossRef]
- Hsu, A.; Sheriff, G.; Chakraborty, T.; Manya, D. Disproportionate Exposure To Urban Heat Island Intensity Across Major Us Cities. Nat. Commun. 2021, 12, 2721. [Google Scholar] [CrossRef]
- Wang, J.; Zhou, W.; Wang, J. Time-Series Analysis Reveals Intensified Urban Heat Island Effects but without Significant Urban Warming. Remote Sens. 2019, 11, 2229. [Google Scholar] [CrossRef]
- Yao, R.; Wang, L.; Huang, X.; Niu, Z.; Liu, F.; Wang, Q. Temporal Trends of Surface Urban Heat Islands and Associated Determinants in Major Chinese Cities. Sci. Total Environ. 2017, 609, 742–754. [Google Scholar] [CrossRef]
- Zhou, D.; Zhao, S.; Liu, S.; Zhang, L.; Zhu, C. Surface Urban Heat Island in China’s 32 Major Cities: Spatial Patterns and Drivers. Remote Sens. Environ. 2014, 152, 51–61. [Google Scholar] [CrossRef]
- Hu, L.; Brunsell, N.A. The Impact of Temporal Aggregation of Land Surface Temperature Data for Surface Urban Heat Island (Suhi) Monitoring. Remote Sens. Environ. 2013, 134, 162–174. [Google Scholar] [CrossRef]
- Peng, J.; Ma, J.; Liu, Q.; Liu, Y.; Hu, Y.; Li, Y.; Yue, Y. Spatial-Temporal Change of Land Surface Temperature across 285 Cities in China: An Urban-Rural Contrast Perspective. Sci. Total Environ. 2018, 635, 487–497. [Google Scholar] [CrossRef] [PubMed]
- Imhoff, M.L.; Zhang, P.; Wolfe, R.E.; Bounoua, L. Remote Sensing of the Urban Heat Island Effect across Biomes in the Continental USA. Remote Sens. Environ. 2010, 114, 504–513. [Google Scholar] [CrossRef]
- Schwarz, N.; Lautenbach, S.; Seppelt, R. Exploring Indicators for Quantifying Surface Urban Heat Islands of European Cities with Modis Land Surface Temperatures. Remote Sens. Environ. 2011, 115, 3175–3186. [Google Scholar] [CrossRef]
- Fenner, D.; Holtmann, A.; Meier, F.; Langer, I.; Scherer, D. Contrasting Changes of Urban Heat Island Intensity During Hot Weather Episodes. Environ. Res. Lett. 2019, 14, 124013. [Google Scholar] [CrossRef]
- Zhao, L.; Oppenheimer, M.; Zhu, Q.; Baldwin, J.W.; Ebi, K.L.; Bou-Zeid, E.; Guan, K.; Liu, X. Interactions Between Urban Heat Islands and Heat Waves. Environ. Res. Lett. 2018, 13, 034003. [Google Scholar] [CrossRef]
- Callejas, I.J.A. Relationship between Land Use/Cover and Surface Temperatures in the Urban Agglomeration of Cuiabá-Várzea Grande, Central Brazil. J. Appl. Remote Sens. 2011, 5, 053569. [Google Scholar] [CrossRef]
- Weng, Q.; Rajasekar, U.; Hu, X. Modeling Urban Heat Islands and Their Relationship with Impervious Surface and Vegetation Abundance by Using Aster Images. IEEE Trans. Geosci. Remote Sens. 2011, 49, 4080–4089. [Google Scholar] [CrossRef]
- Fu, P.; Weng, Q. A Time Series Analysis of Urbanization induced Land Use and Land Cover Change and Its Impact on Land Surface Temperature with Landsat Imagery. Remote Sens. Environ. 2016, 175, 205–214. [Google Scholar] [CrossRef]
- Cui, Y.; Xiao, X.; Doughty, R.B.; Qin, Y.; Liu, S.; Li, N.; Zhao, G.; Dong, J. The Relationships Between Urban-Rural Temperature Difference and Vegetation in Eight Cities of the Great Plains. Front. Earth Sci. 2019, 13, 290–302. [Google Scholar] [CrossRef]
- Melaas, E.K.; Wang, J.A.; Miller, D.L.; Friedl, M.A. Interactions between Urban Vegetation and Surface Urban Heat Islands: A Case Study in the Boston Metropolitan Region. Environ. Res. Lett. 2016, 11, 054020. [Google Scholar] [CrossRef]
- Li, X.; Li, W.; Middel, A.; Harlan, S.L.; Brazel, A.J.; Turner, B.L. Remote Sensing of the Surface Urban Heat Island and Land Architecture in Phoenix, Arizona: Combined Effects of Land Composition and Configuration And Cadastral–Demographic–Economic Factors. Remote Sens. Environ. 2016, 174, 233–243. [Google Scholar] [CrossRef]
- Peng, J.; Xie, P.; Liu, Y.; Ma, J. Urban Thermal Environment Dynamics and Associated Landscape Pattern Factors: A Case Study in the Beijing Metropolitan Region. Remote Sens. Environ. 2016, 173, 145–155. [Google Scholar] [CrossRef]
- Ferreira, L.S.; Duarte, D.H.S. Exploring The Relationship between Urban Form, Land Surface Temperature and Vegetation Indices in A Subtropical Megacity. Urban Clim. 2019, 27, 105–123. [Google Scholar] [CrossRef]
- Li, J.X.; Song, C.H.; Cao, L.; Zhu, F.G.; Meng, X.L.; Wu, J.G. Impacts of Landscape Structure on Surface Urban Heat Islands: A Case Study of Shanghai, China. Remote Sens. Environ. 2011, 115, 3249–3263. [Google Scholar] [CrossRef]
- Connors, J.P.; Galletti, C.S.; Chow, W.T.L. Landscape Configuration and Urban Heat Island Effects: Assessing the Relationship between Landscape Characteristics and Land Surface Temperature in Phoenix, Arizona. Landsc. Ecol. 2012, 28, 271–283. [Google Scholar] [CrossRef]
- Estoque, R.C.; Murayama, Y.; Myint, S.W. Effects Of Landscape Composition and Pattern on Land Surface Temperature: An Urban Heat Island Study in the Megacities of Southeast Asia. Sci. Total Environ. 2017, 577, 349–359. [Google Scholar] [CrossRef]
- Li, Y.; Sun, Y.; Li, J.; Gao, C. Socioeconomic Drivers of Urban Heat Island Effect: Empirical Evidence From Major Chinese Cities. Sustain. Cities Soc. 2020, 63, 102425. [Google Scholar] [CrossRef]
- Peng, S.; Piao, S.; Ciais, P.; Friedlingstein, P.; Ottle, C.; Breon, F.M.; Nan, H.; Zhou, L.; Myneni, R.B. Surface Urban Heat Island across 419 Global Big Cities. Environ. Sci. Technol. 2012, 46, 696–703. [Google Scholar] [CrossRef] [PubMed]
- Sun, R.; Lü, Y.; Yang, X.; Chen, L. Understanding the Variability of Urban Heat Islands From Local Background Climate and Urbanization. J. Clean. Prod. 2019, 208, 743–752. [Google Scholar] [CrossRef]
- Geng, X.; Zhang, D.; Li, C.; Yuan, Y.; Yu, Z.; Wang, X. Impacts of Climatic Zones on Urban Heat Island: Spatiotemporal Variations, Trends, and Drivers in China From 2001–2020. Sustain. Cities Soc. 2023, 89, 104303. [Google Scholar] [CrossRef]
- Wang, Y.; Du, H.; Xu, Y.; Lu, D.; Wang, X.; Guo, Z. Temporal and Spatial Variation Relationship And Influence Factors on Surface Urban Heat Island and Ozone Pollution in the Yangtze River Delta, China. Sci. Total Environ. 2018, 631–632, 921–933. [Google Scholar] [CrossRef] [PubMed]
- Wang, J.; Huang, B.; Fu, D.; Atkinson, P.M.; Zhang, X. Response of Urban Heat Island to Future Urban Expansion over the Beijing–Tianjin–Hebei Metropolitan Area. Appl. Geogr. 2016, 70, 26–36. [Google Scholar] [CrossRef]
- Fu, X.; Yao, L.; Sun, S. Accessing The Heat Exposure Risk in Beijing–Tianjin–Hebei Region based on Heat Island Footprint Analysis. Atmosphere 2022, 13, 739. [Google Scholar] [CrossRef]
- Wang, Y.; Ren, Y.; Song, L.; Xiang, Y. Responses of Extreme High Temperatures to Urbanization in the Beijing–Tianjin–Hebei Urban Agglomeration in the Context of a Changing Climate. Meteorol. Appl. 2021, 28, e2024. [Google Scholar] [CrossRef]
- Yu, W.; Zhou, W.; Qian, Y.; Yan, J. A New Approach for Land cover Classification and Change Analysis: Integrating Backdating and an Object-Based Method. Remote Sens. Environ. 2016, 177, 37–47. [Google Scholar] [CrossRef]
- Zhou, W.; Troy, A. An Object-Oriented Approach for Analysing and Characterizing Urban Landscape at the Parcel Level. Int. J. Remote Sens. 2008, 29, 3119–3135. [Google Scholar] [CrossRef]
- Zhou, W.; Jiao, M.; Yu, W.; Wang, J. Urban Sprawl in a Megaregion: A Multiple Spatial and Temporal Perspective. Ecol. Indic. 2019, 96, 54–66. [Google Scholar] [CrossRef]
- Hu, X.; Zhou, W.; Qian, Y.; Yu, W. Urban Expansion and Local Land-Cover Change Both Significantly Contribute to Urban Warming, but Their Relative Importance Changes over Time. Landsc. Ecol. 2017, 32, 763–780. [Google Scholar] [CrossRef]
- Solano, R.; Didan, K.; Jacobson, A.; Huete, A. Modis Vegetation Indices (Mod13) C5 User’s Guide; Vegetation Index Adn Phenology Lab, The University of Arizona: Tuscon, AZ, USA, 2010. [Google Scholar]
- Oke, T.R.; Johnson, G.T.; Steyn, D.G.; Watson, I.D. Simulation of Surface Urban Heat Islands Under ‘Ideal’conditions at Night Part 2: Diagnosis Of Causation. Bound. Layer Meteorol. 1991, 56, 339–358. [Google Scholar] [CrossRef]
- National Bureau of Statistics of China. China City Statistical Yearbook; China Statistics Press: Beijing, China, 2000–2020. (In Chinese) [Google Scholar]
- Meng, Q.; Zhang, L.; Sun, Z.; Meng, F.; Wang, L.; Sun, Y. Characterizing Spatial and Temporal Trends of Surface Urban Heat Island Effect in an Urban Main Built-Up Area: A 12-Year Case Study in Beijing, China. Remote Sens. Environ. 2018, 204, 826–837. [Google Scholar] [CrossRef]
- Mohammad Harmay, N.S.; Kim, D.; Choi, M. Urban Heat Island Associated With Land Use/Land Cover And Climate Variations In Melbourne, Australia. Sustain. Cities Soc. 2021, 69, 102861. [Google Scholar] [CrossRef]
- Chen, M.; Zhou, Y.; Hu, M.; Zhou, Y. Influence of Urban Scale and Urban Expansion on the Urban Heat Island Effect in Metropolitan Areas: Case Study of Beijing–Tianjin–Hebei Urban Agglomeration. Remote Sens. 2020, 12, 3491. [Google Scholar] [CrossRef]
- Xu, H.; Li, C.; Wang, H.; Zhou, R.; Liu, M.; Hu, Y. Long-Term Spatiotemporal Patterns and Evolution of Regional Heat Islands in the Beijing–Tianjin–Hebei Urban Agglomeration. Remote Sens. 2022, 14, 2478. [Google Scholar] [CrossRef]
- Martilli, A.; Krayenhoff, E.S.; Nazarian, N. Is the Urban Heat Island Intensity Relevant for Heat Mitigation Studies? Urban Clim. 2020, 31, 100541. [Google Scholar] [CrossRef]
- Zander, K.K.; Cadag, J.R.; Escarcha, J.; Garnett, S.T. Perceived Heat Stress Increases with Population Density in Urban Philippines. Environ. Res. Lett. 2018, 13, 084009. [Google Scholar] [CrossRef]
- Zhou, D.; Zhao, S.; Liu, S.; Zhang, L. Spatiotemporal Trends of Terrestrial Vegetation Activity Along the Urban Development Intensity Gradient in China’s 32 Major Cities. Sci. Total Environ. 2014, 488–489, 136–145. [Google Scholar] [CrossRef] [PubMed]
- Yao, R.; Wang, L.; Huang, X.; Zhang, W.; Li, J.; Niu, Z. Interannual Variations in Surface Urban Heat Island Intensity and Associated Drivers in China. J. Environ. Manag. 2018, 222, 86–94. [Google Scholar] [CrossRef]
- Yao, R.; Wang, L.; Huang, X.; Gong, W.; Xia, X. Greening in Rural Areas Increases the Surface Urban Heat Island Intensity. Geophys. Res. Lett. 2019, 46, 2204–2212. [Google Scholar] [CrossRef]
- Peng, J.; Jia, J.; Liu, Y.; Li, H.; Wu, J. Seasonal Contrast of the Dominant Factors for Spatial Distribution of Land Surface Temperature in Urban Areas. Remote Sens. Environ. 2018, 215, 255–267. [Google Scholar] [CrossRef]
- Feng, R.; Wang, F.; Wang, K.; Wang, H.; Li, L. Urban Ecological Land and Natural-Anthropogenic Environment Interactively Drive Surface Urban Heat Island: An Urban Agglomeration-Level Study in China. Environ. Int. 2021, 157, 106857. [Google Scholar] [CrossRef] [PubMed]
- Peng, S.; Feng, Z.; Liao, H.; Huang, B.; Peng, S.; Zhou, T. Spatial-Temporal Pattern of, and Driving Forces for, Urban Heat Island in China. Ecol. Indic. 2019, 96, 127–132. [Google Scholar] [CrossRef]
- Grassein, F.; Lavorel, S.; Till-Bottraud, I. The Importance of Biotic Interactions and Local Adaptation for Plant Response to Environmental Changes: Field Evidence Along an Elevational Gradient. Glob. Chang. Biol. 2014, 20, 1452–1460. [Google Scholar] [CrossRef] [PubMed]
- Mildrexler, D.J.; Zhao, M.; Running, S.W. A Global Comparison between Station Air Temperatures and Modis Land Surface Temperatures Reveals the Cooling Role of Forests. J. Geophys. Res. 2011, 116. [Google Scholar] [CrossRef]
- Sun, H.; Chen, Y.; Zhan, W. Comparing Surface- and Canopy-Layer Urban Heat Islands over Beijing Using Modis Data. Int. J. Remote Sens. 2015, 36, 5448–5465. [Google Scholar] [CrossRef]
- Liu, Y.; Xu, Y.; Zhang, Y.; Han, X.; Weng, F.; Xuan, C.; Shu, W. Impacts of the Urban Spatial Landscape in Beijing on Surface and Canopy Urban Heat Islands. J. Meteorol. Res. 2023, 36, 882–899. [Google Scholar] [CrossRef]
Figure 1.
Study area: the Beijing–Tianjin–Hebei (BTH) megaregion.

Figure 2.
Classification maps for Beijing–Tianjin–Hebei megaregion from 2000 to 2020: (a) 2000, (b) 2005, (c) 2010, (d) 2015, (e) 2020.
Figure 2.
Classification maps for Beijing–Tianjin–Hebei megaregion from 2000 to 2020: (a) 2000, (b) 2005, (c) 2010, (d) 2015, (e) 2020.
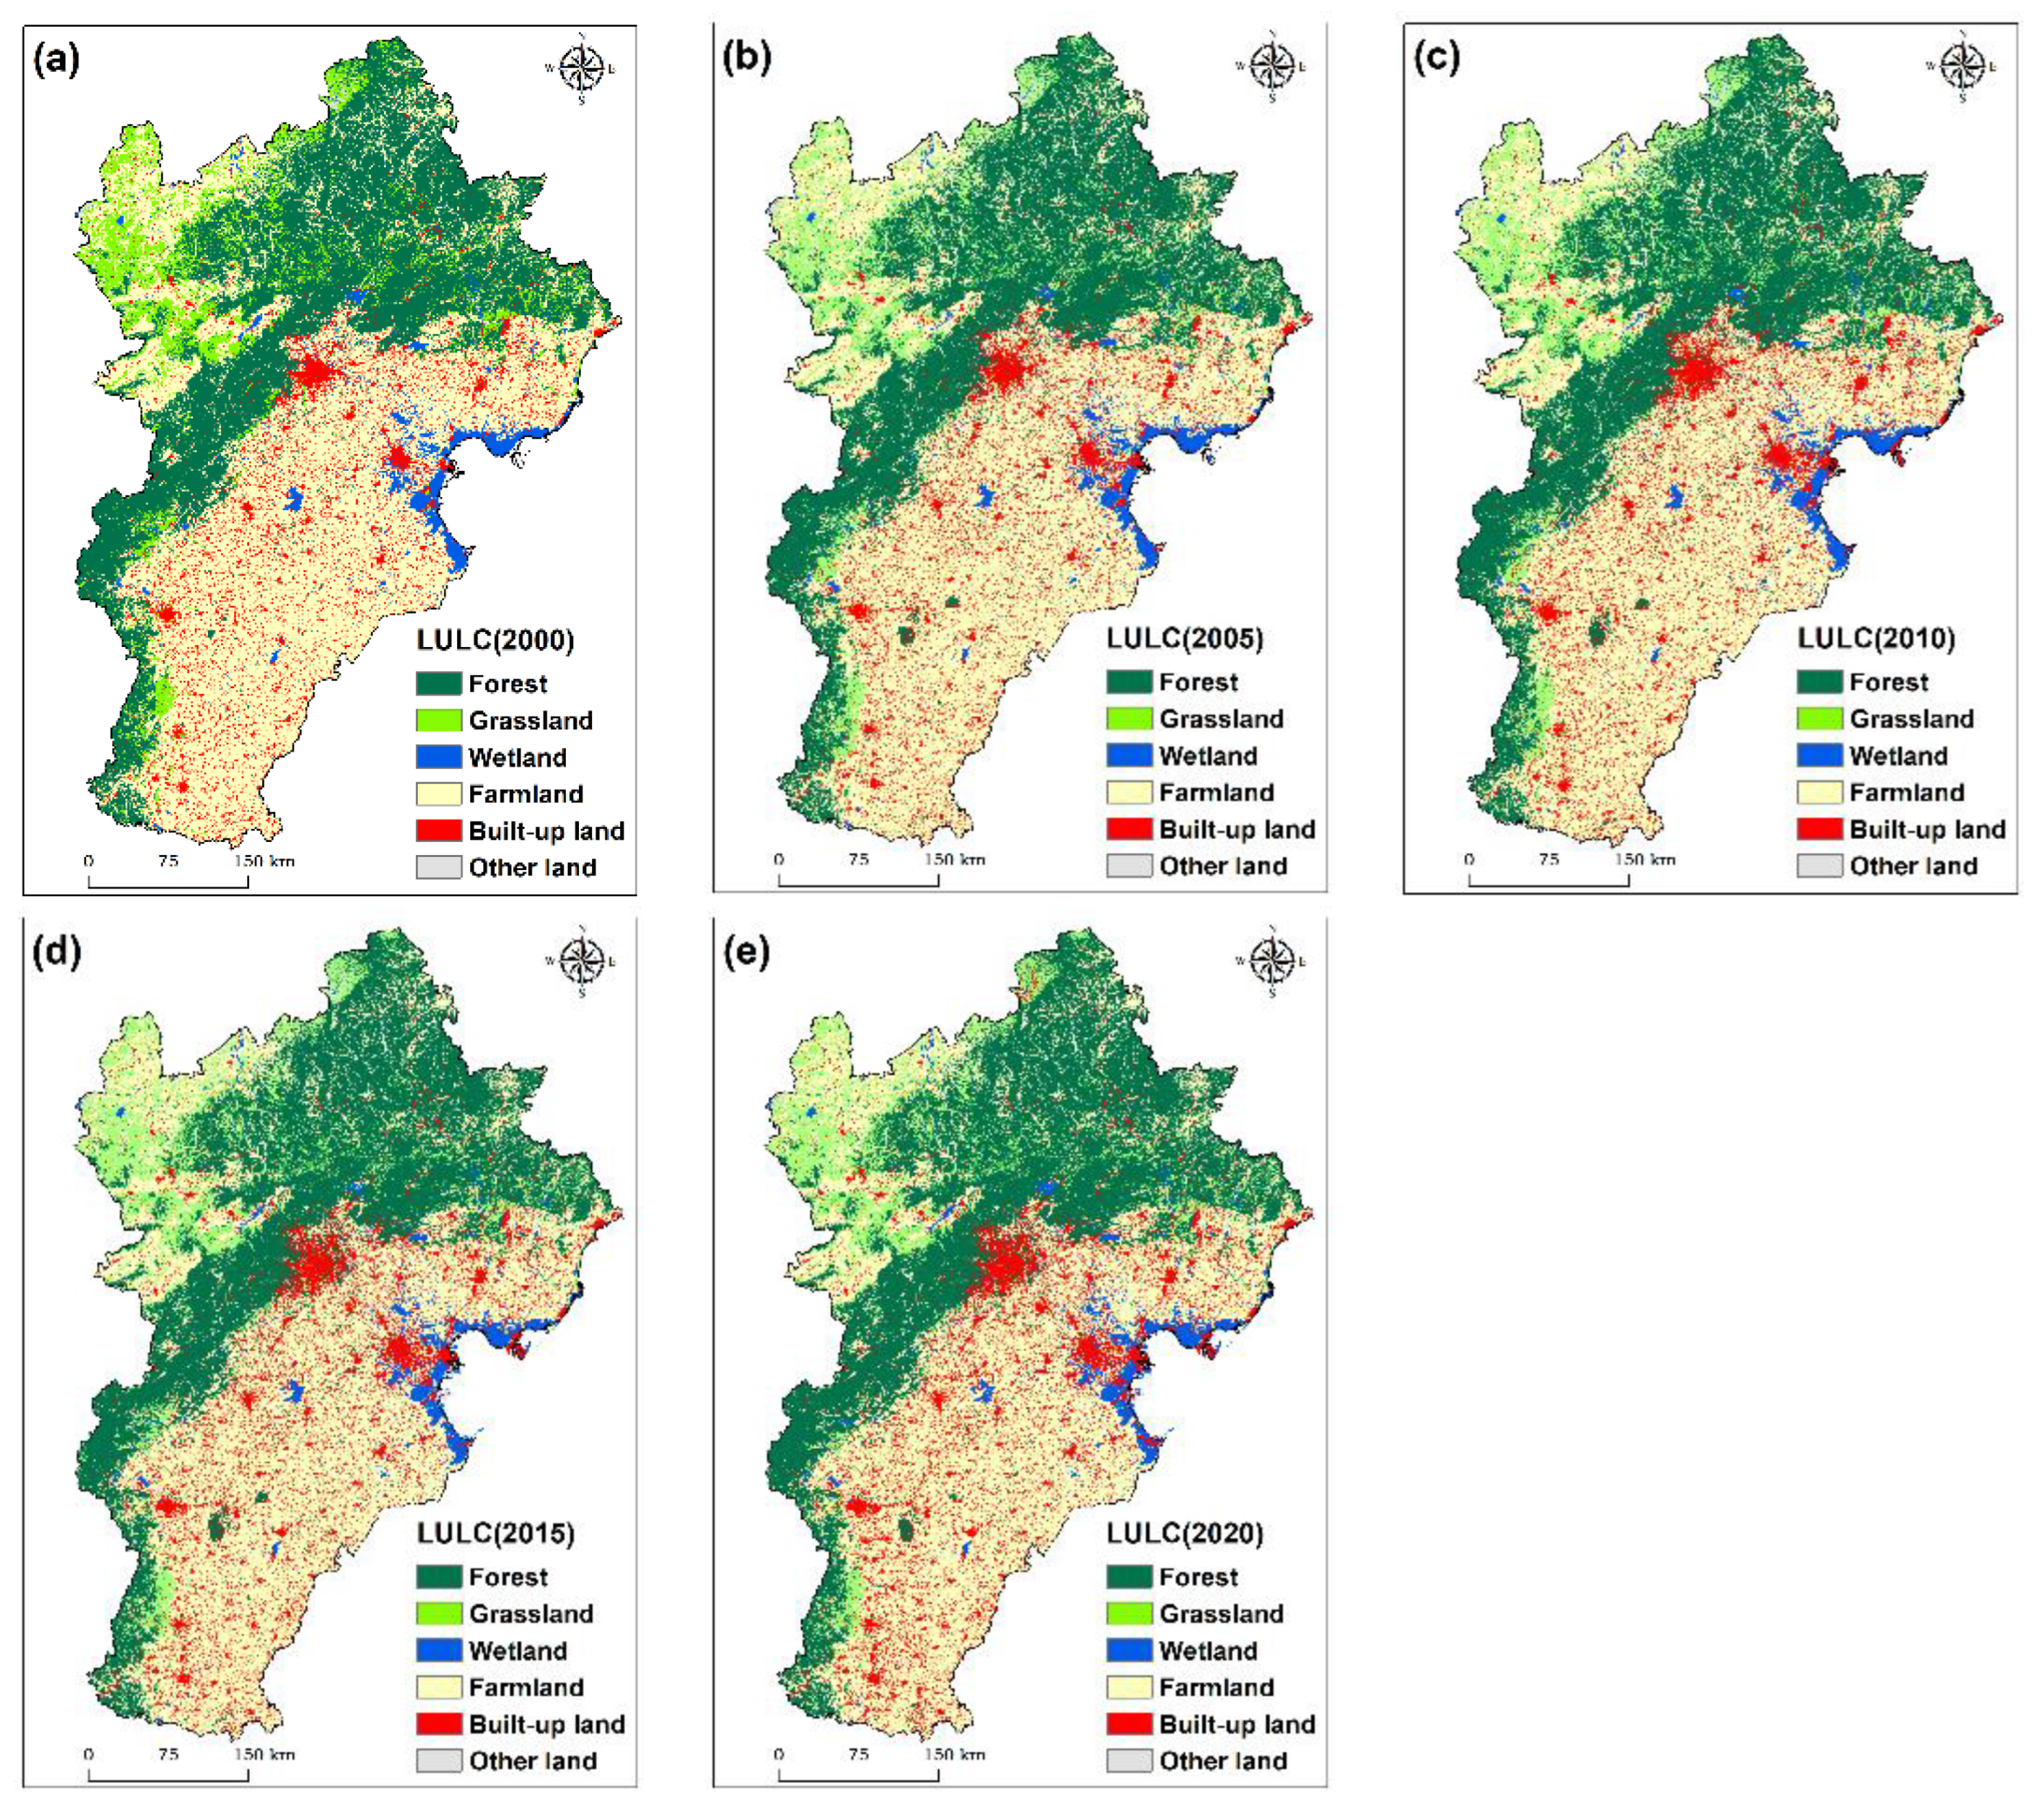
Figure 3.
Urban areas mapping in 2000, 2005, 2010, 2015, and 2020 showing Beijing as an example.
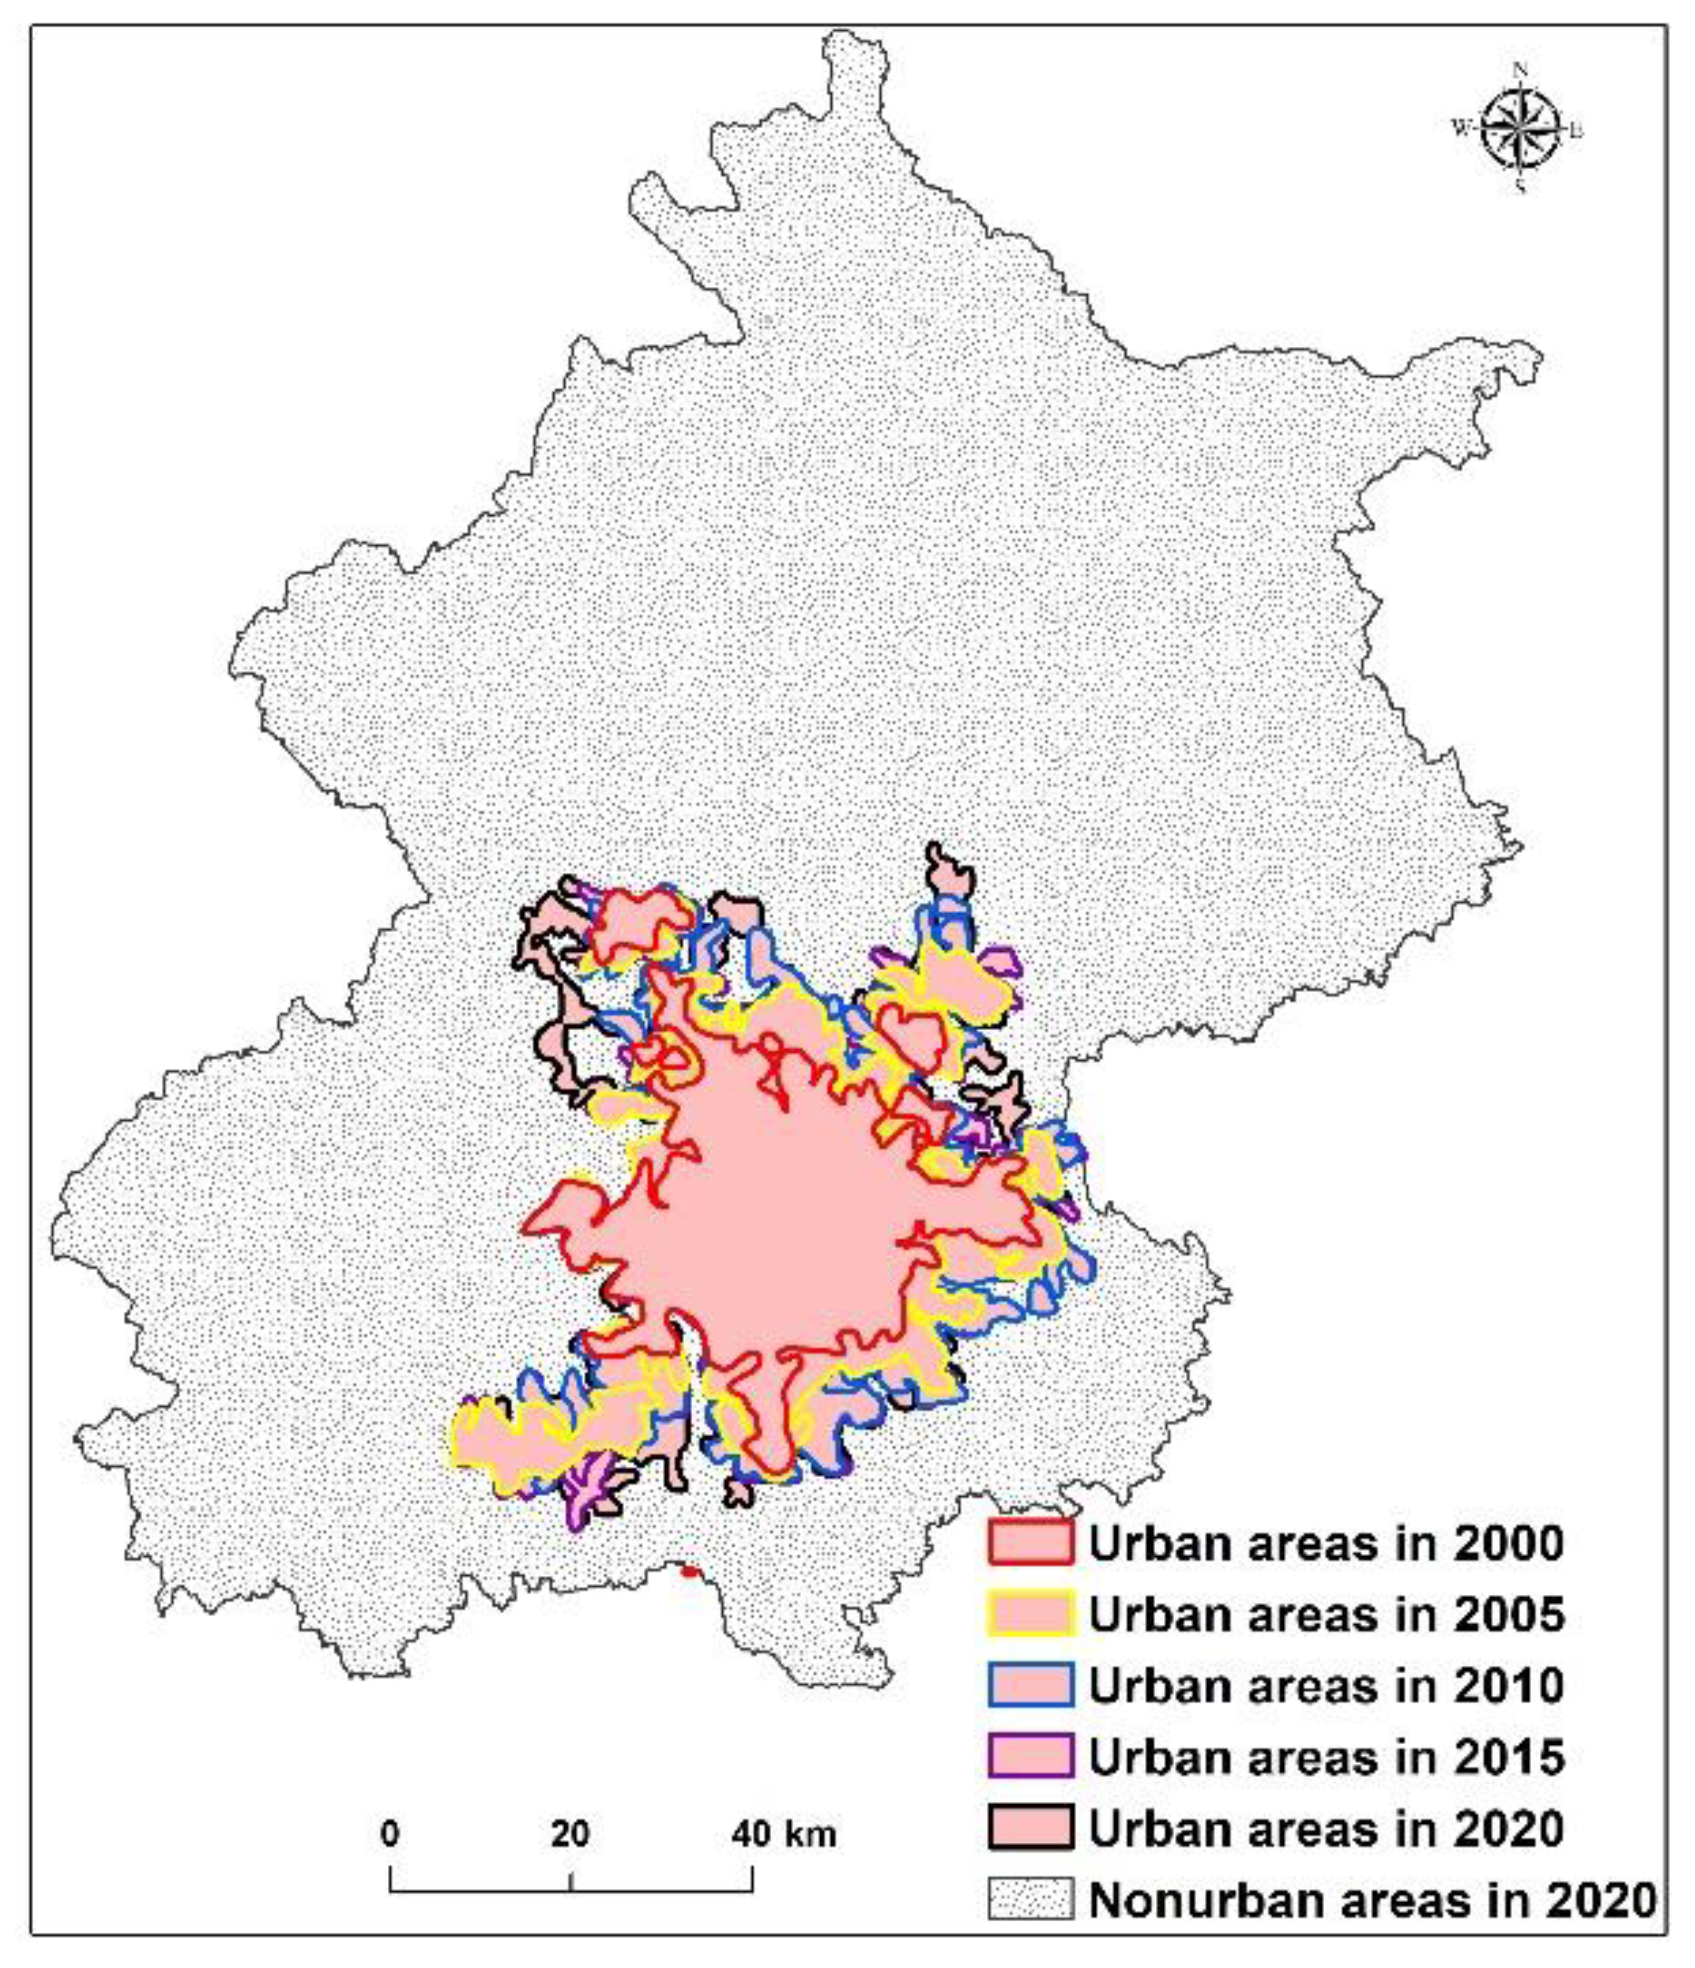
Figure 4.
The spatial pattern of average LST of summer day of the years 2000 (a) and 2020 (b).
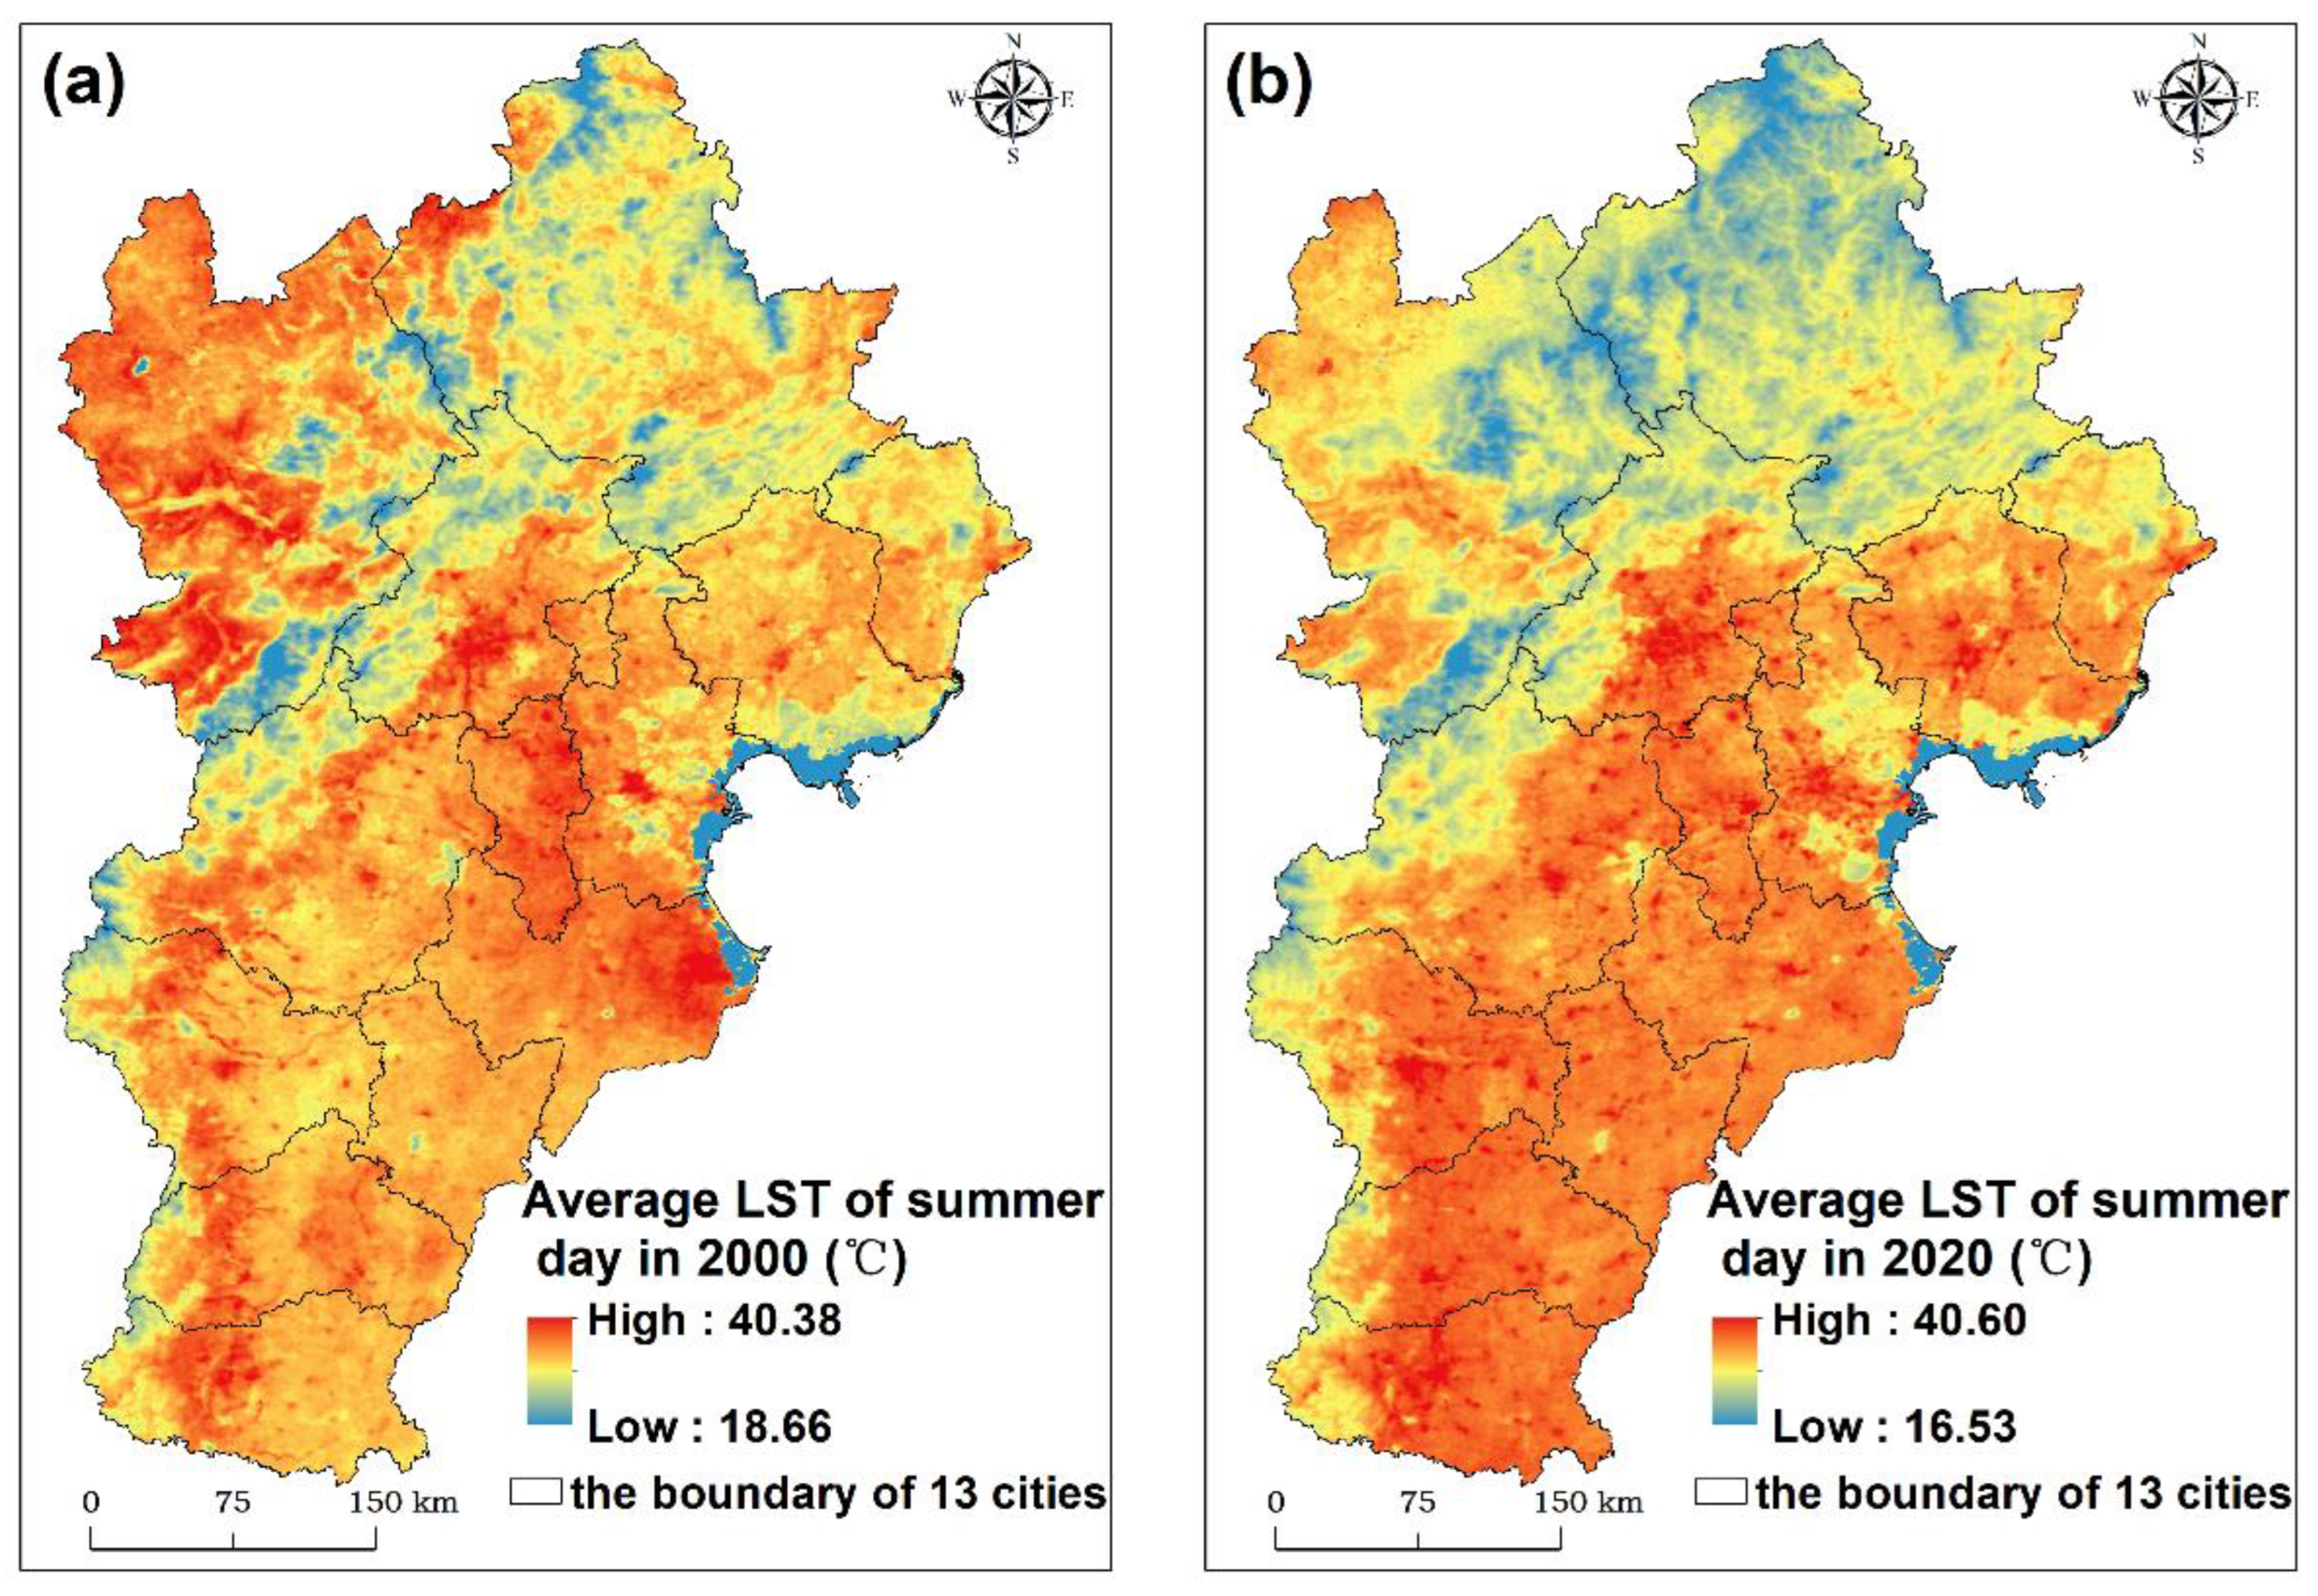
Figure 5.
The trend of socioecological factors for the 13 cities from 2000 to 2020: (a) mean EVI, (b) population density, (c) the percentage of BUA, (d) GDP per capita.
Figure 5.
The trend of socioecological factors for the 13 cities from 2000 to 2020: (a) mean EVI, (b) population density, (c) the percentage of BUA, (d) GDP per capita.
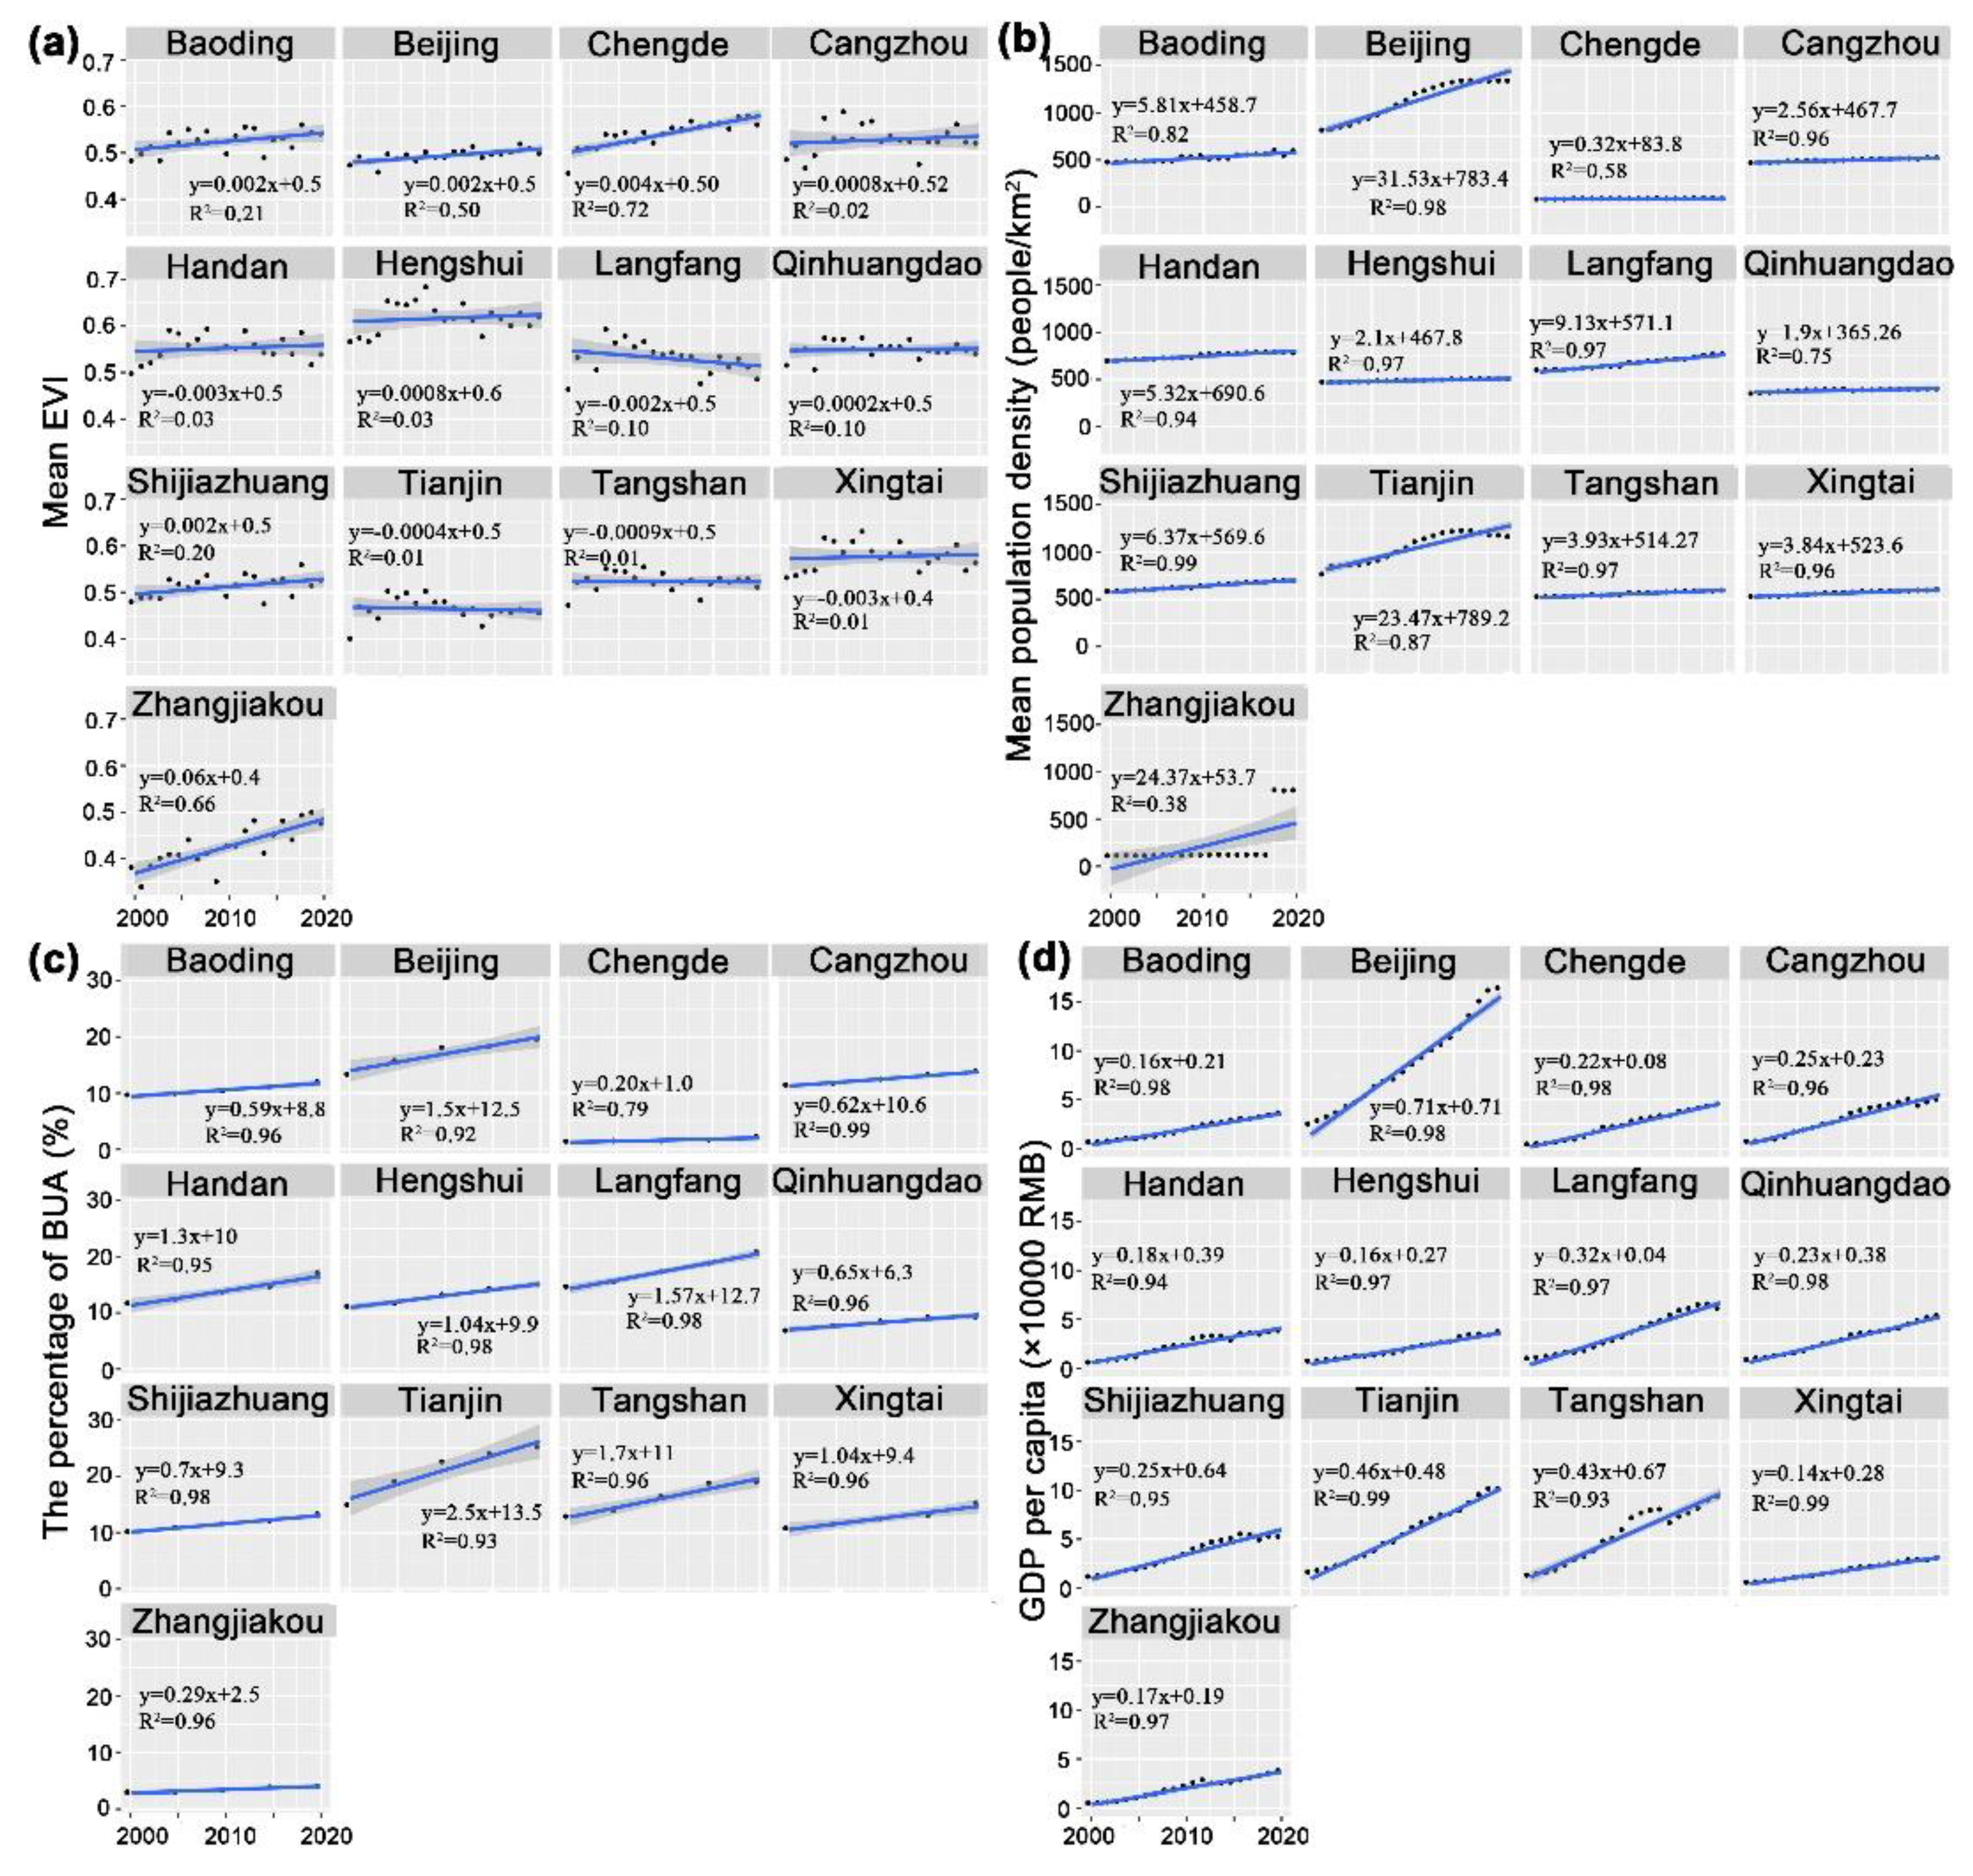
Figure 6.
The spatial distribution of mean SUHII (a) and urban LST (b) in the summer daytime from 2000 to 2020.
Figure 6.
The spatial distribution of mean SUHII (a) and urban LST (b) in the summer daytime from 2000 to 2020.
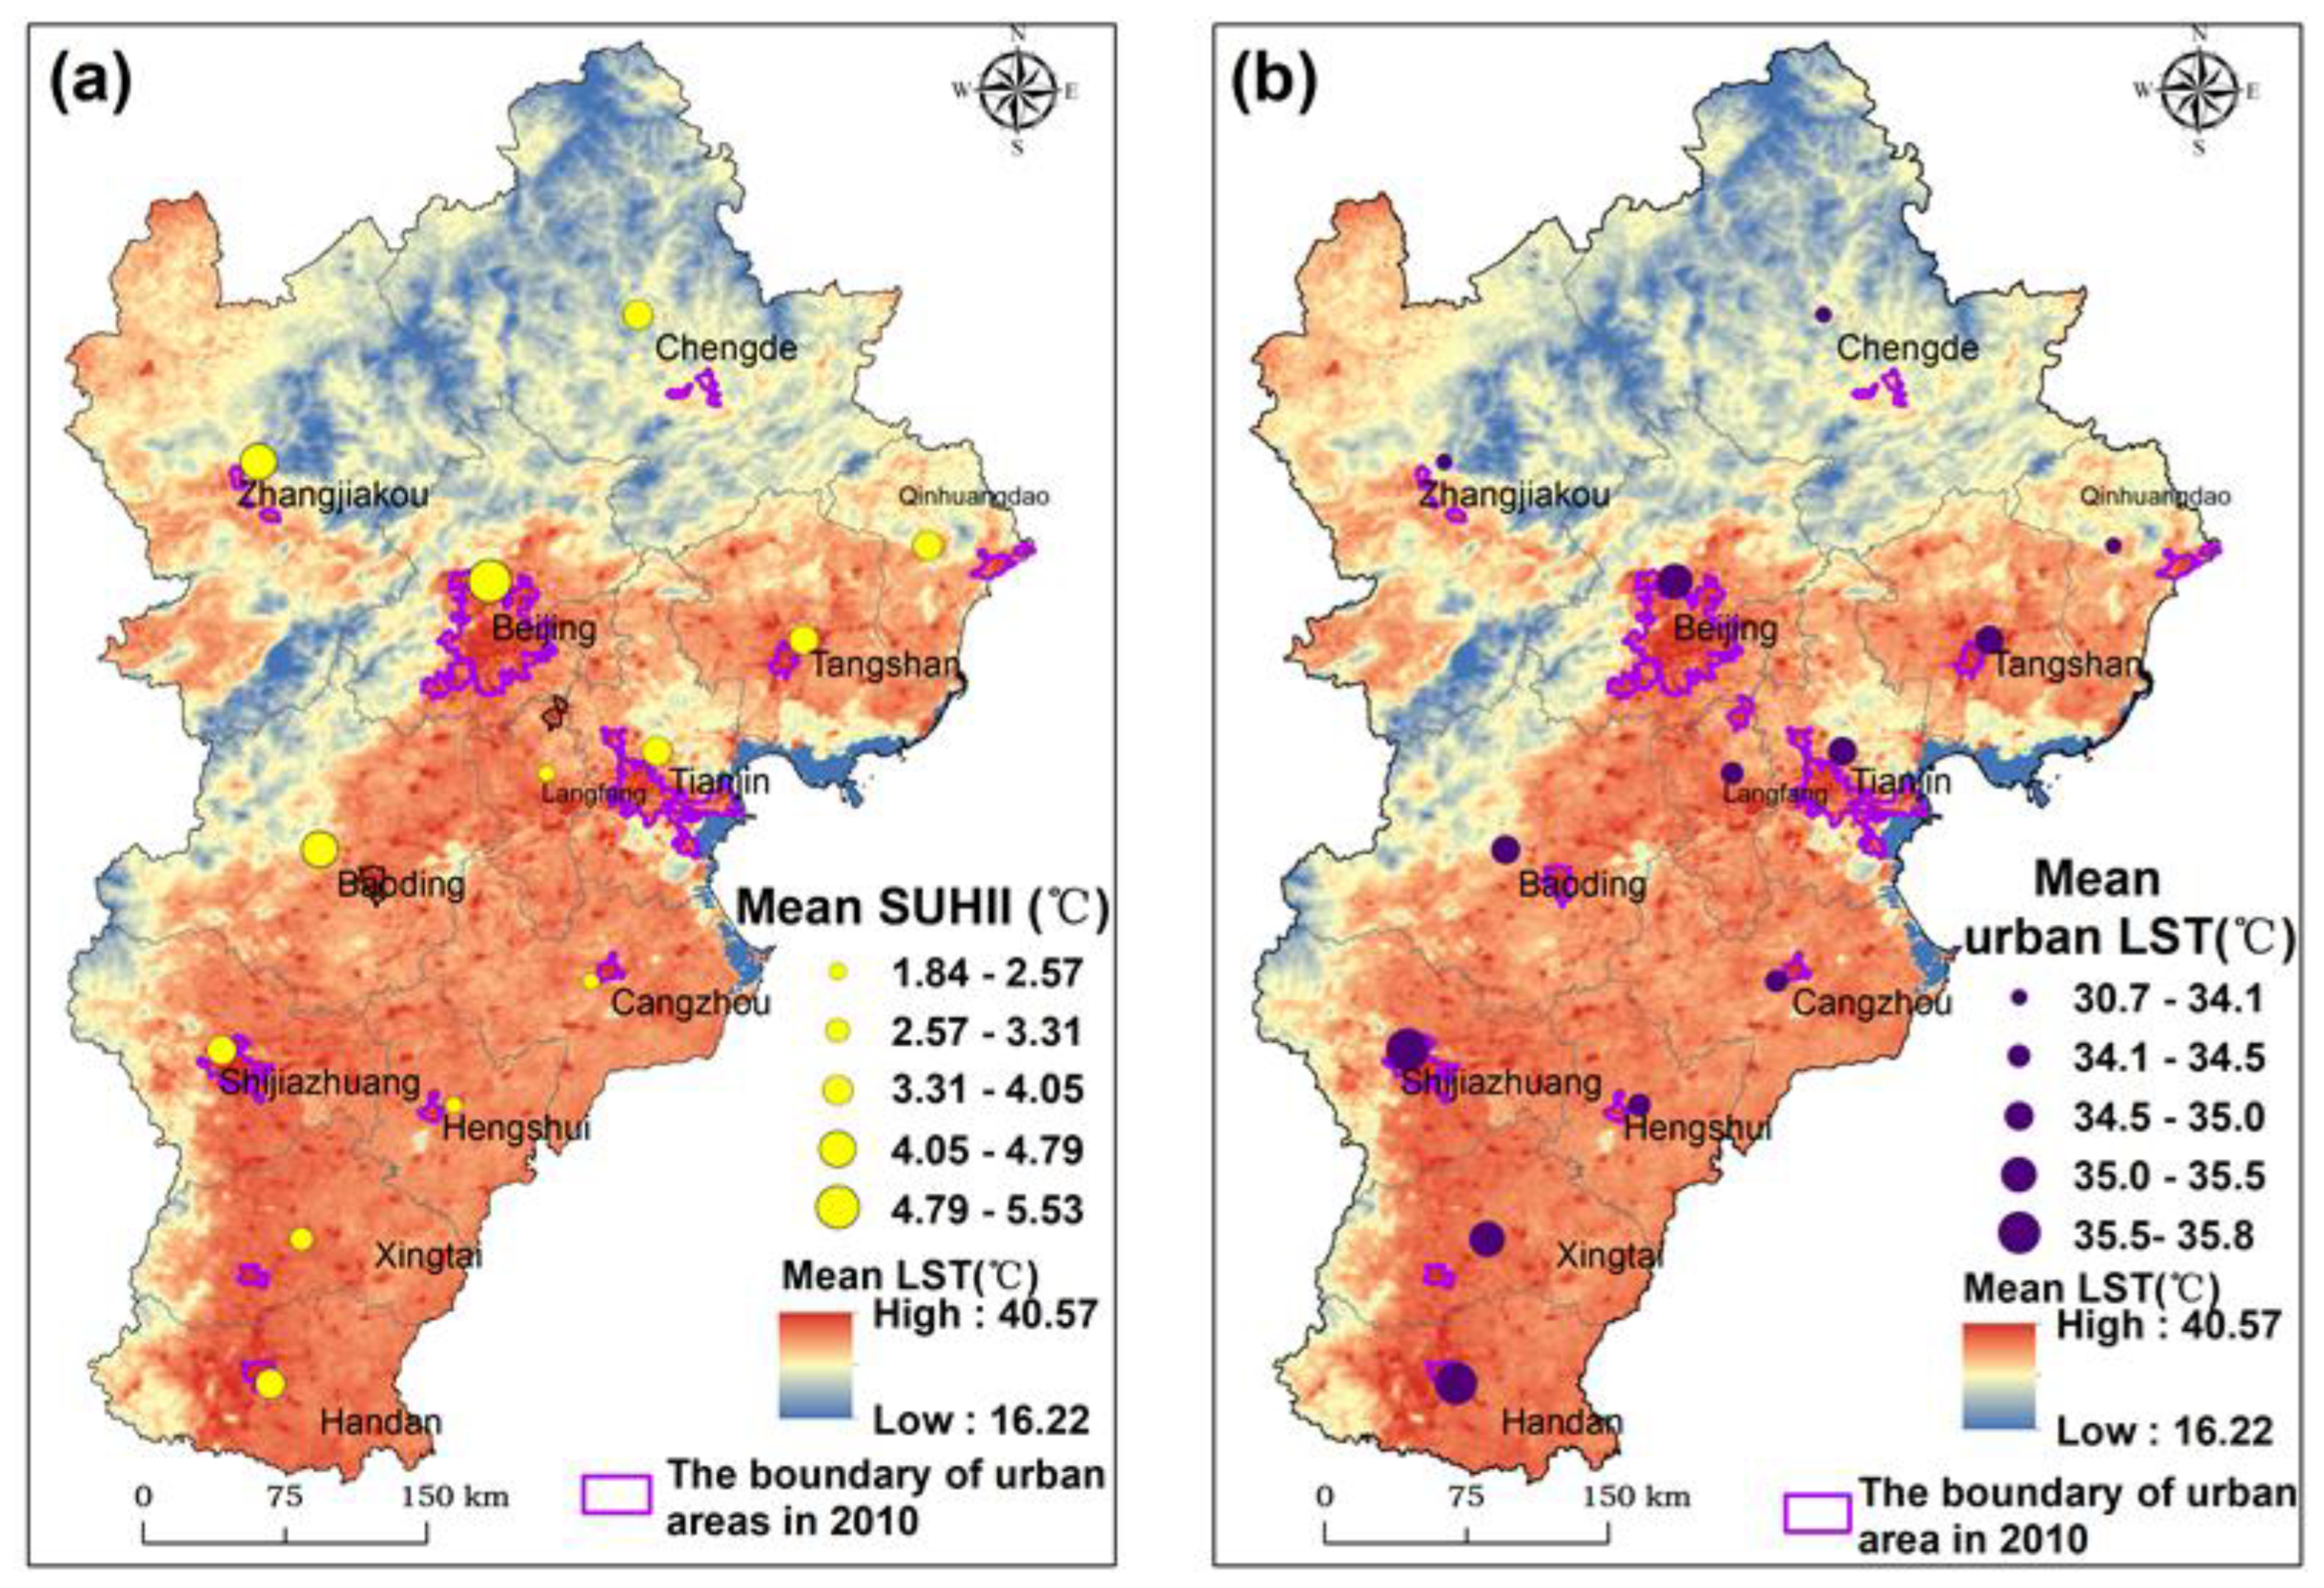
Figure 7.
The trend of mean SUHII in the summer daytime from 2000 to 2020. ** Statistical significance at p = 0.05, * Statistical significance at p = 0.1.
Figure 7.
The trend of mean SUHII in the summer daytime from 2000 to 2020. ** Statistical significance at p = 0.05, * Statistical significance at p = 0.1.

Figure 8.
The trend of urban LST in the summer daytime from 2000 to 2020. ** Statistical significance at p = 0.05, * Statistical significance at p = 0.1.
Figure 8.
The trend of urban LST in the summer daytime from 2000 to 2020. ** Statistical significance at p = 0.05, * Statistical significance at p = 0.1.
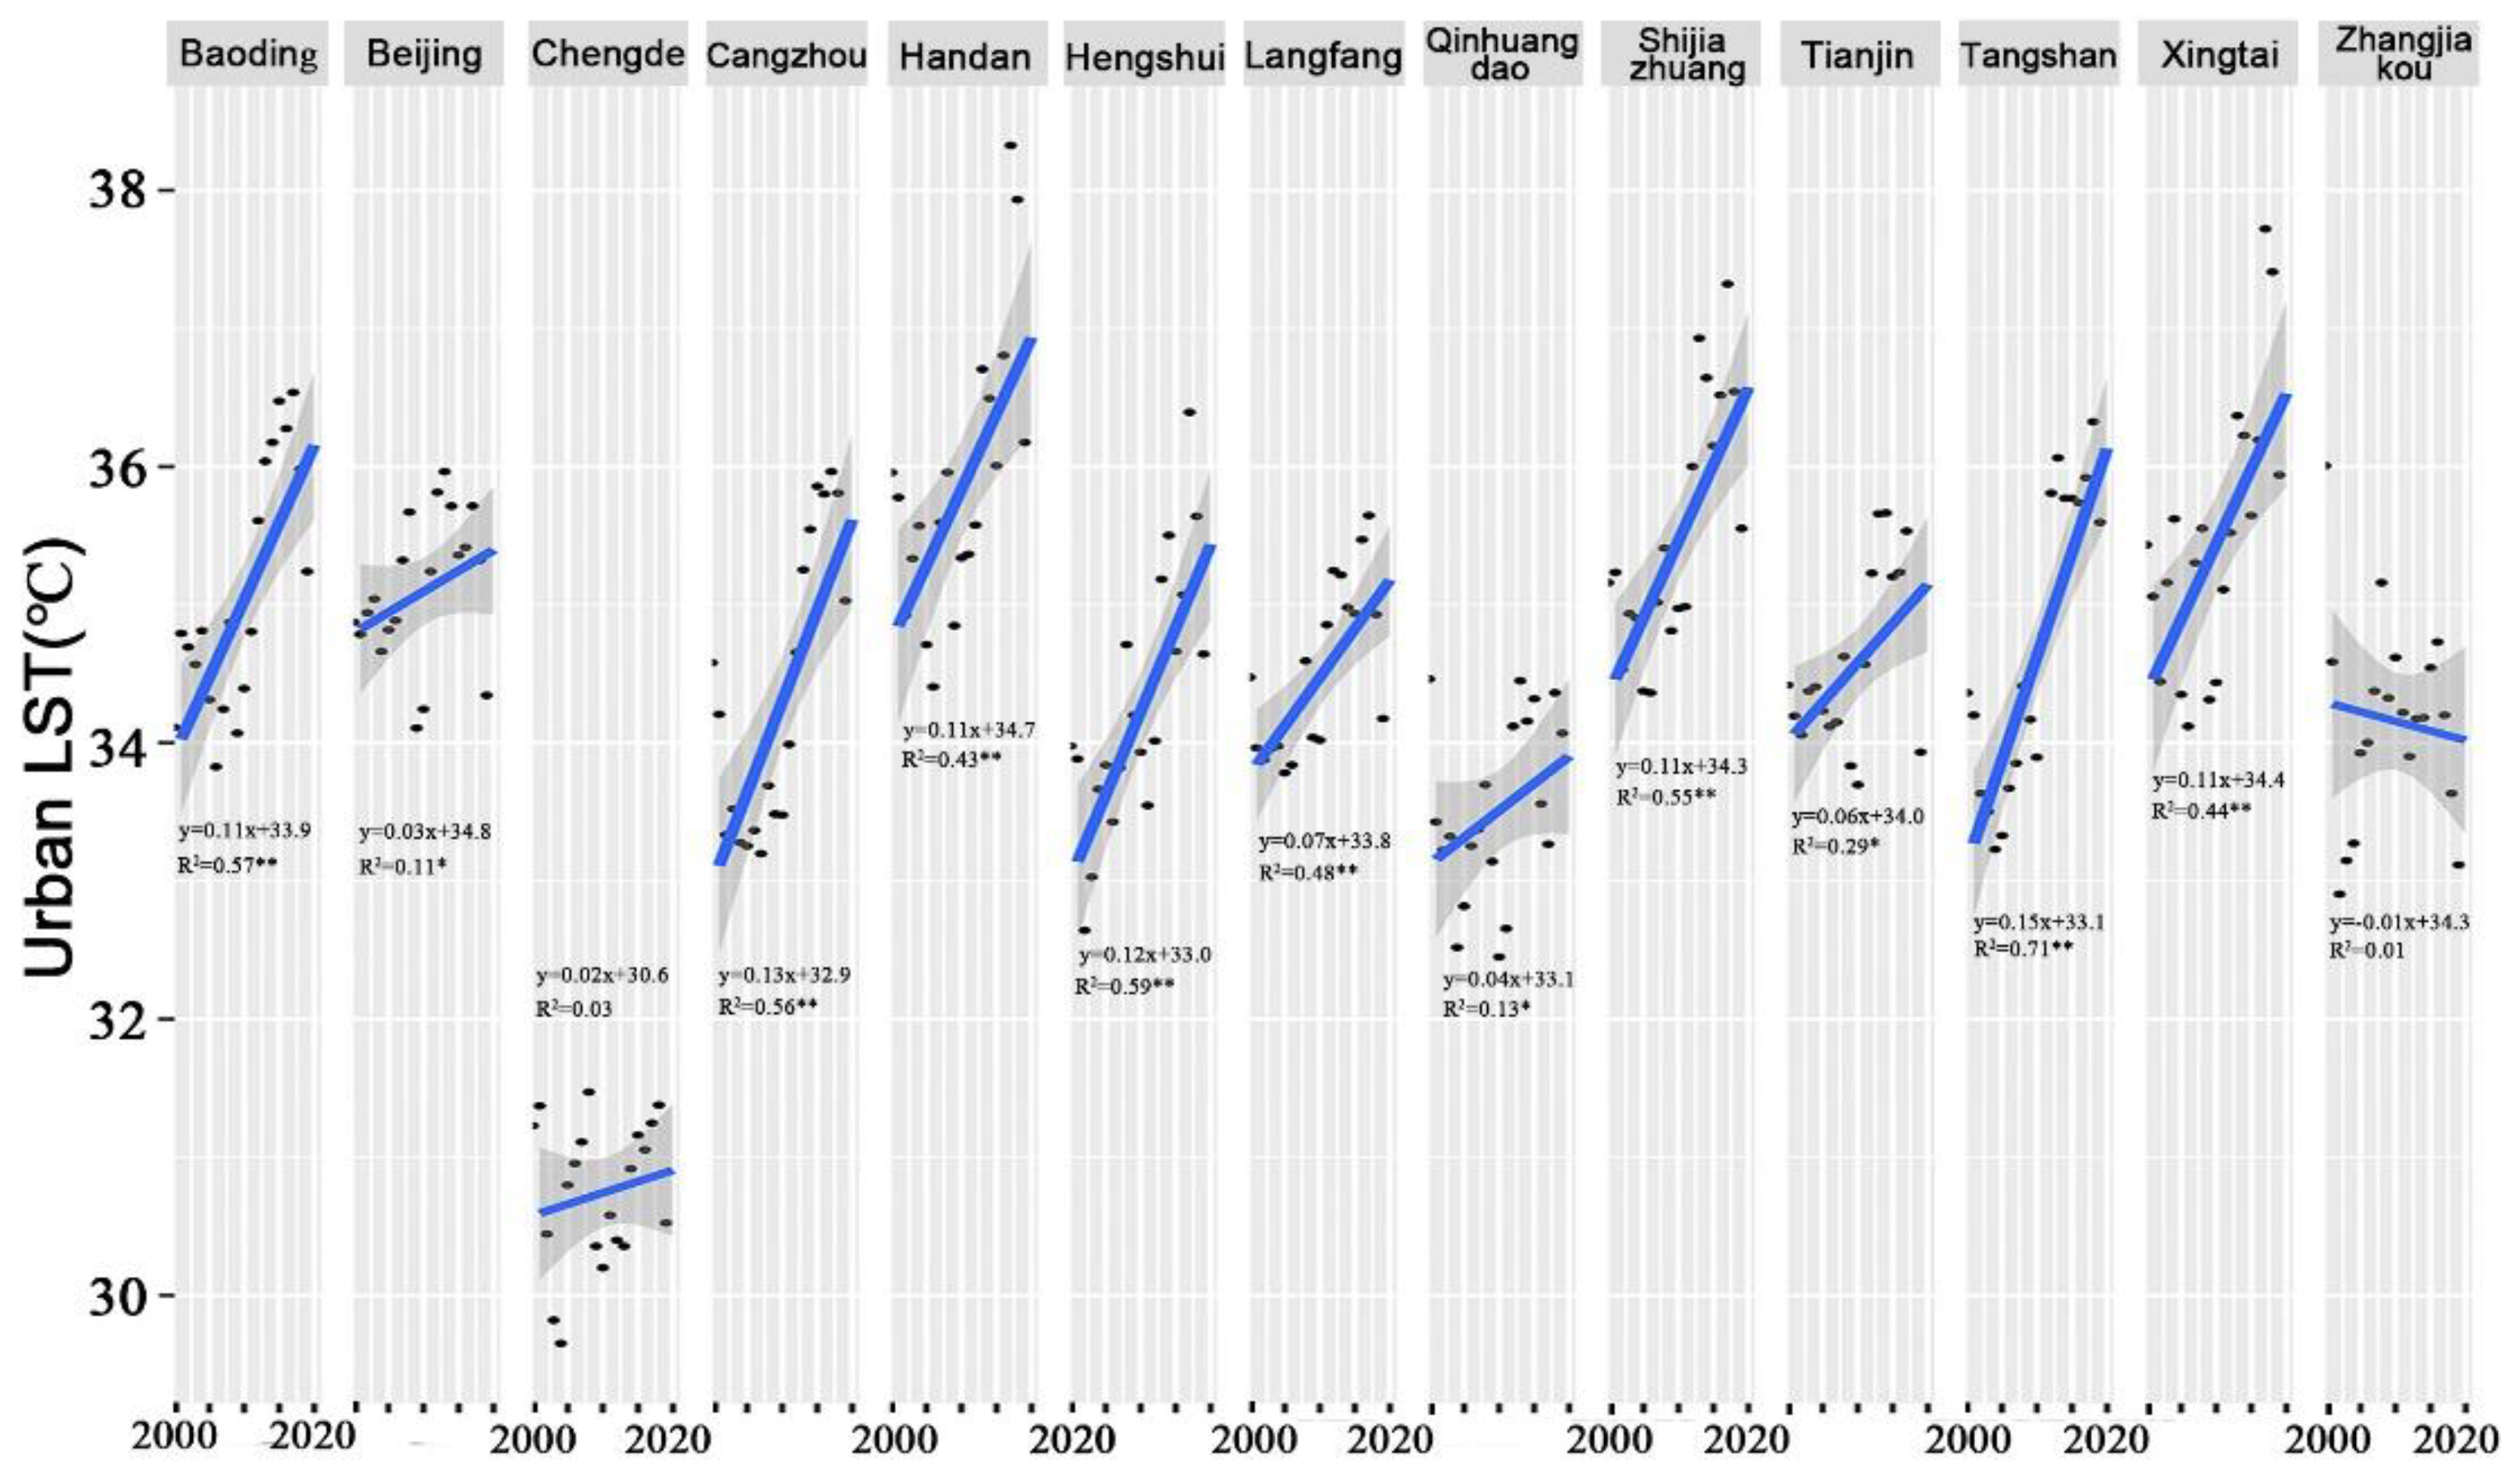
Figure 9.
Relationships between socioecological factors and mean SUHII: (a) mean EVI, (b) mean population density, (c) the percentage of BUA, (d) GDP per capita.
Figure 9.
Relationships between socioecological factors and mean SUHII: (a) mean EVI, (b) mean population density, (c) the percentage of BUA, (d) GDP per capita.
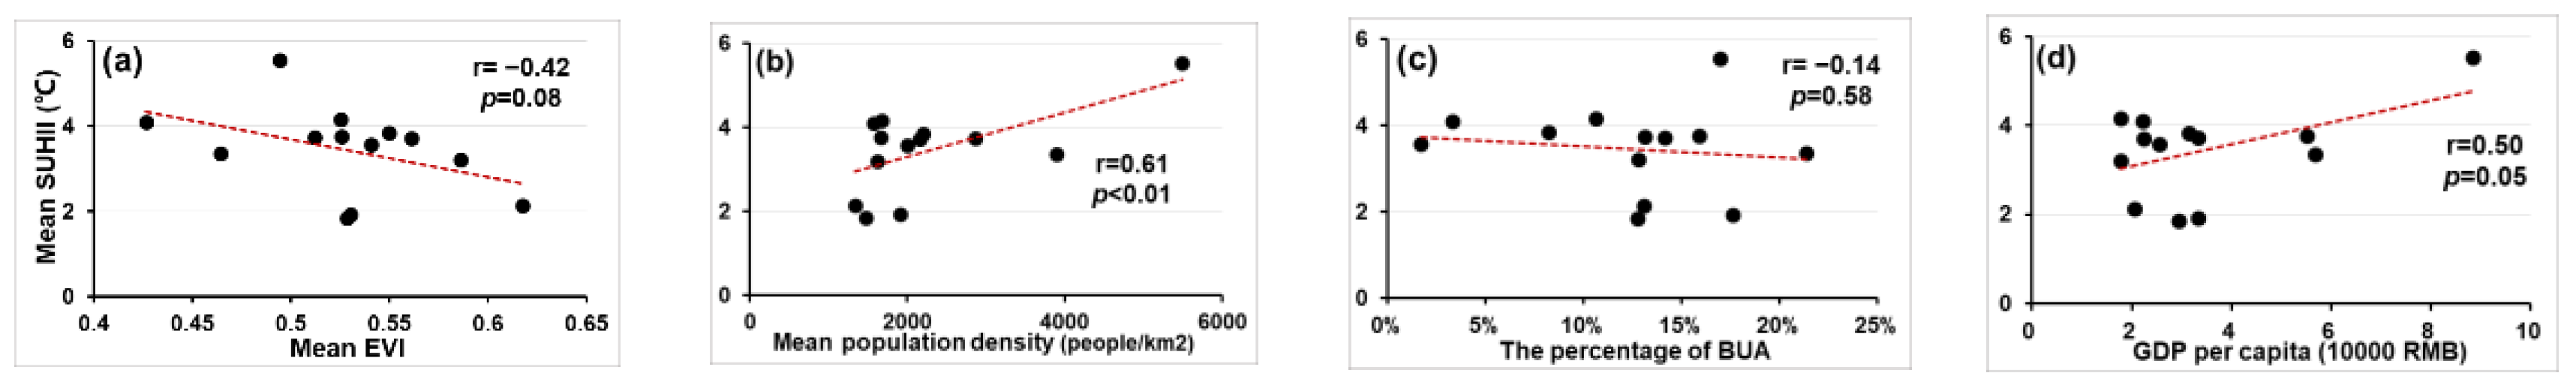
Figure 10.
The correlations between the trends of socioecological factors and the rate of change in SUHII: (a) the trend of EVI, (b) the trend of population density, (c) the trend of GDP per capita.
Figure 10.
The correlations between the trends of socioecological factors and the rate of change in SUHII: (a) the trend of EVI, (b) the trend of population density, (c) the trend of GDP per capita.
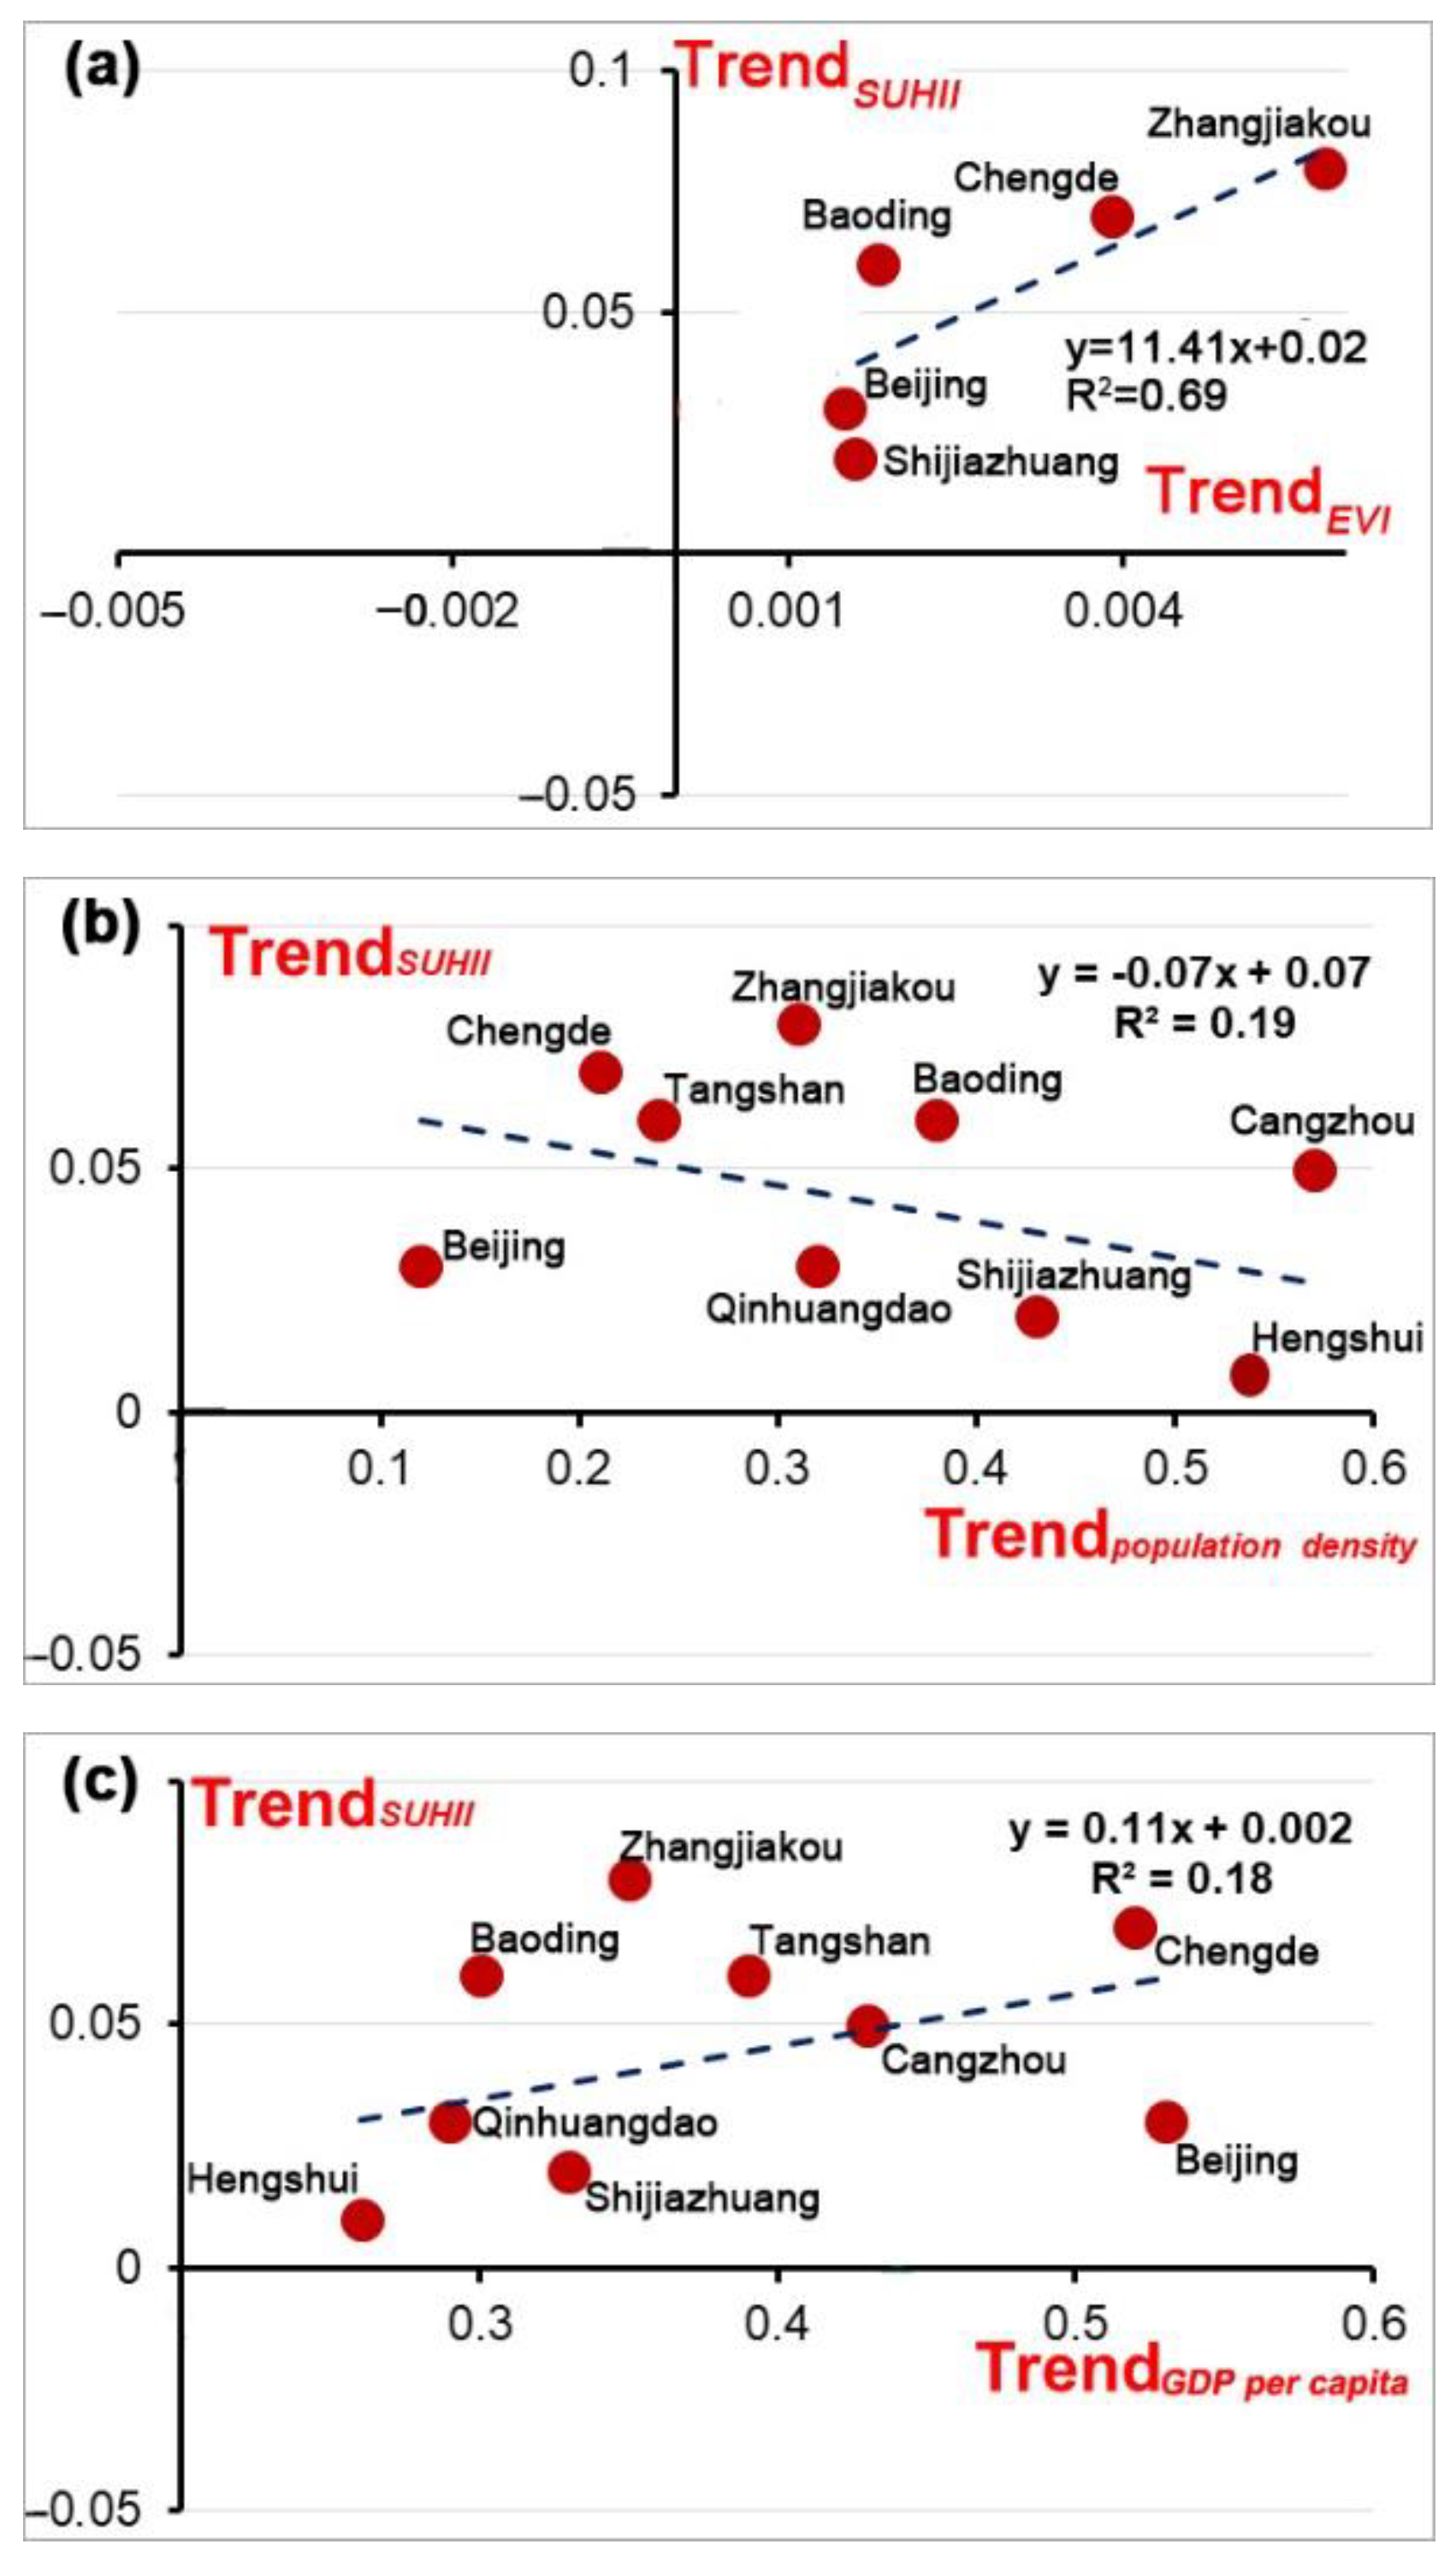
Figure 11.
The distribution of urban LST (a), nonurban LST (b), and SUHII (c) from 2000 to 2020 for all 13 cities.
Figure 11.
The distribution of urban LST (a), nonurban LST (b), and SUHII (c) from 2000 to 2020 for all 13 cities.

Table 1.
Four types of changes in SUHII based on LST change in urban and nonurban areas in the study area.
Table 1.
Four types of changes in SUHII based on LST change in urban and nonurban areas in the study area.
| Change Type of SUHII | Description |
|---|---|
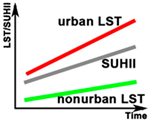 | Cities with increasing trend of SUHII (SUHII↑1): LST in urban and nonurban areas both increase, but there is a greater warming trend in urban areas than in nonurban areas |
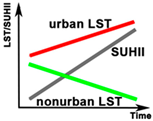 | Cities with increasing trend of SUHII (SUHII↑2):LST in urban areas increases and decreases in nonurban areas. |
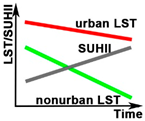 | Cities with increasing trend of SUHII (SUHII↑3): LST in urban and nonurban areas both decrease, but the decreasing rate of LST in nonurban areas is greater than that in urban areas. |
 | Cities with decreasing trend of SUHII (SUHII↓1): LST in urban areas and nonurban areas both increase, but the increasing rate of nonurban areas is greater than that in urban areas. |
Table 2.
Change rate of SUHII and LST in urban and nonurban areas from 2000 to 2020 for the 13 cities.
Table 2.
Change rate of SUHII and LST in urban and nonurban areas from 2000 to 2020 for the 13 cities.
| Type | City | Change Rate (°C/year) | ||
|---|---|---|---|---|
| SUHII | LST in Urban Area | LST in Nonurban Area | ||
SUHII↑1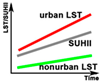 | Tangshan | 0.06 | 0.15 | 0.09 |
| Baoding | 0.06 | 0.11 | 0.05 | |
| Cangzhou | 0.05 | 0.13 | 0.08 | |
| Qinhuangdao | 0.03 | 0.04 | 0.02 | |
| Shijiazhuang | 0.02 | 0.11 | 0.09 | |
| Hengshui | 0.01 | 0.12 | 0.11 | |
| Xingtai | 0.01 | 0.11 | 0.10 | |
SUHII↑2 | Beijing | 0.03 | 0.03 | −0.025 |
| Chengde | 0.07 | 0.02 | −0.05 | |
SUHII↑3 | Zhangjiakou | 0.08 | −0.04 | −0.12 |
SUHII↓1 | Langfang | −0.04 | 0.07 | 0.12 |
| Handan | −0.009 | 0.11 | 0.13 | |
| Tianjin | −0.0004 | 0.06 | 0.07 | |
Disclaimer/Publisher’s Note: The statements, opinions and data contained in all publications are solely those of the individual author(s) and contributor(s) and not of MDPI and/or the editor(s). MDPI and/or the editor(s) disclaim responsibility for any injury to people or property resulting from any ideas, methods, instructions or products referred to in the content. |
© 2023 by the authors. Licensee MDPI, Basel, Switzerland. This article is an open access article distributed under the terms and conditions of the Creative Commons Attribution (CC BY) license (https://creativecommons.org/licenses/by/4.0/).
Share and Cite
MDPI and ACS Style
Wang, J.; Zhou, W.; Zhao, W. Higher UHI Intensity, Higher Urban Temperature? A Synthetical Analysis of Urban Heat Environment in Urban Megaregion. Remote Sens. 2023, 15, 5696. https://doi.org/10.3390/rs15245696
AMA Style
Wang J, Zhou W, Zhao W. Higher UHI Intensity, Higher Urban Temperature? A Synthetical Analysis of Urban Heat Environment in Urban Megaregion. Remote Sensing. 2023; 15(24):5696. https://doi.org/10.3390/rs15245696
Chicago/Turabian StyleWang, Jing, Weiqi Zhou, and Wenhui Zhao. 2023. "Higher UHI Intensity, Higher Urban Temperature? A Synthetical Analysis of Urban Heat Environment in Urban Megaregion" Remote Sensing 15, no. 24: 5696. https://doi.org/10.3390/rs15245696
Note that from the first issue of 2016, this journal uses article numbers instead of page numbers. See further details here.