Article

A Lightweight and High-Accuracy Deep Learning Method for Grassland Grazing Livestock Detection Using UAV Imagery

1
Key Laboratory of Quantitative Remote Sensing Information Technology, Aerospace Information Research Institute, Chinese Academy of Sciences, Beijing 100094, China
2
School of Electronic, Electrical and Communication Engineering, University of Chinese Academy of Sciences, Beijing 100049, China
3
Key Laboratory of Land Surface Pattern and Simulation, Institute of Sciences and Natural Resources Research, Chinese Academy of Sciences, Beijing 100101, China
4
Inner Mongolia North Heavy Industries Group Co., Ltd., Baotou 014033, China
*
Author to whom correspondence should be addressed.
Remote Sens. 2023, 15(6), 1593; https://doi.org/10.3390/rs15061593
Submission received: 7 February 2023 / Revised: 12 March 2023 / Accepted: 13 March 2023 / Published: 15 March 2023
(This article belongs to the Special Issue Deep Learning and Computer Vision in Remote Sensing-II)

Abstract

:
Unregulated livestock breeding and grazing can degrade grasslands and damage the ecological environment. The combination of remote sensing and artificial intelligence techniques is a more convenient and powerful means to acquire livestock information in a large area than traditional manual ground investigation. As a mainstream remote sensing platform, unmanned aerial vehicles (UAVs) can obtain high-resolution optical images to detect grazing livestock in grassland. However, grazing livestock objects in UAV images usually occupy very few pixels and tend to gather together, which makes them difficult to detect and count automatically. This paper proposes the GLDM (grazing livestock detection model), a lightweight and high-accuracy deep-learning model, for detecting grazing livestock in UAV images. The enhanced CSPDarknet (ECSP) and weighted aggregate feature re-extraction pyramid modules (WAFR) are constructed to improve the performance based on the YOLOX-nano network scheme. The dataset of different grazing livestock (12,901 instances) for deep learning was made from UAV images in the Hadatu Pasture of Hulunbuir, Inner Mongolia, China. The results show that the proposed method achieves a higher comprehensive detection precision than mainstream object detection models and has an advantage in model size. The m A P of the proposed method is 86.47%, with the model parameter 5.7 M. The average recall and average precision can be above 85% at the same time. The counting accuracy of grazing livestock in the testing dataset, when converted to a unified sheep unit, reached 99%. The scale applicability of the model is also discussed, and the GLDM could perform well with the image resolution varying from 2.5 to 10 cm. The proposed method, the GLDM, was better for detecting grassland grazing livestock in UAV images, combining remote sensing, AI, and grassland ecological applications with broad application prospects.

Graphical Abstract

1. Introduction

Overgrazing destroys grassland ecological functions. The survey of grazing animals is of great significance in maintaining the balance of grass and livestock. Investigating the geographical and temporal distribution of different grazing livestock (sheep, cattle, horses, etc.) provides the basic and indispensable information for grassland ecological management [1].
Satellites and manned aircraft are usually used in early animal surveys. Spaceborne remote sensing data with low and medium spatial resolution (1–60 m) have been used for indirect animal surveys since the early 1980s [2], mainly by detecting signs indicating the presence of animals in the area, such as fecal counts [3,4,5], food removal, and burrow counts [6,7]. Submeter very-high-resolution (VHR) spaceborne imagery has potential in modeling the population dynamics of large (>0.6 m) wild animals at large spatial and temporal scales, but has difficulty discerning small (<0.6 m) animals at the species level, although high-resolution commercial satellites, such as WorldView-3 and WorldView-4, have reached ground resolution of up to 0.31 m in panchromatic mode [2]. Although satellites have the advantages of wide coverage and not disturbing animals, they are limited by the weather, and the resolution is still not high enough to finely distinguish animal objects. Manned aircraft have also been widely used for wild animal surveys, such as kangaroo censuses in New South Wales, Australia [8] and polar bear censuses in the seasonally ice-free Foxe Basin, Canada [9]. Although manned aircraft are flexible in terms of survey time and area, they are relatively expensive [10], require qualified pilots, and possibly have individual biases when used in real-time censuses [8].
In recent years, unmanned aerial vehicles (UAVs), a convenient and low-cost remote sensing platform, have been widely used in various fields, including wild animal surveys. Compared with manned helicopters, UAVs are more flexible and quieter, keeping the distance between the observer and the animal, ensuring the safety of field investigators in dangerous environments, and avoiding human interference with animal habitats. Previous surveys relied on manually observing and counting from large numbers of images. Researchers developed a series of automatic and semiautomatic object detection methods to improve efficiency. Moreover, some scholars [11] compared the factors affecting the detection probability of ground observation, manual inspection, and automatic detection from UAV images. They concluded that the combination of drone-captured imagery and machine learning does not suffer from the same biases that affect conventional ground surveys and could better provide information for managing the ecological population [11].
Studies have shown that some simple threshold-based methods are still sufficient for detecting and counting animals with similar grayscale values and significant differences from the background. For example, using threshold segmentation and template matching techniques, Gonzalez et al. [12] developed an algorithm to count and track koalas and deer in UAV RGB and thermal imaging videos. However, against complex backgrounds, these methods’ accuracy will usually be greatly affected. As higher-resolution images become available, researchers developed various algorithms based on machine learning to extract more complex features. Xue et al. [13] developed a semi-supervised object-based method that combined a wavelet algorithm and an adaptive network-based fuzzy neural network (ANFIS) to detect and count wildebeests and zebras in a single VHR GeoEye-1 panchromatic image of open savanna. The accuracy of this method is significantly higher than that of the traditional threshold-based method (0.79 vs. 0.58). Torney et al. [14] developed a method via rotation-invariant object descriptors combined with machine learning algorithms to detect and count wildebeests in aerial images collected in the Serengeti National Park, Tanzania. The algorithm was more accurate for the total count than both manual counts, while the per-image error rates were greater than manual counts, and the recognition accuracy was 74.15%. Rey et al. [10] proposed a semiautomated data-driven active learning system jointly based on an object proposal strategy with an ensemble of exemplar support vector machine (EESVM) models to detect large mammals, including common elands, greater kudus, and gemsboks, in the semiarid African savanna from 6500 RGB UAS images, achieving a recall of 75% for a precision of 10%. The author believes that recall is much more important than precision in this application. Although machine learning methods based on non-deep neural networks can still produce good detection results in simple cases, these methods usually cannot fully mine complex animal features.
Deep learning technology, such as convolutional neural networks (CNNs), has developed rapidly in recent years and achieved great success in computer vision. Compared with traditional methods, which only extract shallow image features, convolutional neural networks can automatically learn much richer semantic information and high-level image features with higher learning efficiency. It more comprehensively describes the differences between various types of objects. The CNN-based object detection algorithm includes anchor-free and anchor-based models. Anchor-based models include Faster R-CNN [15], RetinaNet [16], YOLOv3 [17], YOLOv7 [18], etc. These models need to adjust the hyperparameter settings of the anchor during the training procedure to better match the size of the objects in the dataset. The anchor-free model is more convenient without such a process, and the representative models include FCOS [19], CenterNet [20], YOLOX [21], etc.
Some researchers have also introduced the deep learning method to detect animal objects in UAV remote sensing images. For example, in 2017, Kellenberger et al. [22] used a two-branch CNN network structure to detect wild animals in the Kuzikus Wildlife Conservation Park in Namibia, and the precision and speed of the model were greatly improved compared with Fast RCNN. In 2018, Kellenberger et al. [23] studied how to extend CNN to large-scale wildlife census tasks. When the recall was set to 90%, false positives of the CNN were reduced by an order of magnitude, but the precision of the model was still lower. In short, the above two methods lack consideration for the comprehensive performance of the model and cannot guarantee good performance in both recall and precision. In 2020, Roosjen et al. [24] used the neural network resnet18 to automatically detect and count spotted wing drosophila, including sex prediction and discrimination. The results showed that UAV images have the potential to be researched and applied to integrated pest management (IPM) strategies. In 2020, Peng et al. [25] developed an automatic detection model for kiangs in Tibet, based on the improved Faster R-CNN and aiming at small object detection of the UAV images, and increased the F 1   s c o r e from 0.85 to 0.94. However, the dataset in this study was relatively small, and there was only one type of animal object. The classifying ability of similar types of objects has not been verified.
In this study, the grassland grazing livestock detection in UAV images was different from that in natural images taken on the ground and other objects’ detection of remote sensing images, which brings the following challenges to the algorithm design.
First, considering the surveying efficiency, the field of view angle tends to be large, and the image resolution is low. Therefore, animal objects only occupy very few pixels, making it difficult to extract useful and distinguishable features to perform detection. Moreover, grassland grazing livestock such as cattle, horses, and sheep share similar characteristics and are much more difficult to distinguish than those in the classic applications, vehicles, aircraft, and ships.
Second, the UAV images contain a large area of invalid complex background, with changeable illumination conditions, and many false objects exist, such as rocks, haystacks, and woods. Moreover, due to the posture changes of the animals, the animals of the same category may have a different appearance in imagery.
In addition, with the development of the deep learning network model, deeper networks with high precision consume a large amount of computer resources, making them hard to use in portable minimized platforms and for real-time processing. Therefore, the model size is an important index to be considered in the model construction, as well as the precision.
To solve the difficulties in the above aspects, in this paper, we propose an effective grazing livestock detection model—GLDM, based on YOLOX nano [21]. The rest of the paper is organized as follows.
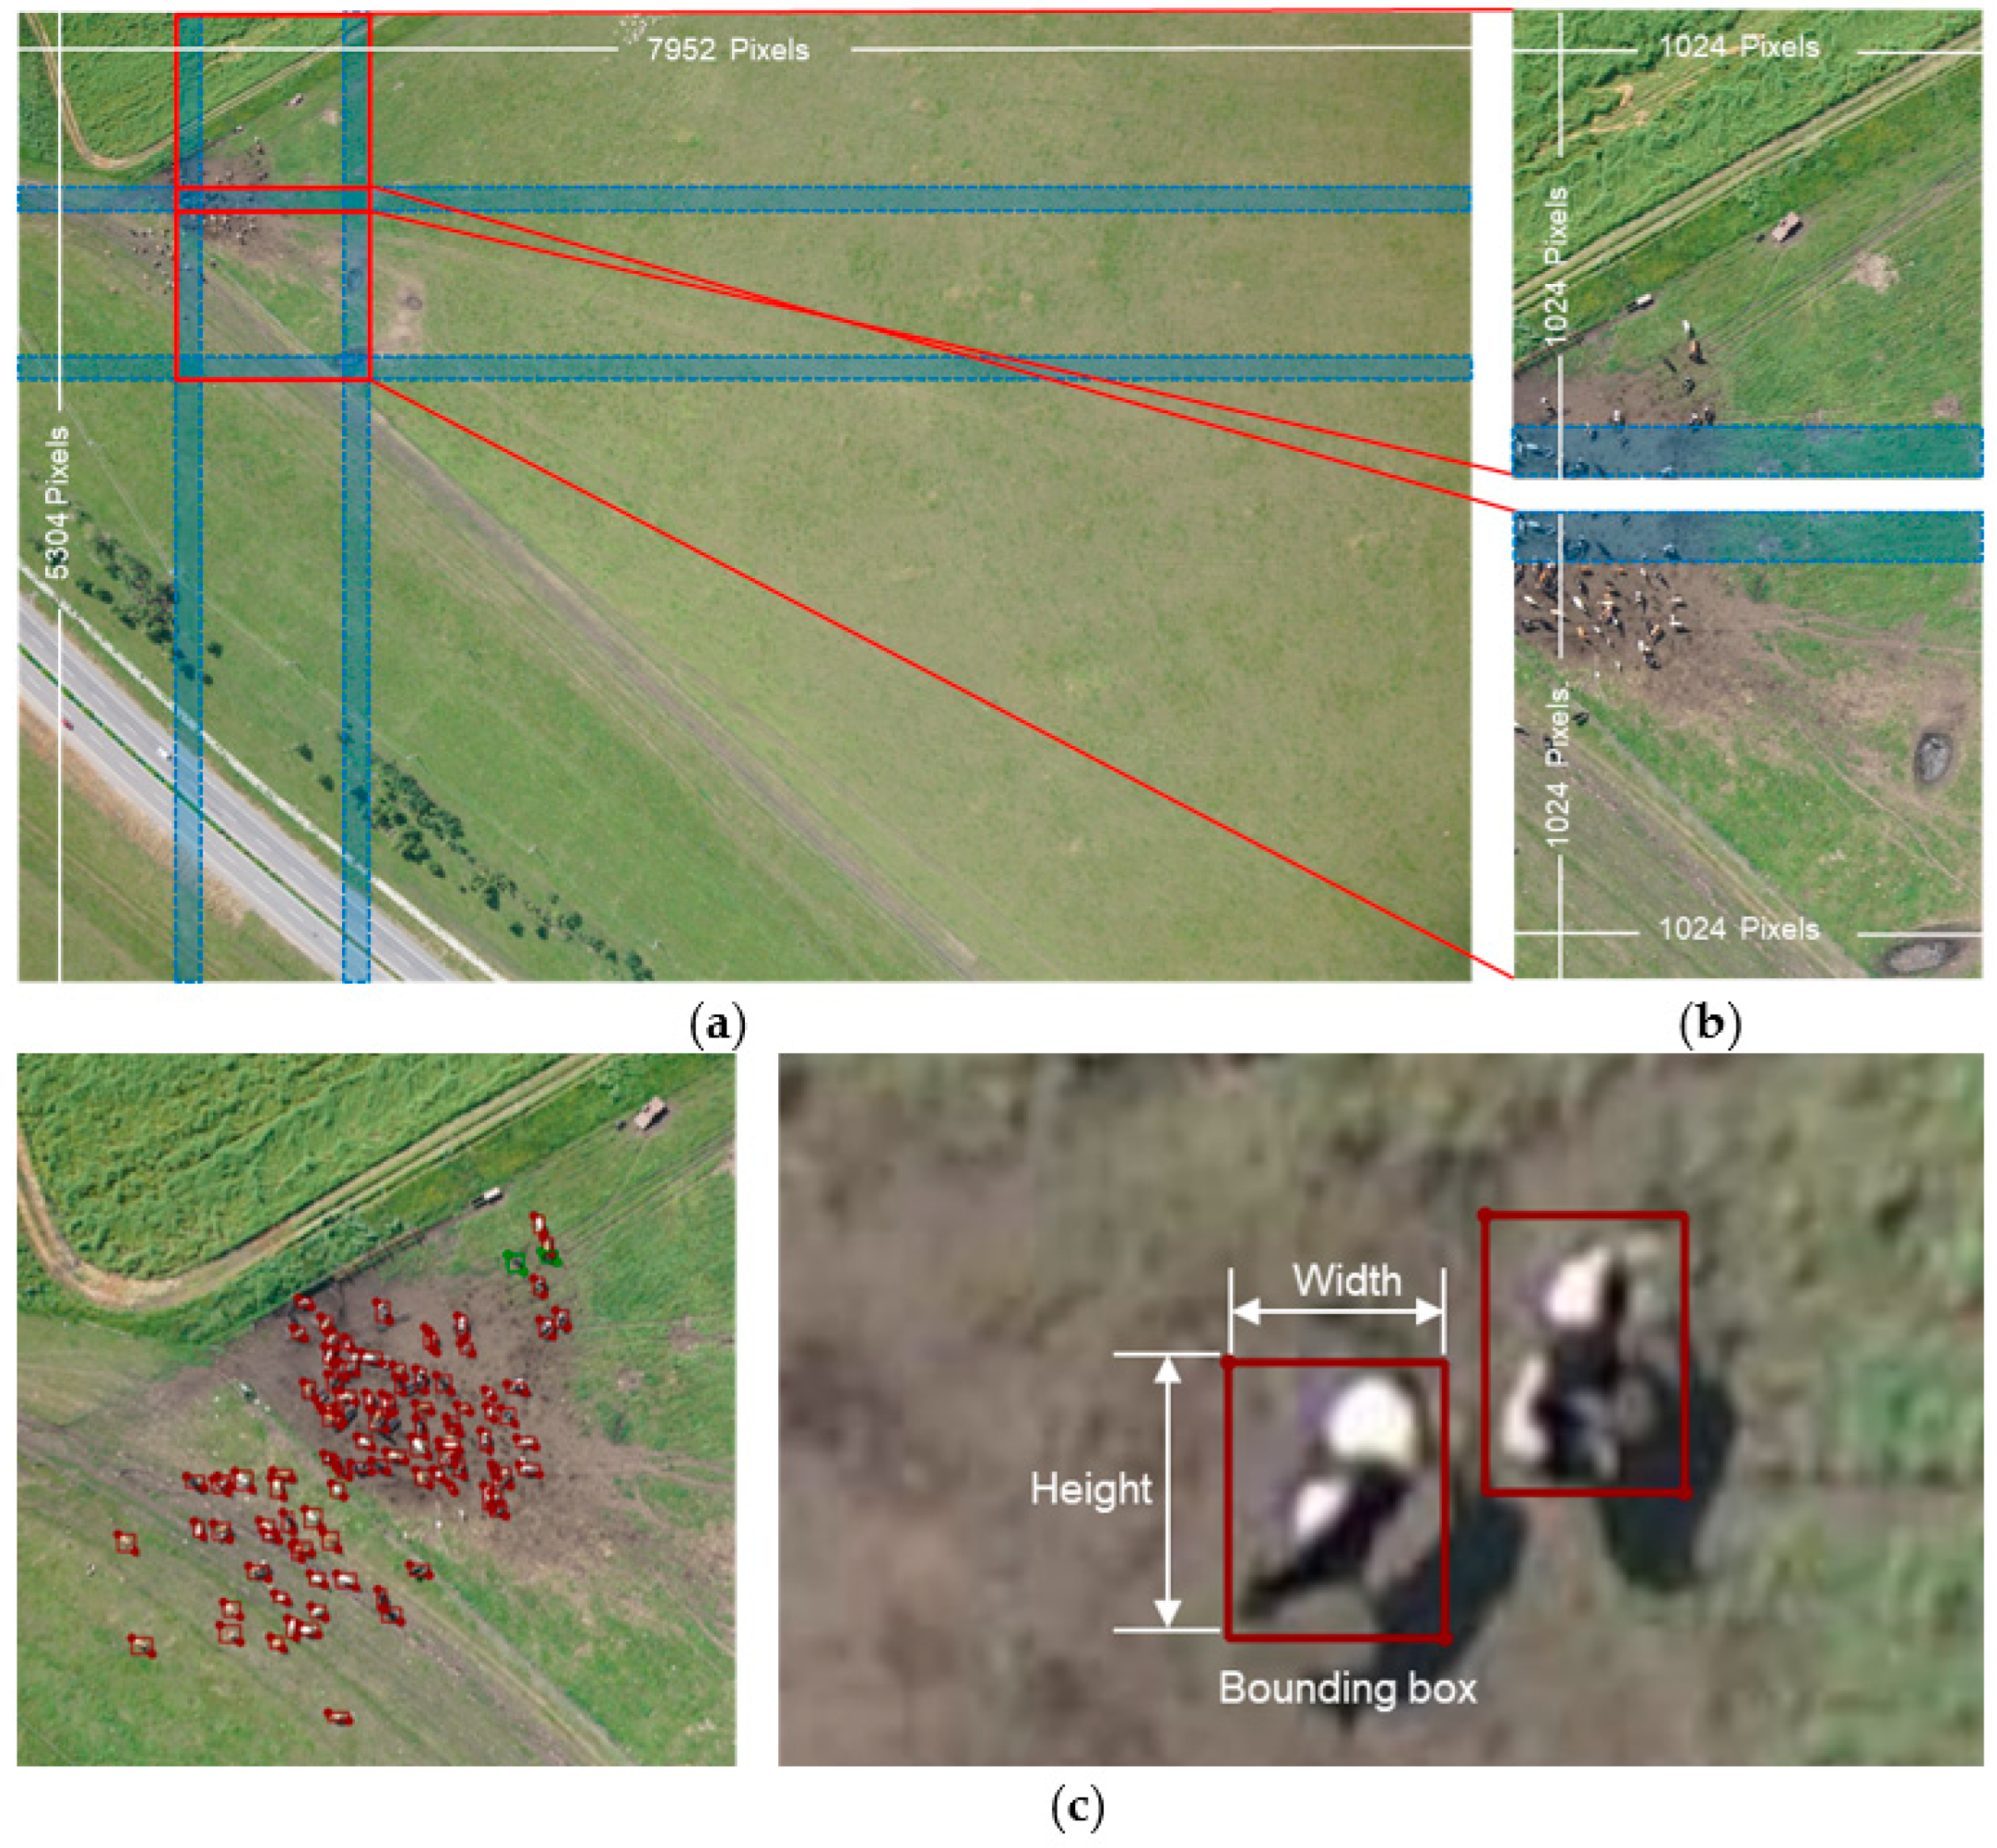
  • A grazing livestock dataset based on UAV imagery data of the Hulunbuir grassland was established. We describe the dataset in detail and show some examples in Section 2.
  • The proposed model is elaborated in Section 3.
  • Comparison, ablation, and multi-scale adaptation experiments of the model had been conducted. The details and results of the experiments are shown in Section 4.
  • Finally, we summarize and conclude the paper in Section 5.

2. Materials and Methods

2.1. Materials

2.1.1. Study Area and the UAV Imagery

Experimental data in this section were captured in Hadatu Pasture (49°32′–49°59′N, 119°3′–120°15′E, about 1000 km2), Hulunbuir City, Inner Mongolia, China, as shown in Figure 1. Hadatu Pasture has a large distribution of common livestock such as cattle, horses, and sheep. We used a fixed-wing unmanned aerial vehicle (UAV) to collect ground images in Hadatu Pasture from 24 to 29 July 2021. The UAV images covered 20% of the total area—about 200 square kilometers. The photography was taken from the overhead orthographic attitude. The forward overlap rate was 80%, and the flight altitude was about 300 m. The relative altitude of the flight changed with the rugged terrain field. The images’ spatial resolution was about 3~7 cm. A total of 30 flight strips were flown, and 33,304 shots of RGB images were taken. The image set covered objects of various landforms, buildings, and large numbers of cattle, horses, and sheep in the area.

2.1.2. Data Preparation

For the training and testing of the deep learning model, we used Labelme 4.6.0 [26] software to label the data on the original UAV images. This study used a rectangular box to label the ground truth, as shown in Figure 2c. The box was composed of an upper left point and a lower right point, using which the width and height of the object on the image could be obtained.
The size of the UAV images we obtained was 7952 × 5304. The original images were split into subpatches of 1024 × 1024 to suit the limited computer memory (as shown in Figure 2), and the width of the overlapping area was 100 pixels, which was wider than the largest object, to ensure that an object on the split line would not be lost in the dataset.
Seventy-five original UAV images with livestock were selected, and after the split, there were a total of 4050 image subpatches, including 469 animal patches (images containing animals), to build the dataset. The set was randomly divided into training, validation, and testing datasets with a ratio of about 7:1:2. More details about dataset allocation are shown in Table 1. Figure 3 shows the image samples in the dataset containing three types of animals: cattle, horses, and sheep. Figure 4 shows some object instances of the three types of animals in the dataset.
Table 2 and Figure 5 are the statistical information of the animal samples in the dataset, as shown below. From Figure 5d, it can be seen that the side length of most object boxes is 10–20 pixels. The size of most sheep objects is in this range. The mean absolute size (MAS) is defined as the square root of the object box average area, while the mean relative size (MRS) is defined as the percentage of the mean area to the total patch area. The formula is as follows:
M A S = A v e r a g e   a r e a
M R S = A v e r a g e   a r e a P a t c h   a r e a
In order to test the multi-scale adaptability of the model, we made a multi-scale dataset with nine scales of 0.2, 0.25, 0.33, 0.5, 1, 2, 3, 4, and 5. Each scale set of the dataset consisted of 10 random animal patches, so there were a total of 90 patches, and each patch was still 1024 × 1024. Image scaling uses the bilinear interpolation method, in which an image with a scale smaller than 1 is a scaled-down image patch, and its surroundings are filled with zero values. In comparison, an image with a scale greater than 1 is the window for capturing the original image patch after scaling up, as shown in Figure 6. The details of the objects in the multi-scale dataset are shown in Table 3. Among them, the mean absolute size of the objects in the 0.2-scale set was already lower than 10 pixels, and the mean absolute size of the sheep was only 3.03 pixels. However, in the 5-scale set, the mean absolute size of sheep reached 72.04 pixels, and that of cattle reached 179.24 pixels. Generally, the multi-scale dataset scaled across an approximately 22–24 times change. Table 3 shows that the number of objects (scale > 1) was reduced due to the image being intercepted by the fixed window. The average size of the objects was not strictly proportional to the previous scale.

2.2. Proposed Method

Before selecting a model, we conducted a large number of model experiments. For details, see the experimental part later. According to the experiment results, the YOLOX series models were more suitable for our application because they have a higher recall rate than other models, which could achieve better performance when we calculated sheep units in the area. Moreover, this model was the state-of-the-art model in the past two years, integrating many effective strategies. The model’s performance, such as accuracy, size, and speed, reached a good balance. Therefore, the GLDM (grazing livestock detection model) proposed in this paper was improved based on YOLOX.
YOLOX is an anchor-free model in the YOLO series proposed by Ge et al. [21] in July 2021. Another iconic model in the YOLO series after YOLOv5, the YOLOX model is based on different network depths and widths. The YOLOX model contains six different sizes: nano, tiny, s, m, l, and x, arranged from small to large. The nano version was designed for lightweight models with a weight size of only 3.9 MB. Regarding network structure, the YOLOX model used CSPDarknet in the backbone network, PANet [27] in the neck part, and proposed a decoupled head in the head part, improving the performance and convergence speed of the model. Mosaic and Mixup were used as data augmentation methods in training. The model also proposed to use a new sample matching method, SimOTA, to better improve the performance of the anchor-free model.
However, YOLOX had certain limitations in this study. First, the capability of detection for small objects with low resolution was inadequate, leading to missed detection. Second, the model was susceptible to confusion when distinguishing between different animal objects with similar body shapes. To facilitate the deployment of the model in the future, the nano in the YOLOX family was chosen as the baseline. The model was improved as follows.
  • An enhanced CSPDarknet (ECSP) was proposed as the backbone network of our model with three improvement tricks: a cascaded hybrid dilated convolutional module, stage compute ratio optimization, and input size optimization. The new backbone introduced context-related features and improved the feature extraction ability. This maximized the performance, especially the recall, with as few parameters as possible.
  • A weighted aggregation feature re-extraction pyramid module (WAFR) was also proposed as the neck part of our model, which made better use of the shallow features in the network and achieved effective multi-scale feature fusion.
The network structure of the GLDM is shown in Figure 7.

2.2.1. Enhanced CSPDarknet

The backbone network is an essential part of an object detection model, which is responsible for the feature extraction of images. Modifying the backbone network to improve feature extraction ability is the key to improving the performance of the network. CSPDarknet, as an excellent backbone network after the proposal of CSPNet [28], was first used in YOLOv4 [29]. The subsequent YOLOv5 and YOLOX have continued to use this network. Therefore, based on the CSPDarknet, an enhanced CSPDarknet (ECSP) was proposed to further enhance its ability to extract small object features.
  • Cascade Hybrid Dilated Convolution Module
Introducing a large receptive field will bring more context-related features, improving the detection ability for small objects. Ordinary convolutional networks mainly obtain further feature maps through pooling operations, such as maximum pooling or average pooling, to increase the receptive field. However, this approach will make the size of the feature map smaller and inevitably lose information in the network downsampling process, which will seriously impact the detection accuracy, especially for small objects with fewer features in the original image. To avoid information loss, expand the receptive field, and increase the object context feature information, this study introduced the idea of dilated convolution. Dilated convolution was proposed by Yu et al. [30], and it was originally used for intensive prediction tasks such as semantic segmentation. This convolution can systematically aggregate multi-scale context information and exponentially expand the receptive field without reducing the resolution and without additional parameters. Inspired by [31], this study used dilated convolutions in combination with different dilation rates to expand the receptive field. However, the selection of the expansion rate here is not arbitrary. When the expansion rate of continuous hole convolution is the same, the features on the original image will be missed. Therefore, according to a design criteria of the hybrid dilated convolution module proposed by [31], combined with our large number of experiments, an effective cascaded hybrid dilated convolution module (CHDC) was proposed, as shown in Figure 8. The dilated rate of the convolution combination we designed is [1,2,5]. Convolution kernels with different dilated rates will sample features of different scales. After the combination and superposition, the receptive field will significantly exceed three consecutive standard convolutions, and there will be no missing samples in this combination. In this module, we uniquely use two sets of such hybrid dilated convolution for cascading. What is more, inspired by the residual idea of Resnet [32], we performed a shortcut connection to prevent gradient problems caused by too many convolutional layers. The shortcut adds the original information and the convolved information by matrix addition instead of concatenating. This module effectively improves the m A P , especially the recall in experiments.
Figure 9 shows the comparison of the receptive fields of the two convolutions. The color from light to dark indicates the number of pixel calculations from less to more. Figure 10 is a schematic diagram of the sampling effect of the module in the image. For example, select a partial area of 224 × 224 in the original image, which is 61 × 61 after dark2 (4 times downsampling). Each grid in the figure represents a pixel, and the blue grid is a sampling point. It can be seen that the sampling coverage obtained after CHDC is wider than the original bottleneck in nano, and the associated information around the object can be obtained.
2.
Stage Compute Ratio Optimization
The stage settings in the backbone network can be traced back to Resnet, and the feature maps of each stage have different resolutions. The authors of [33] believe that the original design of the computation distribution across stages in Resnet is largely empirical. Different dark modules in CSPDarknet represent different stages, and the initial stage compute ratio is 1:3:3:1. In the past two years, Transformer has shown extraordinary performance in computer vision. Swin-T [34] also used similar ideas in the network but with a slightly different stage compute ratio of 1:1:3:1. The author of ConvNeXt [33] discovered and applied this ratio to Resnet, changing the number of blocks in each stage from (3, 4, 6, 3) in ResNet-50 to (3, 3, 9, 3). Here, we have carried out much experimental exploration based on this idea and finally adjusted the stage compute ratio in CSPDarknet to 1:1:3:1. Experiments have proved that this ratio not only reduces the model parameters but also improves the accuracy of the model. Overall, it is the best ratio at present. The specific experimental results are shown in Section 3.2.1.
3.
Input Size Optimization
In order to ensure the consistency of the size and dimension of the output of the features by the network, we usually perform data size preprocessing before the image enters the backbone network; that is, bilinear interpolation operation, to force the image to be converted into the same size. For natural image detection tasks, to reduce GPU memory usage and reduce calculations, the YOLOX baseline usually compresses the input image to 640 × 640, which is larger than that. Although such an operation may cause image deformation and information loss, it is also beneficial, reducing the amount of calculation and the risk of model overfitting. However, for the small object detection in this study, if the algorithm compresses the image, the feature information of the small object will be lost before entering the model. This lost information cannot be recovered, which ultimately affects the detection performance of the model. Therefore, according to this study’s image size and data characteristics, we bilinearly interpolated the input image into a size of 1024 × 1024 in this model because bilinear interpolation has a balance between effects and computation. That ensured the image lost no data before entering the network training and obtained more effective feature extraction in the subsequent network, effectively improving the model accuracy.

2.2.2. Weighted Aggregation Feature Re-Extraction Pyramid

Some researchers believe that low-level features from shallow layers of the network contain more fine-grained feature information and background noise, while features extracted from deeper layers contain more semantic information [35]. A modern detector consists of at least two parts: a backbone and a detection head. With the development of the model, there are many layer structures between the backbone and the head. This part of the structure is usually used to obtain feature maps at different stages for fusion to learn better features, which we call the model neck. FPN is a classic feature fusion structure with a top-down pathway proposed by Lin et al. [36] in 2017. It has been widely used in object detection models. Subsequently, many effective multi-scale feature fusion structures have emerged. Starting from YOLOv4, the YOLO model uses PANet [27] as a neck. PANet is a feature fusion structure divided into two processes: top-down and bottom-up. The structure fuses the features of different layers equally. Hence, the extraction effect for small object features is limited.
Therefore, to facilitate the detection of small objects in our dataset, we propose a new feature fusion structure: a weighted aggregation feature re-extraction pyramid (WAFR) with top-down and bottom-up two pathways as well. In this structure, the weighted fusion is started from the highest layer upwards, and the way of concatenating in the original PANet is abandoned, instead of the form of matrix addition. The fusion formula is as follows: where r C 4 : r C 5 is 2:1, and r C 3 : r s 4 is 2:1, the N3 layer after the top-down weighted fusion is re-extracted by the Dark4 and Dark5 in the backbone. Moreover, the S4 layer and the C5 layer are cross-fused during the extraction process. Finally, three feature map outputs with different scales are obtained. The structure is shown in Figure 11.
F = 1 r i + r j ( r i F i + r j F j )
F is the fused feature, F i and F j are the i and j feature layers, respectively, and r i and r j are the weights of the feature layer.

2.2.3. Standard of Performance Evaluation

A series of indices were adopted to evaluate object detection performance from different aspects: the precision, the recall, the F 1   s c o r e , and mean average precision ( m A P ).
The precision evaluates the accuracy in the total number of predictions, whereas the recall provides insight into how well the prediction covers the objects of interest [25]. The mathematical formula of precision and recall are defined as follows:
p r e c i s i o n = T P T P + F P
r e c a l l = T P T P + F N
where T P , F P , and F N represent the true positive, false positive, and false negative.
F 1   s c o r e and average precision ( A P ) were adopted to make a comprehensive evaluation of the results, since recall and precision reflect only one aspect of the model’s performance [25]. F 1   s c o r e is the harmonic mean of precision and recall, and the formula is defined as:
F 1   s c o r e = 2 1 p r e c i s i o n + 1 r e c a l l
A P is defined as the area surrounded by the recall-precision curve, which is formulated as:
A P = 0 1 p r e c i s i o n ( r e c a l l ) d ( r e c a l l )
To evaluate the overall performance of the model on the dataset, m A P was adopted, which is formulated as:
m A P = 1 n i = 1 n A P i
where n is the number of categories in the dataset.
In order to apply the model to the survey of grassland grazing livestock, we proposed a new evaluation index—livestock accuracy ( L A C ), which is the accuracy of the evaluation model when calculating the number of grazing livestock in an area. This evaluation index reflects the accounting accuracy of regional livestock volume (without distinguishing categories) under the premise of no prior knowledge and full trust model. The formula is defined as:
L A C = S U t r u t h | S U p r e d i c t e d S U t r u t h | S U t r u t h
S U p r e d i c t e d = σ c l a s s ( T P c l a s s + F P c l a s s )
S U t r u t h = σ c l a s s G T c l a s s
where S U is the sheep unit, which is a unified conversion unit for calculating the amount of livestock. One sheep unit is a sheep with a live weight of 40 kg and its suckling lambs, and the daily eclipse of forage grass is 5.0–7.5 kg [37]. G T is the number of ground truth and σ c l a s s is the conversion factor of the object class and sheep unit. For example, in this research area, 1 cattle unit can be converted into 5 sheep units. σ c l a s s is defined as follows:
σ s h e e p = 1 , 1   s h e e p = 1   S U
σ c a t t l e = 5 , 1   cattle = 5   S U
σ h o r s e = 5 , 1   horse = 5   S U

3. Results

The model was run on an InterXeon(R) Gold 5118 [email protected], NVIDIA RTX A6000 GPU, and Ubuntu 18.04.5 LTS system, using the Pytorch 1.10 deep learning framework. The model used the stochastic gradient descent (SGD) optimizer and was trained for 500 epochs. In the training strategy, we froze the backbone network at 0–50 epochs and trained with a batch size of 16. Then, we unfroze the backbone network, all model parameters participated in the training together, and the batch size was 8. The learning rate was initially set to 0.01, the minimum learning rate was set to 0.0001, the momentum was set to 0.937, and the weight decay was set to 0.0005. The learning rate drop method adopted was the cos drop method.

3.1. Algorithm Performance Comparison

To demonstrate the advantage of the proposed method, different deep learning object detection models are executed in this section, such as Faster R-CNN, RetinaNet, FCOS, and YOLO series, including the-state-of-art models. The above experimental models include the classic one-stage, two-stage, and anchor-based and anchor-free classic models as the object detection model. We used these models to make a horizontal comparison with our proposed GLDM and observed the performance of these models on our dataset from a large number of experiments, as shown as Table 4.
Faster RCNN is a milestone model in the RCNN series proposed by Ren et al. [15] in 2016. As a two-stage classic model, Faster RCNN once became the most accurate object detection model. However, the model is anchor-based, and the accuracy of the model depends on the setting of anchor hyperparameters, which requires prior knowledge. After some simple anchor hyperparameter adjustments, the experimental results’ m A P only reached 21.75%.
RetinaNet is a one-stage detection model as well as an anchor-based model proposed by He et al. [16] in 2017. In order to solve the problem of class imbalance, the author proposed using the Focal Loss. Through experiments, the m A P of this model reached 35.78%, which was slightly better than that of the Faster RCNN model, but the detection effect for the category sheep was not satisfactory.
YOLOv3 was proposed by Redmon et al. [17] in 2018, using DarkNet-53 as the backbone network and absorbing the idea of FPN with high computing efficiency. As a one-stage anchor-based model, YOLOv3 introduced the most effective tricks in the industry at that time, and it is also a milestone object detection model. Through experiments, although the model size was larger, the accuracy was greatly improved: the m A P reached 74.69%.
FCOS is an anchor-free detection model. It was proposed by Tian et al. [19] in 2019. This model no longer depends on the anchor and avoids all hyperparameters related to the anchor that affect the final detection result, and it is a fully convolutional, one-stage model for pixel-by-pixel prediction. Experiments showed that compared with YOLOv3, the model achieved a higher m A P with a smaller number of parameters, reaching 78.06%.
The YOLOX-nano in the YOLOX series had a m A P of 77.73% with 0.9 M parameters, and the YOLOX-x was the model with the largest number of parameters and the highest accuracy in the series, with a m A P of 87.19%.
The m A P of the GLDM reached 86.47%, a bit lower than the YOLOX-x model. While improving the detection performance, we also considered the model size. The number of parameters of the proposed model was only 5.7 M, or only about 5.76% of that of YOLOX-x. The average precision ( A P ) for sheep detection exhibited a notable increase of 12.25%, indicating the effectiveness of our enhancements in the detection of small objects. In summary, we achieved a lighter and higher-precision unification on our UAV dataset, which is currently a more efficient detection model for grassland grazing livestock detection.
Figure 12 shows a comparison of the detection results from different models. The chosen models were Faster R-CNN, FCOS, and YOLOv3, which are the typical two-stage, anchor-free, and classic YOLO model, respectively. Faster R-CNN had a very poor detection effect on sheep, which had been greatly improved in YOLOv3. Although FCOS was not as good as YOLOv3 in detecting sheep, it was better in detecting horses than YOLOv3. It can also be seen from the figure that the above objects all had excellent detection results in our model.

3.2. Ablation Experiments

To verify the effectiveness of the method proposed, ablation experiments were performed in this study. First, we carried out the ablation verification of the overall model and conducted experiments on the two improved modules, ECSP and WAFR in sequence. The experimental results are shown in Table 5. After using ECSP, the m A P of the model was improved by 8.25%. Due to the increase of CHDC in ECSP to the receptive field, and bilinear interpolation input, the recall rate was significantly improved. The average recall improved by 8.48%, which aligned with our expectations. Results with high recall are more beneficial for our application. After the model used WAFR, the m A P of the model increased by 8.74%, reaching 86.47%. The average recall was improved by 8.86%. Although the number of parameters changed and increased, the model accuracy improvement in exchange was worthwhile.

3.2.1. Use of Enhanced CSPDarknet

The experimental results above proved that ECSP improved the m A P and recall of the model. To verify the effectiveness of the three tricks proposed in ECSP, as mentioned above, we decomposed ECSP and conducted more in-depth ablation experiments. As shown in Table 6, the experimental results proved that m A P had been improved by each trick.
As for improving our stage compute rate on the backbone, it is an optimal ratio that we have explored through many experiments. In Table 7 below, several representative experiments are given. The original ratio was 1:3:3:1, referring to the ratio of CHDC in Dark2-5. In the nano model, the depth factor was 1, so 1:3:3:1 was also the real number ratio of CHDC in each stage. First, the ratio was adjusted based on keeping the total number consistent. Although higher accuracy was obtained, the size of the model was sacrificed.
In the final experiment, the m A P of the model with a ratio of 1:1:3:1 was 0.94% higher than that of the original model. The parameters were reduced by 0.11 M, which achieved higher accuracy and smaller volume than the original model, and is currently the best choice.

3.2.2. Use of Weighted Aggregation Feature Re-Extraction Pyramid

In this part, we give the ablation tests for WAFR, as shown in Table 8 below. Experiments in the table verify the effect of WAFR on the model with or without ECSP. When not using our proposed ECSP, WAFR brought a 0.9% improvement to the model, and after using ECSP, WAFR brought a 0.49% improvement to the model. Experiments proved that WAFR was effective for model improvement.

3.2.3. Visualization of Results

In order to see the difference before and after the model improvement more clearly, we show in Figure 13 the original test image, the test result image before and after the model improvement, and the ground truth. The figure shows the detection results of typical sheep, horses, and cattle images. We can see an improvement in missed detection and false detection. In a dense scene like a flock of sheep, the improved model significantly improved the recall of sheep and detected some previously undetected objects efficiently. For horses, false detections before improvement were corrected. For the cattle in the figure, there may be two cattle with one detection box before the improvement, and the individuals were better distinguished after the improvement.

3.3. Model Application

In this part, we study the application of the model, including the scale adaptability of the model; that is, in what resolution range the model can still maintain a good accuracy, the model inference method of large-size remote sensing image, and the grassland livestock counting in the test dataset.

3.3.1. Model Scale Adaptability

The data used in this study were collected by UAVs flying at 300 m, although due to the ups and downs of the terrain, the actual shooting distance to the ground varied. However, generally speaking, the resolution was roughly within a range; that is, the size of similar objects did not change much. Since the model proposed was trained from such data, we needed to test the model’s adaptability to large-scale changes. Therefore, we made a test dataset with multi-scale variation, as described in Section 2. The test results are shown in Table 9 and Figure 14. The general trend was that as the scale shrank or expanded, the detection performance decreased, but the performance of different categories was slightly different.
From Figure 14b, it can be seen more intuitively that cattle and sheep have misplacement for scale changes. Cattle have stronger adaptability to scale reduction, and sheep have stronger adaptability to scale expansion. Assuming that the A P value of any category is required to be greater than or equal to 0.5, a scale change of 0.5–2 can meet the requirements. Performance drops off significantly outside of a scale change of 0.33-3.
Considering that the original image resolution of our dataset was about 5 cm, and corresponding to the above conclusion, our model still performed well between 2.5 and 10 cm through resolution conversion. The range could be expanded appropriately, but it was best to stay within 15 and 1.7 cm. Figure 15 below is the test dataset detection results at scales of 0.5, 1, and 2.

3.3.2. Large-Size Remote Sensing Image Inference and Grassland Livestock Accounting

In practical applications, we often obtain large-size remote sensing images. For example, the original image size of the UAV in our research reached 7952 × 5304. If an image of this size is directly detected without a split, the entire image will be compressed to a fixed size before entering the network. The algorithm directly filters a large amount of image information in the preprocessing stage. Because the object to be detected is extremely small, the image entering the network may have no object information.
We used the sliding window detection method to achieve the inference process of large-size remote sensing images. The detection window slides from the upper left of the image until it slides to the lower right, traversing the entire image. The final large-size image detection result is obtained, as shown in Figure 16. The object in the figure, which is the original UAV image, has been effectively detected without split.
We used the model in this paper to calculate the number of livestock in the testing dataset, and the detailed data are shown in Table 10. The test set had 3136 livestock samples, which could be converted into 6312 sheep units. The model detected 489 cattle objects, 322 horse objects, and 2261 sheep objects, which were converted into 6316 sheep units. Therefore, LAC (the accuracy of accounting for livestock in Section 2.2.3) using UAV images in this testing dataset reached 99% without prior knowledge.

4. Discussion

The use of UAV images combined with deep learning for the automatic detection of grassland grazing livestock presents several technical difficulties, such as small objects, easy false detection, and easily missed detection. In this study, an improved deep learning detection model GLDM was designed based on the YOLOX nano model to deal with the above difficulties. The enhanced backbone network ECSP we proposed incorporates the hybrid dilated convolution idea to expand the receptive field to extract the context features of small objects. We also optimized the stage compute ratio and the input size. These techniques enhanced the feature extraction ability of small objects in the image, significantly improving the model’s recall. Additionally, a feature fusion structure WAFR was designed to strengthen the network’s utilization of objects’ shallow features, further enhancing the detection and positioning capabilities of small objects. Experimental results have also shown that our proposed model achieves better performance than before, effectively addressing the challenges posed by small object detection, false detection, and missed detection. The proposed model can also be used for large-scale grassland livestock surveys.
Nonetheless, there remain several areas for improvement in this study. First, the computational efficiency of the model has not been optimized. Secondly, the model has not improved the detection of ultra-dense sheep in sheep pens, which is also a direction for future research. For future work, in addition to exploring the above issues, there are several directions that are worthy of further work.
  • Increase the number of labeled samples and add other object categories to explore possible long-tail object detection. This is a complex problem in the field of object detection that warrants further investigation.
  • Collect multi-angle and multi-scale data to expand the model’s application scenarios. This will make the model more flexible and allow it to be applied to tasks such as target tracking in the future, as well as enabling the description of objects at ultra-high resolution.
  • Study the domain adaptation problem in transfer learning and explore the knowledge transfer of the model. This is critical for the inheritance and evolution of the model, as well as the reduction of data labeling costs.

5. Conclusions

In this study, a deep learning dataset based on UAV images was constructed, and a deep learning method GLDM for grassland grazing livestock detection was proposed to better integrate deep learning technology into remote sensing and serve grassland animal husbandry. The model’s detection ability for small and confusing objects in UAV images was effectively strengthened by the enhanced backbone network ECSP and the feature fusion module WAFR. Experimental results show that this model has better detection performance and fewer model parameters than existing object detection algorithms. It performed well in the recall rate, and the m A P of the model reached 86.47%, which is suitable for detecting grassland grazing livestock in UAV images. Moreover, the performance of the model was investigated, and it was observed to maintain good performance in images with a spatial resolution ranging from 2.5 to 10 cm. The inference process of large-size remote sensing images was implemented without splitting. Overall, the proposed model can achieve remarkable results in livestock detection, effectively overcome the main practical problems, and can practicably perform livestock surveys using UAV remote sensing over extensive grassland.

Author Contributions

Conceptualization, Y.W. and Q.W.; methodology, Y.W. and Q.W.; software, Y.W. and Q.W.; validation, Y.W., Q.W. and L.M.; formal analysis, Y.W. and Q.W.; investigation, Y.W. and Q.W.; resources, Y.W., Q.W., N.W., D.W. and L.M.; data curation, Y.W. and Q.W.; writing—original draft preparation, Y.W.; writing—review and editing, Y.W., Q.W., X.W. and L.M.; visualization, Y.W.; supervision, Q.W., N.W. and L.M.; project administration, Q.W., N.W., Q.Z., X.H., L.M. and G.O.; funding acquisition, Q.W., N.W., L.M. and G.O. All authors have read and agreed to the published version of the manuscript.

Funding

This research was funded by the Strategic Priority Research Program of Chinese Academy of Sciences (Grant No. XDA26010201) and the Science and Technology Major Project of Inner Mongolia Autonomous Region of China (Grant No. 2021ZD0044).

Data Availability Statement

The data presented in this study are available on request from the corresponding author.

Conflicts of Interest

The authors declare no conflict of interest.

References

  1. Wang, D.; Liao, X.; Zhang, Y.; Cong, N.; Ye, H.; Shao, Q.; Xin, X. Grassland Livestock Real-Time Detection and Weight Estimation Based on Unmanned Aircraft System Video Streams. Chin. J. Ecol. 2021, 40, 4099–4108. [Google Scholar]
  2. Wang, D.; Shao, Q.; Yue, H. Surveying Wild Animals from Satellites, Manned Aircraft and Unmanned Aerial Systems (UASs): A Review. Remote Sens. 2019, 11, 1308. [Google Scholar] [CrossRef] [Green Version]
  3. Fretwell, P.T.; Trathan, P.N. Penguins from Space: Faecal Stains Reveal the Location of Emperor Penguin Colonies. Glob. Ecol. Biogeogr. 2009, 18, 543–552. [Google Scholar] [CrossRef]
  4. Schwaller, M.R.; Southwell, C.J.; Emmerson, L.M. Continental-Scale Mapping of Adélie Penguin Colonies from Landsat Imagery. Remote Sens. Environ. 2013, 139, 353–364. [Google Scholar] [CrossRef] [Green Version]
  5. Schwaller, M.R.; Olson, C.E.; Ma, Z.; Zhu, Z.; Dahmer, P. A Remote Sensing Analysis of Adélie Penguin Rookeries. Remote Sens. Environ. 1989, 28, 199–206. [Google Scholar] [CrossRef] [Green Version]
  6. Löffler, E.; Margules, C. Wombats Detected from Space. Remote Sens. Environ. 1980, 9, 47–56. [Google Scholar] [CrossRef]
  7. Wilschut, L.I.; Heesterbeek, J.A.P.; Begon, M.; de Jong, S.M.; Ageyev, V.; Laudisoit, A.; Addink, E.A. Detecting Plague-Host Abundance from Space: Using a Spectral Vegetation Index to Identify Occupancy of Great Gerbil Burrows. Int. J. Appl. Earth Obs. Geoinf. 2018, 64, 249–255. [Google Scholar] [CrossRef]
  8. Caughley, G.; Sinclair, R.; Scott-Kemmis, D. Experiments in Aerial Survey. J. Wildl. Manag. 1976, 40, 290–300. [Google Scholar] [CrossRef]
  9. Stapleton, S.; Peacock, E.; Garshelis, D. Aerial Surveys Suggest Long-Term Stability in the Seasonally Ice-Free Foxe Basin (Nunavut) Polar Bear Population. Mar. Mammal Sci. 2016, 32, 181–201. [Google Scholar] [CrossRef]
  10. Rey, N.; Volpi, M.; Joost, S.; Tuia, D. Detecting Animals in African Savanna with UAVs and the Crowds. Remote Sens. Environ. 2017, 200, 341–351. [Google Scholar] [CrossRef] [Green Version]
  11. Corcoran, E.; Denman, S.; Hamilton, G. Evaluating New Technology for Biodiversity Monitoring: Are Drone Surveys Biased? Ecol. Evol. 2021, 11, 6649–6656. [Google Scholar] [CrossRef]
  12. Gonzalez, L.F.; Montes, G.A.; Puig, E.; Johnson, S.; Mengersen, K.; Gaston, K.J. Unmanned Aerial Vehicles (UAVs) and Artificial Intelligence Revolutionizing Wildlife Monitoring and Conservation. Sensors 2016, 16, 97. [Google Scholar] [CrossRef] [Green Version]
  13. Xue, Y.; Wang, T.; Skidmore, A.K. Automatic Counting of Large Mammals from Very High Resolution Panchromatic Satellite Imagery. Remote Sens. 2017, 9, 878. [Google Scholar] [CrossRef] [Green Version]
  14. Torney, C.J.; Dobson, A.P.; Borner, F.; Lloyd-Jones, D.J.; Moyer, D.; Maliti, H.T.; Mwita, M.; Fredrick, H.; Borner, M.; Hopcraft, J.G.C. Assessing Rotation-Invariant Feature Classification for Automated Wildebeest Population Counts. PLoS ONE 2016, 11, e0156342. [Google Scholar] [CrossRef] [PubMed] [Green Version]
  15. Ren, S.; He, K.; Girshick, R.; Sun, J. Faster R-CNN: Towards Real-Time Object Detection with Region Proposal Networks. In Proceedings of the Advances in Neural Information Processing Systems, Montreal, QC, Canada, 7–12 December 2015; Curran Associates, Inc.: Red Hook, NY, USA, 2015; Volume 28. [Google Scholar]
  16. Lin, T.-Y.; Goyal, P.; Girshick, R.; He, K.; Dollar, P. Focal Loss for Dense Object Detection. In Proceedings of the IEEE International Conference on Computer Vision (ICCV), Venice, Italy, 22–29 October 2017; pp. 2980–2988. [Google Scholar]
  17. Redmon, J.; Farhadi, A. YOLOv3: An Incremental Improvement. arXiv 2018, arXiv:1804.02767. [Google Scholar]
  18. Wang, C.-Y.; Bochkovskiy, A.; Liao, H.-Y.M. YOLOv7: Trainable Bag-of-Freebies Sets New State-of-the-Art for Real-Time Object Detectors. arXiv 2022, arXiv:2207.02696. [Google Scholar]
  19. Tian, Z.; Shen, C.; Chen, H.; He, T. FCOS: Fully Convolutional One-Stage Object Detection. In Proceedings of the IEEE/CVF International Conference on Computer Vision (ICCV), Seoul, Republic of Korea, 27 October–2 November 2019; pp. 9627–9636. [Google Scholar]
  20. Zhou, X.; Wang, D.; Krähenbühl, P. Objects as Points. arXiv 2019, arXiv:1904.07850. [Google Scholar]
  21. Ge, Z.; Liu, S.; Wang, F.; Li, Z.; Sun, J. YOLOX: Exceeding YOLO Series in 2021. arXiv 2021, arXiv:2107.08430. [Google Scholar]
  22. Kellenberger, B.; Volpi, M.; Tuia, D. Fast Animal Detection in UAV Images Using Convolutional Neural Networks. In Proceedings of the 2017 IEEE International Geoscience and Remote Sensing Symposium (IGARSS), Fort Worth, TX, USA, 23–28 July 2017; pp. 866–869. [Google Scholar]
  23. Kellenberger, B.; Marcos, D.; Tuia, D. Detecting Mammals in UAV Images: Best Practices to Address a Substantially Imbalanced Dataset with Deep Learning. Remote Sens. Environ. 2018, 216, 139–153. [Google Scholar] [CrossRef] [Green Version]
  24. Roosjen, P.P.; Kellenberger, B.; Kooistra, L.; Green, D.R.; Fahrentrapp, J. Deep Learning for Automated Detection of Drosophila Suzukii: Potential for UAV-Based Monitoring. Pest Manag. Sci. 2020, 76, 2994–3002. [Google Scholar] [CrossRef]
  25. Peng, J.; Wang, D.; Liao, X.; Shao, Q.; Sun, Z.; Yue, H.; Ye, H. Wild Animal Survey Using UAS Imagery and Deep Learning: Modified Faster R-CNN for Kiang Detection in Tibetan Plateau. ISPRS J. Photogramm. Remote Sens. 2020, 169, 364–376. [Google Scholar] [CrossRef]
  26. Wada, K. Labelme: Image Polygonal Annotation with Python. Available online: https://github.com/wkentaro/labelme (accessed on 19 January 2023).
  27. Liu, S.; Qi, L.; Qin, H.; Shi, J.; Jia, J. Path Aggregation Network for Instance Segmentation. In Proceedings of the IEEE Conference on Computer Vision and Pattern Recognition (CVPR), Salt Lake City, UT, USA, 18–23 June 2018; pp. 8759–8768. [Google Scholar]
  28. Wang, C.-Y.; Liao, H.-Y.M.; Wu, Y.-H.; Chen, P.-Y.; Hsieh, J.-W.; Yeh, I.-H. CSPNet: A New Backbone That Can Enhance Learning Capability of CNN. In Proceedings of the IEEE/CVF Conference on Computer Vision and Pattern Recognition (CVPR) Workshops, Seattle, WA, USA, 14–19 June 2020; pp. 390–391. [Google Scholar]
  29. Bochkovskiy, A.; Wang, C.-Y.; Liao, H.-Y.M. YOLOv4: Optimal Speed and Accuracy of Object Detection. arXiv 2020, arXiv:2004.10934. [Google Scholar]
  30. Yu, F.; Koltun, V. Multi-Scale Context Aggregation by Dilated Convolutions. arXiv 2016, arXiv:1511.07122. [Google Scholar]
  31. Wang, P.; Chen, P.; Yuan, Y.; Liu, D.; Huang, Z.; Hou, X.; Cottrell, G. Understanding Convolution for Semantic Segmentation. In Proceedings of the 2018 IEEE Winter Conference on Applications of Computer Vision (WACV), Lake Tahoe, NY, USA, 12–15 March 2018; pp. 1451–1460. [Google Scholar]
  32. He, K.; Zhang, X.; Ren, S.; Sun, J. Deep Residual Learning for Image Recognition. In Proceedings of the IEEE Conference on Computer Vision and Pattern Recognition (CVPR), Las Vegas, NV, USA, 27–30 June 2016; pp. 770–778. [Google Scholar]
  33. Liu, Z.; Mao, H.; Wu, C.-Y.; Feichtenhofer, C.; Darrell, T.; Xie, S. A ConvNet for the 2020s. arXiv 2022, arXiv:2201.03545. [Google Scholar]
  34. Liu, Z.; Lin, Y.; Cao, Y.; Hu, H.; Wei, Y.; Zhang, Z.; Lin, S.; Guo, B. Swin Transformer: Hierarchical Vision Transformer Using Shifted Windows. arXiv 2021, arXiv:2103.14030. [Google Scholar]
  35. Liu, J.-J.; Hou, Q.; Cheng, M.-M.; Feng, J.; Jiang, J. A Simple Pooling-Based Design for Real-Time Salient Object Detection. arXiv 2019, arXiv:1904.09569. [Google Scholar]
  36. Lin, T.-Y.; Dollar, P.; Girshick, R.; He, K.; Hariharan, B.; Belongie, S. Feature Pyramid Networks for Object Detection. arXiv 2017, arXiv:1612.03144. [Google Scholar]
  37. Xu, M. A Review of Grassland Carrying Capacity: Perspective and Dilemma for Research in China on “Forage—Livestock Balance”. Acta Prataculturae Sin. 2014, 23, 321–329. [Google Scholar] [CrossRef]
Figure 1. Data collection. (a) Map of Hadatu Pasture and UAV flight routes; (b) flight strip image captured and mosaiced by the UAV; (c) original image sample of the UAV.
Remotesensing 15 01593 g001
Figure 2. The split UAV image. (a) The original UAV image. The overlapped blue areas are 100 pixels wide to prevent the object from being split. (b) The subpatches after split are images in our dataset. The size of them is 1024 × 1024. (c) The annotation of samples using Labelme.
Remotesensing 15 01593 g002
Figure 3. Dataset image. (a) A patch of cattle; (b) a patch of horses; (c) a patch of sheep.
Remotesensing 15 01593 g003
Figure 4. The object instances of the dataset. (a) cattle instances; (b) horse instances; (c) sheep instances.
Remotesensing 15 01593 g004
Figure 5. (a) The boxplot of object bounding box width. (b) The boxplot of object bounding box height. (c) The boxplot of object bounding box area. (d) The distribution of the object bounding boxes in the dataset. The horizontal axis is the width of the object bounding boxes and the vertical axis is the height. The color represents the number of boxes with the width and height in the coordinate system.
Remotesensing 15 01593 g005
Figure 6. (ai) The display of image patches of scale 0.2-5 in the multi-scale dataset. Among them (ad) are image patches (scale < 1) surrounded by zero values. (e) The original image patch (scale = 1); (fi) image patches (scale > 1) which are windows of 1024 × 1024 to intercept the enlarged images.
Remotesensing 15 01593 g006aRemotesensing 15 01593 g006b
Figure 7. Network structure of the GLDM, roughly divided into parts of backbone, neck, and head. The backbone part is the proposed ECSP, and the neck part is the proposed WAFR.
Remotesensing 15 01593 g007
Figure 8. The designed cascaded hybrid dilated convolution module (CHDC), in which dilated conv-1, 2, and 5 are dilated convolutions with dilated rates of 1, 2, and 5, respectively, as shown on the right.
Remotesensing 15 01593 g008
Figure 9. Comparison diagram of continuous convolution sampling. The color from light to dark indicates the number of pixel calculations from less to more. (a) The receptive field after three standard convolutions [1,1,1]; (b) the receptive field after the combination of dilated convolutions with expansion rates of [1,2,5].
Remotesensing 15 01593 g009
Figure 10. Schematic diagram of sampling on an image. (a) A schematic diagram of sampling after only one standard convolution; (b) a schematic diagram of sampling after CHDC with the sampling area larger, and the associated information around the object can be obtained.
Remotesensing 15 01593 g010
Figure 11. Weighted aggregation feature e-extraction pyramid (WAFR). In the figure, layer C5 is the deepest output of the backbone network, which has the most semantic information. Layer N3 is a top-down fusion feature map. Layers N4 and N5 are feature maps after re-extraction and cross-fusion of backbone network features.
Remotesensing 15 01593 g011
Figure 12. Visualization of the detection results for different methods. (a) Faster R-CNN; (b) FCOS; (c) YOLOv3; (d) our model (GLDM).
Remotesensing 15 01593 g012
Figure 13. Comparison of detection results before and after model improvement.
Remotesensing 15 01593 g013
Figure 14. (a) The line graph of the A P values of cattle, horse, sheep, and m A P on the multi-scale test dataset; (b) the heat map of the A P values of the three types of objects on the multi-scale test dataset. This more intuitively reflects the difference in the detection of scale changes in the model for cattle, horses, and sheep.
Remotesensing 15 01593 g014
Figure 15. The detection results of the model at scales of 0.5, 1, and 2; (ac) cattle at scales of 0.5, 1, and 2; (df) horses at scales of 0.5, 1, and 2; (gi) sheep at scales of 0.5, 1, and 2.
Remotesensing 15 01593 g015
Figure 16. The result of the direct detection of the original image of the UAV.
Remotesensing 15 01593 g016
Table 1. The allocation of images into the training, validation, and testing datasets.
DatasetsAnimal PatchesCattle InstancesHorse InstancesSheep Instances
Training344151111495354
Validation39169871495
Testing864713232342
Total469215115599191
Table 2. Details of objects’ sizes in the dataset.
CategoryMin WidthMax WidthAverage
Width
Min HeightMax HeightAverage
Height
MASMRSNumber
cattle117334.8798733.3733.990.11%2151
horse98137.17118236.9036.450.13%1559
sheep54217.4063919.6018.420.03%9191
Table 3. Details of objects’ size in multi-scale dataset.
ScaleCategoryMASMRSNumber
0.2cattle8.120.79%108
horse6.410.63%107
sheep3.030.30%605
0.25cattle10.150.99%108
horse8.030.78%107
sheep3.820.37%605
0.33cattle13.381.31%108
horse10.551.03%107
sheep5.010.49%605
0.5cattle20.311.98%108
horse16.041.56%107
sheep7.60.74%605
1cattle40.593.96%108
horse32.073.13%107
sheep15.211.49%605
2cattle79.557.77%61
horse63.876.24%92
sheep29.682.90%347
3cattle114.7311.20%36
horse94.459.22%78
sheep43.794.28%195
4cattle150.9414.7428
horse122.4311.96%64
sheep59.235.78%153
5cattle179.2417.50%23
horse149.8914.64%50
sheep72.047.04%90
Table 4. Comparison of state-of-the-art object-detection models.
ModelTimeCategoryAPF1RecallPrecisionmAPParameters 1
Faster
R-CNN
2016cattle39.34%0.4854.99%42.88%21.75%28.3M
horse25.37%0.3642.72%31.15%
sheep0.53%0.530.60%60.87%
RetinaNet2017cattle60.09%0.5236.73%91.05%35.78%36.4M
horse47.26%0.4227.86%85.71%
sheep0.00%00.00%0.00%
YOLOv32018cattle82.43%0.7871.76%85.79%74.69%61.5M
horse69.06%0.6760.06%74.62%
sheep72.59%0.7574.72%75.82%
FCOS2019cattle84.95%0.8583.23%87.31%78.06%32.1M
horse82.06%0.878.95%81.99%
sheep67.17%0.5540.73%86.73%
YOLOX-nano2021cattle84.69%0.8382.80%82.80%77.73%0.9M
horse75.72%0.7674.30%77.67%
sheep72.78%0.7771.69%82.87%
YOLOX-x2021cattle89.61%0.8790.23%83.66%87.19%99.0M
horse86.63%0.8587.93%82.08%
sheep85.32%0.8886.68%88.53%
GLDM
(ours)
2022cattle88.52%0.8687.47%84.25%86.47%5.7M
horse85.87%0.8483.90%84.16%
sheep85.03%0.8683.99%87.42%
1 The parameter quantity here is an approximate value, and the conversion relationship is taken as 1 M = 1000 k.
Table 5. Ablation experiments for the proposed method.
BaselineBackboneNeckAverage RecallAverage PrecisionmAPParameters
nano 76.26%81.11%77.73%0.9M
nanoECSP 84.74%84.93%85.98%3.8M
nanoECSPWAFR85.12%85.28%86.47%5.7M
Table 6. Ablation experiments for ECSP as the backbone.
BaselineBottleneckImage InputBlock RatemAP
nano 77.73%
nanoCHDC 78.17%
nanoCHDC1024 × 1024 85.04%
nanoCHDC1024 × 10241:1:3:185.98%
Table 7. Ablation experiments for stage compute rate in ECSP.
BaselineBottleneckImage InputBlock RatemAPParameter
nanoCHDC1024 × 10241:3:3:185.04%3.949M
nanoCHDC1024 × 10241:1:3:384.96%5.642M
nanoCHDC1024 × 10241:1:4:285.19%4.965M
nanoCHDC1024 × 10241:1:5:185.88%4.288M
nanoCHDC1024 × 10241:1:3:185.98%3.836M
Table 8. Ablation experiments for WAFR.
BaselineBackboneNeckmAP
nanoCSPDarknetPAN77.73%
nanoCSPDarknetWAFR78.63%
nanoECSPPAN85.98%
nanoECSPWAFR86.47%
Table 9. AP of three animals’ detection at different scales.
Scale0.20.250.330.512345
cattle AP0.50470.63610.79550.90350.91420.84670.2450.10380.029
horse AP0.14790.40220.51680.79290.89190.91590.73090.36340.089
sheep AP0.02550.11870.26020.62220.90740.94570.91270.73190.4122
mAP0.2260.38570.52420.77280.90450.90280.62960.39970.1767
Table 10. Livestock accounting in testing dataset.
CategoryTruthTPFPFNLAC
cattle47141277590.99
horse3232715152
sheep23421967294375
Disclaimer/Publisher’s Note: The statements, opinions and data contained in all publications are solely those of the individual author(s) and contributor(s) and not of MDPI and/or the editor(s). MDPI and/or the editor(s) disclaim responsibility for any injury to people or property resulting from any ideas, methods, instructions or products referred to in the content.

