
Snowfall Variation in Eastern Mediterranean Catchments


1
Laboratory of Atmospheric Physics, School of Physics, Aristotle University of Thessaloniki, 54124 Thessaloniki, Greece
2
Institute for Astronomy, Astrophysics, Space Applications and Remote Sensing, National Observatory of Athens, 15236 Athens, Greece
3
Laboratory of Engineering Geology & Hydrogeology, School of Geology, Aristotle University of Thessaloniki, 54124 Thessaloniki, Greece
4
Biological and Pharmaceutical Sciences and Technologies, Department of Environmental, University of Campania “Luigi Vanvitelli”, 81100 Caserta, Italy
*
Author to whom correspondence should be addressed.
Remote Sens. 2023, 15(6), 1596; https://doi.org/10.3390/rs15061596
Submission received: 8 February 2023
/
Revised: 4 March 2023
/
Accepted: 12 March 2023
/
Published: 15 March 2023
(This article belongs to the Special Issue Field-Scale Monitoring for Water Resources and Ecosystems Management: From Drone to Satellite Imagery)
Abstract
:This study aims to present and analyze the time series of the snow parameters focusing on representative geographical areas of the Eastern Mediterranean (i.e., Greece and Italy) and to examine their seasonal variability, in terms of region and geography. The satellite retrievals were firstly validated against in-situ retrievals for 67 common days, with a mean bias equal to −0.018 cm, with a near-Gaussian distribution, showing the good performance of the satellite snow detection. The satellite-based analysis resulted in increasing trends of snow water equivalent, attributed to the enhanced values between 2000 and 2009; however, decreasing trends are found starting from 2010 until now of −1.79 × 10⁻¹⁷ and −2.31 × 10⁻¹⁸ over the two representative areas of Greece (e.g., Thessaloniki and Kozani). A similar pattern is found for the snow water equivalent in the Italian study area, with a decreasing trend of −4.45 × 10⁻¹⁸. The presented results contribute to a better understanding of the spatial snow distribution and the snow coverage seasonality that could be crucial for the long-term groundwater management, by combining snow data trends from in-situ data and satellite statistics.

1. Introduction
Snow is a component of broad interest in the hydrological balance, being a form of precipitation with a particularly significant inflow rate. It is quite an important source of supply for groundwater recharge and the surface runoff of rivers and torrents, especially during the spring period [1,2]. The quantitative parameters of snow are the following: snowfall, snow depth (SD), snow water equivalent (SWE), snow accumulation and snowmelt. Snowfall is the amount of snow and/or ice pellets since the previous event. Snow depth is the depth of the new and remaining snow on the ground and SWE corresponds to the water equivalent of melted snow. Snow accumulation is the depth of snow measured in a specified period, whilst snowmelt is defined as the rate of snow melting.
Obviously, it is critically important to measure or estimate with a small error rate these parameters in order to be included within a hydrological model and provide accurate hydrological balance. Additionally, it is essential to accurately calculate the spatial distribution of snow height and its accumulation due to the affection morphological conditions, the climatic conditions, and the vegetation cover [3]. The snow parameters constitute critical input data in hydrological models for calculating the inflow and outflow in a basin. For instance, the volume of water stored in the snow is calculated as inflow for run-off models. Generally, SD and the SWE are key variables in many hydrological models and studies involve groundwater recharge rates, basic flow preservation of rivers, and hydropower dam sustainability. For their monitoring, two possible methods or a combination of them are available: (i) satellite remote sensing and (ii) in-situ measurements. Both methods have equal advantages and drawbacks. For example, ground-based monitoring networks provide valuable and quick measurements in the field [4]. However, field measurements are limited to specific regions and for certain periods of time. On the other hand, satellite monitoring of the snow parameters can provide long-term changes on a global scale [5]. Nevertheless, the general coarse spatial resolution of the majority of satellites results in a rather challenging well representativeness of the spatial variability of the snow parameters.
Numerous techniques based on remote sensing retrievals have been reported in studies for providing snow cover parameters. The applications have been applied in the basin scale as well as globally. In the study of Wang et al., [6] yearly and regional differences are found for the snow cover in variable latitudes and elevations in mountainous basins. In the aforementioned study, the seasonal variation in the snow-covered area showed a downward trend during the spring, summer, and fall seasons between 2000 and 2015. Another remote sensing application is snowmelt detection using special sensor microwaves/imagers to study the relation between summer and winter snowmelt [7].The radar classifications were conducted based on their differences in liquid snow content, snow grain size, and relative elevations. Recent studies also investigate the correlation of the presence of different aerosol types with the accelerating rate of the snow/glacial melting over regions [8,9].
Snow models provide valuable outputs on snow cover evolution and are useful in providing water availability projections [10]. Additionally, accurate measurements of the snow melt is of central importance to flood forecasting [11]. The possibility of estimating the future trend of these data is also essential for forecasting purposes [12]. Nevertheless, snow modeling remains a challenge due to the difficulty of simulating snow parameters [13].
Putting aside this difficulty, numerous works have attempted to incorporate snow parameters into hydrological balance simulation. For instance, quantitative snow parameters such as SWE and snow water content have been applied to validate SWAT model simulation [14,15]. Moreover, the simulation analysis results in the snow-dominated regions showed a significant connection between the CoupModel and WSFS model imported to the MODFLOW model for the study of groundwater—surface water interaction under climate variability [16]. In the study of Sorman et al. [17] the Hydrologiska Byråns Vattenbalansavdelning model was applied where the snowmelt runoff process is computed by a degree-day method. Other research applications focused on the correlation between water quality and melted snow discharge [18].
The Mediterranean region is warming 20% faster than the global average, while by 2050, the water demands are projected to double or even triple (UNEP/MAP and Plan Bleu 2020, https://www.unep.org/unepmap/, accessed on 11 March 2023). Hence, the study of snow contribution to the water availability of sites in the Mediterranean region can contribute to a better management plan of water resources. In Greece and Italy, water resources are under intense anthropogenic pressure regarding their qualitative and quantitative status. On top of that the in-situ observations of snow depth are rather limited in the aforementioned regions [19]. In the literature, extensive research for snowfall processes with respect to snow parameters in both Greece and Italy is missing. Considering the importance of snowmelt contribution to water budget in the Mediterranean, an extensive snow satellite dataset undertaken in selected Eastern Mediterranean regions is needed. In this paper, the space-based 0.25 × 0.25-degree snow extent climatology for selected Eastern Mediterranean regions derived from GLDAS data over the period 1960–2021 is presented for the first time. The objective of this research is: (i) to produce an updated set of validated satellite snow products, after their evaluation with the in-situ information and (ii) to analyze the SWE patterns, in order to configure whether they show a level of repetition through the years and to check any changes/trends in snow information from the satellite perspective. The novelty of this research is the 61-year snow parameters record, based on the satellite dataset approach for the Eastern Mediterranean region. These datasets can be used for future analysis and cross-comparison with other hydrological–hydrogeological parameters such as groundwater level and surface runoff in order to determine the influence of snowfall on water budget variation.
2. Materials and Methods
2.1. Study Area
Three sites from Greece and Italy were chosen to study the temporal variability of the snow parameters. Two of the study areas are located in Greece and one in Italy (Figure 1). The study sites were chosen due to the different hydrogeological, climatological, and socio-economic characteristics. The common characteristic of the sites is the necessity to use groundwater to cover water demands. In addition, snow variation information is missing from the sites. The characteristics of the study areas are briefly described below.
Study area 1: The coastal zone of Anthemountas basin is placed in Northern Greece. The elevation is varying between 0 to 1201 m, with a mean value of 260 m. The mean annual precipitation recorded here is 575 mm with a mean annual temperature of 15.1 °C. Groundwater is the main water supply source, while the main activities are livestock and agriculture. In the lowlands, the aquifer system is developed within sedimentary formations and in fractured rocks in the mountainous part of the basin. The coastal aquifer is influenced by seawater intrusion due to overexploitation [20].
Study area 2: The second area is Mouriki basin located north of Kozani city in Northern Greece. The mean elevation is 874.5 m, while the minimum and maximum elevation is 630 to 1710 m correspondingly. The mean annual precipitation recorded here is 636 mm with a mean annual temperature of 11.2 °C. Porous aquifers occur in the lowlands within sedimentary formations, while in the mountainous part of the dominant aquifer is fractured rock. The mountainous part is covered by dense forest, while in the lowlands agricultural activities dominate. In the porous aquifer, elevated nitrate concentrations have been observed in groundwater samples [21].
Study area 3: The Upper Volturno plain in Southern Italy is the third study area. The elevation is varying between 15 to 2118 m, with a mean value of 530 m. The mean annual precipitation recorded here is 800 mm with a mean annual temperature of 18 °C and is characterized by a slight impact of drought events [22]. The main aquifer system is developed in alluvial formations with a mean thickness of 60 m [23]. Karst aquifers are located in the mountainous part of the study area. In the lowlands, the main activities are livestock and agriculture. Forest dominates the mountainous part of the region. In the area, nitrate pollution occurs in the groundwater of the sedimentary aquifers.
2.2. Global Land Data Assimilation System (GLDAS) Dataset
Satellite data are processed to fill the gap in the snow monitoring over Greece. The dataset used in this study (GLDAS Noah Land Surface Model L4 monthly 0.25 × 0.25 degree V2.0 (GLDAS_NOAH025_M)) is publicly available at https://search.earthdata.nasa.gov/search, accessed on 11 March 2023. The aim of the Global Land Data Assimilation System (GLDAS) is to combine satellite and in-situ observations, implementing innovative surface models and techniques for data assimilation, in order to compute land surface fluxes and states [24]. The high-quality, global land surface fields provided by GLDAS support several current and proposed weather and climate predictions, water resources applications, and water cycle investigations. Noah model uses the Modified IGBP MODIS 20-category vegetation classification and the soil texture based on the Hybrid STATSGO/FAO dataset. The MODIS based land surface parameters are used in the current GLDAS-2.0 and GLDAS-2.1 products while the AVHRR base parameters were used in GLDAS-1 and previous GLDAS-2 products (prior to October 2012).
The products are processed in high resolutions (2.5 degrees to 1 km), providing 3-hourly, daily, monthly, and yearly mean values of the snow depth and snow water equivalent. In October 2020, all 3-hourly and monthly GLDAS-2 data were post-processed with the MOD44W MODIS land mask. Previously, some grid boxes over inland water were considered as over land and, thus, had non-missing values. The post-processing corrected this issue and masked out all model output data over inland water; the post-processing did not affect the meteorological forcing variables.
The GLDAS-2.0 data are archived and distributed in netCDF format, covering the period from January 1948 up to today. In our analysis, data were processed for the whole period from January 1960 up to December 2021, both in daily and monthly mean values of the snow parameters (i.e., SWE, SD). The dataset is the longest available record of region-scale variations in snow cover over the Eastern Mediterranean and is considered to be sufficiently accurate for monitoring the snow cover variability.
2.3. Methodology
In this section, the methodology used for the calculation of the snow water equivalent from satellite data is presented. SWE and SD are direct products of the GLDAS dataset. The snow density (ρ) is then calculated following the equation below, where SWE is in kg/m2, SD in m, and ρ in kg/m3:
SWE = SD × ρ,
The snow density’s literature values usually range from 100 to 500 kg/m3 [25]. However, the snow density is generally larger (due to the subsidence under the influence of gravity and other mechanisms), depending on the residence time of snow and the snow depth. Thus, its calculation from ground-based measurements or satellite retrievals is of great importance.
3. Results
In this section, a comparison of the satellite retrieved snow depth with the in-situ dataset is presented for the reference station of Mount Athos and Kozani, along with the mapping of the SWE and the snow density in a selected year. The vertical distribution and seasonality of snow parameters from 1960 to 2021 are also presented and discussed in Section 3.3.
3.1. Comparison with In-Situ Data
Snow depth derived from in-situ measurements available for Mount Athos and Kozani meteorological station was employed and used in the inter-comparison with the satellite dataset. The co-ordinates of the meteorological stations are shown in Table 1. The snow height measurements are recorded and analyzed hourly. This dataset consists of daily snow depth measurements from December 2018 to May 2022 and is considered stable over time, in order to assess the satellite performance.
Figure 2 shows the distribution of the satellite and the in-situ snow height differences. The histogram plot consists of 67 collocated cases. The near-Gaussian distribution of the absolute difference is centered slightly to the left, indicating lower satellite snow depth values on average with a mean bias of −0.0188 cm and a standard deviation of 0.1148 cm. Additionally, a high correlation of 0.65 is derived for the two datasets, showing the good performance of the satellite snow detection.
The quantitative validation at pixels over the selected study areas and the in-situ stations illustrate that the satellite dataset is generally consistent with the ground-based retrievals and this work confirms a very promising result considering all the individual uncertainties of both datasets. It should be pointed out that this analysis is not a point-by-point validation, but a good spatial collocation between ground-based stations and target satellite pixels. In this context, the installation of more ground-based stations for monitoring the snow is crucial for providing accurate measurements.
3.2. Snow Mapping
To illustrate the methodology applied in our analysis, Figure 3 and Figure 4 depict the snow cumulative snow parameters in 1970 over the regions under study. Similar maps are produced every year with an automatic algorithm for visualization purposes.
More specifically, the algorithm consists of the following steps:
- (i)
- Reading the GLDAS satellite dataset and selecting the region of interest;
- (ii)
- Date screening;
- (iii)
- Estimation of the spatial distribution of SWE and SD in the selected areas;
- (iv)
- Calculation of the snow density;
- (v)
- Mapping the snow parameters in the selected areas.
The algorithm’s outputs are: (i) a csv file with written values of the SWE and the SD in the selected areas and (ii) maps of the SWE for certain days/months/years, based on the selection of the user.
In 1970, moderate values of the snow statistics were observed. In general, the snow water equivalent and the snow depth are higher in theAnthemountas basin, whilst the derived snow density ranged between 170 and 200 kg/m3. Data gaps in the maps represent screened-out pixels due to either cloud or uncalibrated values.
3.3. Temporal Variability of the Snow Parameters
Based on the space-borne snow cover climatology, the spatiotemporal distribution of the snow parameters over the selected study areas during the last decades is analyzed in this session on accumulative yearly mean values and an accumulative mean monthly basis. Figure 5 and Figure 6 present the temporal distribution of the snow parameters over the years 1960–2021 for the three study areas: the Anthemountas basin, the Mouriki basin, and the Upper Volturno-Calore basin.
The linear fit slope values show similar temporal variability for SWE and SD for the three regions. The satellite dataset results in a generally insignificant increase after 1960, mainly attributed to the enhanced SD values between the 2000 and 2013 decade. However, after 2010, the satellite dataset shows a decrease in the SD by −7.5 × 10⁻²⁰ for theAnthemountasand −9.63 × 10⁻²¹ for theMourikibasin, whilst the decreasing trend of the SWE is −1.79 × 10⁻¹⁷ and −2.31 × 10⁻¹⁸ per year, correspondingly. Concerning the UpperVolturno-Calore basin, the satellite dataset shows a decrease in the SD by −1.95 × 10⁻²¹, with the decreasing trend of SWE being equal to −4.45 × 10⁻¹⁸.
Table 2 summarizes the accumulative values of the SWE (kg/m2) and the SD (m) and the calculated snow density (kg/m3) for the selected measurement study areas in Greece, the Anthemountas basin, the Mouriki basin, and the Upper Volturno-Calore basin, for the period between 1960 and 2021. The retrieved snow density values are within the reported ranges in the literature (100–500 kg/m3), showing no significant deviation for the two Greek and Italian study areas. The yearly mean snow density values for the Anthemountas basin and the Upper Volturno-Calore basin study areas are found equal to 224 kg/m3. However, yearly mean snow density values are differentiated for the two Greek study areas. Possible reasons for these insignificant discrepancies could be attributed to their geographical characteristics (e.g., different altitudes).
Additionally, the retrieved values are well within the snow density values reported for other Mediterranean regions (i.e., Morocco, Spain, France, Italy, Bulgaria, and Croatia) in the study of Fayad et al. [10]. The Mediterranean region is characterized by a warmer snowpack, a shorter snow season, and a higher variation in both the yearly and monthly snow depth and snow density mean values compared to the Tundra, Taiga, and Prairie regions, according to the above study.
In what follows, the annual snow parameters cycle is presented in Figure 7. The results are displayed in monthly boxplots, calculated from the monthly average values. In general, the SWE and SD are higher during the winter months (i.e., December to February) and zero in the warmer months (i.e., May to August). The snow accumulation season picks up during January for both Greek study areas over the years, followed by December, the two winter months with the largest snow coverage, whilst accumulation decreases on March over both stations. Additionally, snow coverage is reported in September only for the Mouriki basin. Concerning the Italian study area, snow accumulation is only found during the winter months, with the most enhanced snow values being reported during February. Additionally, some outliers occur, marked with dots, mainly during the month of February for all study areas.
Table 3 summarizes the mean seasonal values of the snow density, produced from the monthly mean values for the Anthemountas basin, the Mouriki basin, and the Upper Volturno-Calore basin study areas.
4. Discussion
The snowfall increases the storage of water in the mountainous part of a basin and the snowmelt enhances the base flow of rivers during the spring and summer period [26]. Additionally, snowmelt constitutes a critical process for groundwater recharge [27]. In Greece, although snowfalls do not occur with the same intensity as in Central and Northern Europe, it is a common phenomenon in the mountainous regions of the country between November and May [28,29]. The period with the most frequent snowfall occurrence is the winter period, while snow occurs more rarely during summer months in the mountains of Olympus (>2300 m) where snowfalls have even occurred in the second fortnight of August [30]. Additionally, in the high-elevation sites of Italy such as the part of the Apennine range, high values of snow height and very strong interannual variability of snowfall have been recorded [31].
Obviously, there are few studies in Greece quantifying snow parameters. Additionally, the existing studies focus on data with low spatial resolution, not sufficient to depict the snow variability, or exploit in-situ data that correspond to local conditions. Stefanidis et al. [19], analyzed the snowfall time series of the meteorological station within the mountainous areas of the Trikala regional unit for the period between 2002 and 2016. The examined snow characteristics were the snowfall height and the number of days of snowfall. The investigation of spatial variability of snowfall characteristics showed a very strong linear correlation between those parameters and altitude. In addition, a decreasing trend was reported for both snowfall height and days of snow in almost all the examined meteorological stations; however, this trend was not statistically significant.
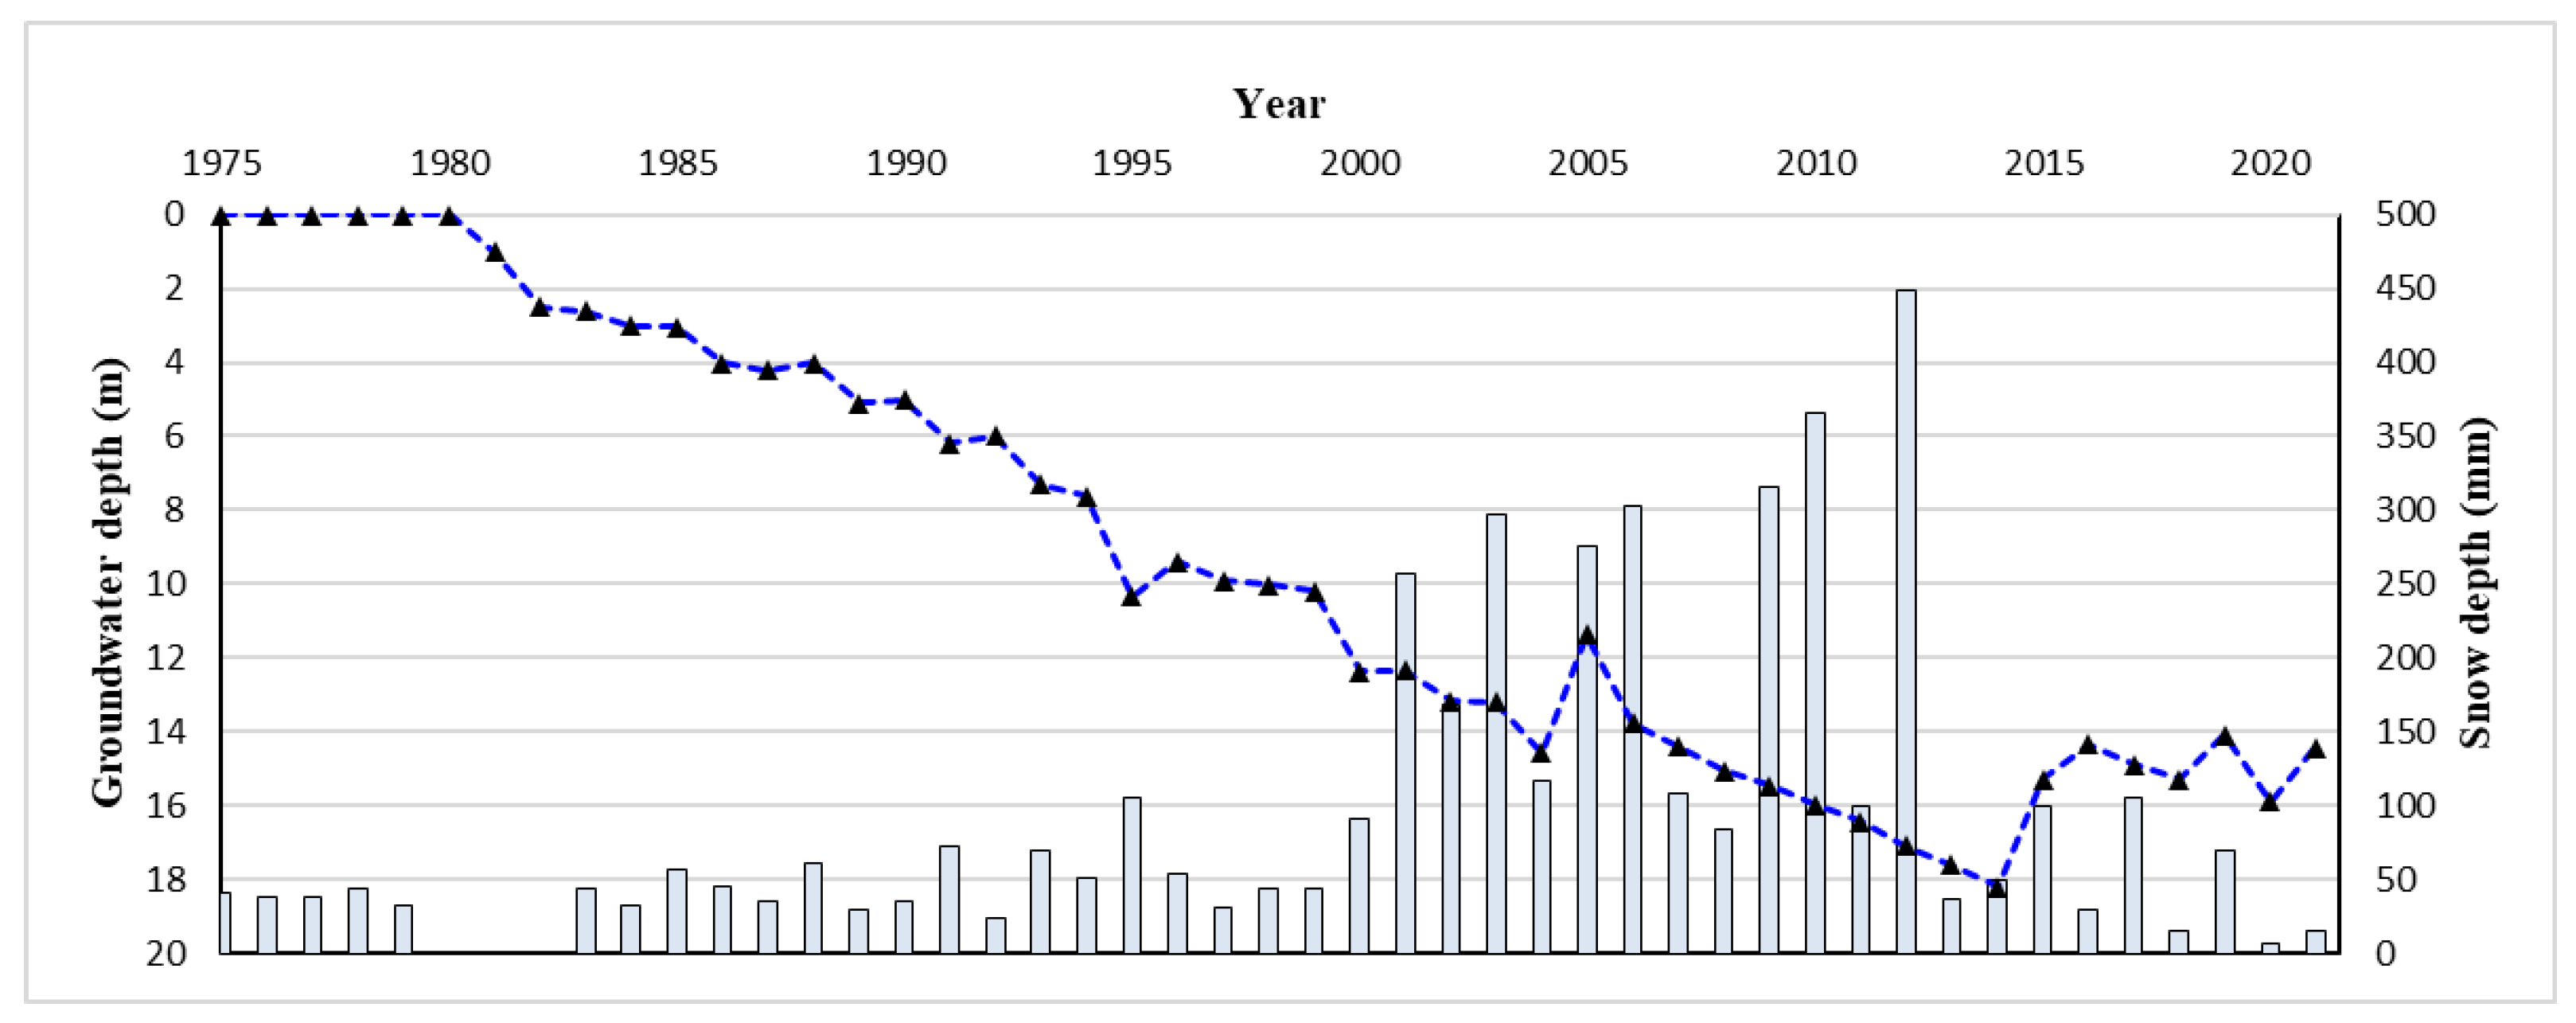
Within this study, it is verified that snowfall mainly occurs during the period of November to May in both Greek and Italian sites. These results are in accordance with previous studies, while the new findings provided the snowfall variability in Northern Greece focusing on two catchments. In the Anthemountas basin mismanagement of groundwater led to groundwater depletion [32]. A critical question in this site is the impact of snowfall variability on the phenomenon. In Figure 8 the variation of the groundwater table in the coastal zone of Anthemountas basin and the snowfall is presented. In the last decade, the higher amounts of snowfall probably contributed to the replenishment of groundwater reserves. A deeper understanding of the process is essential to studying snowmelting during the hydrological year. Most of the snow-related research focused on areas characterized by permafrost thickness and talik formation [33]. Nevertheless, the investigation of the connection between snowfall and groundwater resources in areas without snow cover throughout the year could play a key role in better water management strategies. However, snowmelt is not a constant variable, depending on the climate variations throughout the year. Therefore, the calculation of water reserves is a challenge [13]. The spatial and temporal hydrological change made the operation of the simulation models even more difficult [34]. In-situmeasurements can be used as apriori information in models for developing historical hydrological trends. However, the simulation of future trends requires the development of climatic forecasts. The evapotranspiration method in conjunction with the emission scenario of climate models influences the simulated water balance and the trend of surface runoff and groundwater recharge [35].
Groundwater management strategies require knowledge of both future and historical hydrological trends. For this purpose, numerous works have been applied in the last decades with time series of snow data of about 10–50 years. Since 1987, Gleick [36] investigated the impact of climatic changes in the Sacramento basin, California for a period of 50 years. Zhang [37] simulated for 13 years the variability of groundwater depth in shallow aquifers over different sites of the Prairie Pothole Region (PPR) in North America. On the other hand, stream flow is also affected by snow. Wanger [38] collected data on air temperature trends, SWE measurements, and snow duration trends for a period of 30 years to simulate future projections of stream flow trends starting in 2020 through to 2100 following the RCP 8.5 scenario.
Within this study, we provide the remote sensing snowfall data for a period of 61 years. This data is essential for future research; however, the limitations of the methods and data used have to be highlighted. In general, the intercomparison of the remote sensing measurements in two meteorological stations in the Eastern Mediterranean area shows a strong correlation with the in-situ observations (correlation coefficient of 0.65), depicting the ability of the satellite approaches to properly capture the temporal variability of the snow parameters above areas with various geomorphological characteristics. This confirms the importance of the space-borne observations supplements with respect to spatiotemporal variability of snow cover in continentals with weak ground-based data coverage.
In general, the discrepancies attributed to the satellite dataset limitations are the following: (i) the cloud cover preventing the surface view [39], (ii) the influence of dense vegetation in snow cover, (iii) and the heterogeneity of mountainous terrains influence the satellite data interpretation [40,41], inducing possible offsets on the snow retrievals. These are common sources of uncertainty when dealing with satellite data that might lead to untrustworthy values of the snow parameters. Thus, the current evaluation analysis needs to be extended to include more measurements from meteorological stations, in order to enable the detection of potential patterns and dependences of pixels in certain areas. For this purpose, the combination with in-situ measurements enhances the perspectives of more accurate retrievals.
Our study results in a generally insignificant increase after 1960, mainly attributed to the enhanced SD values between the 2000 and 2013 decade. A recent study performed in Switzerland [42] showed that the strongly decreasing trends found in the late 1980s and 1990s are followed by a trend reversal in the last 10 years (2000–2009), which was correlated with the slightly decreasing temperatures. These results are in accordance with our findings. Another 27-year-long analysis of satellite-based monthly mean climatology (1985–2011) indicated no significant trend for the entire Alpine region [41]. The most recent 38-year-long analysis [43] over the Northern Hemisphere shows an overall negative trend of −3.6% ± 2.7% for the yearly snow cover extent. Moreover, the season most affected by negative trends for snow cover extent is found to be the winter. The average reduction was −11.5% ± 6.9%, whilst positive changes were observed in spring with an average value of 10% ± 5.9%.
According to our knowledge, the comparison of seasonal variability of snow distribution in different areas has not been widely examined in the existing literature. The novelty of this research is the 61-year snow parameters record, based on the satellite dataset in three regions of the Eastern Mediterranean. Undeniably, a base monitoring station should be established, while the existing monitoring data of snow parameters should be publicly accessible in order to be considered in such studies. The next steps of this study are to use the data in simulation models. Additionally, the snow melting process in conjunction with groundwater dynamics should be studied.
5. Conclusions
Seasonal variability and spatial distribution of the snow depth and the snow water equivalent over specific Greek and Italian regions are conducted and we present the first space-borne snow extent climatology for study areas in the Eastern Mediterranean. The satellite retrievals were firstly validated against in-situ retrievals for 67 common days, with a mean bias equal to –0.018 cm, with a near-Gaussian distribution, showing the good performance of the satellite snow detection. The conclusions of this study are summarized as follows:
- (1)
- The 61-year record, based on the satellite analysis, resulted in increasing trends of snow water equivalent, due to the enhanced values between 2000 and 2013; however, decreasing trends starting from 2013 until now of −1.79 × 10⁻¹⁷ and −2.31 × 10⁻¹⁸ over the two representative areas of Greece (i.e., the Anthemountas and Mouriki basins). A similar SWE pattern is found for the study area in Italy, with a decreasing trend of −4.45 × 10⁻¹⁸ after 2010.
- (2)
- The SWE and SD annual cycle seems to be higher in the winter months and zero in the warmer months for the three study areas, whilst snow coverage is reported in September only for the Mouriki basin.
- (3)
- The mean snow density is calculated as equal to 224 kg/m3 for both the Anthemountas basin and the Upper Volturno-Calore basin, denoting the significance of the geographical characteristics (e.g., altitude) in each reference region, whilst the yearly mean snow density is differentiated for the two Greek study areas, with the area of the Mouriki basin presenting the lowest annual value (i.e., 206 kg/m3).
- (4)
- Overall, the present study evaluates and strengthens our limited understanding of the importance of the estimation of the spatial snow distribution in the Eastern Mediterranean which could be crucial for long-term groundwater management, by combining meteorological (i.e., snow data trends), hydrological, and satellite statistics. This information is crucial for representing distributions of the snow water equivalent, for examining the level of repetition from year-to-year, and for improving the water resource management.
Author Contributions
All authors contributed significantly to this manuscript. K.A.V. carried out the processing of satellite measurements and prepared the figures of the manuscript. N.K. was responsible for the methodology and conceptualization of the paper. K.A.V. prepared the manuscript with contributions from all co-authors. All authors have read and agreed to the published version of the manuscript.
Funding
This research project was supported financially by the Hellenic Foundation for Research and Innovation (H.F.R.I.) under the “Second Call for H.F.R.I. Research Projects to support Post-Doctoral Researchers” (Project Number: 00138, Title: Groundwater Depletion. Are Eco-Friendly Energy Recharge Dams a Solution?).
Data Availability Statement
The GLDAS dataset is freely distributed via the website at: https://search.earthdata.nasa.gov/search (accessed on 13 March 2023).
Acknowledgments
We acknowledge the financial support by the Hellenic Foundation for Research and Innovation (H.F.R.I.) under the “Second Call for H.F.R.I. Research Projects to support Post-Doctoral Researchers” (Project Number: 00138, Title: Groundwater Depletion. Are Eco-Friendly Energy Recharge Dams a Solution?).
Conflicts of Interest
The authors declare no conflict of interest.
References
- Sturm, M.; Taras, B.; Liston, G.E.; Derksen, C.; Jonas, T.; Lea, J. Estimating Snow Water Equivalent Using Snow Depth Data and Climate Classes. J. Hydrometeorol. 2010, 11, 1380–1394. [Google Scholar] [CrossRef]
- Wesemann, J.; Herrnegger, M.; Schulz, K. Hydrological modelling in the anthroposphere: Predicting local runoff in a heavily modified high-alpine catchment. J. Mt. Sci. 2018, 15, 921–938. [Google Scholar] [CrossRef] [Green Version]
- Pistocchi, A.; Bagli, S.; Callegari, M.; Notarnicola, C.; Mazzoli, P. On the Direct Calculation of Snow Water Balances Using Snow Cover Information. Water 2017, 9, 848. [Google Scholar] [CrossRef] [Green Version]
- Marty, C.; Meister, R. Long-term snow and weather observations at Weissfluhjoch and its relation to other high-altitude observatories in the Alps. Theor. Appl. Climatol. 2012, 110, 573–583. [Google Scholar] [CrossRef] [Green Version]
- Wang, X.; Xie, H.; Liang, T.; Huang, X. Comparison and validation of MODIS standard and new combination of Terra and Aqua snow cover products in northern Xinjiang, China. Hydrol. Process. 2009, 429, 419–429. [Google Scholar] [CrossRef]
- Wang, Y.; Huang, X.; Liang, H.; Sun, Y.; Feng, Q.; Liang, T. Tracking Snow Variations in the Northern Hemisphere Using Multi-Source Remote Sensing Data (2000–2015). Remote Sens. 2018, 10, 136. [Google Scholar] [CrossRef] [Green Version]
- Zhou, C.; Zheng, L. Mapping Radar Glacier Zones and Dry Snow Line in the Antarctic Peninsula Using Sentinel-1 Images. Remote Sens. 2017, 9, 1171. [Google Scholar] [CrossRef] [Green Version]
- Niu, H.W.; Kang, S.C.; Wang, H.L.; Du, J.K.; Pu, T.; Zhang, G.T.; Lu, X.X.; Yan, X.G.; Wang, S.J.; Shi, X.F. Light-absorbing impurities accelerating glacial melting in southeastern Tibetan Plateau. Environ. Pollut. 2020, 257, 113541. [Google Scholar] [CrossRef]
- Niu, H.; Kang, S.; Wang, H.; Zhang, R.; Lu, X.; Qian, Y.; Paudyal, R.; Wang, S.; Shi, X.; Yan, X. Seasonal variation and light absorption property of carbonaceous aerosol in a typical glacier region of the southeastern Tibetan Plateau. Atmos. Chem. Phys. 2018, 18, 6441–6460. [Google Scholar] [CrossRef] [Green Version]
- Fayad, A.; Gascoin, S.; Faour, G.; López-Moreno, J.I.; Drapeau, L.; Page, M.L.; Escadafal, R. Snow hydrology in Mediterranean mountain regions: A review. J. Hydrol. 2017, 551, 374–396. [Google Scholar] [CrossRef]
- Wang, S.; Russell, H.A.J. Forecasting Snowmelt-Induced Flooding Using GRACE Satellite Data: A Case Study for the Red River Watershed. Can. J. Remote Sens. 2016, 42, 203–213. [Google Scholar] [CrossRef]
- Adamowski, J.F. Development of a short-term river flood forecasting method for snowmelt driven floods based on wavelet and cross-wavelet analysis. J. Hydrol. 2008, 353, 247–266. [Google Scholar] [CrossRef]
- Baggi, S.; Schweizer, J. Characteristics of wet snow avalanche activity: 20 years of observations from a high alpine valley (Dischma, Switzerland). Nat. Hazards 2009, 50, 97–108. [Google Scholar] [CrossRef] [Green Version]
- Grusson, Y.; Sun, X.; Gascoin, S.; Sauvage, S.; Raghavan, S.; Anctil, F.; Sáchez-Pérez, J.-M. Assessing the capability of the SWAT model to simulate snow, snow melt and treamflow dynamics over an alpine watershed. J. Hydrol. 2015, 531, 574–588. [Google Scholar] [CrossRef]
- Myers, D.T.; Ficklin, D.L.; Robeson, S.M. Incorporating rain-on-snow into the SWAT model results in more accurate simulations of hydrologic extremes. J. Hydrol. 2021, 603, 126972. [Google Scholar] [CrossRef]
- Okkonen, J.; Kløve, B. A sequential modelling approach to assess groundwater–surface water resources in a snow dominated region of Finland. J. Hydrol. 2011, 411, 91–107. [Google Scholar] [CrossRef]
- Sorman, A.A.; Sensoy, A.; Tekeli, A.E.; Sorman, A.U.; Akyurek, Z. Modelling and forecasting snowmelt runoff process using the HBV model in the eastern part of Turkey. Hydrol. Process 2009, 23, 1031–1040. [Google Scholar] [CrossRef]
- Lee, J.; Jung, H. Understanding the relationship between meltwater discharge and solute concentration by modeling solute transport in a snowpack in snow-dominated regions—A review. Polar Sci. 2022, 31, 100782. [Google Scholar] [CrossRef]
- Stefanidis, S.; Stathis, D.; Dafis, S. The characteristics of snowfall in the mountainous areas of Trikala region. In Proceedings of the 19th Forestry Conference, Litochoro, Greece, 5 October 2019. [Google Scholar]
- Kazakis, N.; Pavlou, A.; Vargemezis, G.; Voudouris, K.; Soulios, G.; Pliakas, F.; Tsokas, G. Seawater intrusion mapping using electrical resistivity tomography and hydrochemical data. An application in the coastal area of eastern Thermaikos Gulf, Greece. Sci. Total Environ. 2016, 543, 373–387. [Google Scholar] [CrossRef]
- Patrikaki, O.; Kazakis, N.; Voudouris, K. Vulnerability map: A useful tool for groundwater protection: An example from Mouriki basin, North Greece. Fresenius Environ. Bull. 2012, 21, 2516–2521. [Google Scholar]
- Ntona, M.M.; Busico, G.; Mastroccico, M.; Kazakis, N. The impacts of drought on groundwater resources in the Upper Volturno basin, Southern Italy. In Proceedings of the 16th International Congress of Geological Society of Greece, Patra, Greece, 17–19 October 2022. [Google Scholar]
- Busico, G.; Kazakis, N.; Colombani, N.; Mastrocicco, M.; Voudouris, K.; Tedesco, D. A modified SINTACS method for groundwater vulnerability and pollution risk assessment in highly anthropized regions based on NO3− and SO42− concentrations. Sci. Total Environ. 2017, 609, 1512–1523. [Google Scholar] [CrossRef] [PubMed]
- Rodell, M.; Houser, P.R.; Jambor, U.; Gottschalck, J.; Mitchell, K.; Meng, C.J.; Arsenault, K.; Cosgrove, B.; Radakovich, J.; Bosilovich, M.; et al. The Global Land Data Assimilation System. Bull. Am. Meteorol. Soc. 2004, 85, 381–394. [Google Scholar] [CrossRef] [Green Version]
- Meløysund, V.; Leira, B.; Høiseth, K.; Lisø, K. Predicting snow density using meteorological data. Meteorological Applications. 2007, 14, 413–423. [Google Scholar] [CrossRef]
- Dumanski, S.; Pomeroy, J.W.; Westbrook, C.J. Hydrological regime changes in a Canadian Prairie basin. Hydrol. Process. 2015, 29, 3893–3904. [Google Scholar] [CrossRef]
- Carroll, R.W.H.; Deems, J.S.; Niswonger, R.; Schumer, R.; Williams, K.H. The Importance of Interflow to Groundwater Recharge in a Snowmelt-Dominated Headwater Basin. Geophys. Res. Lett. 2019, 46, 5899–5908. [Google Scholar] [CrossRef] [Green Version]
- Houssos, E.E.; Lolis, C.J.; Bartzokas, A. The atmospheric conditions over Europe and the Mediterranean, favoring snow events in Athens, Greece. Adv. Geosci. 2007, 12, 127–135. [Google Scholar] [CrossRef] [Green Version]
- Dafis, S.; Lolis, C.J.; Houssos, E.E.; Bartzokas, A. The atmospheric circulation characteristics favouring snowfall in an area with complex relief in Northwestern Greece. Int. J. Climatol. 2016, 36, 3561–3577. [Google Scholar] [CrossRef]
- Leivathinos, A.Ν. The phenomenon of snowfall in Greece. Proc. Athens Acad. 1936, 11, 116–131. [Google Scholar]
- Capozzi, V.; De Vivo, C.; Budillon, G. Synoptic control over winter snowfall variability observed in a remote site of Apennine Mountains (Italy), 1884–2015. Cryosphere 2022, 16, 1741–1763. [Google Scholar] [CrossRef]
- Kazakis, N.; Voudouris, K.; Koumantakis, I. Groundwater depletion in Anthemountas basin. Climate change or Mis-management? In Proceedings of the 3rd Conference of ΕΥΕ-ΕΕDYP-ΕΥS, Athens, Greece, 10–12 December 2015; pp. 199–206. [Google Scholar]
- Jafarov, E.E.; Coon, E.T.; Harp, D.R.; Wilson, C.J.; Painter, S.L.; Atchley, A.L.; Romanovsky, V.E. Modeling the role of preferential snow accumulation in through talik development and hillslope groundwater flow in a transitional permafrost landscape. Environ. Res. Lett. 2018, 13, 105006. [Google Scholar] [CrossRef]
- Ntona, M.M.; Busico, G.; Mastrocicco, M.; Kazakis, N. Modeling groundwater and surface water interaction: An overview of current status and future challenges. Sci. Total Environ. 2022, 846, 157355. [Google Scholar] [CrossRef] [PubMed]
- Gelfan, A.; Moreydo, V.; Motovilov, Y.; Solomatine, D.P. Long-term ensemble forecast of snowmelt inflow into the Cheboksary Reservoir under two different weather scenarios. Hydrol. Earth Syst. Sci. 2018, 22, 2073–2089. [Google Scholar] [CrossRef] [Green Version]
- Gleick, P.H. The development and testing of a water balance model for climate impact assessment: Modeling the Sacramento basin. Water Resour. Res. 1987, 23, 1049–1061. [Google Scholar] [CrossRef]
- Zhang, Z.; Li, Y.; Barlage, M.; Chen, F.; Miguez-Macho, G.; Ireson, A.; Li, Z. Modeling groundwater responses to climate change in the Prairie Pothole Region. Hydrol. Earth Syst. Sci. 2020, 24, 655–672. [Google Scholar] [CrossRef] [Green Version]
- Wagner, A.M.; Bennett, K.E.; Liston, G.E.; Hiemstra, C.A.; Cooley, D. Multiple Indicators of Extreme Changes in Snow-Dominated Streamflow Regimes, Yakima River Basin Region, USA. Water 2021, 13, 2608. [Google Scholar] [CrossRef]
- Gafurov, A.; Bárdossy, A. Cloud removal methodology from MODIS snow cover product. Hydrol. Earth Syst. Sci. 2009, 13, 1361–1373. [Google Scholar] [CrossRef] [Green Version]
- Foppa, N.; Seiz, G. Inter-annual variations of snow days over Switzerland from 2000–2010 derived from MODIS satellite data. Cryosphere 2012, 6, 331–342. [Google Scholar] [CrossRef] [Green Version]
- Hüsler, F.; Jonas, T.; Riffler, M.; Musial, J.P.; Wunderle, S. A satellite-based snow cover climatology (1985–2011) for the European Alps derived from AVHRR data. Cryosphere 2014, 8, 73–90. [Google Scholar] [CrossRef] [Green Version]
- Scherrer, S.C.; Wüthrich, C.; Croci-Maspoli, M.; Weingartner, R.; Appenzeller, C. Snow variability in the Swiss Alps 1864–2009. Int. J. Climatol. 2013, 33, 3162–3173. [Google Scholar] [CrossRef] [Green Version]
- Notarnicola, C. Overall negative trends for snow cover extent and duration in global mountain regions over 1982–2020. Sci. Rep. 2022, 12, 13731. [Google Scholar] [CrossRef]
Figure 1.
Geographical distribution of the station used in this study.
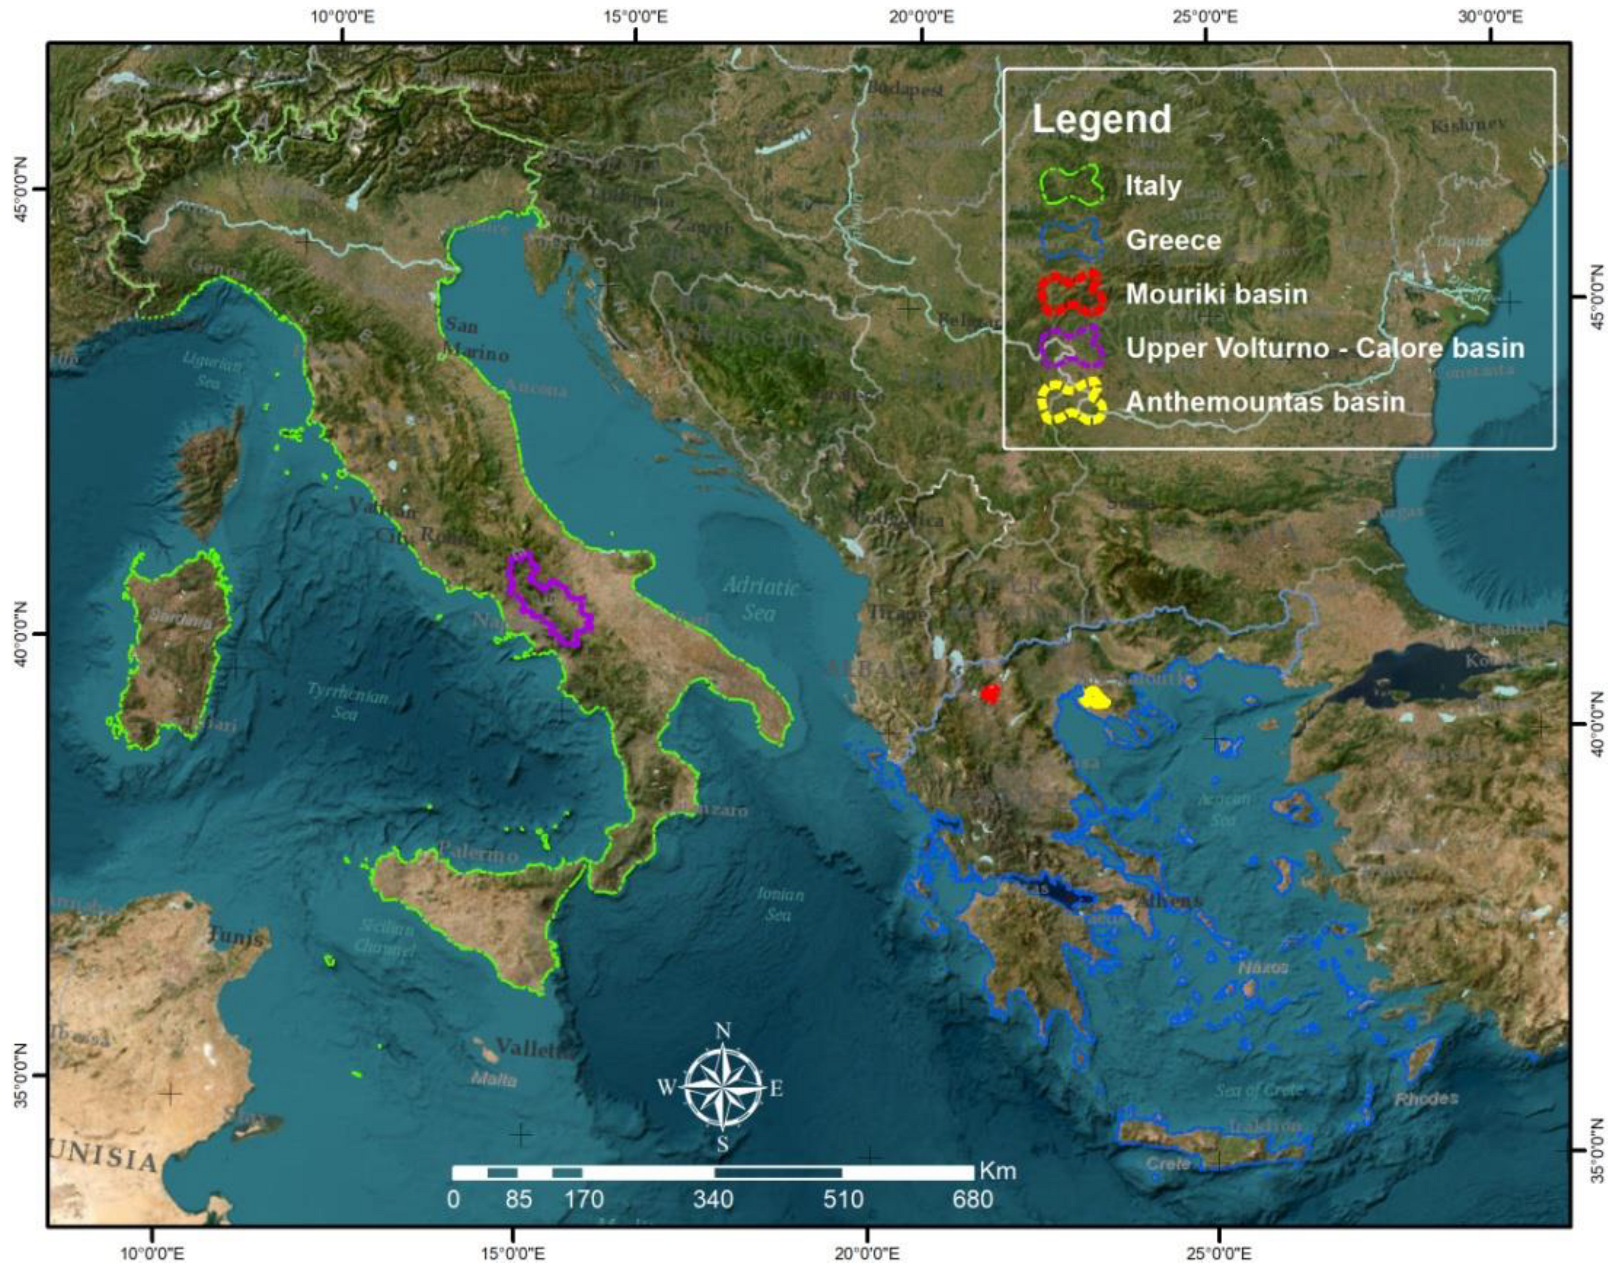
Figure 2.
Histogram of absolute differences between satellite snow height and in-situ snow height, calculated for all collocated cases.
Figure 2.
Histogram of absolute differences between satellite snow height and in-situ snow height, calculated for all collocated cases.
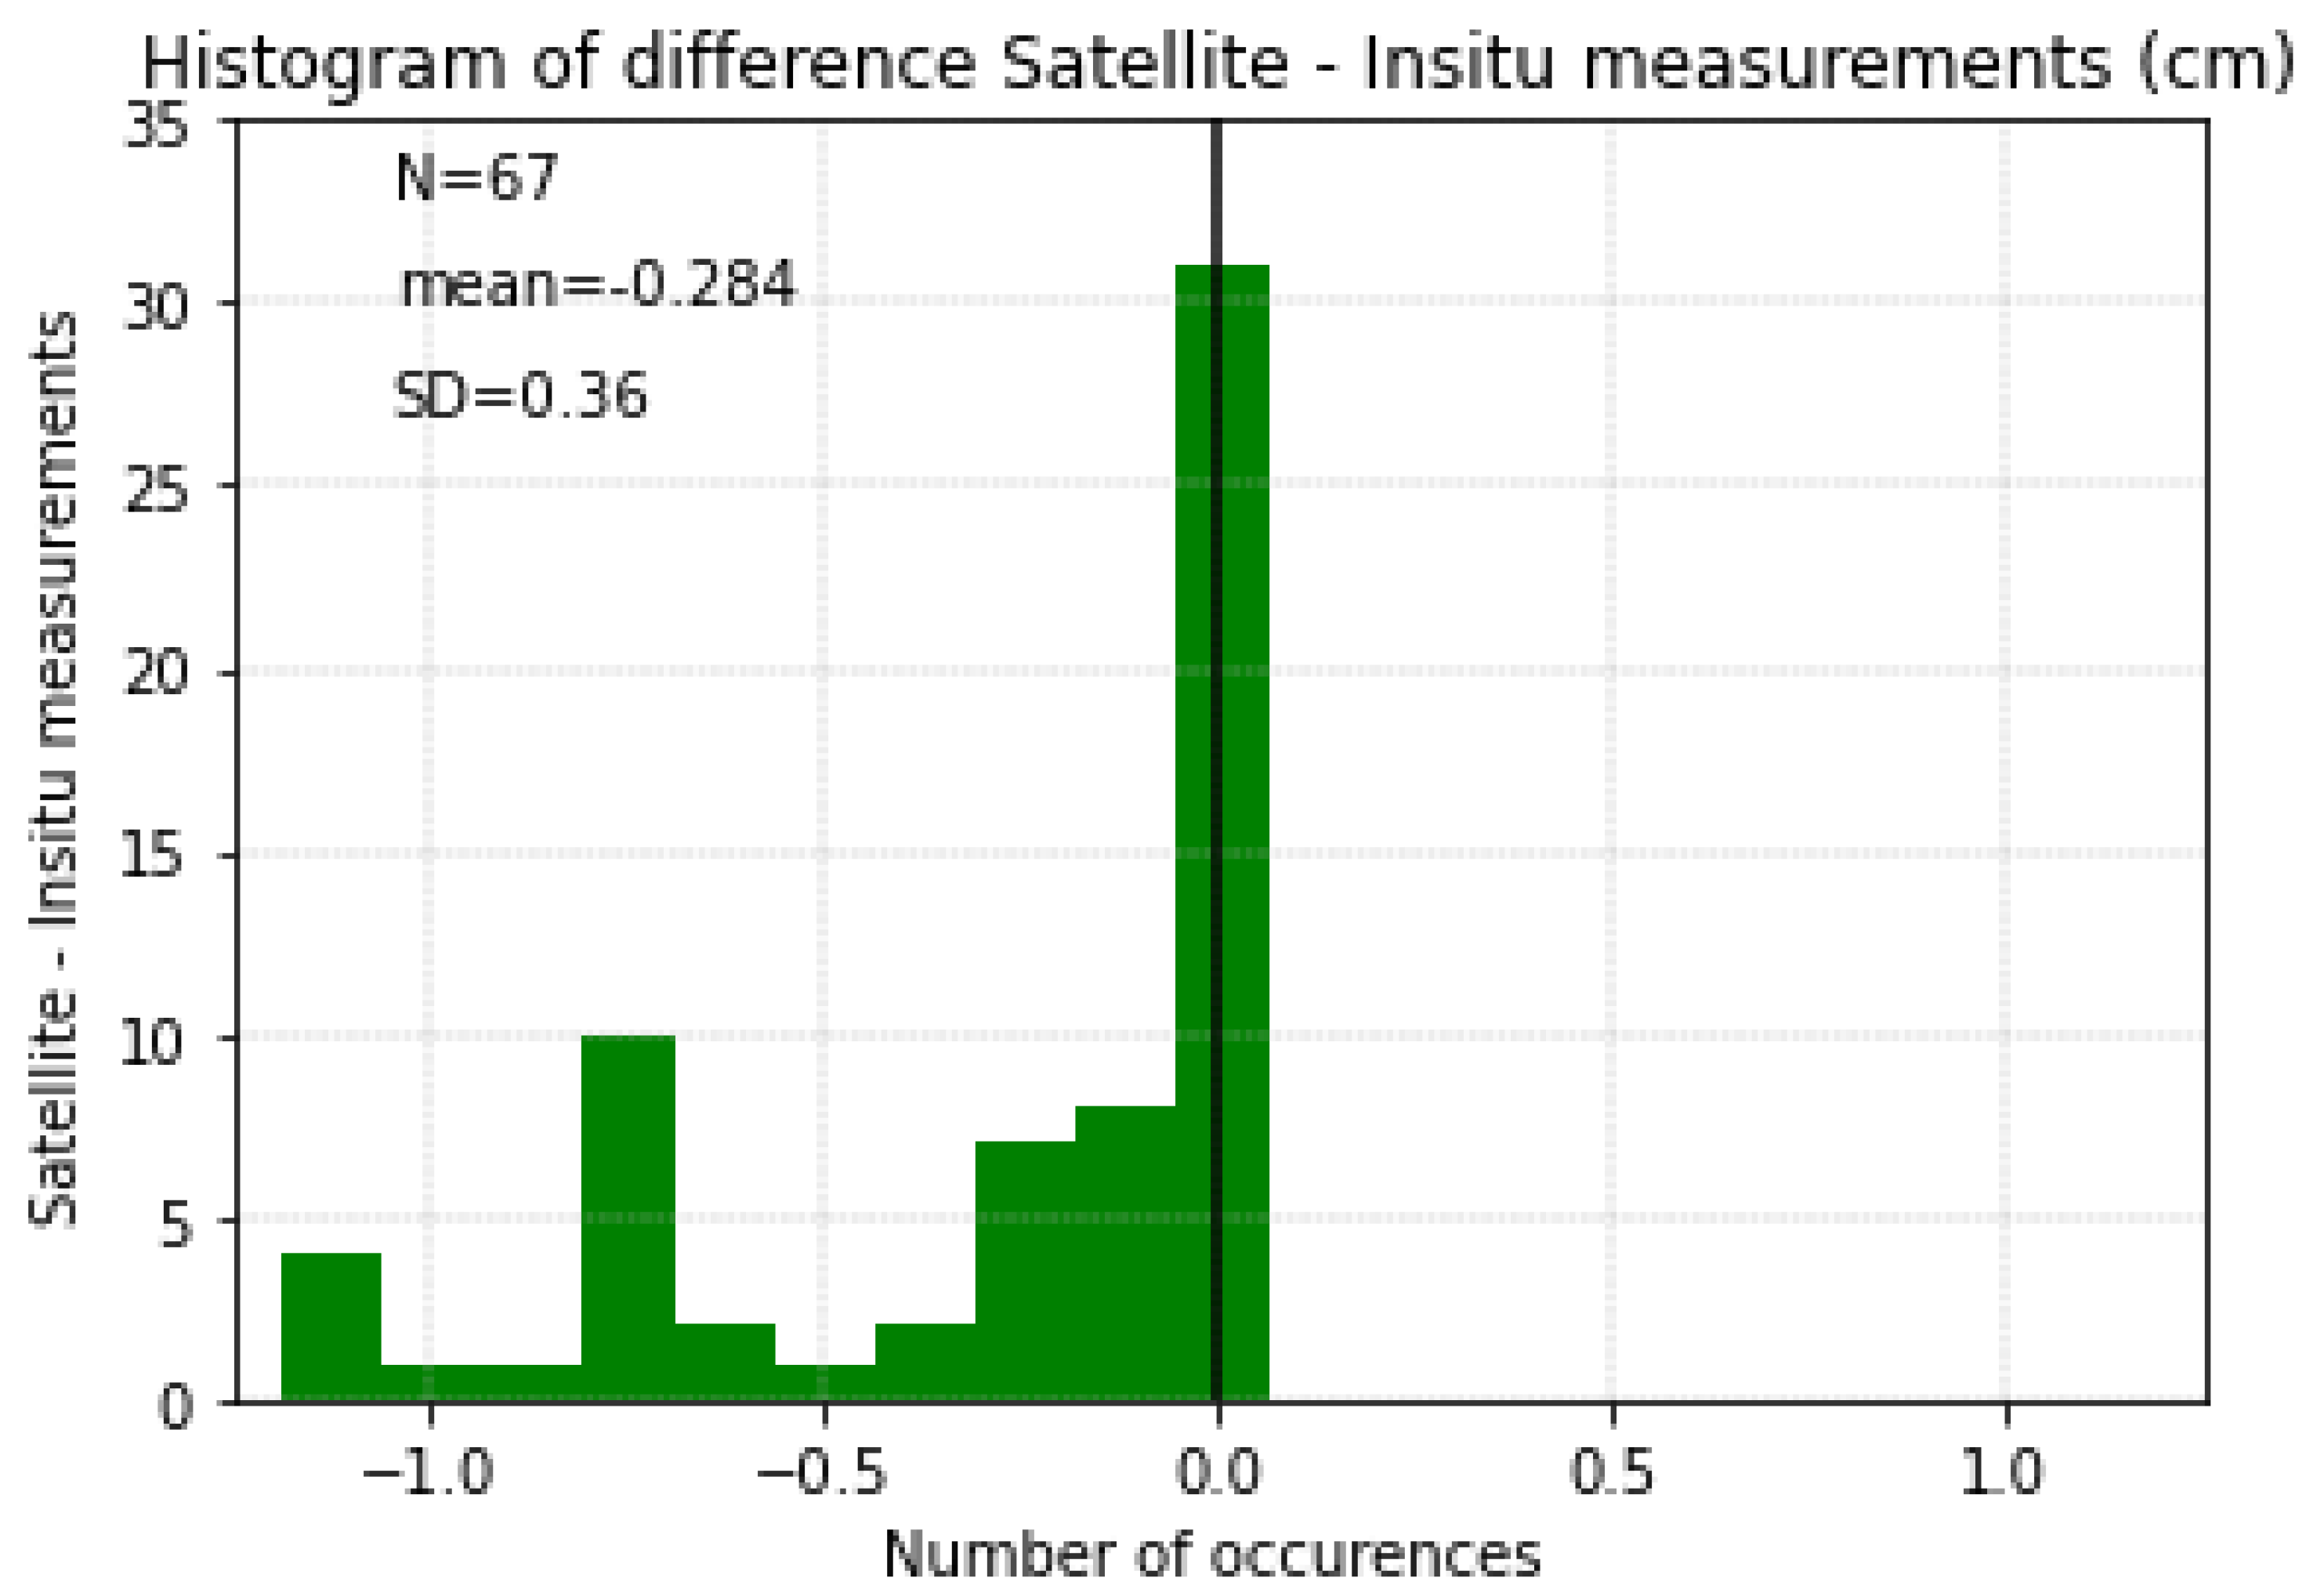
Figure 3.
Cumulative (a) snow water equivalent (kg/m2) and (b)snow depth (m)in 1970 over the study areas.
Figure 3.
Cumulative (a) snow water equivalent (kg/m2) and (b)snow depth (m)in 1970 over the study areas.
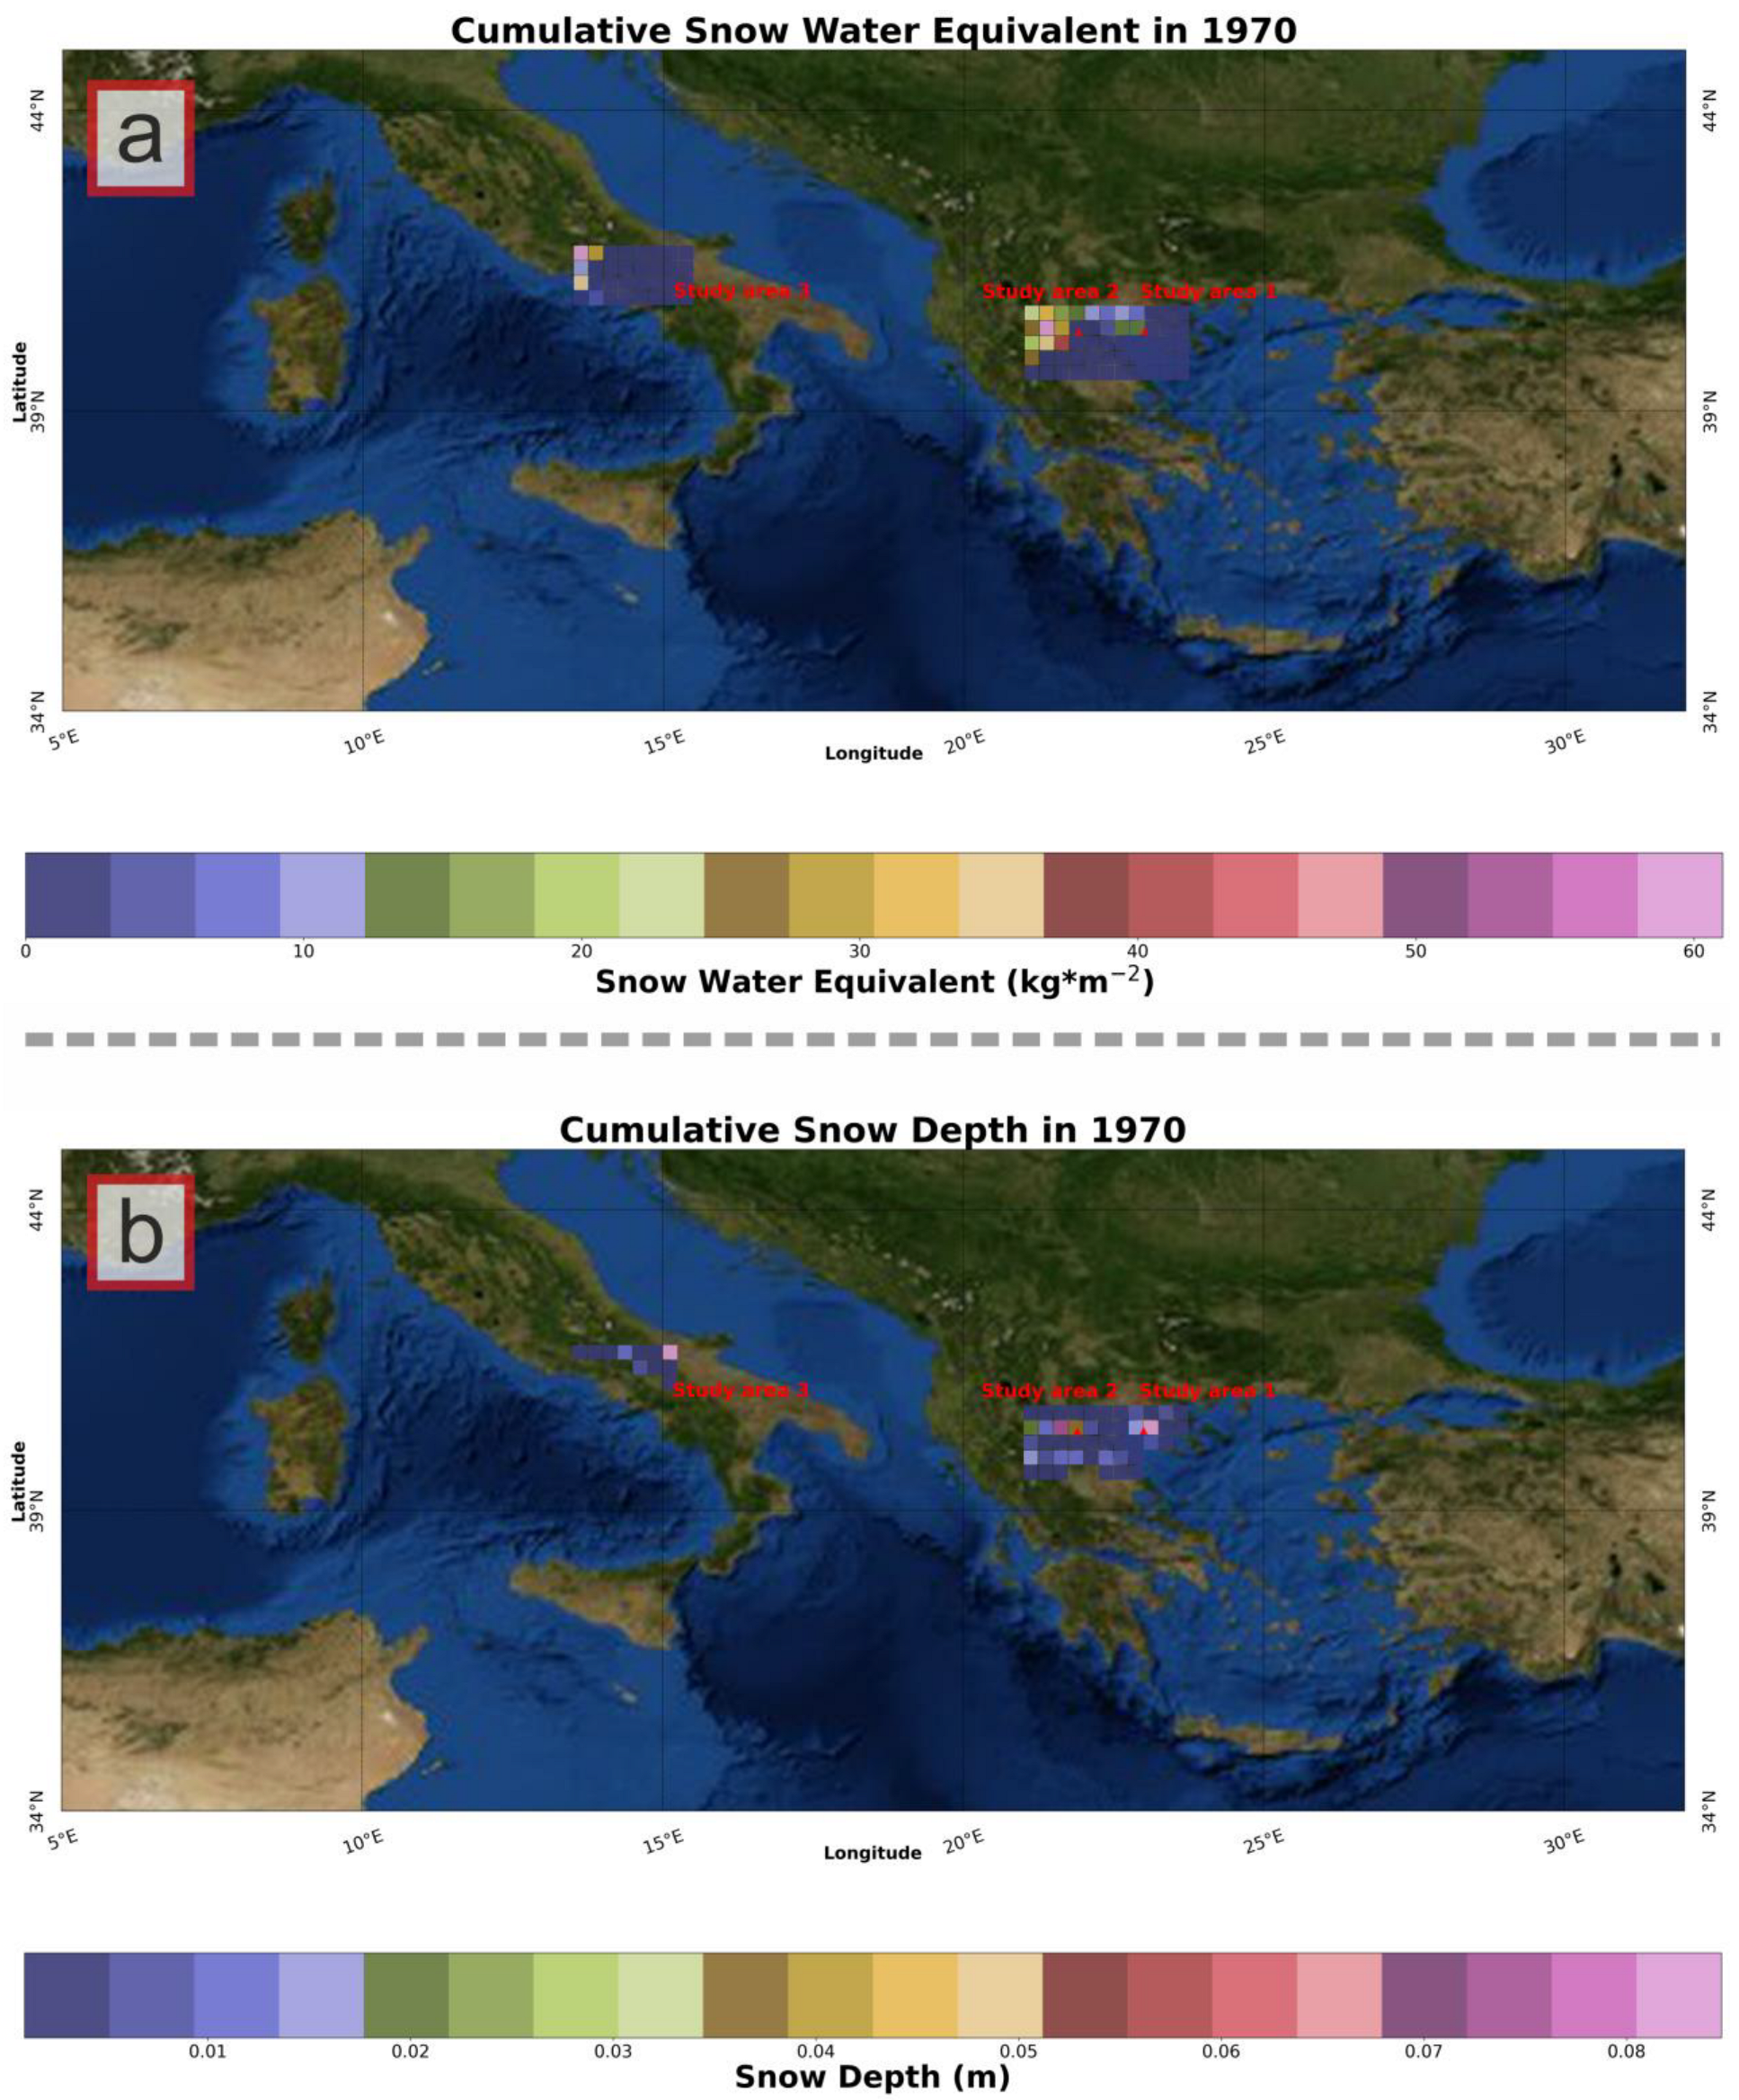
Figure 4.
Cumulative snow density (kg/m3) in 1970, estimated over the study areas.
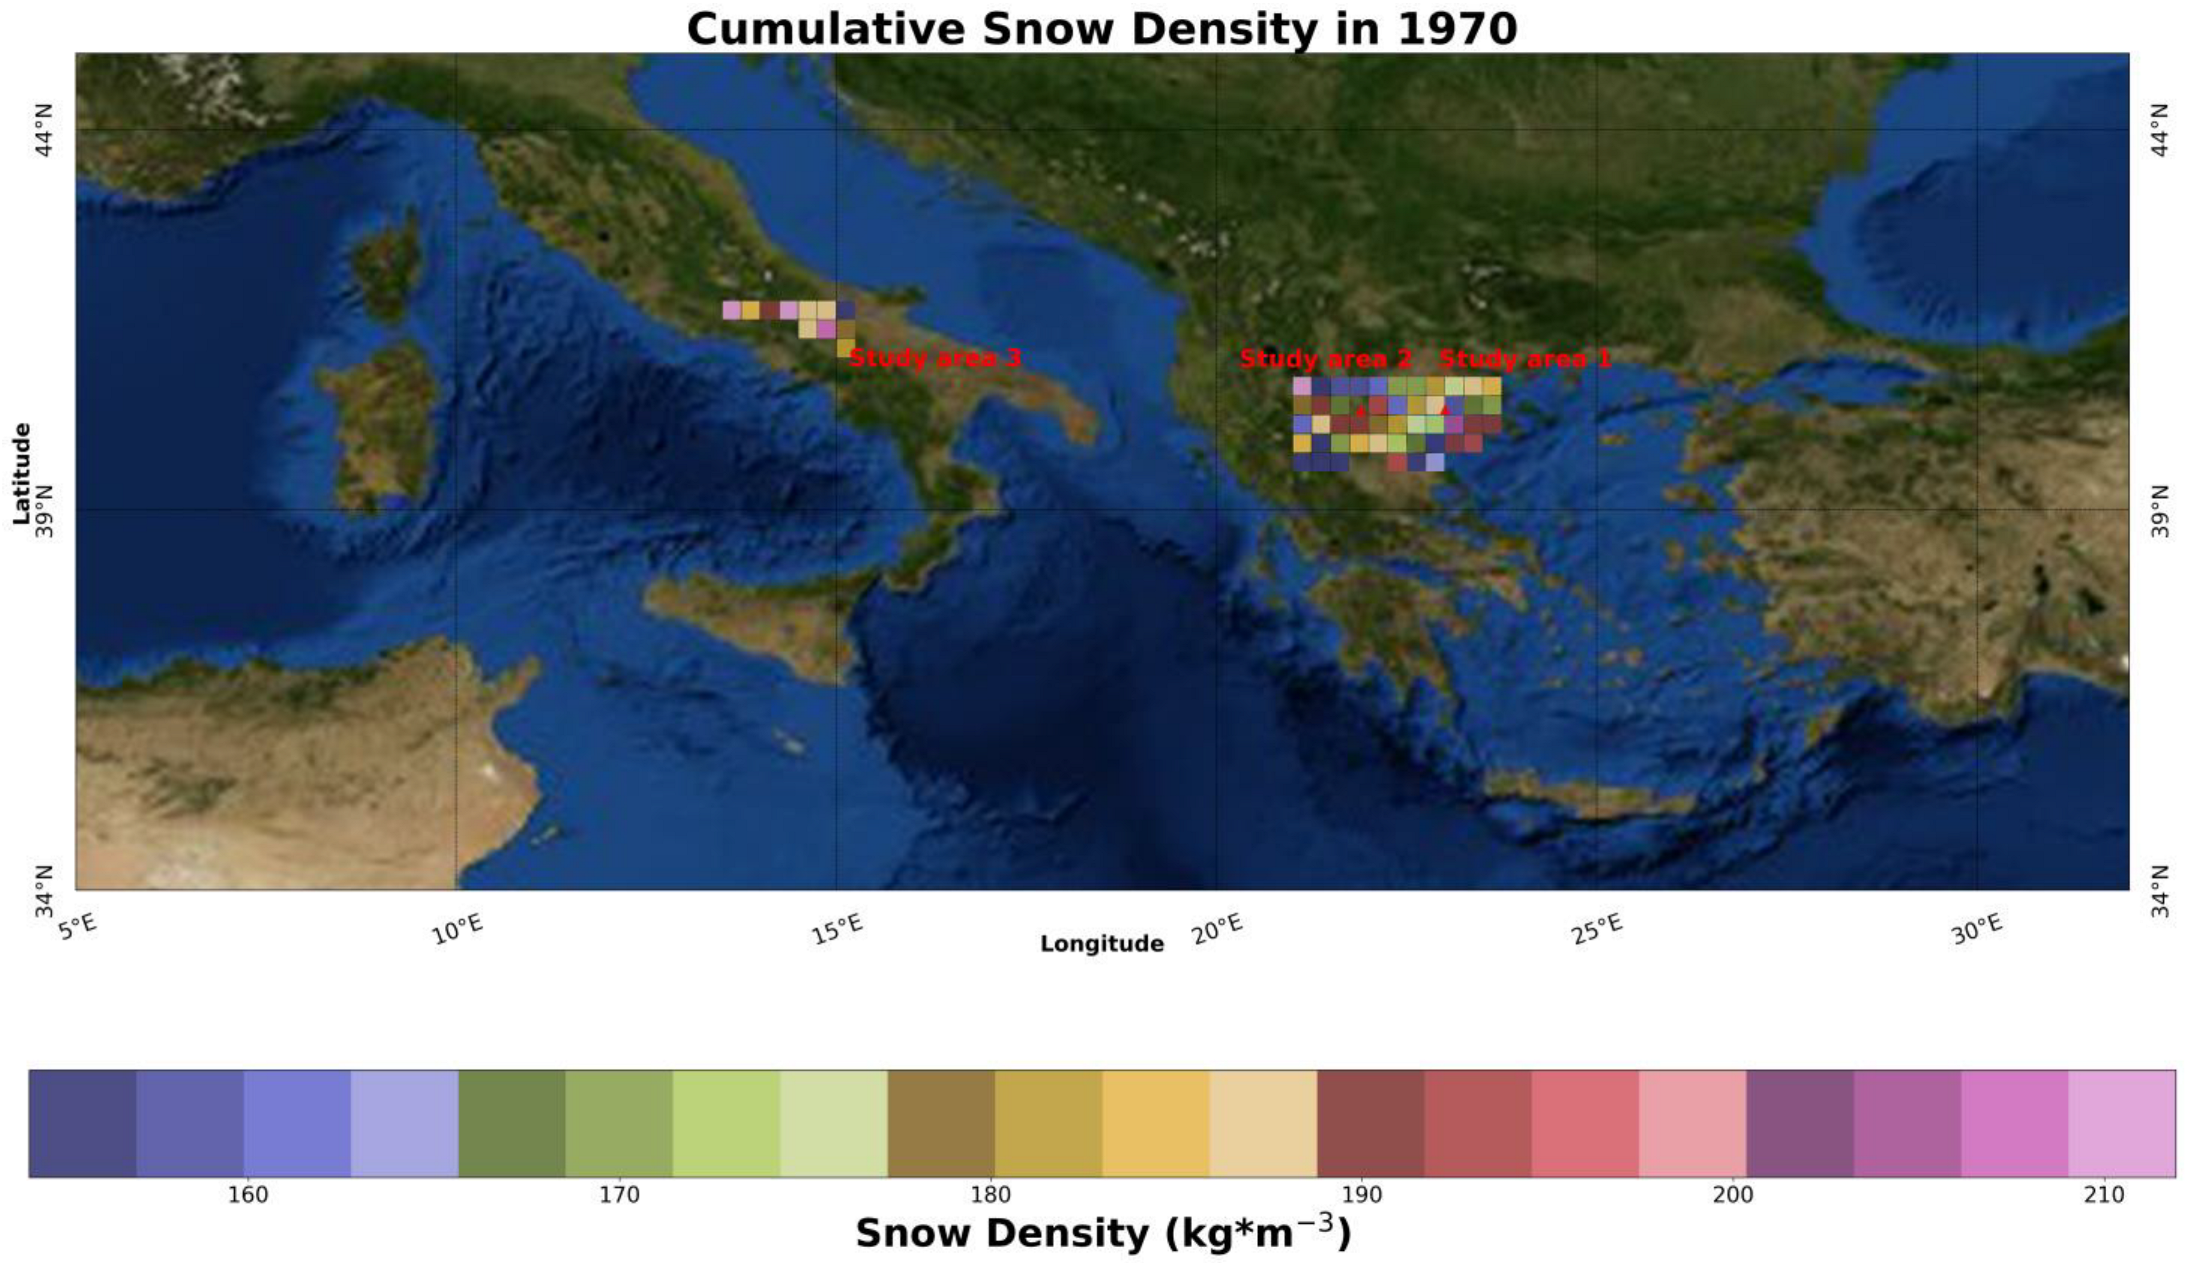
Figure 5.
Monthly averaged accumulative snow water equivalent (kg/m2) time series: (a) in Anthemountas basin, (b) in Mouriki basin, and (c) in Upper Volturno-Calore basin, during the period 1960–2021 derived from the GLDAS dataset. Highlighted is the period with the increased values.
Figure 5.
Monthly averaged accumulative snow water equivalent (kg/m2) time series: (a) in Anthemountas basin, (b) in Mouriki basin, and (c) in Upper Volturno-Calore basin, during the period 1960–2021 derived from the GLDAS dataset. Highlighted is the period with the increased values.

Figure 6.
Monthly averaged accumulative snow depth (m) time series: (a) inAnthemountas basin, (b) in Mouriki basin, and (c) in Upper Volturno-Calore basin, during the period 1960–2021 derived from the GLDAS dataset. Highlighted is the period with the increased values.
Figure 6.
Monthly averaged accumulative snow depth (m) time series: (a) inAnthemountas basin, (b) in Mouriki basin, and (c) in Upper Volturno-Calore basin, during the period 1960–2021 derived from the GLDAS dataset. Highlighted is the period with the increased values.

Figure 7.
The annual cycle of the monthly mean snow parameters: (a) SWE in Anthemountas basin, (c) SWE in Mourikibasin, (e) in Upper Volturno-Calore basin, (b) SD in Anthemountas basin, (d) SD in Mouriki basin, and (f) in Upper Volturno-Calore basin, during the period 1960–2021. Boxplot whiskers correspond to the most distant value encountered within 1.5 times the interquartile range above the upper and lower quartiles.
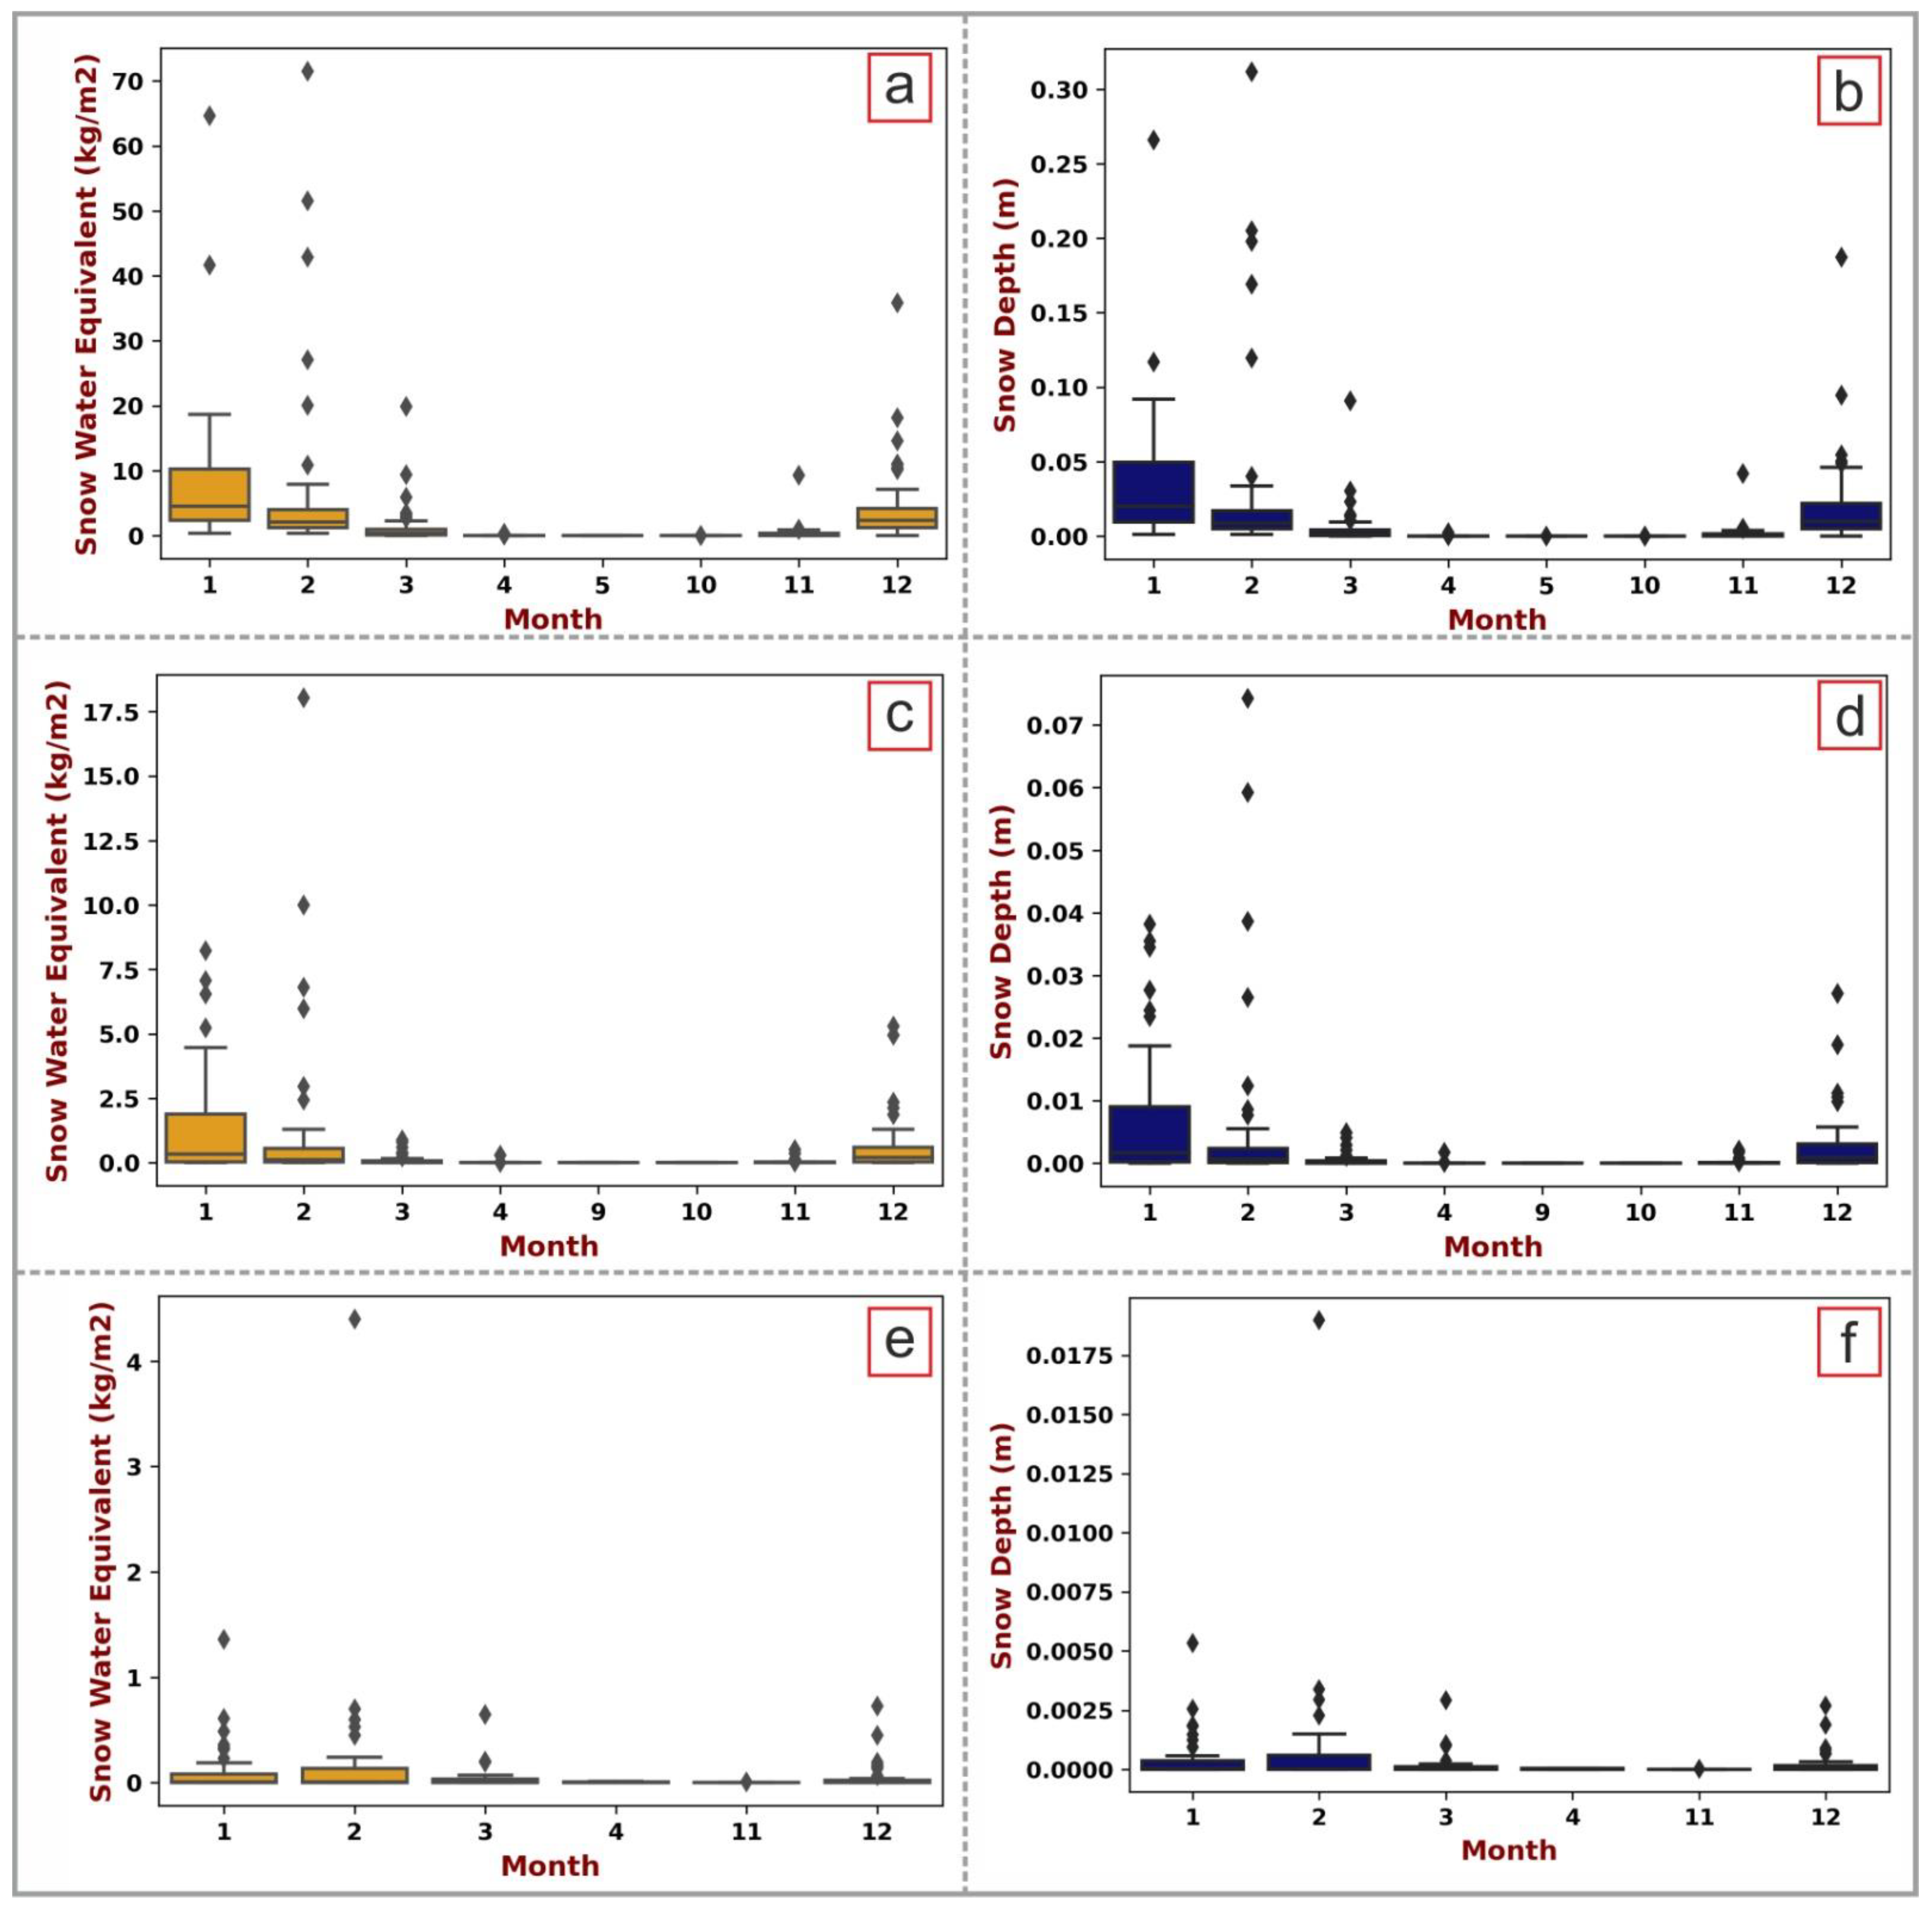
Figure 8.
Groundwater fluctuation and snow depth in Anthemountas basin (with modification Kazakis et al., 2015).
Figure 8.
Groundwater fluctuation and snow depth in Anthemountas basin (with modification Kazakis et al., 2015).

Table 1.
Co-ordinates (WGS-84) of the meteorological stations used in the comparison with the satellite data.
Table 1.
Co-ordinates (WGS-84) of the meteorological stations used in the comparison with the satellite data.
| Meteorological Station | Thessaloniki (Mount Athos) | Kozani (ZoodochosPigi) |
|---|---|---|
| Latitude | 40.320 | 40.375 |
| Longitude | 22.590 | 21.875 |
| Altitude (m) | 7 | 1303 |
Table 2.
Summary of the accumulative values of the snow water equivalent and the snow depth and the retrieved snow density values from the GLDAS dataset for the whole study period (1960–2021) as mean values of catchments.
Table 2.
Summary of the accumulative values of the snow water equivalent and the snow depth and the retrieved snow density values from the GLDAS dataset for the whole study period (1960–2021) as mean values of catchments.
| Study Area | Anthemountas Basin | Mouriki Basin | Upper Volturno-Calore Basin |
|---|---|---|---|
| Snow water equivalent (kg/m2) | 18.612 | 2.796 | 0.264 |
| Snow depth (m) | 0.083 | 0.0136 | 0.0012 |
| Snow density (kg/m3) | 224 | 206 | 224 |
Table 3.
Mean values of the SD from the GLDAS dataset for the whole study period (1960–2021). These seasonal values are calculated from the average monthly values.
Table 3.
Mean values of the SD from the GLDAS dataset for the whole study period (1960–2021). These seasonal values are calculated from the average monthly values.
| Season | Anthemountas Basin | Mouriki Basin | Upper Volturno-Calore Basin |
|---|---|---|---|
| Winter | 0.08 | 0.004711 | 0.0005 |
| Spring | 0.005385 | 0.0003 | 0.00011 |
| Summer | - | - | - |
| Autumn | 0.001795 | 0.00007 | 0.000008 |
Disclaimer/Publisher’s Note: The statements, opinions and data contained in all publications are solely those of the individual author(s) and contributor(s) and not of MDPI and/or the editor(s). MDPI and/or the editor(s) disclaim responsibility for any injury to people or property resulting from any ideas, methods, instructions or products referred to in the content. |
© 2023 by the authors. Licensee MDPI, Basel, Switzerland. This article is an open access article distributed under the terms and conditions of the Creative Commons Attribution (CC BY) license (https://creativecommons.org/licenses/by/4.0/).
Share and Cite
MDPI and ACS Style
Voudouri, K.A.; Ntona, M.M.; Kazakis, N. Snowfall Variation in Eastern Mediterranean Catchments. Remote Sens. 2023, 15, 1596. https://doi.org/10.3390/rs15061596
AMA Style
Voudouri KA, Ntona MM, Kazakis N. Snowfall Variation in Eastern Mediterranean Catchments. Remote Sensing. 2023; 15(6):1596. https://doi.org/10.3390/rs15061596
Chicago/Turabian StyleVoudouri, Kalliopi Artemis, Maria Margarita Ntona, and Nerantzis Kazakis. 2023. "Snowfall Variation in Eastern Mediterranean Catchments" Remote Sensing 15, no. 6: 1596. https://doi.org/10.3390/rs15061596
Note that from the first issue of 2016, this journal uses article numbers instead of page numbers. See further details here.