Article

Improving Land Use and Land Cover Information of Wunbaik Mangrove Area in Myanmar Using U-Net Model with Multisource Remote Sensing Datasets

1
Department of Global Agricultural Sciences, Graduate School of Agriculture and Life Sciences, The University of Tokyo, Tokyo 113-8654, Japan
2
Center for Spatial Information Science, The University of Tokyo, Kashiwa 277-8568, Japan
3
Department of Building Environment and Energy Engineering, The Hong Kong Polytechnic University, Kowloon, Hong Kong, China
*
Author to whom correspondence should be addressed.
Remote Sens. 2024, 16(1), 76; https://doi.org/10.3390/rs16010076
Submission received: 14 November 2023 / Revised: 16 December 2023 / Accepted: 22 December 2023 / Published: 24 December 2023
(This article belongs to the Special Issue Remote Sensing in Mangroves III)

Abstract

:
Information regarding land use and land cover (LULC) is essential for regional land and forest management. The contribution of reliable LULC information remains a challenge depending on the use of remote sensing data and classification methods. This study conducted a multiclass LULC classification of an intricate mangrove ecosystem using the U-Net model with PlanetScope and Sentinel-2 imagery and compared it with an artificial neural network model. We mainly used the blue, green, red, and near-infrared bands, normalized difference vegetation index (NDVI), and normalized difference water index (NDWI) of each satellite image. The Digital Elevation Model (DEM) and Canopy Height Model (CHM) were also integrated to leverage the model performance in mixed ecosystems of mangrove and non-mangrove forest areas. Through a labeled image created from field ground truth points, the models were trained and evaluated using the metrics of overall accuracy, Intersection over Union, F1 score, precision, and recall of each class. The results demonstrated that the combination of PlanetScope bands, spectral indices, DEM, and CHM yielded superior performance for both the U-Net and ANN models, achieving a higher overall accuracy (94.05% and 92.82%), mean IoU (0.82 and 0.79), mean F1 scores (0.94 and 0.93), recall (0.94 and 0.93), and precision (0.94). In contrast, models utilizing the Sentinel-2 dataset showed lower overall accuracy (86.94% and 82.08%), mean IoU (0.71 and 0.63), mean F1 scores (0.87 and 0.81), recall (0.87 and 0.82), and precision (0.87 and 0.81). The best-classified image, which was produced by U-Net using the PlanetScope dataset, was exported to create an LULC map of the Wunbaik Mangrove Area in Myanmar.

Graphical Abstract

1. Introduction

Mangrove ecosystems are among the most productive coastal habitats and are of great importance in contributing to the basic needs of local communities, such as wood, medicine, and food, and in protecting them from severe natural disasters [1,2]. Despite their significance, these ecosystems are experiencing a decline in status owing to the rapid increase in human population and developmental dynamics. It has been confronted with numerous anthropogenic disturbances, including the expansion of agriculture and aquaculture, urbanization, and the extensive exploitation of commercial fuelwood [3,4,5]. To compensate for mangrove deforestation, land use and land cover information for a region are essential components of an effective mangrove management regime. A reliable and up-to-date LULC map plays a crucial role in formulating management regulations, decision making, and restoration programs [6].
With the rapid development of Earth Observation, many researchers have been exploring remote sensing technology in environmental sciences. Remote sensing has become a powerful tool in mangrove conservation across various research areas such as mangrove extent mapping, species-level identification, LULC classification, and aboveground biomass estimation [7,8,9]. Acknowledging the contributions of space technology, numerous satellite missions, including Landsat and Sentinel, have provided invaluable insights into Earth observations, particularly for monitoring the condition of mangrove forests. Nguyen et al. employed Landsat and Sentinel imagery to map the extent of mangroves in Vietnam using a comparative analysis of unsupervised and supervised classification methods. Their results revealed that the highest overall accuracy (90.00%) was attained by employing Sentinel-2A images with a maximum-likelihood supervised classification method [10]. Manna and Raychaudhuri explored Sentinel-2 imagery to identify mangrove species and physiological conditions by integrating the Discriminant Normalized Vegetation index (DNVI) in the Sundarban mangroves [11]. The study underscored the effectiveness of Sentinel-2 coupled with its proposed spectral index, DNVI, achieving an impressive overall accuracy of 93.90% through a support vector machine-supervised classification approach. The research conducted by Zeng and Takeuchi demonstrated the performance of the integrated Advanced Land Observing Satellite (ALOS), Phased Array-type L-band Synthetic Aperture Radar 2 (PALSAR-2) and Landsat imagery to assess mangrove dynamics in China [12]. Some studies [13,14] have applied very high-resolution images such as World View-3, IKONOS and Unmanned Aerial Vehicle (UAV) images, and active light detection and ranging (LiDAR) data to improve the classification accuracy in mangrove species-level identification. However, the use of LiDAR data and UAV images for acquiring information about large-scale mangrove zones is relatively limited, and VHR images incur high financial costs. The resultant accuracy of mangrove classification varies based on the type of remote sensing data and the classification method employed, reflecting the benefits and drawbacks associated with different approaches [13,14].
Regarding classification methods, studies have explored LULC classification using both unsupervised and supervised approaches with different satellite images [15,16]. Currently, the application of machine and deep learning in LULC classification has proven to perform better than conventional approaches [17,18,19,20,21]. Unlike traditional machine learning classification methods, deep learning models exhibit the unique ability to automatically extract features and learn complex patterns from input features, thereby alleviating the necessity for extensive variable training. Numerous studies have demonstrated the superior performance of deep learning models over traditional ML methods in remote sensing applications [22,23,24]. Among state-of-the-art models, the U-Net segmentation model and artificial neural networks (ANNs) have consistently demonstrated superior performance in remote sensing image analysis [25,26,27]. However, limited studies have applied the U-Net and ANN models using different spatial resolution of satellite images for mangrove ecosystem [28,29,30]. Moreover, their research focused only on mangrove and non-mangrove classifications to highlight the distribution and dynamics of mangroves. Consequently, there is still a need to deploy U-Net and ANN models with various satellite images for LULC classification of an intricate mangrove ecosystem.
Despite the limitations of remote sensing technology, the mangrove community itself thrives in the intricate ecosystem of the intertidal zone of tropical and subtropical coastlines. Consequently, LULC classification in mangrove regions encounters unique challenges, such as spectral confusion between similar classes of mangrove status and other land use types. Therefore, the contribution of accurate information to LULC classification of mangrove ecosystems remains challenging. Furthermore, this study explored the integration of differences of Digital Elevation Models to leverage model performance in complex areas where mangrove and non-mangrove forests are mixed. The advent of Plant Scope imagery with 3 m resolution enables researchers to better understand and detail the acquisition of mangrove ecosystems for multiclass LULC classification. Through the Research and Education Program offered by PlanetScope, this study was granted access to high-resolution PlanetScope imagery with 3 m resolution for LULC classification in the Wunbaik Mangrove region in Myanmar. It is worth examining the performance of DL models using different satellite images for the LULC classification of an intricate mangrove ecosystem.
The Wunbaik Mangrove Area (WMA) is one of the largest remnant mangrove biomes endowed with diverse mangrove species and provides invaluable ecosystem services to local communities in Myanmar. Owing to the rapid population explosion, low income, and scarcity of electricity, local people are highly dependent on mangrove forests for their fuelwood. Large areas of mangrove forests are cleared for main livelihoods, including shrimp ponds and paddy fields [31,32]. Being inaccessible and the least developed region in Myanmar, the Wunbaik Mangrove Forest is not well managed by officials, despite being an impressive natural mangrove area. Although mangrove restoration projects have been implemented by the Forest Department, few studies have been conducted to provide reliable information on the mangrove conservation of the WMA. A project report by the Food and Agricultural Organization in 2011 [31] has investigated the LULC classification of the Wunbaik Reserved Mangrove Forest (WRMF), a reserved forest. The doctoral research by Saw [33] investigated mangrove dynamics in the WRMF using Landsat images from 1990 to 2014. However, they only employed traditional classification approaches using medium-resolution satellite images. In 2020, Maung and Sasaki applied an ANN model with 10 m resolution Sentinel-2 imagery to detect the natural recovery of mangrove forests in the WMF, but their focus was also on mangrove and non-mangrove identification [34]. Therefore, there is a prominent research gap in updating the LULC information for such massive mangrove areas. In addition, it is challenging to determine how state-of-the-art deep learning models can accurately distinguish LULC classes in an intricate mangrove ecosystem.
Based on the detailed literature review above, this study aimed to (1) compare U-Net and ANN models using PlanetScope and Sentinel-2 images for LULC classification in a complex mangrove ecosystem and (2) contribute accurate and up-to-date LULC information to mangrove management regimes for Wunbaik Mangrove conservation. Furthermore, we explored the integration of topographic and canopy height information to improve the classification accuracy. By fulfilling these research objectives, the proposed method can improve the performance of multiclass LULC classification in an intricate mangrove environment.

2. Materials and Methods

2.1. Study Area

Wunbaik Mangrove Area (WMA) is one of large remnant mangrove assets covering a land area of about 55,000 ha, which is located between 19°05′00′′N–19°25′00′′N and 93°50′00′′E–94°05′00′′E in Rakhine State, Myanmar (Figure 1). Most mangrove forests in the study area have been reserved as forest areas under management by the Forest Department since 1931: Main Wunbaik Reserved Mangrove Forest (WRMF), Mingyaung Public Mangrove Forest, and Extended Mingyaung Mangrove Forest. According to a Food and Agricultural Organization (FAO) report, 34 mangrove species thrive in mangrove-reserved forests. The study area is endowed with diverse ecosystems of mangrove and non-mangrove forests, with different topographic features ranging from 0 to 95 m. The report of the Myanmar Information Management Unit (MIMU) (https://themimu.info/states_regions/rakhine, accessed on 12 June 2023) in 2019 mentions that temperature of the study area is between 27 °C and 33 °C and annual rainfall is 4860 mm. The main livelihoods of local people in the study area are rice production and shrimp pond aquaculture.

2.2. Ground Truth Data Collection and Creating a Labeled Image

To create a robust deep learning model, training the model with accurately labeled data is necessary and challenging. Some studies have employed existing globally labeled datasets, but considering the unique characteristics of the mangrove ecosystem in our study region, we created a field-based fully labeled image for the classification. We conducted a field survey of ground-truth data collection for model training from 2 to 28 May 2023. Due to the diverse ecosystems and local livelihoods depending on the mangrove area, the study area contains various land use and land cover types, as shown in Figure 2. We used a handheld GARMIN GPS with 3 m accuracy, which is suitable for collecting land cover data. A total of 224 GPS points were recorded with latitude, longitude, and LULC information (Table 1) and then imported them into ArcGIS Pro 3.2.1 version for double checking using very high-resolution Google Earth and PlanetScope images.
To minimize the potential for misinterpretation, which is occasionally encountered in the conventional manual annotation of multiple LULC classes, we initially applied the ISODATA approach to the QGIS acquired on 12 February 2023, which was not used for model training [25,35]. Based on 224 Field GPS points and very high-resolution Google Earth and Planet Scope Dove images, the ISODATA output image was manually corrected using a raster editor tool in QGIS (QGIS Development Team (2009); Open-Source Geospatial Foundation Project, http://qgis.osgeo.org, accessed on 10 June 2023). We also referred to a classified image with 95% accuracy for mangrove and non-mangrove areas in 2020, which was provided by Maung and Sasaki [34]. Following careful visualization and validation by field experts, a reliable and accurately labeled image with seven LULC classes was obtained for training deep learning models.

2.3. Earth Observation Data

2.3.1. Satellite Band and Spectral Indices

This study mainly used two different satellite images of Planet Scope images with 3 m resolution and Sentinel-2 images with 10 m resolution. Planet launches an incredible support of education and research program, by which we could access very high-resolution PlanetScope images for our study area. Orthorectified and atmospherically corrected images were downloaded from the Planet portal. Sentinel-2 level 2A products were collected from the Copernicus Open Access Hub using the semi-automatic Classification Plugin (SCP) tool in the QGIS 3.8 version. Level 2A products have provided atmospherically corrected Surface Reflectance images since December 2018. Sentinel-2 provides 13 bands with resolutions of 10, 20, and 60 m. Our study specifically utilized RGB and NIR bands with a 10 m resolution. To ensure consistency in spatial resolution, these bands were resampled to match the 3 m resolution of the PlanetScope bands; more detailed information is reported in Table 2.
We also used two popular and effective spectral indices, NDVI and NDWI, derived from the preprocessed spectral bands of Planet Scope and Sentinel-2. NDVI was calculated from Red and Near-infrared (NIR) bands, while NDWI was created from Green and NIR bands, which are available in both satellite images, using Equations (1) and (2), respectively [36,37]. The NDWI with a visible green band and NIR can be used to distinguish mangroves from water bodies because of their sensitivity to vegetation [37].
NDVI   = NIR RED NIR + RED
NDWI   = GREEN NIR GREEN + NIR

2.3.2. Topographic and Canopy Height Information

Integration of topographic and canopy height information has been explored to show accuracy improvement in LULC classification [38,39,40,41]. This study exhibited Multi-Error-Removed-Improved-Terrain (MERIT) (https://hydro.iis.u-tokyo.ac.jp/~yamadai/MERIT_DEM/, accessed on 20 January 2020) and Global Canopy Height Model (GCHM) datasets (https://langnico.github.io/globalcanopyheight/, accessed on 17 July 2023) with the aim of leveraging classification accuracy in distinguishing mangrove and non-mangrove forest in a mixed ecosystem of the large study area. To the best of our knowledge, this study is the first attempt to use the GCHM as an input feature for the LULC classification of mangrove ecosystems. The mangrove forests in our study area thrive in specific topographic niches, which are flat and low-lying inland coastal regions. The MERIT DEM and GCHM can help highlight these topographic features and tree height information, making it easier to distinguish mangrove habitats from non-mangrove forests in mountainous regions. Yamazaki et al. improved the MERIT DEM by removing the vertical error from SRTM 3 arc (90 m resolution) imagery [42]. This information is accessible free of charge on the MERIT_DEM website. Lang et al. developed a GCHM by fusing the Global Ecosystem Dynamic Investigation (GEDI) space-borne LiDAR mission and Sentinel-2 imagery [43,44]. The GCHM dataset is available on the Google Earth Engine with a spatial resolution of 10 m. We then resampled MERIT and GCHM to a 3 m spatial resolution using the Nearest Neighbor approach to align them with other spectral information.

2.4. Deep Learning Models for LULC Classification

2.4.1. U-Net Model

The U-Net architecture proposed by Ronneberger et al. [45] is a deep learning model that has gained significant attention because of its exceptional performance in biomedical image segmentation tasks. With a unique U-shaped design, the U-Net architecture consists of an encoder and a decoder, facilitating the extraction of features and reconstruction of high-resolution segmentation maps using skip connections. Through hyperparameter tuning, we designed a U-Net architecture suitable for LULC classification (Figure 3). In the proposed U-Net design, the encoder processes the input features from 128 × 128 × 8 image patches. Using 3 × 3 2D convolutional layers with activation functions, hierarchical features were iteratively extracted, and the feature depth was progressively enhanced. To control the spatial dimensions and establish a contracting path that formed an efficient encoder for capturing contextual information, 2 × 2 max pooling layers were employed. In the bottleneck stage, the encoder converges to a central bottleneck using augmented filters, thereby capturing the most abstract features from the input data.
The decoder, forming the expansive path, begins with 2 × 2 and 3 × 3 Conv2DTranspose upsampling layers to restore spatial resolution and reconstruct fine-grained details. Simultaneously, skip connections are established through concatenation, preserving low-level details and enabling seamless information transfer between paths. The conclusive layer generates the output, which is aligned with the input dimensions. The output layer mirrors the spatial dimensions of the input image, with each pixel predicting the LULC class for the corresponding region.

2.4.2. ANN Model

The ANN model was inspired by the design of a biological neural network of the human brain with a multilayer perceptron of input, hidden, and output layers [46]. In each layer, the nodes are interconnected to receive information, analyze it, and produce data. Referring to the basic ANN architecture, we developed the proposed deep neural network design with one input layer with eight variables, three hidden layers with 256,125, and 64 nodes, and one output layer with seven LULC classes, as shown in Figure 4.
In both the U-net and ANN architectures, we employed an Exponential Linear Unit (ELU) in each layer as an activation function to analyze the features transferred from the input layer, as shown in Equation (3): ELU have shown faster and more precise learning in deep neural network computations than the commonly used Rectified Linear Unit (ReLU) [47]. Studies have already demonstrated the superior performance of ELU over ReLU through experimental analyses [48,49] and have effectively applied ELU in deep-learning segmentation tasks [50,51,52]. The softmax activation function was applied to the output layer to produce seven probabilistic LULC classes (Equation (4)).
f y = y               i f     y > 0 exp y 1     i f   y   0
f y = exp y i exp y j

2.4.3. Assessment of Model Performance

Using a separate testing dataset, the performances of the models were evaluated using different metrics: overall accuracy (OA), IoU, F1 score, precision, and recall. First, we created a confusion matrix to provide a better understanding of the matching of the prediction results with the labeled data in each class. OA is one of the most widely used measures in LULC classification, showing the percentage of classification accuracy [53]. It was calculated based on the proportion of correctly classified pixels to the total number of pixels using Equation (5). A higher OA represents a better overall classification performance, but it sometimes leads to misleading results in an imbalanced dataset. Therefore, we employed other IoU metrics: F1 score, precision, and recall.
The IoU is used when the classes are imbalanced in a dataset. It measures the overlap between the predicted class and true class by calculating the ratio of intersection of the predicted and true classes to their union (Equation (6)) [54]. The F1 score is described as the harmonic mean of the precision and recall, and its value ranges from 0 to 1, indicating that higher F1 scores represent better classification results (Equation (7)). Precision is also expressed as the ratio of correctly classified positive classes to the total number of true and false positive classes, whereas recall focuses on the total number of true positive and false negative classes, as shown in Equations (8) and (9)) [55].
OA   = Number   of   correct   prediction Total   number   of   prediction
IoU   = True   postive True   positive + False   positive   + False   negative
F 1 = 2 × Precision × Recall Precision + Recall
Precision   = True   positive True   positive + False   positive
Recall = True   positive True   positive + False   negative

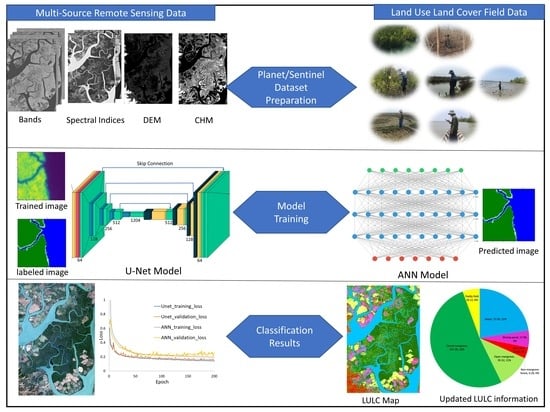
2.5. LULC Classification Workflow

The main workflow of this study is illustrated in the flowchart shown in Figure 5. First, we acquired the necessary remote sensing data, as mentioned in Section 2.3. During the pre-processing stage, the images were mosaiced, and the study area was extracted from each image. All data were resampled to a 3 m resolution based on PlantScope imagery using the Nearest Neighborhood resampling approach. We then created two main datasets, PlanetScope and Sentinel-2, each integrated with their spectral indices, DEM, and GCHM data. The following processes were performed separately for the Planet and Sentinel-2 datasets.
All remote sensing images were sliced into 128 × 128 patches. A total of 3700 images with 128 × 128 patches were created and aligned with the same number of labeled images encoding seven classes of LULC information. Sliced remote sensing images with 128 × 128 patches were concatenated into a dataset of 128 × 128 × 8 patches. We then split the datasets into a 75% training dataset with 2389 images and 15% for validation with 500 images. The remaining 10% of the 388 images were reserved as the testing dataset to evaluate the performance of the models. Our proposed U-Net and ANN models are then trained in 200 epochs and accessed using TensorFlow version 2.1.5 in python 3.10 on the Wisteria/BDEC-01 supercomputer system of the University of Tokyo.

3. Results

In this study, LULC classification was explored using the U-Net and ANN models with two different datasets: Planet Scope and Sentinel-2. Each dataset was also combined with DEM and GCHM data to leverage the classification performance. The models were trained using a training dataset and evaluated using a testing dataset to compare their performances for complex LULC classes in the Wunbaik Mangrove Area.

3.1. Model Performance with PlanetScope Imagery

Using the RGB and NIR bands of Planet Scope, NDVI, NDWI, DEM, and GCHM, both U-Net and ANN models demonstrated promising results in classifying various LULC categories. The U-Net model exhibits an overall accuracy (OA) of 94.88% for the training dataset and 94.05% for the testing dataset. The U-Net model also produced an Intersection over Union (IoU) of 0.82, and average values of precision, recall, and F1 score of 0.94. The ANN model, on the other hand, achieved an OA of 93.61% with the training dataset and 92.82% when the test dataset was predicted, with an IoU of 0.79, an F1 score of 0.93, a precision of 0.94 and a recall of 0.93.
We also investigated all matrices in each class to analyze the model performance in each LULC category in detail. The results showed that both the U-Net and ANN models classified water, open mangrove, and closed mangrove areas with the highest scores in all metrics. The U-Net consistently outperformed the ANN in most LULC classes. However, notable strengths of the ANN model were observed in some classes, which are in bold in Table 3. Both models identified bare land with the lowest scores in most matrices among other classes. In the context of non-mangrove classes, which represent the smallest portion within the dataset, U-Net demonstrated a relatively strong performance in distinguishing them from mangroves, whereas ANN exhibited notably lower scores for this specific task, except for the precision score. In our study area, the paddy fields had a shape similar to shrimp ponds and similar spectral information to that of bare land during the post-harvest season. U-Net, however, could extract paddy fields from confusing classes with slightly higher IoU and F1 scores compared to the ANN’s performance. The images classified by each model were randomly extracted, and their differences are shown with the labeled images in Figure 6.

3.2. Model Performance with Sentinel-2 Imagery

We also employed U-Net and ANN on the Sentinel-2 dataset, including the same spectral bands, indices, DEM, and GCHM. The U-Net model exhibited a higher OA of 98.15% in the training phase; however, the accuracy decreased up to 86.94% for the testing datasets. However, the ANN model showed steady performance, resulting in 82.03% and 82.08% performance on both the training and testing datasets, respectively. A mean IoU of 0.71 and an average value of 0.87 for the F1 score, precision, and recall were obtained with the U-Net model. In sharp contrast, the ANN model classified LULC classes with lower scores: mean IoU, 0.63; average F1 score, 0.81; precision, 0.81; and recall, 0.82. With a detailed analysis of each class, the U-Net model outperformed the ANN model, with higher scores, except for IoU, recall of shrimp ponds, and recall of closed mangroves highlighted in bold in Table 4. The results indicated that when utilizing the Sentinel-2 dataset, the models demonstrated lower overall performance scores than when using the PlanetScope dataset. However, they exhibited slightly higher precision and recall scores for shrimp pond classifications. Both models produced unsatisfactory results for the bare land and open mangrove classes, whereas a higher performance was achieved when applying the PlanetScope dataset. The models exhibited noticeable and steady scores in identifying paddy fields using both datasets. The differences in classification are shown with the labeled images in Figure 7.

3.3. LULC Classification Map for the Whole Study Area

After evaluating the models with different RS datasets, they were applied to produce an LULC map of the Wunbaik Mangrove Area. The LULC maps of the entire study area were visualized using ArcGIS Pro by comparing true color images and labeled ground truth images (Figure 8). The results showed that the LULC map produced by U-Net with Planet Scope had a strong correspondence with the labeled ground truth images in all classes. However, despite the promising scores in the training and testing phases, the ANN model misclassified bare land in most paddy field areas.
We also exported and visually analyzed the LULC classification maps from the predictions of the U-Net and ANN models using the Sentinel-2 dataset. Using Sentinel-2 data, the U-Net model produced a classification map that was as accurate as the U-Net model using Planet Scope. However, there was some noise and misclassified pixels when identifying bare land in non-mangrove areas. In addition, both the U-Net and ANN models misclassified bare land areas and open mangroves with unsatisfactory results. Similarly, using the PlanetScope data, the ANN model could not distinguish between bare land and paddy fields.

3.4. Estimating LULC Area for Wunbaik Mangrove Forest Managment

Because the U-Net model with Planet Scope produced the highest scores in all metrics and predicted a promising classification map, we calculated LULC areas using the U-Net prediction model. According to our prediction result, closed and open mangrove area cover 187.5 km2 and 57.00 km2 while water body cover 149.96 km2 in our study area. As our study area is a complex ecosystem, we also identified 15.15 km2 of non-mangrove forests. Our model detected 44.89 km2 of shrimp ponds and 45.36 km2 of paddy fields, which are the main livelihoods of nearby local communities (Table 5).
With the aim of contributing up-to-date LULC information to sustainable mangrove forest management in the Wunbaik area, we extracted used (WRMF) data from the whole classification map (Figure 9). According to our classification results for 2023, the WRM comprises 167.38 km2 of closed mangrove, 35.52 km2 of open mangroves, and 72.43 km2 of water bodies. Although there was a small portion of non-mangrove forests on small mounds inside the WRM, we mainly focused on mangrove forest management. Despite the large portion of remnant mangrove, due to human disturbances and their effects, we also detected 20.45 km2 of shrimp pond, 17.77 km2 of paddy fields, and 9.41 km2 of bare land.

4. Discussion

For the effective management of mangrove areas, comprehensive LULC information is pivotal for systematic planning and successful restoration programs. This study conducted an LULC classification of an intricate ecosystem by comparing two deep learning models, U-Net and ANN, with confusing classes such as closed and open mangroves, non-mangrove forests, shrimp ponds, paddy fields, bare land, and water bodies.

4.1. Complexity of Land Use Compared to Land Cover

Some studies have shown promising results in binary classification in which mangrove are distinguished from non-mangrove classes such as water, human settlement, and agricultural field [28,29]. However, this study identified multiple classes of intricate mangrove regions that contributed detailed LULC information for the management of mangroves. In the LULC classification of mangrove regions, it is straightforward to classify a binary class, such as mangrove and non-mangrove, or simple land cover classes, such as mangrove, water, and bare land. However, the complexity of different land uses and cover types makes the classification process challenging when land use is considered. As a complicated land use system in our study area, the integration of shrimp ponds and paddy fields requires more attention when selecting the classification methods and RS datasets. For instance, shrimp ponds are a type of land use but it possesses water and bare land as land cover. Shrimp pond areas are sometimes inundated during high tide and have similar spectral information as water, while being confused with bare land during low tide. Similarly, the land use and paddy fields after harvesting confused the models with bare land. Zabaar et al. employed CNN models and compared them with different machine learning algorithms using Pléiades VHSR and Sentinel-2A for multiclass LULC mapping of the Ain Témouchent coastal area situated in western Algeria. Their results showed that the CNN model outperformed them with a higher OA of 93.5% for Pléiades data and 83.4% for Sentinel-2A data [56]. Alteraz et al. also demonstrated the superior performance of U-Net with Sentinel 1 and 2 fusion in multiclass LULC classification compared with other machine learning models [57]. Therefore, the LULC classification of multiple classes with similar land covers could lead to misclassification when using traditional approaches. However, the U-Net model, using PlanetScope with topographic and canopy height information, produced better performance for the intricate coastal land use system in our study.
Due to an imbalanced class distribution in this research, the water and closed mangrove classes represented over half of the dataset, while other classes represented less than 10 percent of the study area (Figure 10). Therefore, the U-Net and ANN models produced noticeably higher scores than the other classes for both datasets. Considering the non-mangrove forest class with the smallest portion of the dataset, the proposed U-Net model outperformed both PlanetScope and Sentinel-2 datasets. In the case of bare land, which was the second smallest portion, the ANN model overpredicted the PlanetScope dataset, whereas the model could not be identified in most areas, particularly inside the mangrove forest with the Sentinel-2 dataset.

4.2. Integration of DEM and CHM

Paying attention to non-mangrove forested areas have similar spectral information to mangroves despite ecological differences. Scholars have also developed mangrove-specific vegetation indices, such as the Combined Mangrove Recognition Index (CMRI) [58] the Enhanced Mangrove Vegetation Index (EMVI) [59], to distinguish mangroves from other forest types. Paying careful attention to the ecological conditions of the study area, we applied DEM and CHM instead of using additional indices. According to our fieldwork, non-mangrove forests grow in terrestrial regions with higher elevations than mangrove regions. Canopy height information derived from Unmanned Aerial Vehicle (UAV) images, light detection, and airborne radar (Lidar) data has been applied as a complementary feature in mangrove classification of specific and small areas. The integration of DEM improved the distinction between these two forest types, whereas CHM provided more information for the case of forested and non-forested classes. Maung and Sasaki [34] introduced a Canopy Height Model derived from SRTM and MERIT DEMs to identify mangrove distribution in the Wunbaik mangrove region. Their experimental research highlighted that using differences of SRTM and MERIT DEMs improved the accuracy compared to CMRI in mangrove regions. However, they also considered the binary classification of mangroves and non-mangroves using only an ANN model and Sentinel-2 imagery for intricate coastal ecosystems. Considering seven LULC classes in the same study area, we explored the U-Net segmentation model and high-resolution PlanetScope imagery and compared them with the ANN and Sentinel-2 image used in the binary classification of Maung and Sasaki’s previous study. Our results show that U-Net was impressively classified using the PlanetScope dataset, whereas the ANN model produced some misclassifications between paddy fields and bare land, as shown in Figure 8.

4.3. Model Performance and Labeled Data Requirement

The deep learning models proposed in our study were trained using the training and validation datasets separately with the same hyperparameters and input shapes of 128 × 128 × 8. The models were monitored during the learning phase using a validation dataset. As shown in Figure 11, the U-Net learned well with PlanetScope dataset, which means no significance difference between the training and validating loss. When the U-Net model was introduced to the Sentinel-2 dataset, there was overfitting with different trends of training and validation losses after 25 epochs of learning phases. However, the ANN model significantly reduced the loss during early epochs in both datasets and, also, a remarkable loss reduction occurred when using PlanetScope as compared to the Sentinel-2 dataset. The overfitting problem of the U-Net model with Sentinel-2 dataset was considered a reason for the resampling approach of Sentinel-2 from 10 m to 3 m. Being a segmentation model, U-Net is sensitive for spatial information of a dataset. In response to these overfitting challenges, the fusion of PlanetScope and Sentinel-2 data was not considered in our analysis, as the U-Net model with the Planet dataset had already yielded satisfactory results in improving LULC information. In our future studies, we are aiming to explore various state of the art deep learning approaches to compare with our proposed method.
Aside from the overfitting, a notable discrepancy in the spatial resolution between the U-Net and ANN-predicted images occurred when utilizing the Sentinel dataset, as shown in Figure 7. This discrepancy can be attributed to the resampling process applied to the Sentinel images, which affected all corresponding predictions. This assumption finds support in the ANN-predicted image of the PlanetScope dataset, illustrated in Figure 6, which maintains its original 3 m resolution. In contrast, the U-Net model demonstrated a notable ability to preserve fine spatial details in both datasets, which were closely aligned with the resolution of the labeled images. Leveraging its semantic segmentation approach and skip connections, U-Net showcased superior performance in terms of both classification accuracy and spatial resolution of the predicted images. However, it is worth trying original spatial resolution or different resampling approaches for the Sentinel-2 imagery in future research. Through a detailed quantitative and qualitative assessment of the model learning and prediction, we assumed that the U-Net model with PlanetScope bands, NDVI, NDWI, MERIT DEM, and GCHM, is the best candidates for the LULC classification of the Wunbaik Mangrove Area.
Semantic segmentation models such as U-Net are pivotal for accurately categorizing objects in images, particularly in remote sensing, where access to fully labeled images is common. With full labels, the model can capture intricate patterns, leading to a more precise and nuanced segmentation. By contrast, partial labels may hinder the model’s ability to distinguish between similar classes or subtle distinctions. However, it is important to acknowledge the challenge of acquiring substantial amounts of labeled data, which is resource intensive and time consuming. In some cases, partially labeled datasets may be more practical, and exploring techniques such as semi-supervised learning or active learning can optimize the labeling resources. Marsocci and Scardapane investigated continual self-supervised learning for remote sensing semantic segmentation by employing heterogeneous remote sensing sensors, resolutions, acquisitions, and scenes with varying levels of labeled data (10%, 50%, and 100%) [60]. Their findings revealed that the proposed model, Continual Barlow Twins (CBTs), achieved satisfactory IoU scores with 10% and 50% partially labeled images from the US3D dataset derived from the WorldView 3 satellite, whereas using a 100% labeled dataset produced the highest IoU score. To address the challenge of labeled data dependence in remote sensing image semantic segmentation, Li et al. introduced a semi-supervised segmentation network called SegMind, tested with partially labeled datasets (5%, 10%, and 20%) [61]. Their experimental results demonstrated competitive IoU scores compared with other state-of-the-art deep learning models. Saha et al. conducted unsupervised single-scene segmentation with different input datasets and no labeled data [62]. Their proposed method outperformed other models, despite low metric scores and limitations in segmenting small classes. Given the rapid developments in computer science and remote sensing applications, it is essential to consider both model performance and resource effectiveness in future studies.

4.4. Challenges and Opportunities of Sustainable Wunbaik Mangrove Mangement

To better manage mangrove forests, other land use information from a reliable LULC map needs to be considered. Some researchers have explored mangrove mapping on a global and large scale to better understand mangrove distribution and dynamic changes as the foundation of international collaboration [63]. Detailed, accurate, and up-to-date regional information is of utmost importance when considering practical strategies for implementing regional mangrove restoration projects. Despite a massive remnant mangrove track, the Wunbaik Mangrove Area is also facing human disturbances such as the extension of shrimp ponds and paddy fields, and illegal firewood extraction due to growth in population with low income and lack of job opportunities. Over the years, conversion into shrimp ponds and paddy fields has led to mangrove deforestation, whereas overexploitation of fuelwood has downgraded the mangrove status. Other studies have also pointed out mangrove loss in Wunbaik due to human disturbances, such as shrimp ponds and agricultural expansion, except for mangrove plantation, but there are no particular programs in which local communities can participate in mangrove restoration projects [34]. According to our LULC map, shrimp ponds and paddy fields still exist, even in the Wunbaik Reserved Mangrove Forest. Being a vulnerable mangrove area due to many interactions with local livelihoods, it would be impossible to implement mangrove restoration programs without the active participation of local people. Therefore, based on our findings of LULC information, we would recommend mangrove projects, such as community forestry, mangrove-friendly aquaculture systems other than plantations, and the constitution of reserved forests. In pursuit of a long-term mangrove management strategy for the Wunbaik Reserved Forest, policymakers, conservationists, and local communities can leverage the LULC information to formulate a collective land use policy across all government sectors. The insights derived from our LULC information lay the groundwork for a comprehensive forest management plan, in which the creation of buffer zones between existing mangrove areas and anthropogenically disturbed zones is recommended to curtail the expansion of shrimp ponds and paddy fields. With the goal of mitigating the impact of climate change, our accurate and up-to-date LULC data serve as a benchmark for estimating mangrove carbon sequestration, thereby contributing to improved accuracy of global carbon accounting efforts.

5. Conclusions

This study provides reliable and up-to-date LULC information for an intricate mangrove ecosystem using the U-Net model in conjunction with multisource remote sensing datasets of PlanetScope, Sentinel-2, MERIT DEM, and Global Canopy Height Model. Through different scenarios of the U-Net and ANN models using different dataset combinations, the U-Net model using PlanetScope, topography, and canopy height information achieved the highest OA (94.05%), IoU (0.82), and a mean F1 score, recall, and precision of 0.94. Our proposed model could predict LULC classes in the entire study area and produce an accurate LULC map for the mangrove management regime. According to the LULC results, Wunbaik Reserved Mangrove Forest is endowed with varying states of closed and open mangroves. However, disturbances due to human activities in shrimp ponds and paddy fields are still occurring in reserved forests, thereby altering for the need of conservation. To safeguard this remnant mangrove area, immediate attention should be paid to restoration approaches in which local communities can participate under expert guidance. In summary, our study not only proposes a promising classification method but also an urgent call for conservation measures for this unique mangrove ecosystem.

Author Contributions

Conceptualization, methodology, W.S.M., S.T. and Z.G.; data curation, formal analysis, and writing—original draft preparation, W.S.M.; project administration, and funding acquisition, S.T.; writing—review and editing, supervision, Conceptualization, S.T. and Z.G. All authors have read and agreed to the published version of the manuscript.

Funding

This research received no external funding.

Data Availability Statement

The remote sensing data used in this study are available on their websites as mentioned in the related section. Other data presented in the study are available on request from the first author.

Acknowledgments

We express our sincere thanks to Planet (https://www.planet.com/, accessed on 20 April 2022) for granting us access to the high-resolution PlanetScope imagery through the Education and Research Program. Deep learning analysis was performed using the supercomputer resources of International Technological Center (ITC) supercomputer, the University of Tokyo. The authors would like to express their gratitude to the anonymous reviewers for their insightful comments and suggestions to improve the quality of this article.

Conflicts of Interest

The authors declare no conflicts of interest.

References

  1. Brander, L.M.; Wagtendonk, A.J.; Hussain, S.S.; McVittie, A.; Verburg, P.H.; de Groot, R.S.; van der Ploeg, S. Ecosystem service values for mangroves in Southeast Asia: A meta-analysis and value transfer application. Ecosyst. Serv. 2012, 1, 62–69. [Google Scholar] [CrossRef]
  2. Hawkins, S.J.; Evans, A.J.; Dale, A.C.; Firth, L.B.; Hughes, D.J.; Smith, I.P. Ecosystem Services and Disservices of Mangrove Forests and Salt Marshes. In Oceanography and Marine Biology; Taylor & Francis: Hoboken, NJ, USA, 2017; Volume 55, ISBN 9781351987592. [Google Scholar]
  3. Richards, D.R.; Friess, D.A. Rates and drivers of mangrove deforestation in Southeast Asia, 2000–2012. Proc. Natl. Acad. Sci. USA 2016, 113, 344–349. [Google Scholar] [CrossRef] [PubMed]
  4. Friess, D.A.; Rogers, K.; Lovelock, C.E.; Krauss, K.W.; Hamilton, S.E.; Lee, S.Y.; Lucas, R.; Primavera, J.; Rajkaran, A.; Shi, S. The State of the World’s Mangrove Forests: Past, Present, and Future. Annu. Rev. Environ. Resour. 2019, 44, 89–115. [Google Scholar] [CrossRef]
  5. Awuku-Sowah, E.M.; Graham, N.A.J.; Watson, N.M. Investigating mangrove-human health relationships: A review of recently reported physiological benefits. Dialogues Health 2022, 1, 100059. [Google Scholar] [CrossRef]
  6. Chen, R.; Yang, H.; Yang, G.; Liu, Y.; Zhang, C.; Long, H.; Xu, H.; Meng, Y.; Feng, H. Land-Use Mapping with Multi-Temporal Sentinel Images Based on Google Earth Engine in Southern Xinjiang Uygur Autonomous Region, China. Remote Sens. 2023, 15, 3958. [Google Scholar] [CrossRef]
  7. Wang, L.; Jia, M.; Yin, D.; Tian, J. A review of remote sensing for mangrove forests: 1956–2018. Remote Sens. Environ. 2019, 231, 111223. [Google Scholar] [CrossRef]
  8. Pham, T.; Yokoya, N.; Yoshino, K.; Bui, D.; Friess, D. Remote Sensing Approaches for Monitoring Mangrove Species, Structure, and Biomass: Opportunities and Challenges. Remote Sens. 2019, 11, 230. [Google Scholar] [CrossRef]
  9. Giri, C. Recent advancement in mangrove forests mapping and monitoring of the world using earth observation satellite data. Remote Sens. 2021, 13, 563. [Google Scholar] [CrossRef]
  10. Nguyen, H.H.; Nghia, N.H.; Nguyen, H.T.T.; Le, A.T.; Tran, L.T.N.; Duong, L.V.K.; Bohm, S.; Furniss, M.J. Classification methods for mapping mangrove extents and drivers of change in Thanh Hoa province, Vietnam during 2005–2018. For. Soc. 2020, 4, 225–242. [Google Scholar] [CrossRef]
  11. Manna, S.; Raychaudhuri, B. Mapping distribution of Sundarban mangroves using Sentinel-2 data and new spectral metric for detecting their health condition. Geocarto Int. 2020, 35, 434–452. [Google Scholar] [CrossRef]
  12. Zheng, Y.; Takeuchi, W. Quantitative assessment and driving force analysis of mangrove forest changes in china from 1985 to 2018 by integrating optical and radar imagery. ISPRS Int. J. Geo-Inf. 2020, 9, 513. [Google Scholar] [CrossRef]
  13. Lu, D.; Weng, Q. A survey of image classification methods and techniques for improving classification performance. Int. J. Remote Sens. 2007, 28, 823–870. [Google Scholar] [CrossRef]
  14. Thakur, S.; Mondal, I.; Ghosh, P.B.; Das, P.; De, T.K. A review of the application of multispectral remote sensing in the study of mangrove ecosystems with special emphasis on image processing techniques. Spat. Inf. Res. 2020, 28, 39–51. [Google Scholar] [CrossRef]
  15. Green, E.P.; Clark, C.D.; Mumby, P.J.; Edwards, A.J.; Ellis, A.C. Remote sensing techniques for mangrove mapping. Int. J. Remote Sens. 1998, 19, 935–956. [Google Scholar] [CrossRef]
  16. Ahmad, A.; Quegan, S. Comparative analysis of supervised and unsupervised classification on multispectral data. Appl. Math. Sci. 2013, 7, 3681–3694. [Google Scholar] [CrossRef]
  17. Toosi, N.B.; Soffianian, A.R.; Fakheran, S.; Pourmanafi, S.; Ginzler, C.; Waser, L.T. Comparing different classification algorithms for monitoring mangrove cover changes in southern Iran. Glob. Ecol. Conserv. 2019, 19, e00662. [Google Scholar] [CrossRef]
  18. Ge, G.; Shi, Z.; Zhu, Y.; Yang, X.; Hao, Y. Land use/cover classification in an arid desert-oasis mosaic landscape of China using remote sensed imagery: Performance assessment of four machine learning algorithms. Glob. Ecol. Conserv. 2020, 22, e00971. [Google Scholar] [CrossRef]
  19. Campomanes, F.; Pada, A.V.; Silapan, J. Mangrove classification using support vector machines and random forest algorithm: A comparative study. In Proceedings of the GEOBIA 2016: Solutions and Synergies, Enschede, The Netherlands, 14–16 September 2016; pp. 2–6. [Google Scholar]
  20. Castelo-Cabay, M.; Piedra-Fernandez, J.A.; Ayala, R. Deep learning for land use and land cover classification from the Ecuadorian Paramo. Int. J. Digit. Earth 2022, 15, 1001–1017. [Google Scholar] [CrossRef]
  21. Han, W.; Zhang, X.; Wang, Y.; Wang, L.; Huang, X.; Li, J.; Wang, S.; Chen, W.; Li, X.; Feng, R.; et al. A survey of machine learning and deep learning in remote sensing of geological environment: Challenges, advances, and opportunities. ISPRS J. Photogramm. Remote Sens. 2023, 202, 87–113. [Google Scholar] [CrossRef]
  22. Zhang, C.; Sargent, I.; Pan, X.; Li, H.; Gardiner, A.; Hare, J.; Atkinson, P.M. Joint Deep Learning for land cover and land use classification. Remote Sens. Environ. 2019, 221, 173–187. [Google Scholar] [CrossRef]
  23. Yuan, Q.; Shen, H.; Li, T.; Li, Z.; Li, S.; Jiang, Y.; Xu, H.; Tan, W.; Yang, Q.; Wang, J.; et al. Deep learning in environmental remote sensing: Achievements and challenges. Remote Sens. Environ. 2020, 241, 111716. [Google Scholar] [CrossRef]
  24. Fan, Z.; Zhan, T.; Gao, Z.; Li, R.; Liu, Y.; Zhang, L.; Jin, Z.; Xu, S. Land Cover Classification of Resources Survey Remote Sensing Images Based on Segmentation Model. IEEE Access 2022, 10, 56267–56281. [Google Scholar] [CrossRef]
  25. Chen, J.; Sasaki, J. Mapping of subtidal and intertidal seagrass meadows via application of the feature pyramid network to unmanned aerial vehicle orthophotos. Remote Sens. 2021, 13, 4880. [Google Scholar] [CrossRef]
  26. Mas, J.F.; Flores, J.J. The application of artificial neural networks to the analysis of remotely sensed data. Int. J. Remote Sens. 2008, 29, 617–663. [Google Scholar] [CrossRef]
  27. Dai, X.L.; Khorram, S. Remotely sensed change detection based on artificial neural networks. Photogramm. Eng. Remote Sens. 1999, 65, 1187–1194. [Google Scholar]
  28. Wei, Y.; Cheng, Y.; Yin, X.; Xu, Q.; Ke, J.; Li, X. Deep Learning-Based Classification of High-Resolution Satellite Images for Mangrove Mapping. Appl. Sci. 2023, 13, 8526. [Google Scholar] [CrossRef]
  29. Islam, M.D.; Di, L.; Mia, M.R.; Sithi, M.S. Deforestation Mapping of Sundarbans Using Multi-Temporal Sentinel-2 Data and Transfer Learning. In Proceedings of the 2022 10th International Conference on Agro-geoinformatics (Agro-Geoinformatics), Quebec City, QC, Canada, 11–14 July 2022; pp. 1–4. [Google Scholar]
  30. Chun, B.B.; Mat Jafri, M.Z.; San, L.H. Comparison of remote sensing approach for mangrove mapping over Penang Island. In Proceedings of the 2012 International Conference on Computer and Communication Engineering, Kuala Lumpur, Malaysia, 3–5 July 2012; pp. 258–262. [Google Scholar]
  31. Stanley, D.O.; Broadhead, J.; Aung Aung, M. The Atlas and Guidelines for Mangrove Management in Wunbaik Reserved Forest; Forest Department; Food and Agriculture Organization of the United Nations FAO-UN: Yangon, Myanmar, 2011; 132p. [Google Scholar]
  32. Saw, A.A.; Kanzaki, M. Local Livelihoods and Encroachment into a Mangrove Forest Reserve: A Case Study of the Wunbaik Reserved Mangrove Forest, Myanmar. Procedia Environ. Sci. 2015, 28, 483–492. [Google Scholar] [CrossRef]
  33. Saw, A.A. Deforestation and Local Livelihood Strategy: A Case of Encroachment into the Wunbaik Reserved Mangrove Forest, Myanmar. Ph.D. Thesis, Kyoto University, Kyoto, Japan, 2017. [Google Scholar]
  34. Maung, W.S.; Sasaki, J. Assessing the natural recovery of mangroves after human disturbance using neural network classification and sentinel-2 imagery in wunbaik mangrove forest, Myanmar. Remote Sens. 2021, 13, 52. [Google Scholar] [CrossRef]
  35. Xu, C.; Wang, J.; Sang, Y.; Li, K.; Liu, J.; Yang, G. An Effective Deep Learning Model for Monitoring Mangroves: A Case Study of the Indus Delta. Remote Sens. 2023, 15, 2220. [Google Scholar] [CrossRef]
  36. Teillet, P.M.; Staenz, K.; Williams, D.J. Effects of spectral, spatial, and radiometric characteristics on remote sensing vegetation indices of forested regions. Remote Sens. Environ. 1997, 61, 139–149. [Google Scholar] [CrossRef]
  37. McFeeters, S.K. The use of the Normalized Difference Water Index (NDWI) in the delineation of open water features. Int. J. Remote Sens. 1996, 17, 1425–1432. [Google Scholar] [CrossRef]
  38. Alsaaideh, B.; Al-Hanbali, A.; Tateishi, R.; Kobayashi, T.; Hoan, N.T. Mangrove Forests Mapping in the Southern Part of Japan Using Landsat ETM+ with DEM. J. Geogr. Inf. Syst. 2013, 5, 369–377. [Google Scholar] [CrossRef]
  39. Eiumnoh, A.; Shrestha, R.P. Application of DEM data to Landsat image classification: Evaluation in a tropical wet-dry landscape of Thailand. Photogramm. Eng. Remote Sens. 2000, 66, 297–304. [Google Scholar]
  40. Alsaaideh, B.; Al-Hanbali, A.; Tateishi, R.; Nguyen Thanh, H. The integration of spectral analyses of Landsat ETM+ with the DEM data for mapping mangrove forests. In Proceedings of the 2011 IEEE International Geoscience and Remote Sensing Symposium, Vancouver, BC, Canada, 24–29 July 2011; pp. 1914–1917. [Google Scholar]
  41. Ou, J.; Tian, Y.; Zhang, Q.; Xie, X.; Zhang, Y.; Tao, J.; Lin, J. Coupling UAV Hyperspectral and LiDAR Data for Mangrove Classification Using XGBoost in China’s Pinglu Canal Estuary. Forests 2023, 14, 1838. [Google Scholar] [CrossRef]
  42. Yamazaki, D.; Ikeshima, D.; Neal, J.C.; O’Loughlin, F.; Sampson, C.C.; Kanae, S.; Bates, P.D. MERIT DEM: A new high-accuracy global digital elevation model and its merit to global hydrodynamic modeling. AGUFM 2017, 2017, H12C-04. [Google Scholar]
  43. Lang, N.; Jetz, W.; Schindler, K.; Wegner, J.D. A high-resolution canopy height model of the Earth. arXiv 2022, arXiv:2204.08322. [Google Scholar] [CrossRef] [PubMed]
  44. Lang, N.; Schindler, K.; Wegner, J.D. Country-wide high-resolution vegetation height mapping with Sentinel-2. Remote Sens. Environ. 2019, 233, 111347. [Google Scholar] [CrossRef]
  45. Ronneberger, O.; Fischer, P.; Brox, T. U-Net: Convolutional Networks for Biomedical Image Segmentation; Lecture Notes in Computer Science; Springer: Cham, Switzerland, 2015; Volume 9351, pp. 234–241. [Google Scholar]
  46. Vanneschi, L.; Silva, S. Artificial Neural Networks. Natural Computing Series. 2023. Available online: https://link.springer.com/chapter/10.1007/978-3-031-17922-8_7 (accessed on 13 November 2023).
  47. Clevert, D.A.; Unterthiner, T.; Hochreiter, S. Fast and accurate deep network learning by exponential linear units (ELUs). In Proceedings of the 4th International Conference on Learning Representations, ICLR 2016, San Juan, Puerto Rico, 2–4 May 2016; pp. 1–14. [Google Scholar]
  48. Cococcioni, M.; Rossi, F.; Ruffaldi, E.; Saponara, S. A Novel Posit-based Fast Approximation of ELU Activation Function for Deep Neural Networks. In Proceedings of the 2020 IEEE International Conference on Smart Computing (SMARTCOMP), Bologna, Italy, 14–17 September 2020; pp. 244–246. [Google Scholar]
  49. Devi, T.; Deepa, N. A novel intervention method for aspect-based emotion Using Exponential Linear Unit (ELU) activation function in a Deep Neural Network. In Proceedings of the 2021 5th International Conference on Intelligent Computing and Control Systems (ICICCS), Madurai, India, 6–8 May 2021; pp. 1671–1675. [Google Scholar]
  50. Zhang, Y.; Wu, J.; Chen, W.; Chen, Y.; Tang, X. Prostate segmentation using z-net. In Proceedings of the 2019 IEEE 16th International Symposium on Biomedical Imaging, Venice, Italy, 8–11 April 2019; pp. 11–14. [Google Scholar]
  51. Pan, X.; Liu, Z.; He, C.; Huang, Q. Modeling urban expansion by integrating a convolutional neural network and a recurrent neural network. Int. J. Appl. Earth Obs. Geoinf. 2022, 112, 102977. [Google Scholar] [CrossRef]
  52. Wang, X.; Jing, S.; Dai, H.; Shi, A. High-resolution remote sensing images semantic segmentation using improved UNet and SegNet. Comput. Electr. Eng. 2023, 108, 108734. [Google Scholar] [CrossRef]
  53. Rwanga, S.S.; Ndambuki, J.M. Accuracy Assessment of Land Use/Land Cover Classification Using Remote Sensing and GIS. Int. J. Geosci. 2017, 8, 611–622. [Google Scholar] [CrossRef]
  54. Van Beers, F.; Lindström, A.; Okafor, E.; Wiering, M.A. Deep neural networks with intersection over union loss for binary image segmentation. In Proceedings of the ICPRAM 2019—8th International Conference on Pattern Recognition Applications and Methods, Prague, Czech Republic, 19–21 February 2019; pp. 438–445. [Google Scholar]
  55. Yacouby, R.; Axman, D. Probabilistic Extension of Precision, Recall, and F1 Score for More Thorough Evaluation of Classification Models. In Proceedings of the First Workshop on Evaluation and Comparison ofNLP Systems, Eval4NLP 2020, Online, 20 November 2020; pp. 79–91. Available online: https://aclanthology.org/2020.eval4nlp-1.9/ (accessed on 13 November 2023).
  56. Zaabar, N.; Niculescu, S.; Kamel, M.M. Application of Convolutional Neural Networks with Object-Based Image Analysis for Land Cover and Land Use Mapping in Coastal Areas: A Case Study in Ain Témouchent, Algeria. IEEE J. Sel. Top. Appl. Earth Obs. Remote Sens. 2022, 15, 5177–5189. [Google Scholar] [CrossRef]
  57. Altarez, R.D.D.; Apan, A.; Maraseni, T. Deep learning U-Net classification of Sentinel-1 and 2 fusions effectively demarcates tropical montane forest’s deforestation. Remote Sens. Appl. Soc. Environ. 2023, 29, 100887. [Google Scholar] [CrossRef]
  58. Gupta, K.; Mukhopadhyay, A.; Giri, S.; Chanda, A.; Datta Majumdar, S.; Samanta, S.; Mitra, D.; Samal, R.N.; Pattnaik, A.K.; Hazra, S. An index for discrimination of mangroves from non-mangroves using LANDSAT 8 OLI imagery. MethodsX 2018, 5, 1129–1139. [Google Scholar] [CrossRef] [PubMed]
  59. Yang, G.; Huang, K.; Sun, W.; Meng, X.; Mao, D.; Ge, Y. Enhanced mangrove vegetation index based on hyperspectral images for mapping mangrove. ISPRS J. Photogramm. Remote Sens. 2022, 189, 236–254. [Google Scholar] [CrossRef]
  60. Marsocci, V.; Scardapane, S. Continual Barlow Twins: Continual Self-Supervised Learning for Remote Sensing Semantic Segmentation. IEEE J. Sel. Top. Appl. Earth Obs. Remote Sens. 2023, 16, 5049–5060. [Google Scholar] [CrossRef]
  61. Li, Z.; Chen, H.; Wu, J.; Li, J.; Jing, N. SegMind: Semisupervised Remote Sensing Image Semantic Segmentation with Masked Image Modeling and Contrastive Learning Method. IEEE Trans. Geosci. Remote Sens. 2023, 61, 1–17. [Google Scholar] [CrossRef]
  62. Saha, S.; Shahzad, M.; Mou, L.; Song, Q.; Zhu, X.X. Unsupervised Single-Scene Semantic Segmentation for Earth Observation. IEEE Trans. Geosci. Remote Sens. 2022, 60, 1–11. [Google Scholar] [CrossRef]
  63. Giri, C.; Ochieng, E.; Tieszen, L.L.; Zhu, Z.; Singh, A.; Loveland, T.; Masek, J.; Duke, N. Status and distribution of mangrove forests of the world using earth observation satellite data. Glob. Ecol. Biogeogr. 2011, 20, 154–159. [Google Scholar] [CrossRef]
Figure 1. Location of field GPS points collected in Wunbaik Mangrove Area, Myanmar (PlanetScope image) (coastal border is in blue and terrestrial is in red).
Remotesensing 16 00076 g001
Figure 2. Different LULC types of our classification in the study area. (a) Water body; (b) shrimp pond; (c) bare land; (d) non-mangrove forest; (e) open mangrove; (f) closed mangrove; (g) paddy field.
Remotesensing 16 00076 g002
Figure 3. The proposed U-net architecture in this study.
Remotesensing 16 00076 g003
Figure 4. The proposed artificial neural network architecture in this study.
Remotesensing 16 00076 g004
Figure 5. Workflow of LULC classification in this study.
Remotesensing 16 00076 g005
Figure 6. The classification results of PlanetScope image, label image, and U-Net-predicted and ANN-predicted images.
Remotesensing 16 00076 g006
Figure 7. The classification results of Sentinel-2 image, label image, and U-Net-predicted and ANN-predicted images.
Remotesensing 16 00076 g007
Figure 8. (a) True color image of PlanetScope, (b) labeled image, LULC classification maps classified by (c) U-Net model with PlanetScope, (d) ANN model with PlanetScope, (e) U-Net model with Sentinel-2, and (f) ANN model with Sentinel-2 Dataset.
Remotesensing 16 00076 g008aRemotesensing 16 00076 g008b
Figure 9. (a) LULC map and (b) LULC information of Wunbaik Reserved Mangrove Forest.
Remotesensing 16 00076 g009
Figure 10. Area of LULC classes in our dataset of the study area.
Remotesensing 16 00076 g010
Figure 11. Learning process of the U-Net and ANN models using (a) PlanetScope and (b) Sentinel-2.
Remotesensing 16 00076 g011
Table 1. Ground truth points collected in field survey.
Annotation CodeDescription of LULC ClassesNumber of GPS Points
0Water: areas mainly covered by marine water. 20
1Shrimp pond: man-made ponds used for shrimp farming, characterized by the presence of water and often geometric shapes.31
2Bare land: unvegetated areas such as tidal flat in mangrove areas or exposed soil in terrestrial areas.22
3Non-mangrove forest: forested areas consisting of tree cover that is not dominated by mangrove species.25
4Open mangrove: mangrove areas with a relatively sparse canopy, allowing more sunlight to reach the ground.38
5Closed mangrove: dense mangrove areas with a thick canopy, where mangrove trees form a dense cover.58
6Paddy field: agricultural fields used for cultivating rice, typically similar shapes to shrimp ponds.30
Total224
Table 2. Specification of satellite imageries used in this study.
Title 1Acquisition DateCloud CoverageBand UsedSpatial ResolutionProcessing Level
PlanetScope21 January 20230RGB, NIR3-
Sentinel-214 February 20230RGB, NIR10Level-2A
Table 3. Classification results of U-Net and ANN using Planet Scope dataset.
LULC ClassIoUF1 ScorePrecisionRecall
U-NetANNU-NetANNU-NetANNU-NetANN
Water0.970.960.970.970.970.980.970.96
Shrimp pond0.820.720.840.790.850.880.820.72
Bare land0.760.840.730.700.700.600.760.84
Non-mangrove forest0.920.830.910.850.890.870.920.83
Open mangrove0.910.950.930.940.950.940.910.94
Closed mangrove0.990.990.990.990.990.980.990.98
Paddy field0.920.890.920.900.920.920.920.92
Average Score0.820.790.940.930.940.940.940.93
Overall accuracy on testing dataset (%)94.0592.82
Note: Notable strengths of the ANN model were observed in some classes, which are in bold.
Table 4. Classification results of U-Net and ANN using Sentinel-2 dataset.
LULC ClassIoUF1 ScorePrecisionRecall
U-NetANNU-NetANNU-NetANNU-NetANN
Water0.940.890.940.910.940.940.940.89
Shrimp pond0.830.910.820.770.810.670.830.91
Bare land0.530.220.540.340.550.550.530.22
Non-mangrove forest0.890.850.910.870.930.890.910.85
Open mangrove0.600.430.640.490.680.570.640.43
Closed mangrove0.960.940.930.890.910.840.930.94
Paddy field0.920.910.920.910.920.910.920.91
Average Score0.710.630.870.810.870.810.870.82
Overall accuracy on testing dataset (%)86.9482.08
Note: With a detailed analysis of each class, the U-Net model outperformed the ANN model, with higher scores, except for IoU, recall of shrimp ponds, and recall of closed mangroves highlighted in bold.
Table 5. LULC information of the whole study area and Wunbaik Reserved Mangrove Forest.
LULC ClassWhole Study AreaWunbaik Reserved Mangrove Forest
Area (km2)Portion (%)Area (km2)Portion (%)
Water149.9628.1472.9422.51
Shrimp pond44.898.4217.995.55
Bare land32.986.1911.843.65
Non-mangrove forest15.152.840.290.09
Open mangrove57.0010.7035.5210.96
Closed mangrove187.5035.19167.3851.65
Paddy field45.368.5118.125.59
Disclaimer/Publisher’s Note: The statements, opinions and data contained in all publications are solely those of the individual author(s) and contributor(s) and not of MDPI and/or the editor(s). MDPI and/or the editor(s) disclaim responsibility for any injury to people or property resulting from any ideas, methods, instructions or products referred to in the content.

