Article

Regional Analysis of Dominant Factors Influencing Leaf Chlorophyll Content in Complex Terrain Regions Using a Geographic Statistical Model

1
State Key Laboratory of Remote Sensing Science, Aerospace Information Research Institute, Chinese Academy of Sciences, Beijing 100101, China
2
University of Chinese Academy of Sciences, Beijing 100049, China
*
Author to whom correspondence should be addressed.
Remote Sens. 2024, 16(3), 479; https://doi.org/10.3390/rs16030479
Submission received: 23 November 2023 / Revised: 23 January 2024 / Accepted: 23 January 2024 / Published: 26 January 2024

Abstract

:
Chlorophyll is a vital indicator of vegetation growth; exploring its relationship with external influencing factors is essential for studies such as chlorophyll remote sensing retrieval and vegetation growth monitoring. However, there has been limited in-depth exploration of the spatial distribution of leaf chlorophyll content (LCC) and its influencing factors across large-scale areas with varying climates and terrains. To investigate the primary influencing factors and degrees of various environmental factors on LCC, this study employed the Geodetector Model (GDM) and the LCC satellite products in Sichuan Province in 2020 to investigate the impact of relationships between nine environmental factors (meteorology, topography, and vegetation types) and the ecosystem LCC at a regional scale. The results indicated the following: (1) Elevation (q-value = 49.31%) is the primary factor determining photosynthesis in Sichuan Province, followed by temperature (46.10%) and vegetation types (40.73%). The impact of topographical factors on LCC distribution is higher than that of meteorological factors and vegetation types in terrain with complex topography. The elevation effectively distinguishes the variations in climate factors and vegetation types. (2) Combining the influencing factors pairwise increased the combined q-values. The combination of elevation with other factors yielded the highest combined q-value. (3) The q-values for all influencing factors are higher in winter and spring and lowest in summer. Different influencing factors exhibited more substantial constraints on vegetation photosynthesis during winter and spring, significantly reducing influence during summer. (4) The different primary factors drive or constrain vegetation photosynthesis in different climate zones due to their distinct temperature and humidity characteristics. The findings of this study provide a basis for future research on vegetation change analysis and dynamic monitoring of vegetation LCC in different terrains.

Graphical Abstract

1. Introduction

The biochemical and physicochemical characteristics of vegetation, such as chlorophyll content and leaf area index, are crucial in characterizing the well-being and growth of individual vegetation entities and the entire ecosystem [1]. Chlorophyll, as a fundamental constituent of plant organs, is commonly found in the leaves of green plants [2]. Retrievals of chlorophyll content are crucial since it serves as a proxy for the photosynthetic capacity within terrestrial biosphere models [3,4]. The chlorophyll content can indicate the suitability of the vegetation’s growth environment and the presence of deficiencies in essential nutrients or water.
Various algorithms were developed based on remote sensing data for retrieving vegetation leaf chlorophyll content (LCC) [5,6,7]. Researchers have generated multiple chlorophyll content products at different scales and time spans using methods like lookup tables [8,9], machine learning [10], vegetation indices [11,12], etc. These methods can be categorized into two groups: an empirical vegetation index (VI)-based approach and a radiative transfer modeling (RTM)-based approach [11]. Based on these methods, a large number of chlorophyll-content products have been produced, such as the global MERIS LCC [8], MODIS LCC [10], and GLCC products [13]. Their temporal resolutions are 8–16 days, a month, or even longer, and the spatial resolutions are 300 m or lower. Recently, a 10-day, 30 m MuSyQ LCC product was generated based on Sentinel-2 MSI data in China [14], which provides finer spatiotemporal distribution characteristics of LCC.
The spatiotemporal distribution characteristics of vegetation chlorophyll content and its responses to natural environmental changes are essential for analyzing and monitoring ecosystems and their changes. Climate and topography are the primary factors influencing vegetation photosynthesis [15,16,17]. Existing research primarily focused on exploring and analyzing the influences at a mechanical or point-to-regional scale level. Researchers used greenhouses, growth chambers, etc., to simulate ecological environments and examine the relationships between chlorophyll content and climate factors at a point-to-regional scale level [18,19]. When soil moisture content and atmospheric carbon dioxide concentrations are optimal, an increase in temperature will stimulate the opening of stomata in vegetation leaves, thereby enhancing the rate of photosynthesis in vegetation and consequently leading to an increase in chlorophyll content [18]. When temperatures become excessively high, vegetation may experience soil moisture and salinity stress, leading to stomata closure in plant leaves. This closure reduces photosynthetic efficiency and lowers chlorophyll content [19]. In addition, researchers use methods such as field sampling to explore the significant relationships between chlorophyll content and topographical factors. Plant photosynthesis is influenced by solar radiation and temperature variations at different elevations [11,20]. Li et al. [21] indicate that mountainous and undulating terrain can influence radiation transmission processes and the hydrothermal cycle, thereby leading to variations in ecological parameters such as chlorophyll content within a region. However, both greenhouse simulation and field sampling methods involve high operational costs, and research focuses predominantly on the impact of individual factors on chlorophyll content at point or regional scale levels. The large-scale exploration of the relationship between environmental factors and the spatial distribution of LCC within diverse climatic and topographical regions has been limited [22].
The geographic statistical models, such as the Geodetector Model (GDM), Single-Point Areal Estimation (SPA), Biased Sample Hospital-Based Area Disease Estimation (B-SHADE), etc., contribute to enhancing the analysis of the relationship between parameter spatial distribution and various environmental factors, thereby helping to improve the understanding of how the environment determines the development and changes of ecosystems [23,24,25,26]. Compared to other spatial analysis methods, the GDM is not restricted by linear assumptions, making it better suited for quantifying the contribution of independent variables to the dependent variable. It is effective in exploring the complex relationships among spatial data and assessing the impact of various factors on the spatial distribution characteristics of target variables. Researchers have extensively utilized this model to study the spatial relationships of different surface parameters [27]. In the medical and health fields, GDM is used to analyze the interrelation between newborn neural tube defects and the environment in a specific county in China [26]. In the field of urbanization research, GDM has also been proven to provide a reasonable explanation for the driving factors of urbanization in multiple regions of China [28]. In the ecological and environmental context, the geographical detector has also demonstrated its analytical capability for exploring the mutual relationships among spatial factors [29]. So, the geographic statistical models provide the potential to examine the impact of various environmental factors on LCC distribution and enable the assessment of ecosystem changes.
To explore the influence of various environmental factors on the photosynthetic capacity of ecosystems, we employed the GDM model and the satellite products of LCC to analyze the spatiotemporal variations in the influence of nine environmental factors (meteorology, topography, and phenology) on the ecosystem LCC at a regional scale. We selected Sichuan Province, characterized by its various climatic zones and complex topographical features, as our study area.

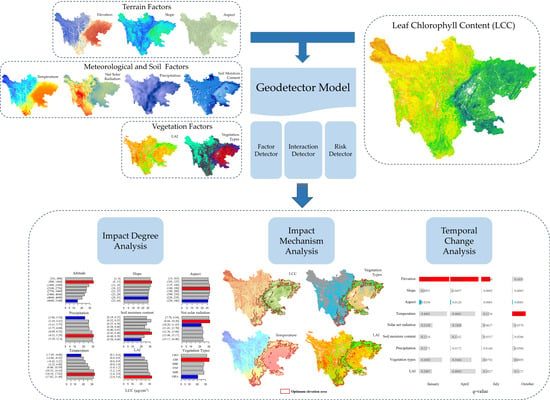
2. Materials and Methods

2.1. Study Area

The study area was located in Sichuan Province, in the southwestern region of China, spanning longitudinally from 97.3°E to 108.2°E and latitudinally from 26.0°N to 34.3°N (Figure 1). This region, covering an area of 486,000 km2, exhibits diverse terrain and distinct climate variations. Sichuan Province is situated between China’s first and second tiers of three-tiered topography. The northwestern region is predominantly plateau, and the southwestern region is mountainous, with elevations exceeding 4000 m. The eastern part consists of basins and hills, with elevations ranging from 1000 to 3000 m.
Sichuan Province experiences a distinct monsoon climate with hot and rainy seasons. The northwestern plateau has a high-elevation, cold environment, while the climate is temperate. The southwestern mountainous area falls under a subtropical semi-humid climate zone characterized by relatively high temperatures and lower precipitation. The eastern Sichuan Basin belongs to the central subtropical humid climate zone, which is characterized by favorable thermal conditions and a warm, moist climate throughout the year.

2.2. Datasets

2.2.1. Chlorophyll Content Product

The MuSyQ LCC product, with a spatial resolution of 30 m and a temporal resolution of 10 days, was derived from Sentinel-2 surface reflectance data. The MuSyQ LCC product was derived by the empirical regression method based on the Chlorophyll Sensitivity Index (CSI) constructed using the PROSAIL model and the PROSPECT+ four-scale model to retrieve LCC for various types of vegetation [11,14]. Compared to other chlorophyll retrieval methods based on vegetation indices or physical models, the RMSE of the MuSyQ LCC product is 8.24 μg/cm2, which significantly decreased by 2 to 6 μg/cm2 compared with existing LCC products [11,14]. The MuSyQ LCC product, released by the Aerospace Information Research Institute (AIR), Chinese Academy of Sciences (CAS), China, can be obtained from the Science Data Bank at https://www.scidb.cn/en/detail?dataSetId=846695127865884672 (accessed on 10 May 2023).

2.2.2. SRTM Digital Elevation 30 m Data

The Shuttle Radar Topography Mission (SRTM) Digital Elevation was obtained based on radar observations with a spatial resolution of 30 m [30]. It was used to extract the topographical factor data, including elevation, slope, and aspect, in this study. This data can be obtained from the US Geological Survey (USGS) Earth Resources Observation and Science (EROS) Center at https://www.usgs.gov/centers/eros/science/usgs-eros-archive-digital-elevation-shuttle-radar-topography-mission-srtm-1 (accessed on 14 May 2023).

2.2.3. ERA5 Reanalysis Meteorological Dataset

Data for four meteorological factors, including temperature at 2 m above the ground, net solar radiation, total precipitation, and soil moisture content at depths of 28–100 cm, were obtained from the monthly average ERA5 reanalysis meteorological dataset with a spatial resolution of 0.25 degrees, released by the European Centre for Medium-Range Weather Forecasts [31]. This data combines model data with observations worldwide into a complete and consistent dataset. This data can be obtained from the European Centre for Medium-Range Weather Forecasts (ECMWF) at https://cds.climate.copernicus.eu/cdsapp#!/dataset/reanalysis-era5-single-levels-monthlymeans?tab=overview (accessed on 10 May 2023).

2.2.4. MODIS Land Cover Product

MODIS Land Cover Type (MCD12Q1) Version 6.1 data product with a spatial resolution of 500 m was employed to identify the vegetation types. This data can be obtained from the NASA Land Processes Distributed Active Archive Center (LP DAAC) at https://lpdaac.usgs.gov/products/mcd12q1v061/ (accessed on 12 May 2023).
In this study, we selected six types: Evergreen Broadleaf Forest (EBF), Evergreen Needleleaf Forest (ENF), Deciduous Broadleaf Forest (DBF), Shrubland (SHR), Grassland (GRA), and Cropland (CRO).

2.2.5. MODIS Leaf Area Index (LAI) Product

The MODIS LAI product (MOD15A2H) has been generated at 500 m spatial resolution with an 8-day interval since 2000. The main algorithm is based on the biome-specific lookup tables (LUTs) simulated from the three-dimensional (3D) radiative transfer (RT) model [32]. The MOD15A2H product was obtained from NASA LP DAAC at https://lpdaac.usgs.gov/products/mod15a2hv061/ (accessed on 12 May 2023).

2.3. Methodology

This study is based on various raster data, including topographical, meteorological, and vegetation data from Sichuan Province in 2020, as factors influencing LCC. To ensure compatibility and comparability among remote sensing products, all data used in this study were resampled to 30 m using the nearest-neighbor method.
The GDM requires uniform data formatting for the input independent variables; all variables should be categorical. Therefore, the independent variables need to be discretized. In this study, five different discretization methods were chosen: the equal interval method, the natural breakpoint method, the quantile classification method, the geometric interval method, and the standard deviation method. Each method’s corresponding q-values were compared, and the method that produced the highest q-value was selected as the final discretization method.
The flowchart of this study is shown in Figure 2.

2.3.1. Influencing Factors

Prior research has shown that climate, topography, and other factors significantly impact vegetation photosynthesis. Therefore, this study selected factors such as elevation, slope, temperature, and precipitation as part of the dataset of influencing factors. Additionally, to explore how different vegetation types and phenological characteristics affect LCC, this study included variables like vegetation type and LAI as influencing factors. The meanings and information of these influencing factors are presented in Table 1, and the average distribution of these influencing factors is shown in Figure 3.
The spatial distribution of influencing factors in Sichuan Province, including terrain, meteorology, soil, and vegetation, exhibits distinct differentiation patterns. Notably, there is a significant difference in distribution between the western and eastern regions.

2.3.2. Geographic Detector Model

The GDM was used to investigate the impact relationships between various influencing factors and vegetation LCC. The GDM assumes that if an independent variable significantly affects the dependent variable, the independent and dependent variables exhibit similar spatial distribution characteristics [23,27]. In this study, with the aid of the GDM based on optimal parameters, the data analysis focused on three main components: differentiation and factor detection, interaction detection, and risk zone detection [33].
We used the R language (version 4.2.2) to implement raster data reading and preprocessing based on the raster package (version 3.6-11), and we implemented data discretization and GDM model analysis based on the GD package (version 1.10) [33].
(1) Factor detector
We used factor detectors to implement impact degree and temporal change analyses of influencing factors. The differentiation and factor detection process assesses the extent to which independent variables explain the spatial differentiation patterns of the dependent variable using the q-value. The calculation of the q-value is shown in Equation (1).
q = 1 h 1 L N h σ h 2 N σ 2 = 1 S S W S S T ,
where h = 1 ,   2 , L represents the strata for either independent or dependent variables. N h and N are the number of units in the h-th stratum and the entire region, respectively. σ h 2 and σ h 2 represent the variance of the dependent variable values in the h-th stratum and the total variance across the entire region. SSW and SST represent the sum of within-stratum variances and the total variance of the entire region, respectively. The q-value ranges from 0 to 1, with larger values indicating more pronounced spatial differentiation of the dependent variable. Moreover, if the independent variable causes the strata, it also signifies a more substantial explanatory power of the independent variable on the dependent variable, and vice versa. The GDM uses the p-value to indicate the significance of the results, where p ≤ 0.01 indicates highly significant results, p ≤ 0.05 indicates significant results, and p > 0.05 indicates nonsignificant results.
(2) Interaction detector
We used an interaction detector to implement an impact degree analysis of different influencing factors. Interaction detection is used to identify whether there is an enhancement or reduction in the explanatory power of the dependent variable when different combinations of independent variables jointly act. Table 2 presents the interactions between two independent variables concerning the dependent variable. In Table 2, q X 1 and q X 2 represent the q-values for the two respective independent variables, and q X 1 X 2 is the q-value when the two independent variables are combined. M i n q X 1 , q X 2 and M a x q X 1 , q X 2 indicate the minimum and maximum values between q X 1 and q X 2 .
(3) Risk detector
Using a risk detector, we implemented an impact mechanism analysis of influencing factors. The risk detector quantifies whether there is a significant difference in attribute means between two subregions using the t-statistic. In this study, to investigate the mechanisms through which different influencing factors affect the chlorophyll content of vegetation, the average chlorophyll content was calculated for each stratum (the discrete categories) of each influencing factor.
Furthermore, to investigate the influence of various factors on the spatial distribution of LCC from different temporal and climatic perspectives, we conducted the analyses above across different seasons and climate zones. In this study, in the time dimension, January, April, July, and October 2020 were selected to analyze the influence of different factors on LCC in four seasons. In the space dimension, the study area encompasses three Köppen climate zone types [34]: plateau, subtropical semi-humid, and central subtropical humid climate zones. So, we conducted the analyses across these three areas to analyze the differences in the primary influencing factors in different climate zones.

3. Results

3.1. Analysis of LCC Distribution Characteristics

The average vegetation LCC distribution in Sichuan Province in 2020, derived from the MuSyQ LCC product, is illustrated in Figure 4a. The highest values were observed in the eastern basin, corresponding to the central subtropical humid climate zone. In contrast, the lowest values were found in the northwestern plateau, representing the plateau climate zone. The southwestern mountainous region, classified as a subtropical semi-humid climate zone, fell between these extremes. The distribution of average LCC in 2020 for different vegetation types is displayed in Figure 4b. Evergreen Broadleaf Forest (EBF) exhibited the highest median LCC due to its characteristic of retaining leaves year-round, aligning with previous research [8], and Grassland (GRA) had the lowest median LCC. Deciduous Broadleaf Forest (DBF) exhibits a wide range of LCC due to its pronounced seasonal phenological changes. Evergreen Needleleaf Forests (ENF) also display a relatively broad distribution of LCC values as they grow in different elevation zones and experience varying climatic influences in the mountainous regions of Sichuan Province. Cropland (CRO) exhibits relatively high LCC, often associated with human management and regulation of crop growth.

3.2. Analysis of Influencing Factors

Based on the average LCC in 2020, the GDM differentiation and factor detection analysis results for the nine influencing factors are presented in Table 3. All the p-values for the influencing factors are less than 0.01, indicating that they all significantly impact vegetation LCC.
Among all the influencing factors, elevation has the highest q-value, explaining 49.31% of the spatial differentiation pattern in LCC. The climate factors of temperature, precipitation, and solar net radiation have q-values of 46.10%, 15.15%, and 28.6%, respectively. The factor of vegetation types, representing the specific photosynthesis capacity of certain vegetation types, has q-values of 40.73%. It indicates that the elevation has a closer and more significant correlation with LCC and further vegetation photosynthesis variations than the factors of climate and vegetation species in the study area. LAI also has a q-value, indicating a significant correlation with the spatial differentiation of LCC. The soil moisture has a relatively minor influence, contributing only about 16.30%. The slope and aspect have minimal effects on the spatial distribution pattern of LCC, accounting for only 2.87% and 0.76%, respectively.
The annual average LCC corresponding to the different strata of the nine influencing factors in 2020 is shown in Figure 5. The most significant strata differences in LCC are observed in temperature, elevation, and vegetation types, corresponding to the high q-values in Table 3. The minimal and maximal average LCC among all nine factors appears in the highest and second lowest elevation strata, reverifying the most significant correlation with elevations. The average LCC increases with higher temperature and increased precipitation until the temperature exceeds 17.82 °C and 5.29 mm (i.e., the second-to-last strata for both factors), which begins to decline. The linear relationship with precipitation is relatively less significant than temperature and elevation. Among the six vegetation types in the study area, EBF has the highest average LCC, followed by CRO. The GRA has minimal values. No significant linear relationship with soil moisture content is observed. The difference in average LCC among different slopes and aspect strata is minimal and consistent with low q-values (Table 3). The slight difference indicates that the LCC is higher on the aspect facing south (aspect = 180°) and lower slopes.
The linear relationship between LCC and elevation is significant, with a noticeable decrease in LCC as elevation increases. The average LCC reaches its maximum when the elevation is in the second stratum, corresponding to [808, 1460] meters. Figure 6a shows that this stratum (red line) corresponds to the main distribution area of evergreen broadleaf forest with high LCC. This elevation stratum, with an average temperature of 17.96 °C (Figure 6c), intercepts the moisture from the Pacific, making it the most favorable area for vegetation growth. The EBF with higher LAI and LCC (Figure 5) thrives in this stratum (Figure 6b,d).

3.3. Mutual Influence Analysis of Influencing Factors

By combining the nine influencing factors in pairs, 36 combinations of elements were obtained, and their mutual impacts on the average LCC in 2020 were explored, as shown in Table 4.
The combination of elevation with other influencing factors can explain 50.27–56.37% of the spatial distribution pattern of LCC, which is larger than the q-value of single elevation (q-value = 49.31% as in Table 3) and also the highest among all pairs of influencing factors. Next are the pairs combined with temperature (explained at least 46.83–54.34% of LCC distribution, more significant than 46.1% of single temperature) and vegetation types (defined at least 41.24–56.37% of LCC distribution, larger than 40.73% of single vegetation type). The q-values for each combination are all larger than the q-values of each influencing factor, indicating that multiple influencing factors jointly constrain LCC.
The elevation and vegetation type combination has the highest q-value (56.37%). However, the gain from the combination is not significant compared to the q-values of each factor (49.31% and 40.73%). When combined with one of the other seven influencing factors, the slope has higher q-values than the sum of the q-values of each factor (the bolded part in Table 4). The combination with slope exhibits a nonlinearly enhanced interaction effect on LCC variations, except when combined with temperature. This indicates that the slope enhances the sensitivity of vegetation photosynthesis to the influencing factors and can slightly strengthen the influence of other factors on LCC variation.

3.4. Influencing Factors in Different Seasons

The q-values for each influencing factor in each season are shown in Figure 7.
It can be observed that the q-values for the nine factors are highest in winter and spring and lowest in summer. In winter, the vegetation grows slowly due to unfavorable conditions, resulting in minimal differences in LCC and low within-class variance (high q-values). This implies that elevation, temperature, and precipitation stress vegetation growth and strongly influence winter and spring. Their influence significantly weakens in the summer since the optimal growing conditions alleviate stress from any factor on vegetation growth.
Some factors (like elevation, slope, aspect, vegetation type) that do not vary with seasons show significant seasonal change in q-values. The elevation, slope, and aspect determine the differentiation of climate factors (temperature, rainfall, and solar radiation) with substantial seasonal variation, thereby contributing to their seasonal characteristics. The elevation effectively distinguishes the variations in climate factors due to its high q-values. The high q-values and their seasonal variations for vegetation types indicate the difference in the photosynthetic capacity of different vegetation types during different seasons.

3.5. Influencing Factors in Different Climatic Zones

The q-values for each influencing factor over three climate zones in Sichuan Province in 2020 are shown in Figure 8. The spatial distributions of average LCC, elevation, and climate factors (temperature and precipitation) in each climate zone are illustrated in Figure 9.
The major influencing factors among the three climate zones differ significantly. It suggests that different primary factors drive or constrain vegetation photosynthesis in different climate zones due to their distinct temperature and humidity characteristics.
As shown in Figure 9, in the northwestern plateau climate zone characterized by high elevation, low temperatures, and low precipitation, LAI and vegetation type significantly impact LCC. ENF and grass are the major vegetation types in this climate zone, and ENF has a larger LCC and greater photosynthesis capacity than grass. In high-elevation and cold regions, different growth stages represented by LAI are the most critical factors determining photosynthetic capacity. Elevation and temperature have lower q-values, indicating that variations in elevation and temperature do not significantly promote photosynthesis growth under the widespread conditions of high elevation and low temperature. Additionally, the intense sunlight in the plateau climate (Figure 9e) leads to a minimal impact of solar net radiation on LCC in this area.
In the southwestern subtropical semi-humid climate zone, which has the most favorable temperature and precipitation conditions among the three climate zones, all meteorological factors are generally within a suitable range for photosynthesis. Therefore, their overall impact on LCC is relatively weak. The terrain factors (elevation, slope, and aspect) also have low q-values and few influences on LCC. Like the plateau climate, LAI and vegetation type become the most influential factors and are most correlated with the photosynthetic capacity of vegetation.
In the eastern central subtropical humid climate zone, temperature and elevation have the largest q-values and become the most influential factors. The elevation increases significantly from the plain, and the pronounced seasonal variation due to the subtropical wet monsoon climate results in a wide range of temperature fluctuations throughout the year. This makes elevation and temperature the most significant factors affecting photosynthesis in this climate zone.
Overall, the q-values of the nine factors differ more significantly, and the sum of the nine q-values is more significant in the plateau climate zone than in the other two climate zones, indicating that the influencing factors have more constraints on photosynthesis in the plateau climate. In the subtropical humid climate zone, the overall conditions for solar radiation, temperature, and rainfall favor plant growth, resulting in fewer constraints imposed by topography, meteorology, and other factors.

4. Conclusions and Discussion

This study highlights the complex relationship between LCC and various influencing factors in different climatic and topographic regions. The findings of this study provide a basis for future research on vegetation change analysis and dynamic monitoring of vegetation LCC.
(1)
The impact of topographical factors on LCC distribution is higher than that of meteorological factors and vegetation types in terrain with complex topography. Elevation (q-value = 49.31%) is the primary factor determining photosynthesis in Sichuan Province, followed by temperature (46.10%) and vegetation types (40.73%). The most significant strata differences in LCC are also observed in elevation, temperature, and vegetation types. The minimal and maximal average LCC among all nine factors appears in the highest and second lowest elevation strata. The elevation effectively distinguishes the variations in climate factors and vegetation types with the most significant influence on LCC distribution.
(2)
Combining the influencing factors pairwise increased the combined q-values. The combination of elevation with other factors yielded the highest combined q-value. Slope alone had a relatively low q-value, but when combined with other factors, there was often a non-linear enhancement effect. The slope enhances the sensitivity of vegetation photosynthesis to the influencing factors.
(3)
The q-values for all influencing factors are higher in winter and spring and lowest in summer. The elevation, temperature, and precipitation stress vegetation growth strongly in winter and spring, and the influence significantly weakens in summer since the optimal growing conditions alleviate stress from any factor on vegetation growth.
(4)
The different primary factors drive or constrain vegetation photosynthesis in different climate zones due to their distinct temperature and humidity characteristics, since the significant influencing factors among different climate zones differ significantly. The sum of the nine q-values is more effective in the plateau climate zone than in the other two, indicating that the influencing factors have more constraints on photosynthesis in the plateau climate. The conditions favor plant growth in the subtropical humid climate zone, resulting in fewer constraints imposed by topography, meteorology, and other factors.

Author Contributions

Conceptualization, J.L. and Q.L.; Data curation, T.C. and C.G.; Formal analysis, T.C.; Investigation, T.C., C.G. and H.Z.; Methodology, T.C. and C.G.; Project administration, J.L., J.Z. and Y.D.; Software, T.C. and C.G.; Supervision, Q.L.; Validation, J.Z., F.M., Y.D. and H.Z.; Visualization, J.L.; Writing—original draft, T.C.; Writing—review and editing, J.L., J.Z., C.G. and F.M. All authors have read and agreed to the published version of the manuscript.

Funding

This work was supported by the National Key Research and Development Program (2019YFE0126700) and the National Natural Science Foundation of China (42271359).

Data Availability Statement

The datasets used and/or analyzed during the current study are available from the corresponding author on request. The data are not publicly available due to the sheer volume of raw data and the challenges in disseminating them effectively.

Conflicts of Interest

The authors declare no conflicts of interest.

References

  1. Lu, B.; He, Y. Evaluating Empirical Regression, Machine Learning, and Radiative Transfer Modelling for Estimating Vegetation Chlorophyll Content Using Bi-Seasonal Hyperspectral Images. Remote Sens. 2019, 11, 1979. [Google Scholar] [CrossRef]
  2. Shah, S.H.; Angel, Y.; Houborg, R.; Ali, S.; McCabe, M.F. A Random Forest Machine Learning Approach for the Retrieval of Leaf Chlorophyll Content in Wheat. Remote Sens. 2019, 11, 920. [Google Scholar] [CrossRef]
  3. Croft, H.; Chen, J.M.; Luo, X.; Bartlett, P.; Chen, B.; Staebler, R.M. Leaf Chlorophyll Content as a Proxy for Leaf Photosynthetic Capacity. Glob. Chang. Biol. 2017, 23, 3513–3524. [Google Scholar] [CrossRef]
  4. Luo, X.; Croft, H.; Chen, J.M.; He, L.; Keenan, T.F. Improved Estimates of Global Terrestrial Photosynthesis Using Information on Leaf Chlorophyll Content. Glob. Chang. Biol. 2019, 25, 2499–2514. [Google Scholar] [CrossRef] [PubMed]
  5. Darvishzadeh, R.; Skidmore, A.; Schlerf, M.; Atzberger, C. Inversion of a Radiative Transfer Model for Estimating Vegetation LAI and Chlorophyll in a Heterogeneous Grassland. Remote Sens. Environ. 2008, 112, 2592–2604. [Google Scholar] [CrossRef]
  6. Croft, H.; Chen, J.M.; Zhang, Y.; Simic, A.; Noland, T.L.; Nesbitt, N.; Arabian, J. Evaluating Leaf Chlorophyll Content Prediction from Multispectral Remote Sensing Data within a Physically-Based Modelling Framework. ISPRS J. Photogramm. Remote Sens. 2015, 102, 85–95. [Google Scholar] [CrossRef]
  7. Malenovskỳ, Z.; Homolová, L.; Zurita-Milla, R.; Lukeš, P.; Kaplan, V.; Hanuš, J.; Gastellu-Etchegorry, J.-P.; Schaepman, M.E. Retrieval of Spruce Leaf Chlorophyll Content from Airborne Image Data Using Continuum Removal and Radiative Transfer. Remote Sens. Environ. 2013, 131, 85–102. [Google Scholar] [CrossRef]
  8. Croft, H.; Chen, J.M.; Wang, R.; Mo, G.; Luo, S.; Luo, X.; He, L.; Gonsamo, A.; Arabian, J.; Zhang, Y. The Global Distribution of Leaf Chlorophyll Content. Remote Sens. Environ. 2020, 236, 111479. [Google Scholar] [CrossRef]
  9. Xu, M.; Liu, R.; Chen, J.M.; Liu, Y.; Wolanin, A.; Croft, H.; He, L.; Shang, R.; Ju, W.; Zhang, Y.; et al. A 21-Year Time Series of Global Leaf Chlorophyll Content Maps From MODIS Imagery. IEEE Trans. Geosci. Remote Sens. 2022, 60, 4413513. [Google Scholar] [CrossRef]
  10. Xu, M.; Liu, R.; Chen, J.M.; Shang, R.; Liu, Y.; Qi, L.; Croft, H.; Ju, W.; Zhang, Y.; He, Y.; et al. Retrieving Global Leaf Chlorophyll Content from MERIS Data Using a Neural Network Method. ISPRS J. Photogramm. Remote Sens. 2022, 192, 66–82. [Google Scholar] [CrossRef]
  11. Zhang, H.; Li, J.; Liu, Q.; Lin, S.; Huete, A.; Liu, L.; Croft, H.; Clevers, J.G.; Zeng, Y.; Wang, X. A Novel Red-Edge Spectral Index for Retrieving the Leaf Chlorophyll Content. Methods Ecol. Evol. 2022, 13, 2771–2787. [Google Scholar] [CrossRef]
  12. Pastor-Guzman, J.; Brown, L.; Morris, H.; Bourg, L.; Goryl, P.; Dransfeld, S.; Dash, J. The Sentinel-3 OLCI Terrestrial Chlorophyll Index (OTCI): Algorithm Improvements, Spatiotemporal Consistency and Continuity with the MERIS Archive. Remote Sens. 2020, 12, 2652. [Google Scholar] [CrossRef]
  13. Qian, X.; Liu, L.; Chen, X.; Zhang, X.; Chen, S.; Sun, Q. Global Leaf Chlorophyll Content Dataset (GLCC) from 2003–2012 to 2018–2020 Derived from MERIS and OLCI Satellite Data: Algorithm and Validation. Remote Sens. 2023, 15, 700. [Google Scholar] [CrossRef]
  14. Li, J.; Zhang, H.; Wang, X.; Zhang, Z.; Gu, C.; Wen, Y.; Chu, T.; Liu, Q. A dataset of 30 m/10-day leaf chlorophyll content of MuSyQ GF-series(2019–2020, China, Version 01). China Sci. Data 2022, 7, 241–249. [Google Scholar]
  15. Bulthuis, D.A. Effects of Temperature on Photosynthesis and Growth of Seagrasses. Aquat. Bot. 1987, 27, 27–40. [Google Scholar] [CrossRef]
  16. Lawlor, D.W. Musings about the Effects of Environment on Photosynthesis. Ann. Bot. 2009, 103, 543–549. [Google Scholar] [CrossRef]
  17. Balasimha, D.; Daniel, E.V.; Bhat, P.G. Influence of Environmental Factors on Photosynthesis in Cocoa Trees. Agric. For. Meteorol. 1991, 55, 15–21. [Google Scholar] [CrossRef]
  18. Urban, J.; Ingwers, M.W.; McGuire, M.A.; Teskey, R.O. Increase in Leaf Temperature Opens Stomata and Decouples Net Photosynthesis from Stomatal Conductance in Pinus Taeda and Populus Deltoides x Nigra. J. Exp. Bot. 2017, 68, 1757–1767. [Google Scholar] [CrossRef]
  19. Becker, V.I.; Goessling, J.W.; Duarte, B.; Caçador, I.; Liu, F.; Rosenqvist, E.; Jacobsen, S.-E. Combined Effects of Soil Salinity and High Temperature on Photosynthesis and Growth of Quinoa Plants (Chenopodium Quinoa). Funct. Plant Biol. 2017, 44, 665–678. [Google Scholar] [CrossRef]
  20. Zhu, J.; He, W.; Yao, J.; Yu, Q.; Xu, C.; Huang, H.; Mhae, B.; Jandug, C. Spectral Reflectance Characteristics and Chlorophyll Content Estimation Model of Quercus Aquifolioides Leaves at Different Altitudes in Sejila Mountain. Appl. Sci. 2020, 10, 3636. [Google Scholar] [CrossRef]
  21. Li, A.; Yin, G.; Jin, H.; Bian, J.; Zhao, W. Principles and Methods for the Retrieval of Biophysical Variables in Mountainous Areas. Remote Sens. Technol. Appl. 2016, 31, 1–11. [Google Scholar]
  22. Li, Y.; He, N.; Hou, J.; Xu, L.; Liu, C.; Zhang, J.; Wang, Q.; Zhang, X.; Wu, X. Factors Influencing Leaf Chlorophyll Content in Natural Forests at the Biome Scale. Front. Ecol. Evol. 2018, 6, 64. [Google Scholar] [CrossRef]
  23. Wang, J.; Xu, C. Geodetector: Principle and prospective. Acta Geogr. Sin. 2017, 72, 116–134. [Google Scholar] [CrossRef]
  24. Wang, J.-F.; Hu, M.-G.; Xu, C.-D.; Christakos, G.; Zhao, Y. Estimation of Citywide Air Pollution in Beijing. PLoS ONE 2013, 8, e53400. [Google Scholar] [CrossRef]
  25. Wang, J.-F.; Reis, B.Y.; Hu, M.-G.; Christakos, G.; Yang, W.-Z.; Sun, Q.; Li, Z.-J.; Li, X.-Z.; Lai, S.-J.; Chen, H.-Y.; et al. Area Disease Estimation Based on Sentinel Hospital Records. PLoS ONE 2011, 6, e23428. [Google Scholar] [CrossRef]
  26. Wang, J.-F.; Li, X.-H.; Christakos, G.; Liao, Y.-L.; Zhang, T.; Gu, X.; Zheng, X.-Y. Geographical Detectors-Based Health Risk Assessment and Its Application in the Neural Tube Defects Study of the Heshun Region, China. Int. J. Geogr. Inf. Sci. 2010, 24, 107–127. [Google Scholar] [CrossRef]
  27. Wang, J.-F.; Zhang, T.-L.; Fu, B.-J. A Measure of Spatial Stratified Heterogeneity. Ecol. Indic. 2016, 67, 250–256. [Google Scholar] [CrossRef]
  28. Liu, Y.; Yang, R. The Spatial Characteristics and Formation Mechanism of the County Urbanization in China. Acta Geogr. Sin. 2012, 67, 1011–1020. [Google Scholar] [CrossRef]
  29. Li, X.; Xie, Y.; Wang, J.; Christakos, G.; Si, J.; Zhao, H.; Ding, Y.; Li, J. Influence of Planting Patterns on Fluoroquinolone Residues in the Soil of an Intensive Vegetable Cultivation Area in Northern China. Sci. Total Environ. 2013, 458–460, 63–69. [Google Scholar] [CrossRef]
  30. Farr, T.G.; Rosen, P.A.; Caro, E.; Crippen, R.; Duren, R.; Hensley, S.; Kobrick, M.; Paller, M.; Rodriguez, E.; Roth, L.; et al. The Shuttle Radar Topography Mission. Rev. Geophys. 2007, 45, 361. [Google Scholar] [CrossRef]
  31. Copernicus Climate Change Service ERA5-Land Monthly Averaged Data from 2001 to Present 2019. Available online: https://cds.climate.copernicus.eu/cdsapp#!/dataset/reanalysis-era5-single-levels-monthlymeans?tab=overview (accessed on 10 May 2023).
  32. Knyazikhin, Y.; Martonchik, J.V.; Myneni, R.B.; Diner, D.J.; Running, S.W. Synergistic Algorithm for Estimating Vegetation Canopy Leaf Area Index and Fraction of Absorbed Photosynthetically Active Radiation from MODIS and MISR Data. J. Geophys. Res. Atmos. 1998, 103, 32257–32275. [Google Scholar] [CrossRef]
  33. Song, Y.; Wang, J.; Ge, Y.; Xu, C. An Optimal Parameters-Based Geographical Detector Model Enhances Geographic Characteristics of Explanatory Variables for Spatial Heterogeneity Analysis: Cases with Different Types of Spatial Data. GISci. Remote Sens. 2020, 57, 593–610. [Google Scholar] [CrossRef]
  34. Beck, H.E.; Zimmermann, N.E.; McVicar, T.R.; Vergopolan, N.; Berg, A.; Wood, E.F. Present and Future Köppen-Geiger Climate Classification Maps at 1-km Resolution. Sci. Data 2018, 5, 180214. [Google Scholar] [CrossRef]
Figure 1. Schematic diagram of the study area.
Remotesensing 16 00479 g001
Figure 2. Flowchart of the study.
Remotesensing 16 00479 g002
Figure 3. Average distribution of influencing factors in Sichuan Province in 2020, including elevation (a), slope (b), aspect (c), temperature (d), net solar radiation (e), soil moisture content (f), precipitation (g), LAI (h), and vegetation types (i). In (i), vegetation types include Cropland (CRO), Evergreen Broadleaf Forest (EBF), Deciduous Broadleaf Forest (DBF), Evergreen Needleleaf Forest (ENF), Shrubland (SHR), and Grassland (GRA).
Remotesensing 16 00479 g003
Figure 4. Average distribution of LCC in 2020 in Sichuan Province (a) and different vegetation types (b). In (b), vegetation types include Cropland (CRO), Evergreen Broadleaf Forest (EBF), Deciduous Broadleaf Forest (DBF), Evergreen Needleleaf Forest (ENF), Shrubland (SHR), and Grassland (GRA).
Remotesensing 16 00479 g004
Figure 5. Average LCC with different stratifications of influencing factors (red is the highest value of each stratification, blue is the lowest value).
Remotesensing 16 00479 g005
Figure 6. Spatial distribution relationship among elevation, vegetation types, temperature, LAI, and LCC (the red box is the area of the second elevation stratification in Figure 5). (a) LCC; (b) vegetation types; (c) temperature; (d) LAI.
Remotesensing 16 00479 g006
Figure 7. Q-values in different months of influencing factors (red is the highest value of each month, blue is the lowest value).
Remotesensing 16 00479 g007
Figure 8. Q-values in different climate zones of influencing factors (red is the highest value of each zone, blue is the lowest value).
Remotesensing 16 00479 g008
Figure 9. Distribution of influencing factors in different climate zones (the blue line frame is the plateau climate zone, the green line frame is the subtropical semi-humid climate zone, and the red line frame is the central humid climate zone). In (b), vegetation types include Cropland (CRO), Evergreen Broadleaf Forest (EBF), Deciduous Broadleaf Forest (DBF), Evergreen Needleleaf Forest (ENF), Shrubland (SHR), and Grassland (GRA). (a) LCC; (b) vegetation types; (c) temperature; (d) precipitation; (e) net solar radiation; (f) elevation.
Remotesensing 16 00479 g009
Table 1. Information on influencing factors.
Influencing Factor TypeInfluencing FactorTemporal ResolutionUnit
Terrain FactorsElevationYearm
SlopeYear°
AspectYear°
Meteorological and Soil FactorsTemperatureMonthly°C
Net Solar RadiationMonthlyJ/m2
PrecipitationMonthlymm
Soil Moisture ContentMonthlyVolume Fraction
Vegetation FactorsVegetation TypesYear-
LAIEight Days-
Table 2. Interaction type of combined variables.
Types of InteractionsMeaning
q X 1 X 2 < M i n q X 1 , q X 2 Non-linear Weakening
M i n q X 1 , q X 2 < q X 1 X 2 < M a x q X 1 , q X 2 Single Factor Non-linear Weakening
q X 1 X 2 > M a x q X 1 , q X 2 Two-factor Enhancement
q X 1 X 2 = q X 1 + q X 2 Independent
q X 1 X 2 > q X 1 + q X 2 Non-linear Enhancement
Table 3. Degree of influence of influencing factors.
Influencing Factor TypeInfluencing Factorq-Value (%)p-Value
Terrain FactorsElevation49.312.96 × 10−10
Slope2.873.60 × 10−11
Aspect0.764.80 × 10−10
Meteorological and Soil FactorsTemperature46.106.33 × 10−10
Net Solar Radiation28.602.39 × 10−10
Precipitation15.153.05 × 10−10
Soil Moisture Content16.303.09 × 10−10
Vegetation FactorsVegetation Types40.738.52 × 10−10
LAI23.398.63 × 10−10
Table 4. Q-values of each pair of influencing factors.
Influencing FactorElevationSlopeAspectTemperatureNet Solar RadiationSoil Moisture ContentPrecipitationVegetation TypesLAI
Elevation ne. *ne.te.te.te.te.te.te.
Slope52.37% ne.te.ne.ne.ne.ne.ne.
Aspect50.27%3.72% te.ne.te.te.te.ne.
Temperature52.12%48.39%46.83% te.te.te.te.te.
Net solar radiation51.88%23.46%17.06%47.53% te.te.te.te.
Soil Moisture Content50.75%19.78%17.05%48.14%30.36% te.te.te.
Precipitation52.65%32.30%28.91%51.31%36.44%35.82% te.te.
Vegetation Types56.37%43.82%41.24%54.34%44.60%44.80%46.94% te.
LAI54.30%30.36%25.10%52.57%29.71%36.51%42.80%46.74%
* ne.: non-linear enhancement; te.: two-factor enhancement. Bold font represents non-linear enhancement and its corresponding q-values.
Disclaimer/Publisher’s Note: The statements, opinions and data contained in all publications are solely those of the individual author(s) and contributor(s) and not of MDPI and/or the editor(s). MDPI and/or the editor(s) disclaim responsibility for any injury to people or property resulting from any ideas, methods, instructions or products referred to in the content.

