
Assessing the Sensitivity of Snow Depth Simulations to Land Surface Parameterizations within Noah-MP in Northern Xinjiang, China


1
School of Geography and Tourism, Anhui Normal University, Wuhu 241002, China
2
Key Laboratory of Remote Sensing of Gansu Province, Northwest Institute of Eco-Environment and Resources, Chinese Academy of Sciences, Lanzhou 730000, China
*
Author to whom correspondence should be addressed.
Remote Sens. 2024, 16(3), 594; https://doi.org/10.3390/rs16030594
Submission received: 22 December 2023
/
Revised: 23 January 2024
/
Accepted: 29 January 2024
/
Published: 5 February 2024
(This article belongs to the Special Issue Land-Atmosphere Interactions and Effects on the Climate of the Tibetan Plateau and Surrounding Regions III)
Abstract
:Snow cover plays a crucial role in the surface energy balance and hydrology and serves as a key indicator of climate change. In this study, we conducted an ensemble simulation comprising 48 members generated by randomly combining the parameterizations of five physical processes within the Noah-MP model. Utilizing the variance-based Sobol total sensitivity index, we quantified the sensitivity of regional-scale snow depth simulations to parameterization schemes. Additionally, we analyzed the spatial patterns of the parameterization sensitivities and assessed the uncertainty of the multi-parameterization scheme ensemble simulation. The results demonstrated that the differences in snow depth simulation results among the 48 scheme combinations were more pronounced in mountain regions, with melting mechanisms being the primary factor contributing to uncertainty in ensemble simulation. Contrasting mountain regions, the sensitivity index for the physical process of partitioning precipitation into rainfall and snowfall was notably higher in basin areas. Unexpectedly, the sensitivity index of the lower boundary condition of the physical process of soil temperature was negligible across the entire region. Surface layer drag coefficient and snow surface albedo parameterization schemes demonstrated meaningful sensitivity in localized areas, while the sensitivity index of the first snow layer or soil temperature time scheme exhibited a high level of sensitivity throughout the entire region. The uncertainty of snow depth ensemble simulation in mountainous areas is predominantly concentrated between 0.2 and 0.3 m, which is significantly higher than that in basin areas. This study aims to provide valuable insights into the judicious selection of parameterization schemes for modeling snow processes.
1. Introduction
As a fundamental element of the cryosphere, snow cover exerts a substantial influence on various aspects of the earth’s systems; it plays a significant role in modulating the surface energy balance, hydrological processes, and atmospheric circulation [1,2,3]. Moreover, snow cover stands as a critical bellwether of climate change, exhibiting a rapid response to its evolving patterns. In many regions, it plays a crucial role as a vital freshwater resource essential for both human sustenance and socioeconomic development, thereby holding a central position in the pursuit of global sustainability [4,5,6,7]. Furthermore, the inherent characteristics of this specialized land surface exert a significant influence on the energy and water cycles within the terrestrial environment [8,9,10]. For instance, the high albedo of snow-covered surfaces adjusts the amount of solar radiation reaching the Earth’s surface, consequently influencing the exchange of energy between the land and the atmosphere [11,12]. The low thermal conductivity of snow has a profound effect on soil temperatures by insulating the soil surface from direct atmospheric contact [13]. Additionally, the melting patterns of snow are critical factors in the occurrence of natural disasters, such as flooding and avalanches [14,15]. Thus, a comprehensive understanding of the temporal and spatial variations in snow cover is crucial for estimating snowmelt runoff, issuing snow-related disaster warnings, and advancing our knowledge of atmospheric circulation.
Land surface models (LSMs) serve as invaluable tools for examining the temporal and spatial dynamics of snow cover. The incorporation of a snow process module into many LSMs and hydrology models has proven effective in achieving satisfactory snow simulation results [16,17]. However, it is noteworthy that LSMs exhibit varying levels of simulation accuracy, with disparities often observed even within the same model across different regions. This variability can be attributed to the inherent characteristics and applicability of individual LSMs. The use of parameterizations is a common strategy to represent diverse physical processes, including snow surface albedo, runoff, and dynamic vegetation. Notably, selecting different parameterizations for the same physical process can lead to discernible differences in simulation outputs [10,18,19]. Essentially, parameterization comprises a set of mathematical equations designed to capture a special physical process, with the parameters within these equations serving as adjustable numerical values [6,20]. Understanding and accounting for these inherent model characteristics and parameterizations are critical considerations in ensuring the reliability and applicability of LSMs in diverse geographical contexts [13]. Divergent simulation outputs resulting from various mathematical equations for a given physical process pose a substantial obstacle to a comprehensive understanding of the cryosphere’s response to climate change. This limitation impedes the elucidation of intricate interactions between the land surface and the atmosphere. As a result, the selection of appropriate parameterizations for LSMs becomes a pressing concern.
The Noah-MP model, an advanced iteration building upon the Noah model, addresses this challenge by incorporating two to four innovative parameterization schemes for identical physical processes, enhancing the model’s applicability [10,12,21]. The inclusion of multiple parameterization schemes in the Noah-MP model offers a convenient avenue for exploring the sensitivity of model outputs to the option of parameterization schemes [18,20]. This has garnered attention in the hydrology and meteorological communities, with researchers keen on unraveling the impact of alternative parameterization schemes on critical physical processes. A study comprising 288 experiments utilized multi-parameterization schemes for six physical processes across ten hydrologic regions in China, revealing varying sensitivities and optimal parameterization schemes for different variables and regions [22]. On a site scale, the benchmarking method was employed to identify the optimal combination of parameterization schemes within the Noah-MP model based on sensitivity experiments of heat simulations [23]. Sensitivity analysis methods, such as those investigating heat flux simulations, have revealed that sensitive parameterization schemes introduce greater uncertainties, enabling researchers to identify schemes that could potentially impact model performance [18]. Various sensitivity analysis methods, including qualitative assessments and the Sobol total sensitivity index, have been employed to evaluate the impact of parameterizations on sensible heat flux, latent heat flux, and net ecosystem exchange [18,20]. Results demonstrated inconsistent sensitivities across sites, emphasizing the need for region-specific evaluations [24]. Among numerous sensitivity analysis methods, the Sobol variance analysis method [25] stands out as a particularly effective choice for exploring parameterization sensitivity, both in small watersheds and large-scale regions. This method not only demonstrates exceptional robustness but also produces reliable sensitivity calculation results [20,26]. Another notable advantage of this method is its independence from observational data in assessing the sensitivity of parameterization schemes; sensitivity calculations rely solely on ensemble simulation results. In the context of snow processes, the Noah-MP model was employed to simulate snow, and a physics ensemble simulation experiment was conducted to analyze the sensitivity of snow simulations to parameterization schemes [10,27]. Although sensitive parameterization schemes were identified and optimal combinations determined, addressing the regional-scale sensitivity of parameterization schemes remained a pressing concern. To address this gap, we utilized the Sobol total sensitivity index in 48 Noah-MP physics-ensemble simulations driven by the China Meteorological Forcing Dataset (CMFD) in Northern Xinjiang, China. Conducting sensitivity analysis, we determined uncertainty intervals and investigated their origins, with the goal of offering a valuable reference for the simulation of snow processes.
The paper is structurally organized as follows: Section 2 provides an overview of the study area, the regional atmospheric forcing data, the design of numerical experiments, and the employed sensitivity analysis method. In Section 3, we showcase the simulation results of snow depth using the default parameterization scheme combination, delve into the sensitivity of parameterization schemes, and establish the uncertainty interval within ensemble simulations. Finally, Section 4 succinctly summarizes the findings derived from this study.
2. Materials and Methods
2.1. Study Area and Data
The research is focused on the northern Xinjiang region, spanning from 79.0° to 92.0°E and 42.0° to 50.0°N, situated along the northwest border area of China. This region boasts diverse topography, with the Altay Mountains in the north and the Tianshan Mountains in the south, reaching a maximum elevation of 7440 m. The central portion comprises the Junggar basin, maintaining an average elevation of 400 m. Terrain heights across Northern Xinjiang are depicted in Figure 1. The climate in this area is characterized as a temperate continental climate, owing to its unique geographical location in the Eurasian continent’s hinterland [28]. Influenced by Siberian circulation, the region experiences a cold and snowy winter, with snow cover persisting for approximately 120 days from November to March. In certain areas, this snow cover can endure until May [28,29]. This climatic profile renders the study area ideal for investigating the regional-scale sensitivity of snow simulations to parameterization schemes, given its abundant snow resources.
In this study, the Noah-MP model was driven by the China Meteorological Forcing Dataset (CMFD) [30], covering the period from 1 October 2012 to 30 September 2013. Developed by the hydrometeorological research group at the Institute of Tibetan Plateau Research, Chinese Academy of Sciences, the CMFD is a comprehensive dataset that includes seven critical meteorological variables: pressure, precipitation, wind speed, specific humidity, near-surface air temperature, and downward shortwave and longwave radiation. Renowned for its precision, this dataset integrates observations from 740 operational stations of the China Meteorological Administration with data from Princeton meteorological forcing, the Global Land Data Assimilation Systems (GLDAS) reanalysis, the precipitation products of the Tropical Rainfall Measuring Mission (TRMM), and the radiation data obtained from the Global Energy and Water Cycle Experiment—Surface Radiation Budget (GEWEXSRB) [31]. The CMFD utilized in this study provides comprehensive coverage across the entire geographical expanse of China, boasting a spatial resolution of 0.1 degree and a temporal resolution of 3 h. To enhance experimental precision, the MicroMet approach [32] was employed to downscale the atmospheric forcing data. This approach relies on the correlations between meteorological variables and topography. Through this methodology, we successfully derived a refined set of forcing data with an improved spatial resolution of 0.05 degrees and a heightened temporal resolution of 1 h.
2.2. Simulation Setups
The Noah-MP model was enhanced by incorporating recent advancements in physics from the land surface models (LSMs) of Noah [33,34]. Various parameterization schemes were integrated into distinct physical processes, with details provided in Table 1, making the model have stronger applicability [10,21]. Our prior research revealed that simulated snow depth and snow water equivalent exhibit sensitivity to parameterization schemes, particularly those related to surface layer drag coefficient (SFC), snow surface albedo (ALB), partitioning of precipitation into rainfall and snowfall (PCP), lower boundary condition of soil temperature (TBOT), and the first snow layer or soil temperature time scheme (TEMP) [10,27]. Although we have determined that the physical processes SFC and TEMP demonstrated high sensitivity across various snow climates and that the choice of different parameterization schemes for these processes led to substantial variations in simulation results, the distribution of parameterization scheme sensitivity on a regional scale is still unknown. Therefore, we generated a total of 48 scheme combinations by randomly combining parameterization schemes of these five physical processes, allowing us to quantify the sensitivity of simulated snow depth to parameterization schemes on a regional scale.
The meteorological forcing data used to drive the Noah-MP model were from the CMFD dataset. Standard soil and vegetation parameters, including the monthly leaf area index, were derived from the soil and vegetation type data using the Noah-MP default lookup tables [35]. Additional hard-coded parameters of Noah-MP, as specified by reference [35], adopted default values manually calibrated by parameterization developers [36,37]. These datasets have been extensively used in continental hydrological simulations and have demonstrated reasonable accuracy [37,38,39]. Building upon our previous research revealing the sensitivity of snow simulations to various parameterization schemes for physical processes SFC, ALB, PCP, TBOT, and TEMP across diverse climates [10,27], this study randomly combined parameterization schemes for these five physical processes while maintaining default settings for the other seven physical processes, resulting in a total of 48 scheme combinations. To ensure soil-state equilibrium—a prerequisite for effective initialization—we employed forcing data from 1 October 2011 to 30 September 2012. The equilibrium criterion, stipulating that the time when the difference in annual means between consecutive single-year simulations is less than 0.1% of the mean, was rigorously applied [37,40]. All simulations spanned one snow period, with snow depth output recorded at an hourly interval. The hourly outputs were aggregated into monthly values, and then the monthly means were analyzed using Sobol’s total sensitivity index.
2.3. Analysis and Evaluation Methods
In this study, the sensitivity analysis utilized the variance-based Sobol’s total sensitivity index as proposed by Saltelli et al. [41] to quantify the impact of parameterization schemes for the five aforementioned physical processes on snow depth simulations. The calculation of sensitivity indices involved a structured series of steps.
Initially, we employed the various parameterization scheme combinations to derive 48 individual snow season averaged snow depth (SD) values, denoted as , . Simultaneously, the mean and variance of the 48 values were promptly calculated.
Secondly, the Sobol total sensitivity of the parameterization schemes for a given physical process, denoted as , was computed using the following equation:
Here represents the Sobol total sensitivity for the parameterization of a given process, . Additionally, denotes all processes except , signifies the snow depth simulations of the 48 scheme combinations, is the variance of the 48 snow depth simulations, represents the variance caused by different parameterization schemes of , and represents the arithmetic average across all scheme combinations of the parameterizations other than . To illustrate, consider the physical process of PCP, which comprises three parameterization schemes. The 48 values were categorized into 16 groups, where the parameterization schemes for SFC, ALB, TBOT, and TEMP processes remained constant, differing only in the PCP parameterization. Each group yielded three values corresponding to the three PCP schemes (Jordan91, BATS, and Noah). For instance, if the parameterization schemes for SFC, ALB, TBOT, and TEMP are M-O, BATS, Jordan 91, Noah, and Semi-implicit, respectively, in one group, the variance of the three PCP schemes () was calculated, with a denominator value of 3 for each of the 16 groups, . The mean of these 16 values was calculated and denoted as . Further details about this method can be found in reference [20]. The Sobol total sensitivity index’s greatest strength lies in accounting for the variance of model outputs resulting from different parameterization schemes for a given physical process. The normalized value, ranging from 0 to 1, indicates the level of sensitivity of simulations to parameterization schemes. A larger value implies high sensitivity, while approaching zero suggests that the parameterization has minimal influence on the simulations.
3. Results and Discussion
3.1. Results of Snow Depth Ensemble Simulations
The CMFD dataset served as the driving force for the 48 scheme combinations, resulting in snow depth simulations across Northern Xinjiang. As illustrated in Figure 2, it displays the annual average snow depth from the 48 ensemble simulations and the variance in the snow depth ensemble simulations. The annual average snow depth reveals a predominant distribution in the mountain regions, particularly evident in the Tianshan and Altay Mountains, where the maximum annual average snow depth approaches 2 m, primarily concentrated in the southern part of Tianshan Mountain. Conversely, the Junggar Basin exhibits significantly lower snow depths, attributed to the arid and semi-arid climate characteristics in Northern Xinjiang. The possible reasons for this phenomenon could be that the colder temperatures in the mountainous regions facilitate snow preservation, while the warmer and drier conditions in the basin contribute to snow sublimation and melting. The simulation results employing the 48 scheme combinations align with the spatial distribution of average snow depth, corresponding to the snow distribution characteristics in Northern Xinjiang. This alignment underscores the Noah-MP model’s ability to accurately simulate snow processes in the region. Importantly, we refrain from comparing the averaged snow depth results of multiple scheme combinations with the corresponding snow depth observational data in this study. Model performance evaluation has been addressed in previous research, specifically assessing the snow simulation capabilities of the Noah-MP model in Northern Xinjiang, China [27]. Our focus here is solely on discerning differences in simulation results among different combination schemes within the Noah-MP model.
The right subfigure of Figure 2 displays the variance of the 48 ensemble simulations. Examining the figure reveals a maximum variance of 0.10 m (the values of individual pixels are not shown in the figure) and a minimum of 0 m. Most areas exhibit a variance in snow depth simulation results below 0.02 m, particularly notable in the Junggar basin region. In contrast, the variance in the Tianshan Mountains region is relatively pronounced, with many areas having variance values around 0.03 m. Additionally, significant variances are observed in the southern part of the Tianshan Mountains and the southeastern part of the Altay Mountains. These findings indicate substantial differences in snow depth simulation results within the Northern Xinjiang mountainous area among different combinations of the Noah-MP model. This phenomenon can be attributed to two factors. Firstly, thicker snow in mountainous areas corresponds to larger errors. For instance, with a 10% error, the resulting errors for snow depths of 10 cm and 50 cm are 1 cm and 5 cm, respectively, illustrating significant differences. Secondly, distinct scheme combinations governing snow accumulation and melting mechanisms contribute to notable differences in snow depth simulation results. Despite these variations, the right subfigure highlights a relatively small variance in the northern region of the Altay Mountains. While located in a high-altitude mountainous region, the snow depth variance in this area is notably smaller than in the southeastern region of the Altay Mountains. This phenomenon may be attributed to relatively minor differences in simulated snow depth results among the 48 scheme combinations in this region, resulting in a reduced variance. Consequently, it underscores the importance of further investigating the sensitivity of different parameterization schemes at the regional scale.
3.2. Spatial Patterns of the Parameterization Sensitivities
In our previous study, a qualitative analysis was undertaken, establishing that the modeled snow depth exhibited sensitivity to the parameterizations of the physical processes SFC, ALB, PCP, TBOT, and TEMP. In this current study, we extend our analysis to quantify the sensitivity of modeled snow depth to these parameterizations in Northern Xinjiang. The 48 scheme combinations were randomly generated by incorporating options for the five sensitive physical processes. Figure 3 illustrates the Sobol total sensitivity of the modeled snow depth to these five physical processes, showcasing the parameterization sensitivity patterns across Northern Xinjiang. Higher values in the figure indicate greater sensitivities. As depicted in Figure 3, the sensitivity patterns of these parameterizations display significant differences. Two parameterization schemes are assigned for the physical process of SFC, and the choice between these two schemes notably influences the simulated surface layer drag coefficient. The first scheme incorporates the zero-displacement height, while the second considers the difference between roughness length for heat and momentum in calculating the surface layer drag coefficient, leading to substantial variations in t water and energy computations in the model. In Figure 3, Sobol sensitivity indices in most areas of Northern Xinjiang are below 0.1, with many regions showing indices at zero, indicating weak sensitivity of surface physical processes in the majority of the region. However, higher Sobol sensitivity indices are observed in the eastern part of the Tian Shan region, reaching a maximum of 0.5. This indicates a stronger sensitivity of surface physical processes in that area, highlighting significant variations in simulated snow depth results when utilizing different parameterization schemes for the surface. Additionally, localized areas near the western part of the Altay Mountains exhibit slightly higher Sobol indices than other regions, averaging around 0.3. This suggests stronger sensitivity of the physical process SFC, specifically in the eastern part of the Tianshan Mountain region, while its sensitivity is weaker in other areas of Northern Xinjiang.
The control of solar radiation entering the snowpack by snow surface albedo significantly influences the energy balance, potentially leading to snowmelt. Snow surface albedo schemes within Noah-MP, specifically the BATS and CLASS schemes, play a distinct role in regulating snow depth, with the CLASS scheme set as the default due to its presumed smaller snow surface albedo resulting from a stronger aging effect. Figure 3 shows notable spatial variations in the Sobol sensitivity index for the ALB process, with a maximum index value of 0.4, primarily in the Tianshan Mountains. Sensitivity indices for most areas in Northern Xinjiang are below 0.1, while the northeast of the Junggar Basin and the east of the Tianshan Mountains show relatively high indices, ranging from 0.3 to 0.4. Overall, ALB exhibits strong sensitivity in mountainous areas at higher altitudes, particularly concentrated in the eastern and southern parts of Northern Xinjiang. In our previous study, the physical process of PCP demonstrated sensitivity at the site scale across various snowfall climates [10]. Altering the parameterization scheme for this particular process can significantly impact the simulation outcomes of snow depth. PCP encompasses three distinct parameterization schemes that categorize precipitation into rain and snow, contingent on diverse temperature thresholds. The first scheme of PCP is the Jordan scheme, which incorporates relatively complex functions. The second scheme divides all precipitation into snowfall when (the and are the air temperature and freezing point, respectively), while in other cases, it is divided into rainfall in the second scheme. The third scheme of PCP divides precipitation into snowfall when , while all other situations are classified as rainfall. While these three parameterization schemes share a minimal distinction in essence, their respective calculation methods reveal noteworthy disparities in the model’s snow simulation outcomes, especially in situations where near-surface air temperatures frequently oscillate around the freezing point. As illustrated in Figure 3, regions with relatively high Sobol sensitivity indices are concentrated in the Junggar Basin, north of the Tianshan Mountains, and in the northern part of Xinjiang, with the maximum index value reaching approximately 0.4. Notably, Sobol sensitivity indices in most areas of northern Xinjiang are low, approaching zero in many regions, particularly in the mountainous areas of the Tianshan Mountains. This observation indicates that unlike the physical process ALB, the sensitivity of the physical process PCP does not escalate with altitude. The primary reason is that the three parameterization schemes of the physical process PCP classify precipitation into varying proportions of rain and snow based on temperature range. In the mountainous regions of northern Xinjiang during the snow cover period, where temperatures are significantly lower than the freezing point, all three schemes classify precipitation as snow. Consequently, the physical process of PCP does not exhibit significant sensitivity in higher-altitude areas. However, in the Junggar Basin, located in a lower-altitude, dry area, temperatures during the snowmelt period fluctuate around the freezing point, leading to notable differences in snow simulation results when different parameterization schemes are chosen. In summary, selecting the appropriate parameterization scheme for the physical process PCP is crucial for accurately simulating snow depth in Northern Xinjiang.
While Tukey’s test sensitivity method was previously utilized to assess TBOT sensitivity under diverse snow climate conditions at specific sites, a tentative sense emerged that simulation results for snow depth might not be notably sensitive to the physical process of TBOT. Our earlier statistical investigations, despite detecting sensitivity at all sites using Tukey’s test method, suggested that the differences in snow depth simulation results arising from two distinct TBOT parameterization schemes were not statistically significant. Figure 3 presents quantitative sensitivity outcomes in Northern Xinjiang, yielding genuinely surprising results. The maximum value of the Sobol sensitivity index across the entire region is 0.05, with only a few pixels achieving the maximum sensitivity index. Remarkably, the sensitivity index for the physical process TBOT throughout the entire Northern Xinjiang region is essentially zero. This finding appears to contradict the results of the study by You et al. [10], where Tukey’s test method examined TBOT sensitivity in eight sites under different snow climates. Further analysis reveals that, on one hand, Tukey’s test scrutinizes the sensitivity of parameterization schemes at the point scale from a microscopic perspective, overlooking spatial heterogeneity. On the other hand, a meticulous comparison of the sample ensembles used for Tukey’s test in the study by You et al. [10] shows that the mean, median, and kernel density distribution of the sample ensemble at most sites are highly similar, with minimal differences between sets. Consequently, it can be concluded that the choice of different parameterization schemes for the physical process TBOT is unlikely to significantly impact the simulation results of snow depth at the regional scale, at least in Northern Xinjiang.
Figure 3 highlights the significant sensitivity of the modeled snow depth to the TEMP parameterization, evident across nearly the entire area. Sobol sensitivity indices in Figure 3 consistently approach 1 for the physical process TEMP throughout the region, with indices reaching approximately 0.6 in specific areas of the Junggar Basin. Notably, areas where these indices approach zero coincide with significant water bodies, falling outside the domain of land surface models. TEMP has long been recognized as a crucial factor influencing snow depth simulation outcomes, contributing significantly to the uncertainty in multi-parameterization scheme ensemble simulations. The parameterization schemes in question revolve around solving the heat conduction equation for soil/snow temperature in the first layer, with two options employing different boundary conditions based on temperature and fluxes. Our prior investigations reveal that opting for TEMP (1) results in rapid snow ablation, while opting for TEMP (2) results in slower snow ablation.
3.3. Uncertainty Analysis of Physical Parameterization Schemes
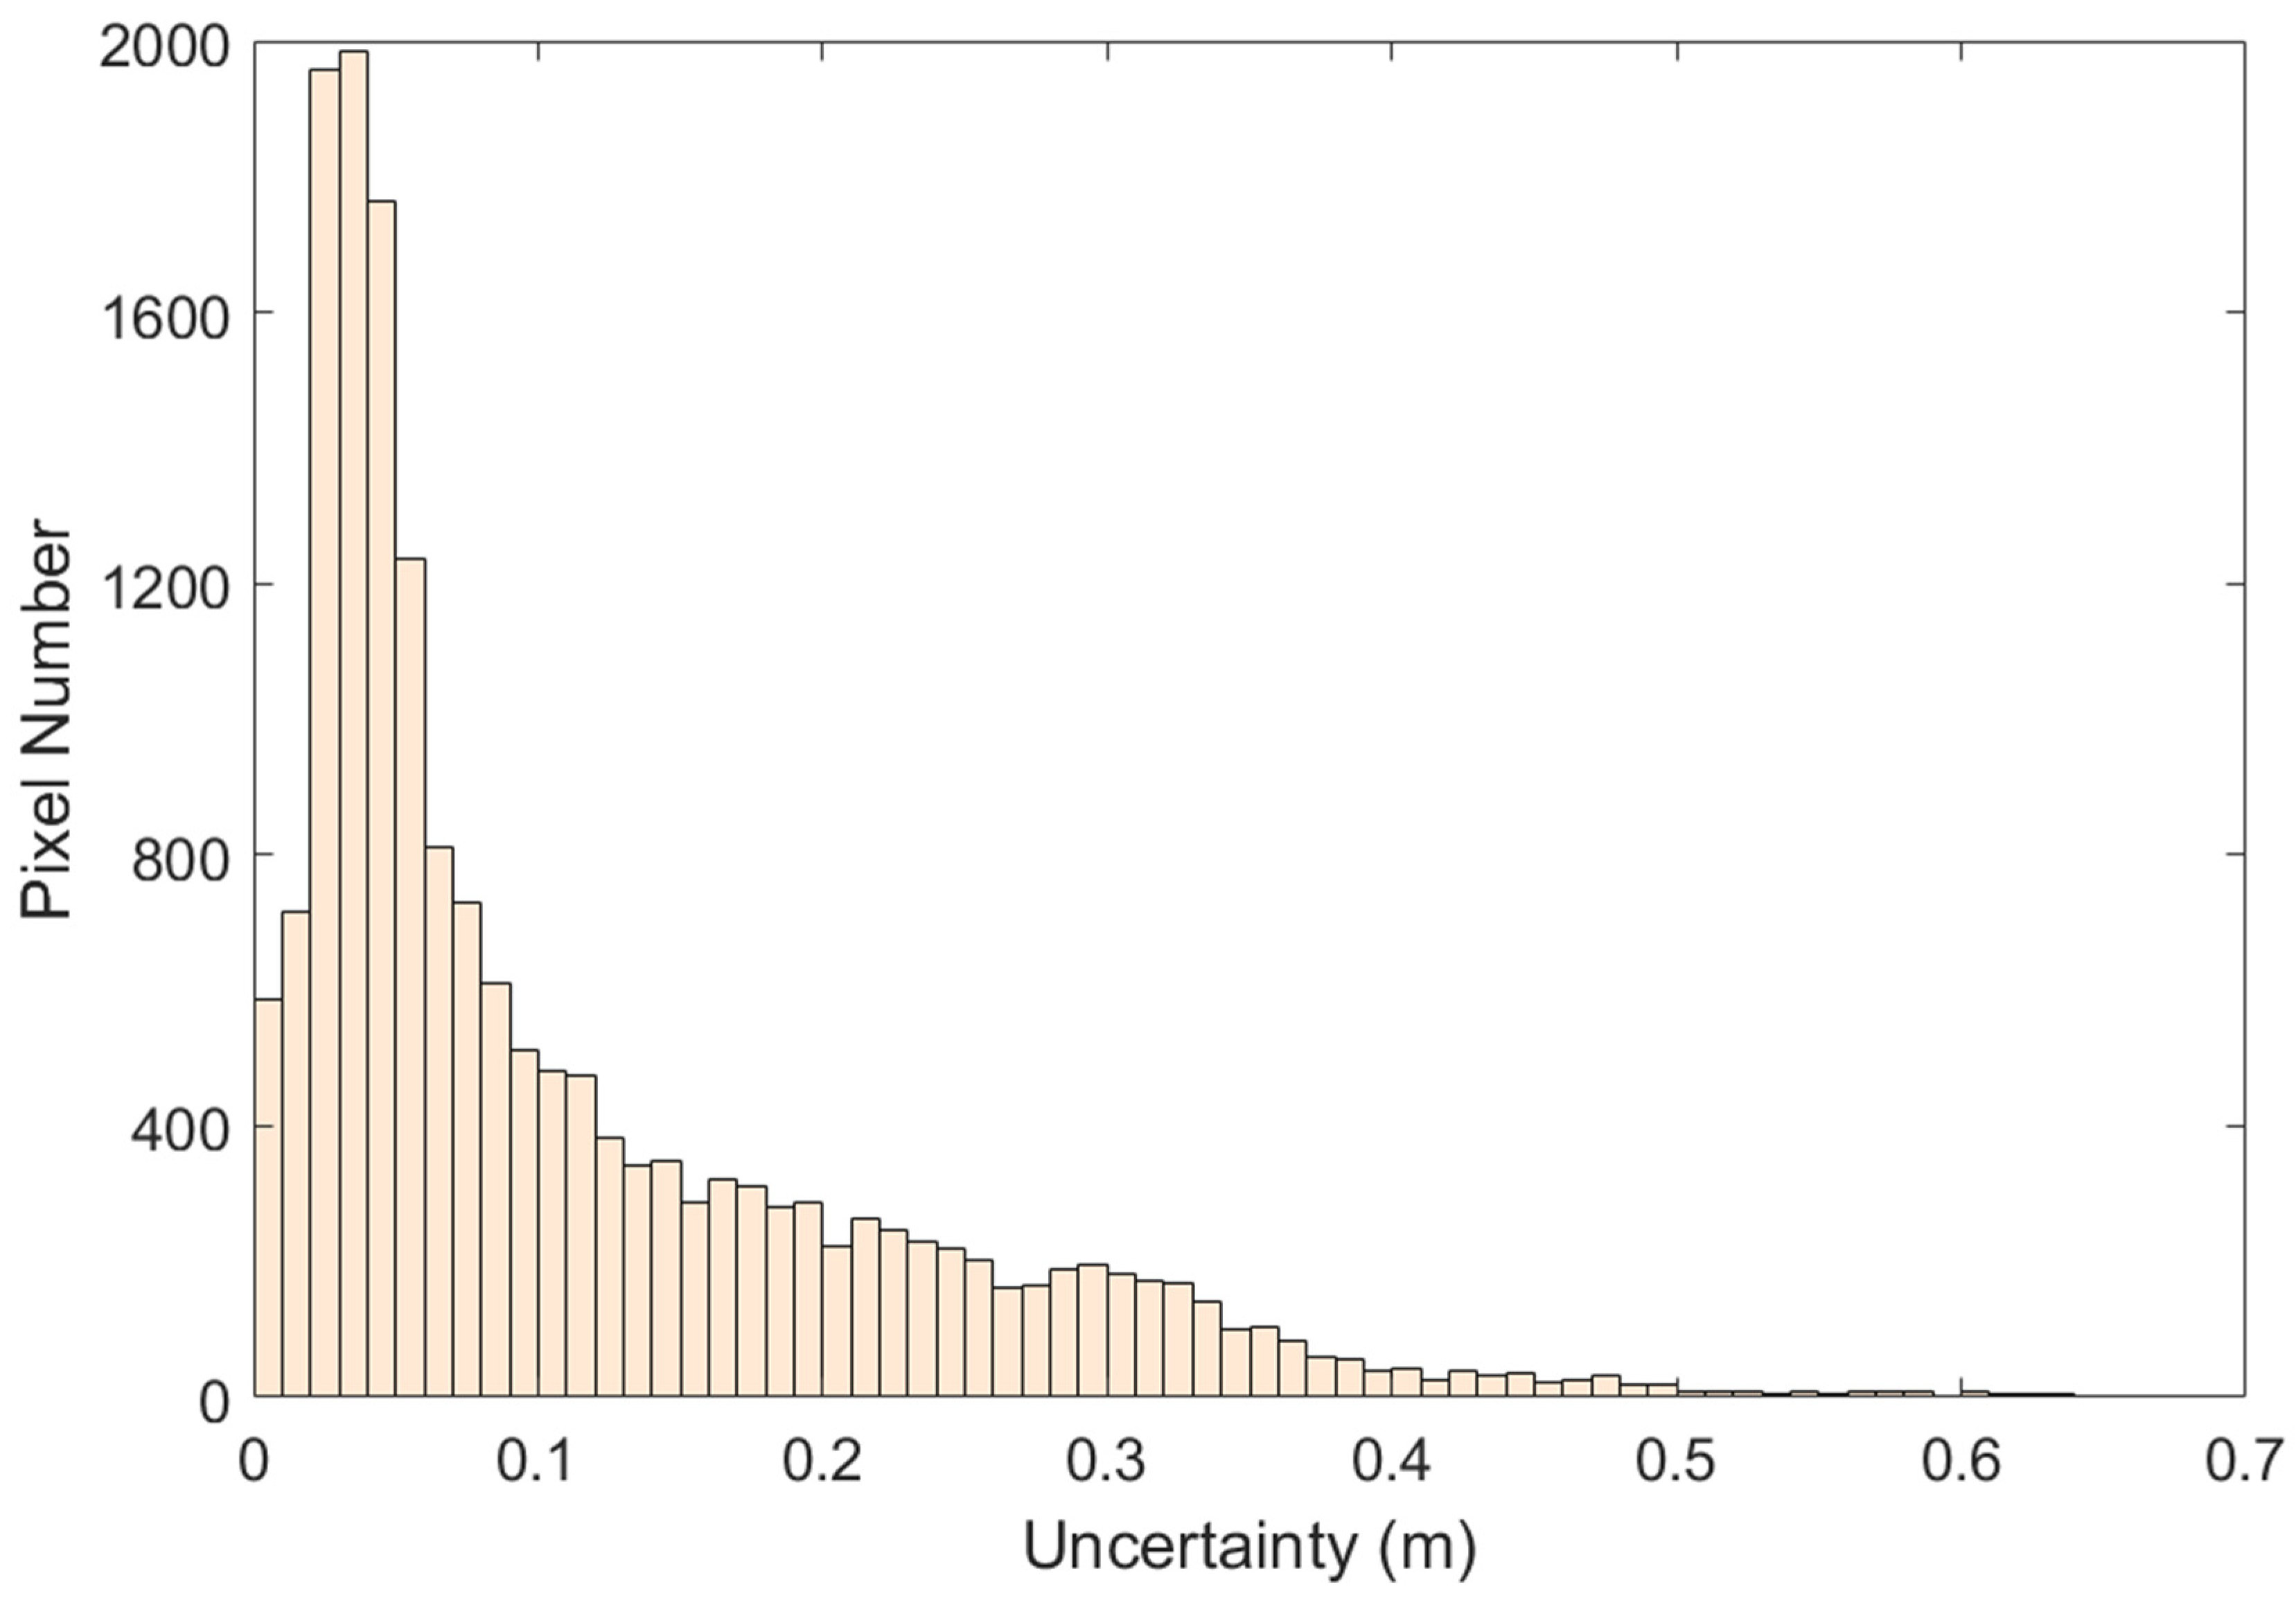
Expanding on the sensitivity analysis of quantified parameterization schemes, we proceeded to quantify uncertainty in the simulated outcomes of a multi-parameterized scheme ensemble for snow depth in Northern Xinjiang. Figure 4 illustrates the uncertainty in snow depth simulation results for 48 combination schemes. Notably, most areas in Northern Xinjiang exhibit small uncertainties, gradually increasing with altitude. For instance, the Tianshan Mountains region displays significantly higher uncertainty compared to the Junggar Basin, ranging mostly from 0.2 to 0.4 m. In local mountainous areas, the uncertainty in snow depth can exceed 0.5 m. This discrepancy is attributed to both the greater snow depth in mountainous regions, leading to relatively larger errors, and the selection of different parameterization schemes for specific physical processes, causing significant variations in snowmelt mechanisms. The 48 combinations, derived through the permutation and combination of parameterization schemes for five sensitive physical processes, underscore the impact of model structure on simulation results. Figure 4 emphasizes that regions with higher uncertainties are concentrated in high-altitude areas such as the Tianshan Mountains and Altay Mountains, suggesting that distinctions between parameterization schemes are primarily manifested during the snowmelt stage. While different combinations of schemes result in diverse snowmelt mechanisms, areas with lower altitudes and less snow accumulation exhibit comparatively smaller uncertainties in the overall simulation results for the multi-parametric scheme ensemble. Figure 5 delves into the number of pixels within different uncertainty intervals in Northern Xinjiang. The majority of pixels have an uncertainty range for snow depth below 0.1 m, with the highest number falling within the 0.02–0.04 m range, indicating generally low uncertainty in simulated snow depth. This may stem from the small amount of accumulated snow in these pixels, resulting in minimal errors or negligible differences among the 48 scheme combinations. Additionally, the figure reveals a considerable number of pixels with a snow depth simulation uncertainty range exceeding 0.1 m, signifying substantial variations in simulated snow depth results in certain areas due to the sensitivity of parameterization schemes. These differences may arise from the varied snow accumulation and melting mechanisms associated with the diverse combination schemes.
4. Conclusions
In this study, our focus was on quantifying the spatial patterns of parameterization sensitivities across Northern Xinjiang, coupled with an examination of the uncertainty in simulated snow depth arising from different parameterization scheme combinations. We accomplished this by creating a simulation ensemble that combined various parameterization schemes and used the Sobol total sensitivity index. The subsequent section outlines the primary findings derived from this study.
Notably, in contrast to the basin region, the variations in snow depth simulation outcomes among the 48 combination schemes exhibit more pronounced distinctions in the mountainous region. Additionally, the ensemble’s snow depth simulation results demonstrate a greater variance in the mountainous region compared to the basin area. While the sensitivity of parameterization schemes is well established in single-point experiments, the quantified results in northern Xinjiang reveal noteworthy distinctions in key parameterization schemes influencing snow simulation. The sensitivity index of the PCP parameterization scheme is consistently high across northern Xinjiang, with sensitivity indices approaching 1 in all areas, with notably higher sensitivity in the basin region compared to the mountains, especially in the central area of the Junggar Basin. In contrast, the sensitivity index of the TBOT parameterization scheme reaches a maximum value of 0.05 across the entire region, indicating low sensitivity. Additionally, the parameterization schemes for SFC and ALB exhibit sensitivity in localized areas. In contrast to the basin region, the ensemble simulation results of snow depth in mountainous regions exhibit greater uncertainty, concentrated mainly between 0.2 and 0.3 m. In the basin, the uncertainty is primarily below 0.1 m, with the majority of pixels falling within the 0.03–0.04 range. These disparities underscore substantial variations in snow accumulation and melting mechanisms among different combination schemes.
This study explores the sensitivity of regional parameterization schemes using the Noah-MP model’s ensemble simulation results and the Sobol sensitivity index calculation method. It is necessary to further investigate whether the sensitivity index calculation of parameterization schemes at the regional level is influenced by the temporal and spatial resolution of the driving data. Future research will employ data assimilation techniques to reduce the uncertainty of ensemble snow simulation results and clarify the impact of different parameterization schemes on snow process simulation. The findings of this study can serve as a reference for future ensemble simulation experiments.
Author Contributions
Methodology, Y.Y.; Software, Y.Y.; Investigation, Y.Y.; Data curation, Y.Z.; Supervision, C.H. All authors have read and agreed to the published version of the manuscript.
Funding
This research was funded by the National Natural Science Foundation of China (grant number 42130113 and 42101361) and the Key Natural Science Research Project of Anhui Provincial Colleges (grant number 2023AH050143). And The APC was funded by 42130113.
Data Availability Statement
The China Meteorological Forcing Dataset used in this study can be downloaded online in the website: https://data.tpdc.ac.cn.
Conflicts of Interest
The authors declare no conflict of interest.
References
- Barnett, T.P.; Adam, J.C.; Lettenmaier, D.P. Potential impacts of a warming climate on water availability in snow-dominated regions. Nature 2005, 438, 303–309. [Google Scholar] [CrossRef]
- Immerzeel, W.W.; Van Beek, L.P.; Bierkens, M.F. Climate change will affect the Asian water towers. Science 2010, 328, 1382–1385. [Google Scholar] [CrossRef]
- Xu, L.; Dirmeyer, P. Snow-atmosphere coupling strength in a global atmospheric model. Geophys. Res. Lett. 2011, 38, L13401. [Google Scholar] [CrossRef]
- Kumar, S.V.; Peters-Lidard, C.D.; Arsenault, K.R.; Getirana, A.; Mocko, D.; Liu, Y.Q. Quantifying the added value of snow cover area observations in passive microwave snow depth data assimilation. J. Hydrometeorol. 2015, 16, 1736–1741. [Google Scholar] [CrossRef]
- Verbunt, M.; Gurtz, J.; Jasper, K.; Lang, H.; Warmerdam, P.; Zappa, M. The hydrological role of snow and glaciers in alpine river basins and their distributed modeling. J. Hydrol. 2003, 282, 36–55. [Google Scholar] [CrossRef]
- Clark, M.P.; Kavetski, D.; Fenicia, F. Pursuing the method of multiple working hypotheses for hydrological modeling. Water Resour. Res. 2011, 47, W09301. [Google Scholar] [CrossRef]
- Clark, M.P.; Hendrikx, J.; Slater, A.G.; Kavetski, D.; Anderson, B.; Cullen, N.J.; Kerr, T.; Hreinsson, E.Ö.; Woods, R.A. Representing spatial variability of snow water equivalent in hydrologic and land-surface models: A review. Water Resour. Res. 2011, 47, W07539. [Google Scholar] [CrossRef]
- Che, T.; Li, X.; Jin, R.; Huang, C.L. Assimilating passive microwave remote sensing data into a land surface model to improve the estimation of snow depth. Remote Sens. Environ. 2014, 143, 54–63. [Google Scholar] [CrossRef]
- Kwon, Y.; Yang, Z.L.; Hoar, T.J.; Toure, A.M. Improving the radiance assimilation performance in estimating snow water storage across snow and land-cover types in North America. J. Hydrometeorol. 2017, 18, 651–668. [Google Scholar] [CrossRef]
- Yang, Z.L.; Niu, G.Y.; Mitchell, K.E.; Chen, F.; Ek, M.B.; Barlage, M.; Longuevergne, L.; Manning, K.; Niyogi, D.; Tewari, M.; et al. The community Noah land surface model with multiparameterization options (Noah-MP): 2. Evaluation over global river basins. J. Geophys. Res. 2011, 116, D12110. [Google Scholar] [CrossRef]
- Huang, C.L.; Margulis, S.A.; Durand, M.T.; Musselman, K.N. Assessment of snow grain-size model and stratigraphy representation impacts on snow radiance assimilation: Forward Modeling Evaluation. IEEE Trans. Geosci. Remote Sens. 2012, 50, 4551–4564. [Google Scholar] [CrossRef]
- You, Y.H.; Huang, C.L.; Hou, J.L.; Zhang, Y.; Wang, Z.; Zhu, G.F. Improving the estimation of snow depth in the Noah-MP model by combining particle filter and Bayesian model averaging. J. Hydrol. 2023, 617, 128877. [Google Scholar] [CrossRef]
- You, Y.H.; Huang, C.L.; Wang, Z.; Hou, J.L.; Zhang, Y.; Xu, P.P. A genetic particle filter scheme for univariate snow cover assimilation into Noah-MP model across snow climates. Hydrol. Earth Syst. Sci. 2023, 27, 2919–2933. [Google Scholar] [CrossRef]
- Gao, J.L.; Huang, X.D.; Ma, X.F.; Feng, Q.S.; Liang, T.G.; Xie, H.J. Snow disaster early warning in pastoral areas of Qinghai province, China. Remote Sens. 2017, 9, 475. [Google Scholar] [CrossRef]
- Zhu, L.L.; Zhang, Y.H.; Wang, J.G.; Tian, W.; Liu, Q.; Ma, G.Y.; Kan, X.; Chu, Y. Downscaling snow depth mapping by fusion of microwave and optical remote-sensing data based on deep learning. Remote Sens. 2021, 13, 584. [Google Scholar] [CrossRef]
- Saha, S.K.; Sujith, K.; Chaudhari, H.S.; Hazra, A. Effects of multilayer snow scheme on the simulation of snow: Offline Noah and coupled with NCEP CFSv2. J. Adv. Model. Earth Syst. 2017, 9, 271–290. [Google Scholar] [CrossRef]
- Moiz, A.; Wei, Z.W.; Naseer, A.; Kawasaki, A.; Acierto, R.A.; Koike, T. Improving snow-process modeling by evaluating reanalysis vertical temperature profiles using a distributed hydrological model. J. Geophys. Res. Atmos. 2022, 127, e2021JD036174. [Google Scholar] [CrossRef]
- Zhang, G.; Chen, F.; Gan, Y.J. Assessing uncertainties in the Noah-MP ensemble simulations of a cropland site during the Tibet Joint International Cooperation program field campaign. J. Geophys. Res. Atmos. 2016, 121, 9576–9596. [Google Scholar] [CrossRef]
- You, Y.H.; Huang, C.L.; Yang, Z.L.; Zhang, Y.; Bai, Y.L.; Gu, J. Assessing Noah-MP parameterization sensitivity and uncertainty interval across snow climates. J. Geophys. Res. Atmos. 2020, 125, e2019JD030417. [Google Scholar] [CrossRef]
- Zheng, H.; Yang, Z.L.; Lin, P.R.; Wei, J.F.; Wu, W.Y.; Li, L.C.; Zhao, L.; Wang, S. On the sensitivity of the precipitation partitioning into evapotranspiration and runoff in land surface parameterizations. Water Resour. Res. 2019, 55, 95–111. [Google Scholar] [CrossRef]
- Niu, G.Y.; Yang, Z.L.; Mitchell, K.E.; Chen, F.; Ek, M.B.; Barlage, M.; Kumar, A.; Manning, K.; Niyogi, D.; Rosero, E.; et al. The community Noah land surface model with multi-parameterization options (Noah-MP): 1. Model description and evaluation with local scale measurements. J. Geophys. Res. 2011, 116, D12109. [Google Scholar] [CrossRef]
- Gan, Y.J.; Liang, X.Z.; Duan, Q.Y.; Chen, F.; Li, J.D.; Zhang, Y. Assessment and reduction of the physical parameterization uncertainty for Noah-MP land surface model. Water Resour. Res. 2019, 55, 5518–5538. [Google Scholar] [CrossRef]
- Chang, M.; Liao, W.H.; Wang, X.M.; Zhang, Q.; Chen, W.H.; Wu, Z.Y.; Hu, Z.C. An optimal ensemble of the Noah-MP land surface model for simulating surface heat fluxes over a typical subtropical forest in South China. Agric. For. Meteorol. 2020, 281, 107815. [Google Scholar] [CrossRef]
- Yang, Q.D.; Dan, L.; Lv, M.Z.; Wu, J.; Li, W.D.; Dong, W.J. Quantitative assessment of the parameterization sensitivity of the Noah-MP land surface model with dynamic vegetation using China FLUX data. Agric. For. Meteorol. 2021, 307, 108542. [Google Scholar] [CrossRef]
- Sobolprime, I.M. Sensitivity analysis for non-linear mathematical models. Math. Model. Comput. Exp. 1993, 1, 407–414. [Google Scholar]
- Dai, H.; Ye, M.; Walker, A.P.; Chen, X.Y. A new process sensitivity index to identify important system processes under process model and parametric uncertainty. Water Resour. Res. 2017, 53, 3476–3490. [Google Scholar] [CrossRef]
- You, Y.H.; Huang, C.L.; Gu, J.; Li, H.Y.; Hao, X.H.; Hou, J.L. Assessing snow simulation performance of typical combination schemes within Noah-MP in northern Xinjiang, China. J. Hydrol. 2020, 581, 124380. [Google Scholar] [CrossRef]
- Xu, J.H.; Shu, H.; Dong, L. DEnKF-Variational Hybrid Snow Cover Fraction Data Assimilation for Improving Snow Simulations with the Common Land Model. Remote Sens. 2014, 6, 10612–10635. [Google Scholar] [CrossRef]
- Huang, X.D.; Liang, T.G.; Zhang, X.T.; Guo, Z.G. Validation of MODIS snow cover products using Landsat and ground measurements during the 2001-2005 snow seasons over northern Xinjiang, China. Int. J. Remote Sens. 2011, 32, 133–152. [Google Scholar] [CrossRef]
- He, J.; Yang, K.; Tang, W.J.; Lu, H.; Qin, J.; Chen, Y.Y.; Li, X. The first high-resolution meteorological forcing dataset for land process studies over China. Sci. Data 2020, 7, 25. [Google Scholar] [CrossRef]
- Chen, Y.; Yang, K.; He, J.; Qin, J.; Shi, J.C.; Du, J.Y.; He, Q. Improving land surface temperature modeling for dry land of China. J. Geophys. Res. 2011, 116, D20104. [Google Scholar] [CrossRef]
- Liston, G.E.; Elder, K. A meteorological distribution system for high-resolution terrestrial modeling (MicroMet). J. Hydrometeorol. 2006, 7, 217–234. [Google Scholar] [CrossRef]
- Ek, M.B.; Mitchell, K.E.; Lin, Y.; Rogers, E.; Grunmann, P.; Koren, V.; Gayno, G.; Tarpley, J.D. Implementation of Noah land surface model advances in the National Centers for Environmental Prediction operational mesoscale Eta model. J. Geophys. Res. Atmos. 2003, 108, 8851. [Google Scholar] [CrossRef]
- Chen, F.; Manning, K.W.; LeMone, M.A.; Trier, S.B.; Alfieri, J.G.; Roberts, R.; Tewari, M.; Niyogi, D.; Horst, T.W.; Oncley, S.P. Description and evaluation of the characteristics of the NCAR high-resolution land data assimilation system. J. Appl. Meteorol. Climatol. 2007, 46, 694–713. [Google Scholar] [CrossRef]
- Cuntz, M.; Mai, J.; Samaniego, L.; Clark, M.; Wulfmeyer, V.; Branch, O.; Attinger, S.; Thober, S. The impact of standard and hard-coded parameters on the hydrologic fluxes in the Noah-MP land surface model. J. Geophys. Res. Atmos. 2016, 121, 10676–10700. [Google Scholar] [CrossRef]
- Chen, F.; Dudhia, J. Coupling an advanced land surface-hydrology model with the Penn State-NCAR MM5 modeling system. Part I: Model implementation and sensitivity. Mon. Weather Rev. 2001, 129, 569–585. [Google Scholar] [CrossRef]
- Cai, X.T.; Yang, Z.L.; Xia, Y.L.; Huang, M.Y.; Wei, H.L.; Leung, L.R.; Ek, M.B. Assessment of simulated water balance from Noah, Noah-MP, CLM, and VIC over CONUS using the NLDAS test bed. J. Geophys. Res. Atmos. 2014, 119, 13751–13770. [Google Scholar] [CrossRef]
- Xia, Y.; Cosgrove, B.A.; Mitchell, K.E.; Peters-Lidard, C.D.; Ek, M.B.; Kumar, S.; Mocko, D.; Wei, H.L. Basin-scale assessment of the land surface energy budget in the National Centers for Environmental Prediction operational and research NLDAS-2 systems. J. Geophys. Res. Atmos. 2016, 121, 196–220. [Google Scholar] [CrossRef]
- Xia, Y.; Ek, M.B.; Wu, Y.; Ford, T.; Quiring, S.M. Comparison of NLDAS-2 simulated and NASMD observed daily soil moisture. Part I: Comparison and analysis. J. Hydrometeorol. 2015, 16, 1962–1980. [Google Scholar] [CrossRef]
- Gao, Y.H.; Li, K.; Chen, F.; Jiang, Y.S.; Lu, C.G. Assessing and improving Noah-MP land model simulations for the central Tibetan Plateau. J. Geophys. Res. Atmos. 2015, 120, 9258–9278. [Google Scholar] [CrossRef]
- Saltelli, A.; Annoni, P.; Azzini, I.; Campolongo, F.; Ratto, M.; Tarantola, S. Variance based sensitivity analysis of model output. Design and estimator for the total sensitivity index. Comput. Phys. Commun. 2010, 181, 259–270. [Google Scholar] [CrossRef]
Figure 1.
The terrain heights in Northern Xinjiang, China.

Figure 2.
The snow depth simulation results from multi-parameterization scheme combinations. (Left) is the annual average snow depth of 48 ensemble simulations, and the (right) figure is the variance of 48 ensemble simulations.
Figure 2.
The snow depth simulation results from multi-parameterization scheme combinations. (Left) is the annual average snow depth of 48 ensemble simulations, and the (right) figure is the variance of 48 ensemble simulations.

Figure 3.
The Sobol total sensitivity of the simulated snow depth to the five parameterizations; higher values indicate higher sensitivities.
Figure 3.
The Sobol total sensitivity of the simulated snow depth to the five parameterizations; higher values indicate higher sensitivities.
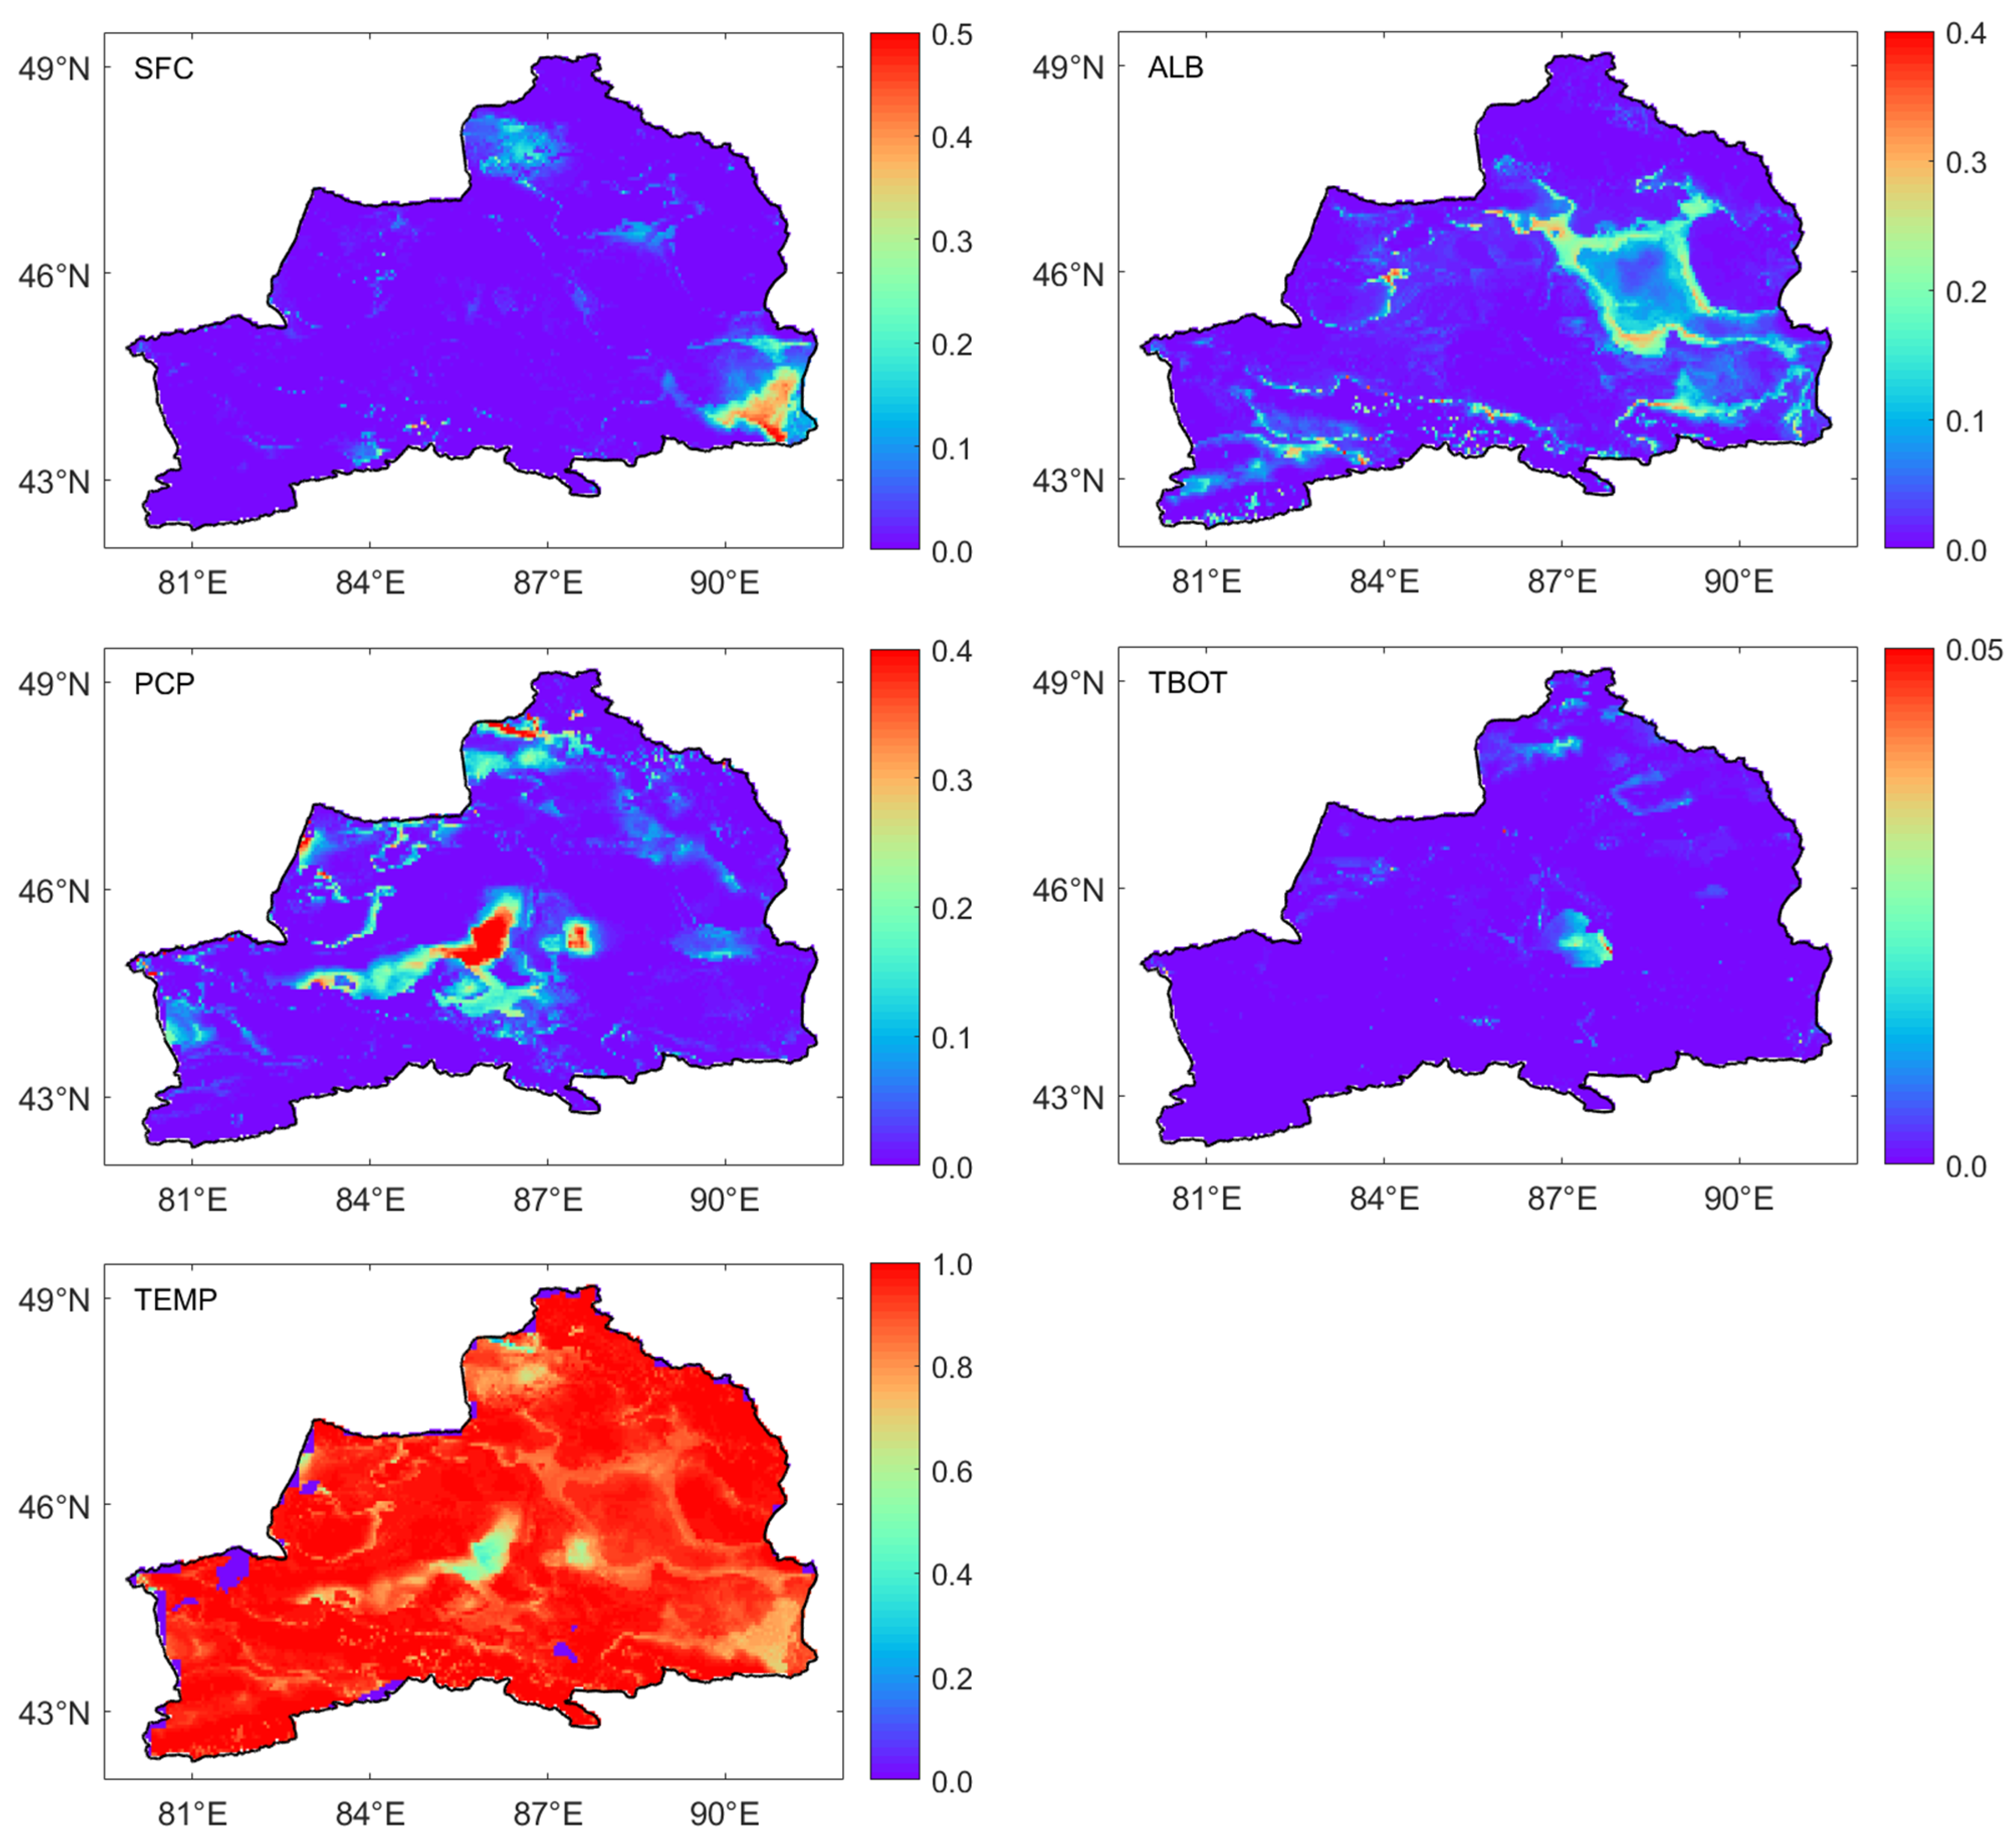
Figure 4.
The uncertainty of the simulated snow depth using parameterization scheme combinations, in total 48.
Figure 4.
The uncertainty of the simulated snow depth using parameterization scheme combinations, in total 48.
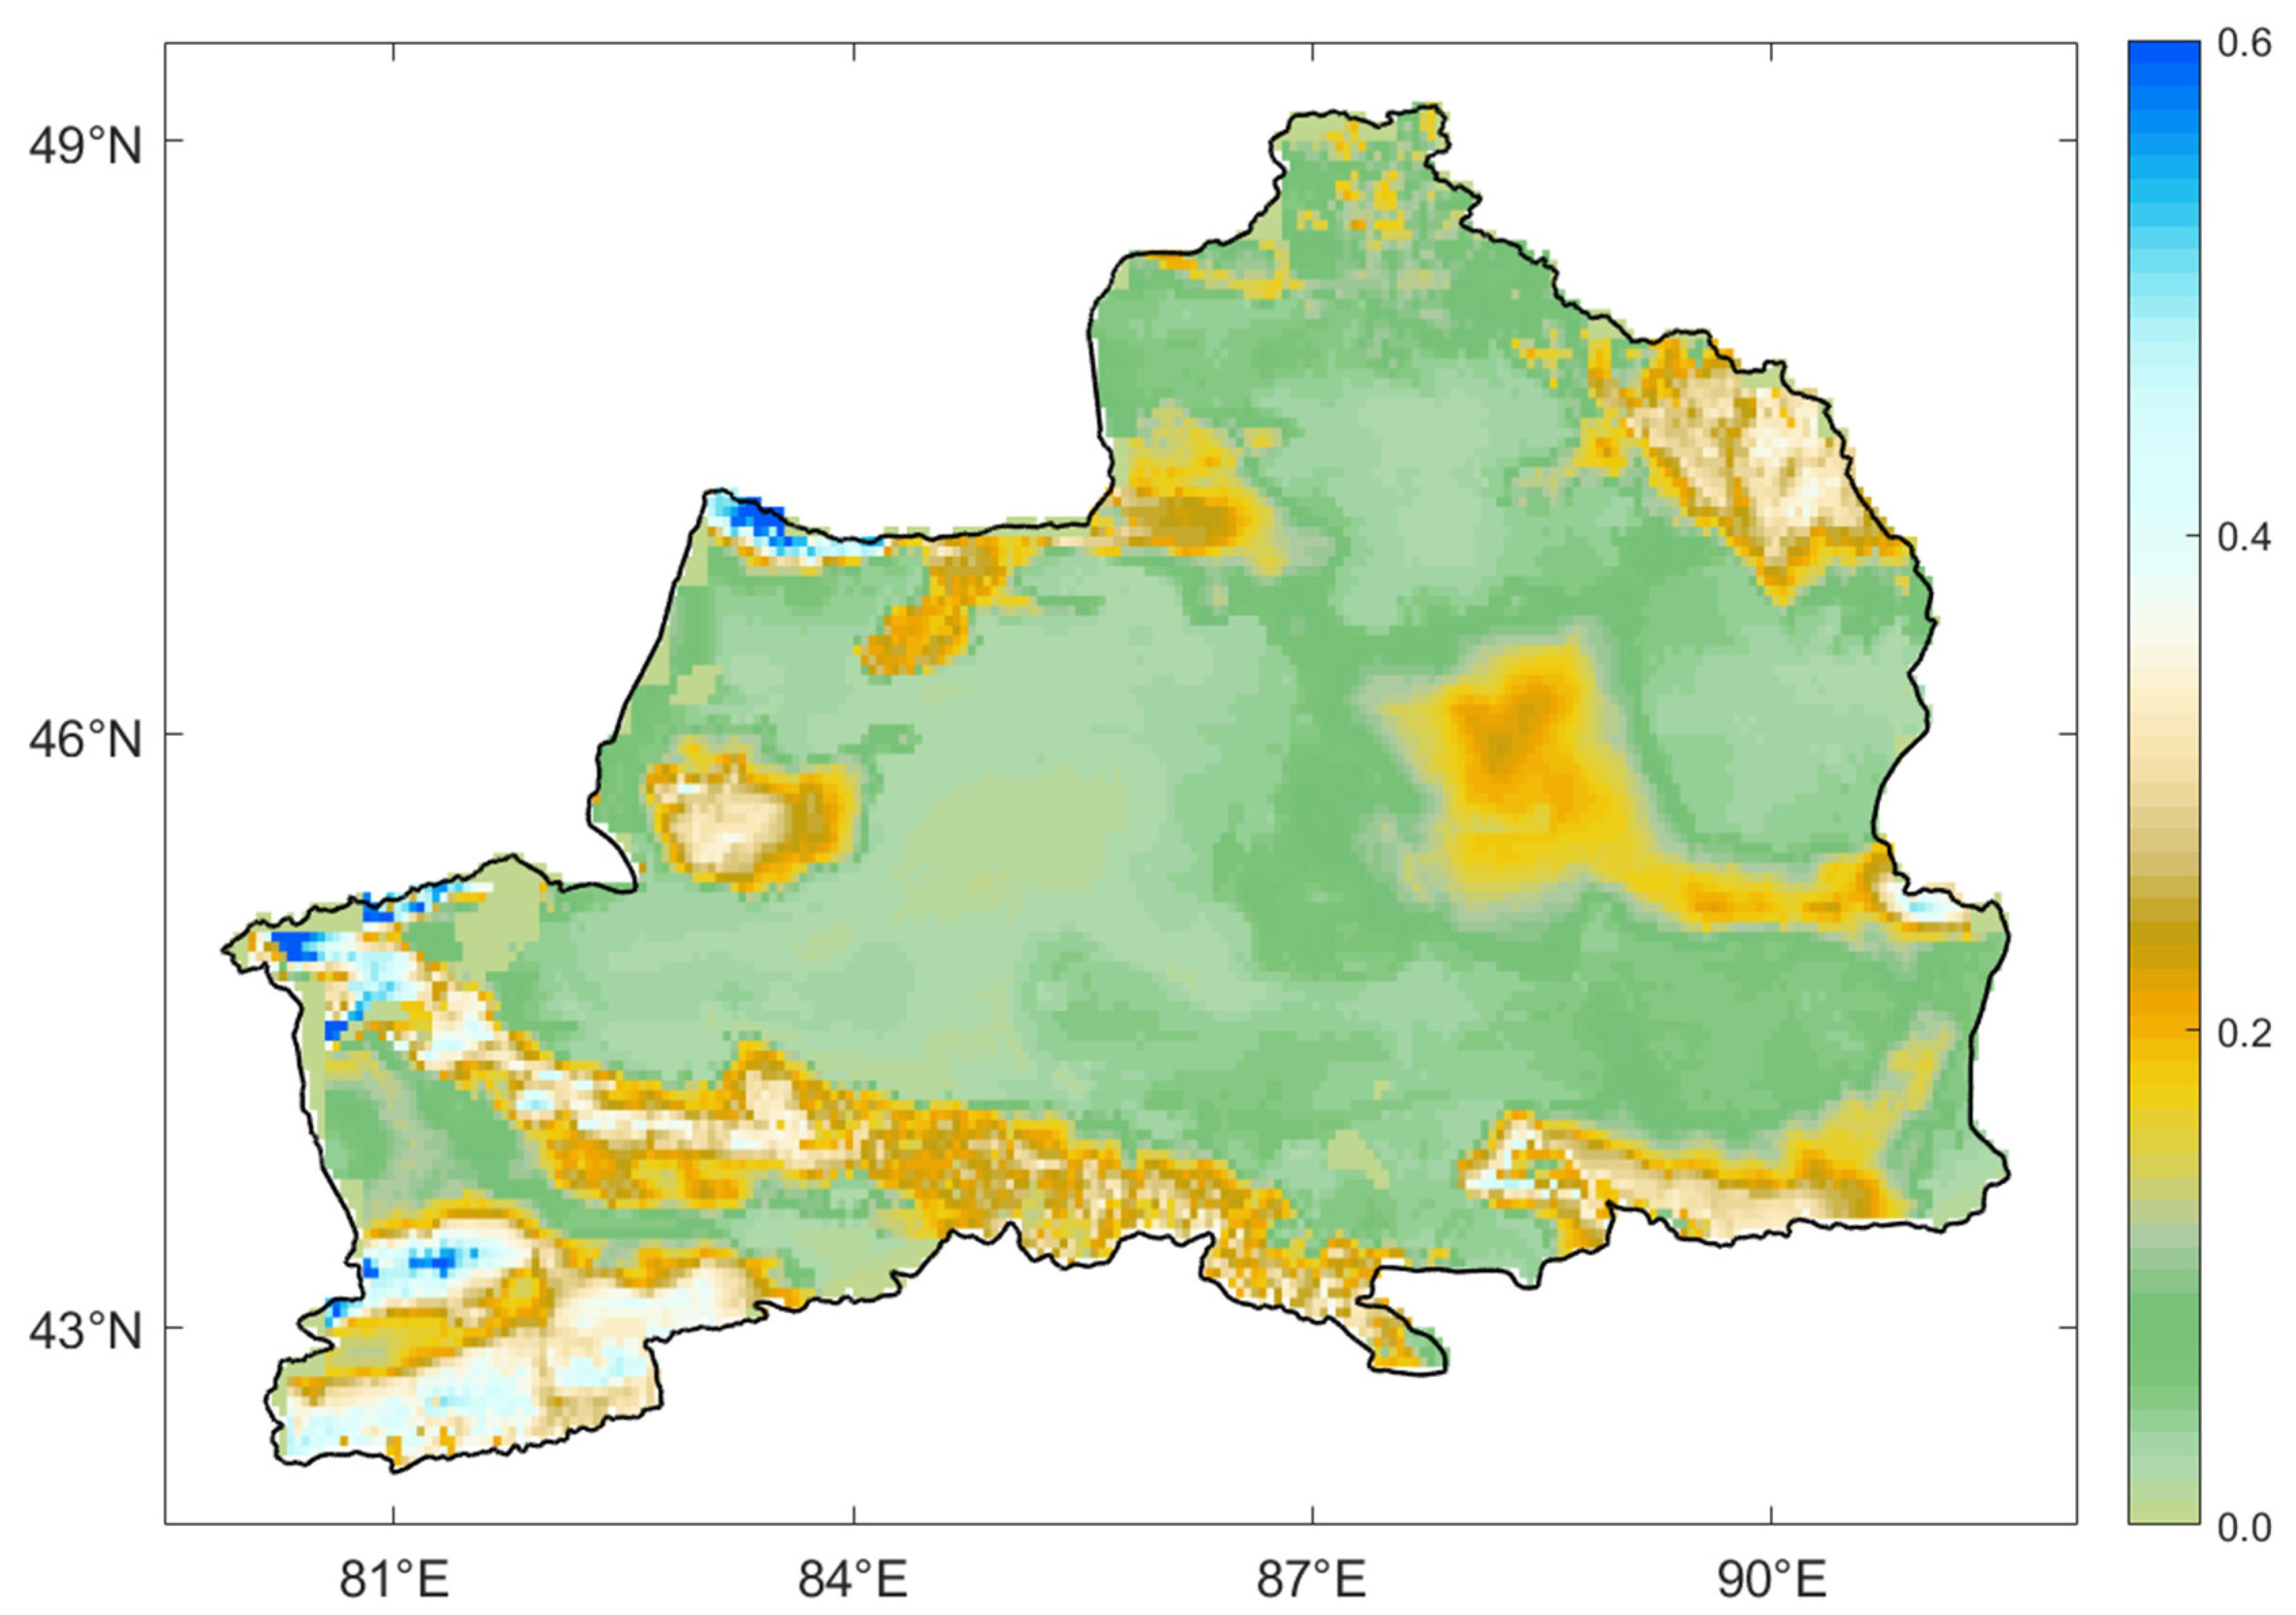
Figure 5.
Statistics of pixel counts in different uncertainty range intervals.

Table 1.
The main physical options within the Noah-MP model.
| Parameterization Description | Scheme Options |
|---|---|
| Dynamic vegetation (DVEG) | 1. off [Default], 2. on |
| Canopy stomatal resistance (CRS) | 1. Ball-berry [Default], 2. Jarvis |
| Soil moisture factor controlling stomatal resistance (BTR) | 1. Noah scheme [Default], 2. CLM scheme, 3. SSiB scheme |
| Runoff and groundwater (RUN) | 1. SIMGM [Default], 2. SIMTOP, 3. Schaake96, 4. BATS |
| Surface layer drag coefficient (SFC) | 1. M-O [Default], 2. Original Noah (Chen97) |
| Frozen soil permeability (INF) | 1. NY06 [Default], 2. Koren99 |
| Super-cooled liquid water in frozen soil (FRZ) | 1. NY06 [Default], 2. Koren99 |
| Radiation transfer (RAD) | 1. gap = F(3D, cosz) [Default], 2. gap = 0, 3. gap = 1 − FVEG |
| Snow surface albedo (ALB) | 1. BATS, 2. CLASS [Default] |
| Partitioning of precipitation into rainfall and snowfall (PCP) | 1. Jordan91 [Default], 2. BATS, 3. Noah |
| Lower boundary condition of soil temperature (TBOT) | 1. Zero-flux scheme, 2. Noah [Default] |
| First snow layer or soil temperature time scheme (TEMP) | 1. Semi-implicit [Default], 2. Fully implicit |
Disclaimer/Publisher’s Note: The statements, opinions and data contained in all publications are solely those of the individual author(s) and contributor(s) and not of MDPI and/or the editor(s). MDPI and/or the editor(s) disclaim responsibility for any injury to people or property resulting from any ideas, methods, instructions or products referred to in the content. |
© 2024 by the authors. Licensee MDPI, Basel, Switzerland. This article is an open access article distributed under the terms and conditions of the Creative Commons Attribution (CC BY) license (https://creativecommons.org/licenses/by/4.0/).
Share and Cite
MDPI and ACS Style
You, Y.; Huang, C.; Zhang, Y. Assessing the Sensitivity of Snow Depth Simulations to Land Surface Parameterizations within Noah-MP in Northern Xinjiang, China. Remote Sens. 2024, 16, 594. https://doi.org/10.3390/rs16030594
AMA Style
You Y, Huang C, Zhang Y. Assessing the Sensitivity of Snow Depth Simulations to Land Surface Parameterizations within Noah-MP in Northern Xinjiang, China. Remote Sensing. 2024; 16(3):594. https://doi.org/10.3390/rs16030594
Chicago/Turabian StyleYou, Yuanhong, Chunlin Huang, and Yuhao Zhang. 2024. "Assessing the Sensitivity of Snow Depth Simulations to Land Surface Parameterizations within Noah-MP in Northern Xinjiang, China" Remote Sensing 16, no. 3: 594. https://doi.org/10.3390/rs16030594
Note that from the first issue of 2016, this journal uses article numbers instead of page numbers. See further details here.