Article

Nearshore Ship Detection in PolSAR Images by Integrating Superpixel-Level GP-PNF and Refined Polarimetric Decomposition

1
Xi’an Electronic Engineering Research Institute, Xi’an 710048, China
2
National Key Laboratory of Science and Technology on Automatic Target Recognition, College of Electronic Science and Technology, National University of Defense Technology, Changsha 410073, China
3
State Key Laboratory of Complex Electromagnetic Environment Effects on Electronics and Information System, College of Electronic Science and Technology, National University of Defense Technology, Changsha 410073, China
*
Author to whom correspondence should be addressed.
Remote Sens. 2024, 16(6), 1095; https://doi.org/10.3390/rs16061095
Submission received: 20 February 2024 / Revised: 13 March 2024 / Accepted: 19 March 2024 / Published: 20 March 2024
(This article belongs to the Section Remote Sensing Image Processing)

Abstract

:
Nearshore ship detection has significant applications in both the military and civilian domains. Compared to synthetic aperture radar (SAR), polarimetric synthetic aperture radar (PolSAR) provides richer information for analyzing the scattering mechanisms of ships and enables better detection of ship targets. However, ships in nearshore areas tend to be highly concentrated, and ship detection is often affected by adjacent strong scattering, resulting in false alarms or missed detections. While the GP-PNF detector performs well in PolSAR ship detection, it cannot obtain satisfactory results in these scenarios, and it also struggles in the presence of azimuthal ambiguity or strong clutter interference. To address these challenges, we propose a nearshore ship detection method named ECD-PNF by integrating superpixel-level GP-PNF and refined polarimetric decomposition. Firstly, polarimetric superpixel segmentation and sea–land segmentation are performed to reduce the influence of land on ship detection. To estimate the sea clutter more accurately, an automatic censoring (AC) mechanism combined with superpixels is used to select the sea clutter superpixels. By utilizing refined eight-component polarimetric decomposition to improve the scattering vector, the physical interpretability of the detector is enhanced. Additionally, the expression of polarimetric coherence is improved to enhance the target clutter ratio (TCR). Finally, this paper combines the third eigenvalue of eigenvalue–eigenvector decomposition to reduce the impact of azimuthal ambiguity. Three spaceborne PolSAR datasets from Radarsat-2 and GF-3 are adopted in the experiments for comparison. The proposed ECD-PNF method achieves the highest figure of merit (FoM) value of 0.980, 1.000, and 1.000 for three datasets, validating the effectiveness of the proposed method.

1. Introduction

Ship detection, which is one of the significant applications of synthetic aperture radar (SAR), plays a significant role in both military and civilian fields [1]. SAR has the advantage of all-weather and all-day monitoring, while polarimetric SAR (PolSAR) systems could capture richer polarization information compared to single-polarization SAR systems [2]. With the development of polarization theory, an increasing number of ship detection methods have been proposed for PolSAR images [3,4,5].
The constant false alarm rate (CFAR) method has been a common approach for ship detection for PolSAR images [6,7,8,9], which does not require extensive prior knowledge. By modeling the sea clutter, CFAR methods obtain the threshold value based on the constant false alarm rate. However, the effectiveness of the CFAR method relies on the accuracy of clutter modeling. When the clutter estimation window contains targets or when the parameters of the distribution model are inaccurately estimated, the detection results will be unsatisfactory.
Many researchers have proposed ship detection methods based on the polarimetric scattering intensity. Polarimetric power (SPAN) detectors [10], polarimetric whitening filter (PWF) detectors [11], and power-maximization synthetic (PMS) detectors [12] primarily differentiate between ships and sea clutter based on polarimetric scattering intensity. However, these methods rely on a simple combination of intensity information from different polarization channels to detect the ship target. When the backscattering power of the ship is weak or when the sea clutter power is strong, it’s difficult for these methods to distinguish ships from sea clutter. In fact, spatial information is beneficial for PolSAR ship detection [13], while the aforementioned methods mainly detect targets at the pixel level and do not fully utilize spatial information. Huang et al. [14] designed an object detection method based on saliency detection. They divided the image into N block regions and calculated the inter-block distances to obtain local saliency and global saliency for detection. Liu et al. [15] utilized pixel neighborhood information to construct a new neighborhood polarimetric covariance matrix (NPCM). The performance of the PWF detector was improved based on NPCM. Zhang et al. [16] improved the detection efficiency of PWF using a superpixel neighborhood covariance matrix based on superpixel segmentation.
Ships typically have complex metallic structures that exhibit significant polarimetric scattering characteristics that differ from the sea surface. Nunziata et al. proposed a reflection symmetry (RS) detector by analyzing the physical characteristic differences between ships and sea clutter [17]. In addition, many detection methods have been proposed based on the diverse polarimetric scattering mechanisms [18]. Polarimetric decomposition methods are commonly used in target detection and land classification, as they provide a physical model to explain the polarimetric scattering mechanisms of targets [19,20]. After Cameron’s [21] proposal of a coherent target decomposition method, Ringrose [22] applied the Cameron decomposition method to ship detection. However, this method fails to effectively distinguish between sea clutter and ships when the incident angle of the radar changes. Touzi et al. [23] utilized the Cloude-Pottier [24] decomposition to distinguish between sea clutter and ship targets. A ship detection method was proposed by Guo based on integrating eigenvalues–eigenvector decomposition and non-negative matrix factorization [25]. Model-based polarization decomposition methods, such as Freeman-Durdan decomposition [26] and Yamaguchi four-component [27] decomposition, can better illustrate the inherent polarization scattering types. Based on Yamaguchi decomposition, Sugimoto et al. [28] suppress the scattering contribution of sea clutter to highlight and detect ship targets. Zhang et al. [29] analyzed the scattering characteristics of sea clutter and ship targets based on Yamaguchi decomposition and then developed a novel detection feature that enhances the target-clutter contrast ratio (TCR). With the development of more refined polarimetric decomposition techniques, Pan et al. [30] constructed a new feature called scattering contribution local contrast (SCLC) based on the eigenvalue–eigenvector decomposition and an improved seven-component decomposition method to detect small ships. Apart from the aforementioned methods, the geometrical perturbation-polarimetric notch filter (GP-PNF) proposed by Marino can enhance the contrast between the sea and ships based on polarimetric coherence [31,32]. GP-PNF builds a six-dimensional polarimetric complex space based on the polarimetric covariance matrix. The scattering mechanism of sea clutter is simply assumed to be Bragg surface scattering, while the scattering mechanism of ships is assumed to be distributed in a five-dimensional space that is perpendicular to the sea clutter. By filtering out the surface scattering component and enhancing other scattering components, ship targets can be detected effectively. In fact, the distribution of polarimetric scattering characteristics in PolSAR images is complex. To improve the performance and adaptability of the GP-PNF, many methods have been proposed. After eigenvalue–eigenvector decomposition is carried out, the detector obtained by combining the third feature value with GP-PNF can mitigate the impact of azimuthal ambiguity [33]. In addition, Liu et al. [34] optimized the construction of the polarimetric vector space of GP-PNF based on Yamaguchi decomposition. However, these methods do not consider the polarimetric scattering characteristics of the target in a more refined manner, resulting in limited enhancement of ship-sea contrast under azimuthal ambiguity and other interference.
In recent years, an increasing number of deep learning-based object detection methods have been proposed, such as YOLO [35], R-CNN [36], SSD [37], etc. Fan et al. [38] improved the modified faster region-based convolutional neural network (Faster R-CNN) to detect ships in PolSAR images. Bai et al. [39] designed a lightweight ship detection network (LSDNET), which was driven by GP-PNF. These models have advantages in detection accuracy and efficiency compared to the existing detection models. However, these methods are data-driven and require a massive amount of annotated data. Therefore, they may not be appliable in some circumstances, such as limited available data.
The nearshore environment is typically populated with a large number of ships due to docking and navigation activities. In fact, nearshore ships are typically densely distributed. The detection of nearshore ships in PolSAR images is not only affected by sea clutter interference but also by other ships and artificial targets’ sidelobe interference, which leads to false alarms or missed detections. Therefore, improving the target clutter ratio (TCR) and eliminating interference are key issues in nearshore ship detection. As a preprocessing technique, superpixel segmentation can cluster regions with similar properties [40]. Compared to pixel-level ship detection methods, superpixel-level ship detection methods better utilize the relationships between pixels within the region and maintain the integrity of the target shape. This paper begins by performing image segmentation for both sea–land segmentation and superpixel segmentation, combined with an automatic censoring (AC) mechanism [41]. Superpixel-level GP-PNF can better utilize spatial information, and AC can help censor candidate clutter superpixels and estimate sea clutter more accurately, contributing to improving the GP-PNF detector. In order to enhance the TCR, a model-based refined eight-component decomposition is integrated with improved GP-PNF to further characterize the local structural scattering of the target and elevate the performance of the detector. Then, a novel detector named ECD-PNF is constructed by incorporating the third eigenvalue feature obtained from the eigenvalues–eigenvector decomposition, which can eliminate clutter and azimuthal ambiguity interference. Finally, the proposed method is validated on GF-3 and Radarsat-2 satellite-borne fully polarimetric SAR data and outperforms other comparative methods in terms of detection results.
This paper is structured as follows: Section 2 provides an introduction to polarimetric theory, the GP-PNF detector, and the refined eight-component decomposition method. Section 3 describes the proposed improved GP-PNF method in detail. Section 4 presents experimental data and analyzes the results. Section 5 and Section 6 present the discussion and conclusions.

2. Polarimetric Theory

2.1. Basic Polarimetric Matrix

Full polarimetric data conclude both the amplitude and phase information of the targets, and the Sinclair matrix S encompasses four combinations of transmission–reception, which can adequately describe the polarimetric scattering characteristics of the targets [42]. In Equation (1), H represents the horizontal polarimetric channel, while V represents the vertical polarimetric channel.
S = S HH S HV S VH S VV
The total power of polarimetric scattering S P A N , can be represented as follows, where T r a c e represents the matrix trace operation.
S P A N = T r a c e S S T = S HH 2 + S HV 2 + S VH 2 + S VV 2
The matrix S can describe the scattering characteristics of deterministic targets with stable scattering properties but cannot accurately describe the scattering characteristics of complex and randomly distributed targets. Most targets are composed of distributed objects in natural scenes, so the polarimetric covariance matrix C and the polarimetric coherence matrix T are commonly used in the literature to describe the scattering characteristics of targets.
C and T can be obtained from the second-order moments of S 3 DL and S 3 DP , separately, where S 3 DL and S 3 DP are 3-D lexicographic scattering vectors and Pauli vectors, respectively. represents multiview processing, and H denotes the conjugate transpose.
S 3 DL = S HH 2 S HV S VV T ,   C = S 3 DL S 3 DL H = C 11 C 12 C 13 C 21 C 22 C 23 C 31 C 32 C 33
S 3 DP = 1 2 S HH + S VV S HH S VV 2 S HV T ,   T = S 3 DP S 3 DP H = T 11 T 12 T 13 T 21 T 22 T 23 T 31 T 32 T 33

2.2. Geometrical Perturbation-Polarimetric Notch Filter (GP-PNF)

The GP-PNF and its subsequent iterations were proposed by Armando et al. [31,32]. The detector first involves perturbing the target of interest with slight disturbances. Then, through calculating the polarimetric coherence between the perturbed and reference targets’ scattering mechanisms, GP-PNF utilizes the polarimetric coherence as a feature to enhance targets or suppress background interference. GP-PNF can effectively characterize the polarimetric scattering properties of distributed targets, and the TCR can also be enhanced.
In GP-PNF, the scattering characteristics vector of the targets is described as:
t = T r a c e C Ψ 3 = [ t 1 , t 2 , t 3 , t 4 , t 5 , t 6 ] T     = k 1 2 , k 2 2 , k 3 2 , k 1 T k 2 , k 1 T k 3 , k 2 T k 3 T
In Equation (5), t is a six-dimensional vector, Ψ 3 is a 3 × 3 matrix complete basis based on Hermitian space, and k i ( i = 1, 2, 3) represents the three elements in S 3 DL .
The polarimetric coherence of the target and perturbed target γ n can then be expressed as (6) in [31].
γ n = 1 1   +   a 2 b 2 P 1 P 2   +   P 3   +   P 4   +   P 5   +   P 6 = 1 1   +   R e d R P s e a P t a r
where P 1 = P s e a represents the power of the sea clutter, P 2 + P 3 + P 4 + P 5 + P 6 = P t a r represents the power of the ship targets. a 2 b 2 = R e d R which is a constant representing the reduction ratio. When the detected pixels correspond to ship pixels, the value of polarization coherence tends to 1.

2.3. Refined Polarimetric Decomposition

The polarimetric coherence matrix contains rich polarization information and is commonly used to describe the polarimetric scattering characteristics of distributed targets. However, the physical meanings of the nine elements in the coherence matrix are not very clear. Polarimetric decomposition methods based on physical models decompose the polarimetric coherence matrix into a combination of interpretable polarization scattering mechanisms. Thus, model-based decomposition (MBD) can better explain the polarization scattering characteristics of targets. With the continuous development of polarimetric theory, polarimetric decomposition reveals more and finer scattering components, which results in stronger physical interpretability [19,43,44].
Some existing polarimetric decomposition methods often rely on certain assumptions and lead to the loss of some polarization information. Quan et al. [45] improved the rotated dihedral scattering model (RDSM) to avoid the confusion between the rotated dihedral scattering mechanism and the volume scattering mechanism based on the seven-component decomposition method. The improved eight-component decomposition method can make better use of polarization information and accurately characterize the physical scattering mechanisms of targets.
Combining the RDSM and the compound scattering models, the final eight-component decomposition (F8D) scattering model is given as follows:
T = f S T S + f D T D + f H T H + f V T V + f R T R + f O D T O D + f O Q W T O Q W + f M D T M D
Thereinto, f S ,   f D ,   f H ,   f V ,   f R ,   f O D ,   f O Q W ,   f M D represent surface, double-bounce, helix, volume, rotated dihedral, ±45° oriented dipole, ±45° oriented quarter-wave reflector, and mixed dipole scattering coefficients, respectively. T S ,   T D ,   T H ,   T T ,   T R ,   T O D ,   T O Q W ,   T M D represent the above scattering models’ scattering matrix. For details on the determination of the scattering coefficients of each model and the calculation of the scattering model power, please refer to the specific literature [45].

3. Methods

This paper proposes a nearshore ship detection method by integrating superpixel-level GP-PNF and refined polarimetric decomposition. The proposed method can be divided into three parts, as follows: (1) Firstly, the image is preprocessed by sea–land segmentation and superpixel segmentation methods. (2) The superpixel-level GP-PNF is then proposed by incorporating the AC mechanism. Furthermore, the scattering vectors in GP-PNF are reconstructed based on refined eight-component decomposition. The third feature of eigenvalues–eigenvector decomposition is also combined with the GP-PNF to eliminate clutter and azimuth ambiguity interference. (3) Morphological processing is finally performed to obtain the ship detection results. Figure 1 shows the flowchart of the newly proposed ECD-PNF detector.

3.1. Preprocessing

In order to reduce the influence of land and man-made targets’ scattering on ship detection, sea–land segmentation is first applied based on morphological methods. Specifically, we remove the land-connected regions through erosion and dilation operations.
Since the spatial information in PolSAR images is not well utilized in pixel-level ship detection methods, the detector can be easily affected by strong sea clutter or artifacts, resulting in false alarms or missed detections. In this paper, the spatial information formed by superpixels is applied to improve the detection results. Superpixels refer to a group of pixels with similar characteristics; therefore, they are helpful to alleviate the effect of speckle noise during feature extraction and subsequent procedures. Superpixel segmentation methods were initially proposed for optical images. The simple linear iterative clustering (SLIC) method, which is a simple yet effective segmentation approach, clusters pixels based on Euclidean distance and CIELAB color distance. The procedure of the basic SLIC method initializes the cluster centers first, and then clusters the pixels in a local region by the k-means method. However, as to PolSAR images, the coherent speckle noise can affect the performance of the original method. Therefore, a gradient calculation method with a normalized covariance matrix is employed in this paper [46]. The method is improved over the traditional CFAR detector and employs a Gaussian filter to replace the rectangular filter. This method is less affected by speckle noise in the PolSAR image during gradient calculation and can more accurately get the location of the minimum gradient. After getting the gradient map and initializing the cluster centers, we replace the Euclidean distance in SLIC with the Wishart distance to enhance the segmentation performance of SLIC in PolSAR images. Finally, we get the segmentation results by postprocessing.
d w i s h a r t ( C i , C j ) = 1 2 × ( T r a c e ( C i 1 C j ) + T r a c e ( C j 1 C i ) ) q
where C i and C j are the estimated center covariance matrices of two regions i and j , and C i = 1 / N i n = 1 N i C n , C j = 1 / N j n = 1 N j C n , N i and N j represent the pixel numbers of i and j , respectively, C n represents the corresponding covariance matrices of the nth pixel. q is the dimension of the covariance matrix.

3.2. ECD-PNF Detector

GP-PNF can enhance the TCR and obtain satisfactory results in general scenarios. However, the detection performance of GP-PNF is affected when ships are densely distributed. To overcome this problem, this paper proposes several improvements to GP-PNF, and the details are presented in the flowing subsections.

3.2.1. Candidate Sea Clutter Superpixel Selection with AC Mechanism

A testing window and a training window are set in the classic GP-PNF, and the sea clutter is estimated using pixels within the training window. GP-PNF slides the testing window and training window across the image to obtain the polarimetric coherence values γ n for each pixel. Although this method is computationally efficient, the sea clutter estimation is inaccurate when the training window contains target pixels. Thus, it’s necessary to select clutter pixels more flexibly.
After polarimetric superpixel segmentation, pixels with similar characteristics and adjacent spatial coordinates are clustered into the common superpixel. To address the issue of inaccurate sea clutter estimation in GP-PNF, this paper utilizes the AC mechanism to censor candidate target superpixels s p c a n d i d a t e - t a r and candidate clutter superpixels s p c a n d i d a t e - s e a . In [41], the AC mechanism classifies the pixels in SAR images into target pixels and clutter pixels based on their grayscale values. In this paper, the superpixels are classified into candidate target superpixels and candidate clutter superpixels with S P A N as a feature value. The specific procedure is shown in the upper part of Figure 2.
Firstly, according to the average S P A N value of each superpixel, the histogram can be obtained. In the sea clutter area, the S P A N value is low, and the proportion of targets is small, so the targets are mainly distributed in the tail of the histogram. According to the histogram, the candidate target superpixels and candidate clutter superpixels can be screened by the threshold, which is determined automatically. If we set the total S P A N level of the PolSAR image as L , the total number of pixels will be N , and the proportion of histogram of each level S P A N will be p i = n i / N , where n i is the number of pixels of each level S P A N , i = 1 , 2 , 3 , , L . If we let the threshold be T s , the proportion of clutter be φ , φ 0 , 1 , then T s can be adaptively obtained according to Formula (9).
i T s p i = 1 φ
By comparing the S P A N value of each superpixel with T s , s p c a n d i d a t e - t a r and s p c a n d i d a t e - s e a are roughly determined. An index vector is generated by assigning index of 1 to s p c a n d i d a t e - t a r and index of 0 to s p c a n d i d a t e - s e a . In order to ensure that the candidate target superpixels are not missed, the value of φ can be increased, while also ensuring that the filtered candidate clutter superpixels do not contain the candidate target superpixels.
As shown in the lower part of Figure 2, the calculation of sea clutter scattering power P s e a _ c l u t t e r is based on the s p c a n d i d a t e - s e a and s p c a n d i d a t e - t a r , respectively. The polarimetric coherence is calculated based on superpixels as the basic unit, and the superpixels within the second-order neighborhood of the current superpixel are selected for clutter estimation. When the labels of the superpixels within the neighborhood are sea clutter labels, P s e a _ c l u t t e r can be described as (10), where N represents the total number of clutter superpixels within the neighborhood, i = 1 , 2 , , N , n represents the total number of pixels within the i-th clutter superpixel, j = 1 , 2 , , n . Superpixels within the neighborhood that are labeled as targets do not participate in the clutter estimation.
P s e a _ c l u t t e r = 1 N i = 1 N P S ( i ) , P S ( i ) = 1 n j = 1 n P S ( j )

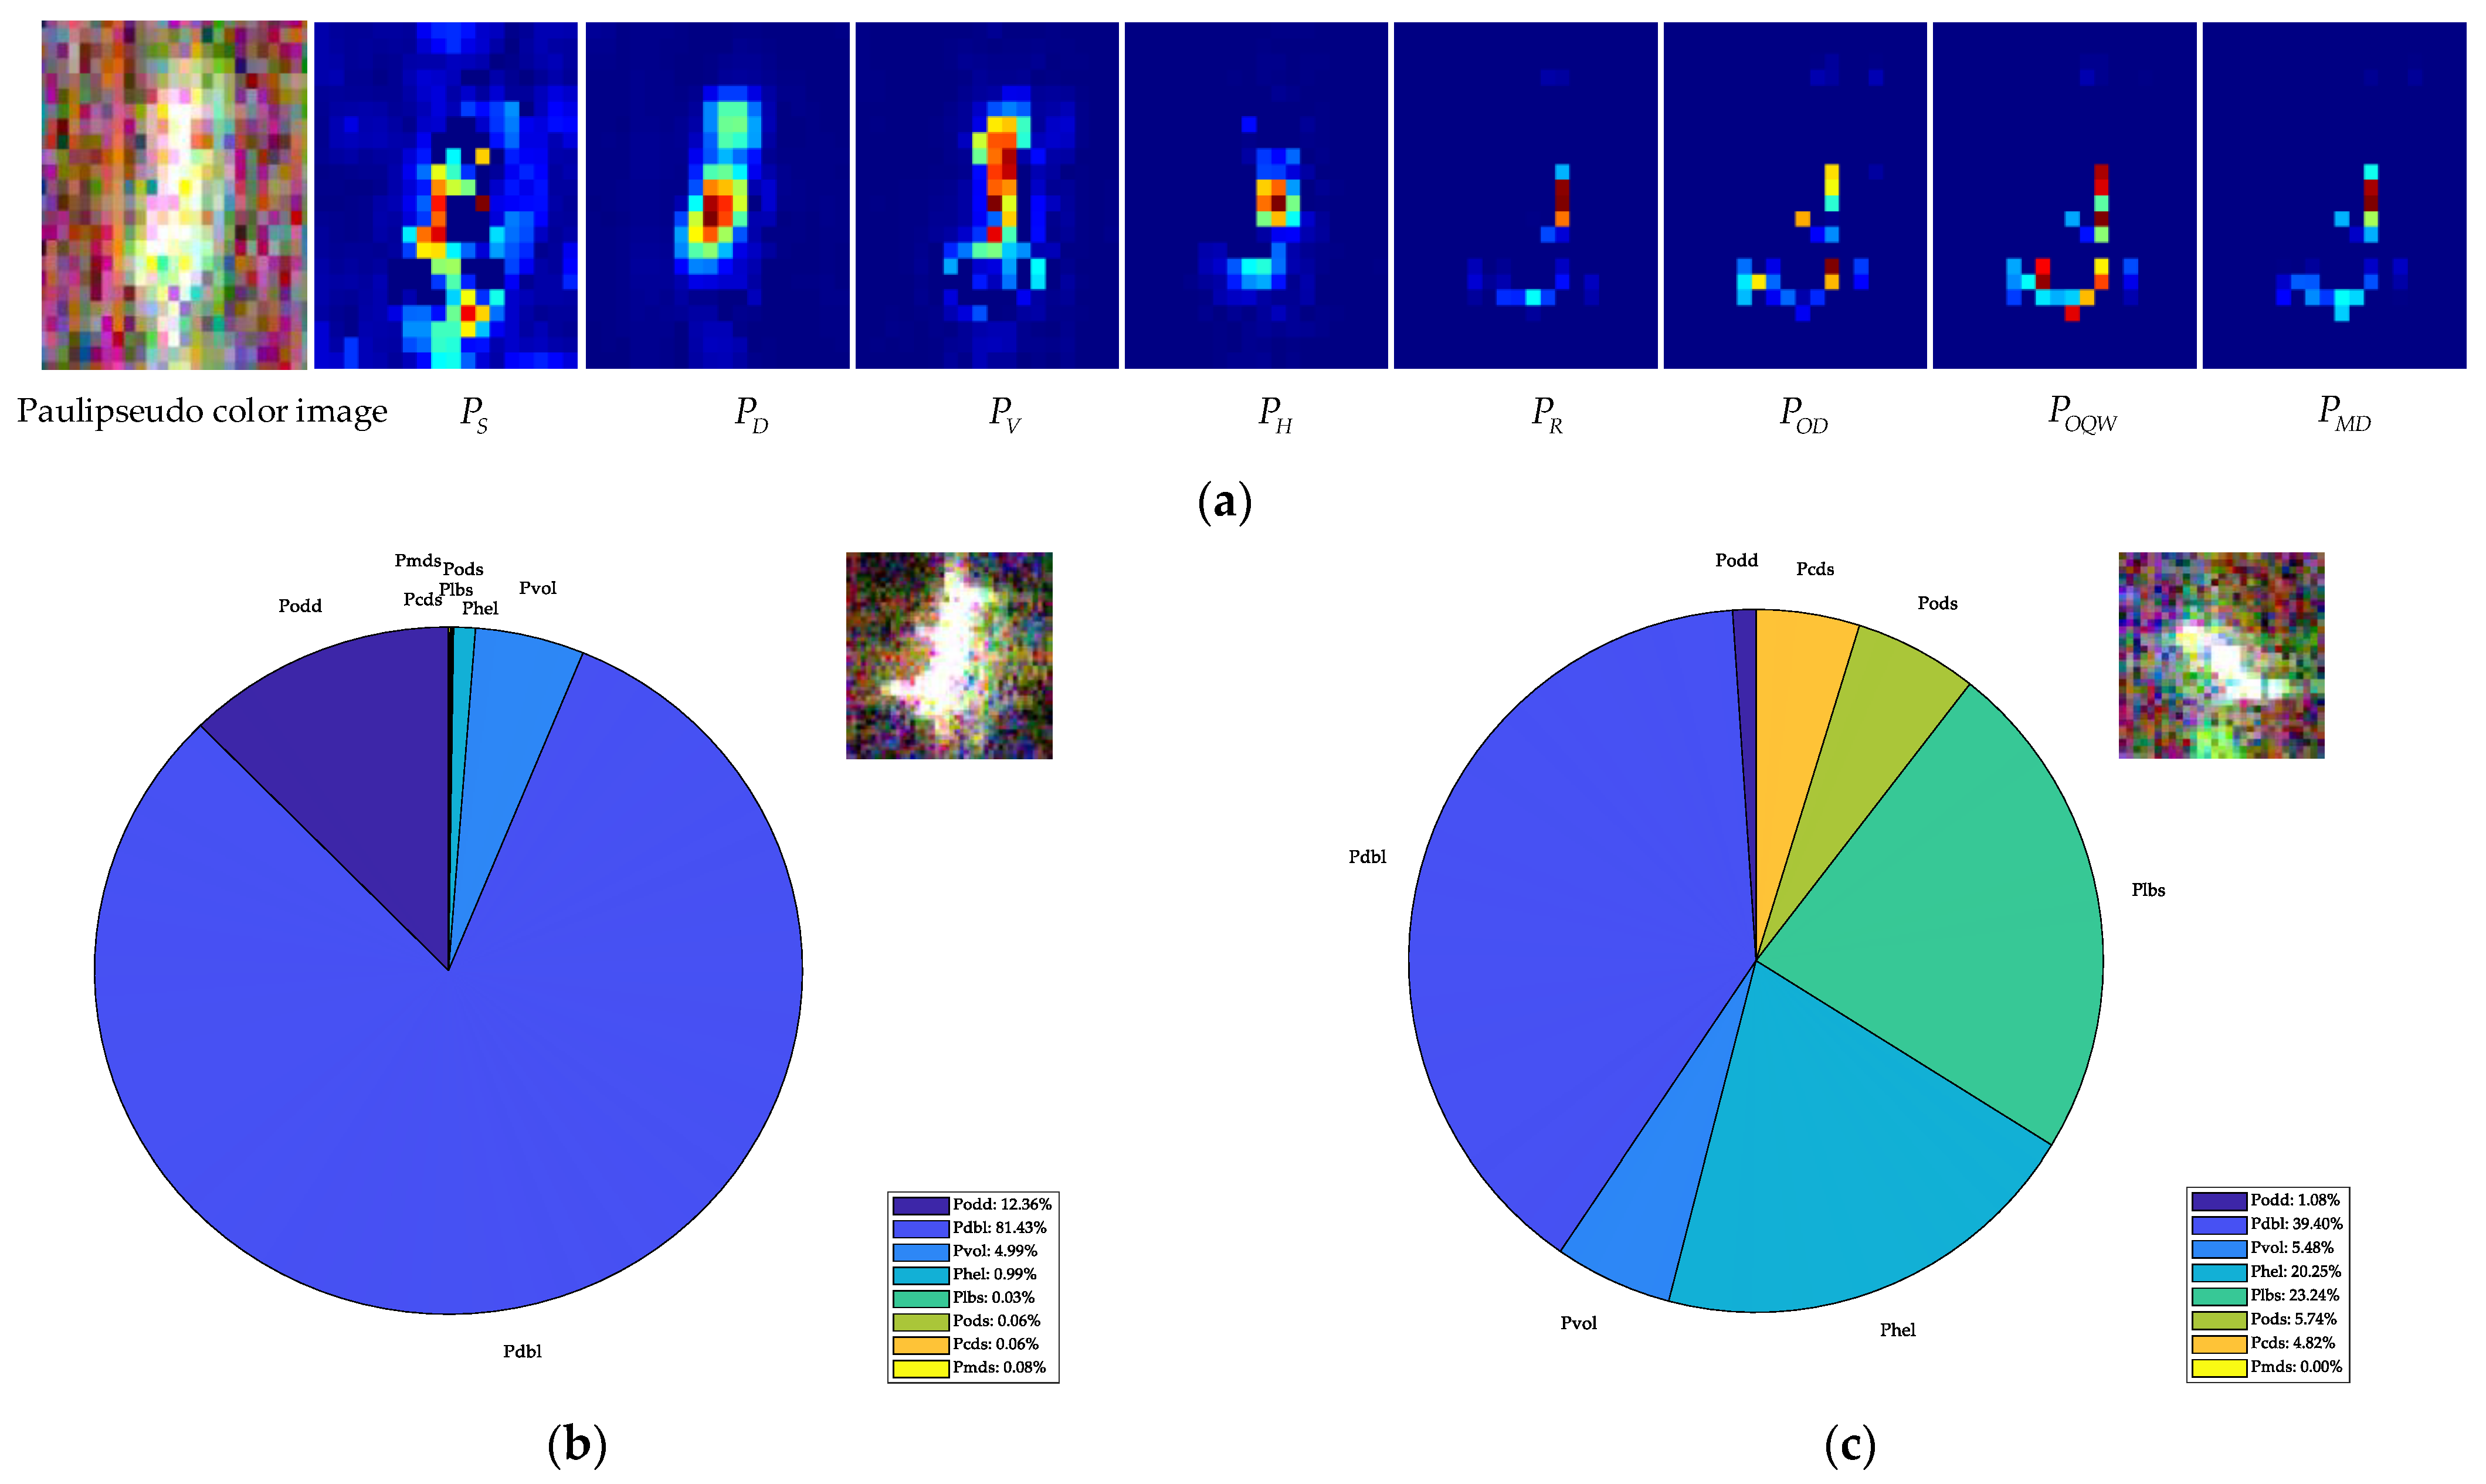
3.2.2. Constructing Scattering Vectors Based on Refined Eight-Component Decomposition

In GP-PNF, it is assumed that sea clutter scattering is composed of Bragg surface scattering, which corresponds to the first element of the partial target scattering vector t . The scattering components of ship targets correspond to the remaining five elements of t . This assumption did not analyze the concrete scattering components of ships or sea clutter, thus lacking strong physical interpretability. Refined model-based polarimetric decomposition methods can typically decompose the coherent matrix of targets into several components with clear physical meanings. To make the most of the polarimetric decomposition in ship detection, the decomposition results can be integrated into GP-PNF by modifying the form of scattering vectors. Quan et al. analyzed the scattering characteristics of ships and explained the physical concepts behind different scattering components [45]. Therefore, the eight-component decomposition is applied in this paper.
After polarimetric eight-component decomposition, the scattering power of the eight components can be obtained. According to the power of different scattering components, we get a new 8-D target scattering vector t e as:
t e = P S , P D , P H , P V , P R , P O D , P O Q W , P M D T
As shown in Figure 3, we utilize the eight-component decomposition method to analyze the scattering power components of different targets. The ROI region is extracted from the GF-3 and Radarsat-2 spaceborne PolSAR datasets. Figure 3a represents the energy map of the eight-component decomposition results for a ship. Figure 3b–d represent the scattering power proportions of different ship targets, Figure 3e represents the scattering power proportions of strong sidelobe scattering, Figure 3f represents the scattering power composition of azimuthal ambiguity, and Figure 3g represents the scattering power composition of sea clutter. Combining the energy map of the scattering components with the sector diagram of scattering power proportions, it can be observed that the refined eight-component decomposition can provide a detailed description of the target’s scattering mechanisms. From the energy map of the scattering components in Figure 3a, it can be seen that the double-bounce scattering energy is distributed almost throughout the entire hull. Additionally, from the sector diagram of ships’ scattering power proportions in Figure 3b–d, it can be observed that the double-bounce scattering energy P D is the main component of the vessels’ scattering energy. The remaining scattering energy proportions of ship targets change since there are variations in radar incident angle, structure, etc. The scattering energy composition of sidelobe scattering in ships resembles that of real targets. Azimuthal ambiguity and sea clutter are mainly composed of surface scattering. By comparison, it is assumed that the energy of sea clutter is concentrated in the first dimension of t e , i.e., the surface scattering energy. While the energy of ship targets is distributed in the other seven dimensions of t e . Following a similar derivation process to GP-PNF, an improved GP-PNF detector is derived as (12):
γ p = 1 1   +   R e d R P s e a _ c l u t t e r P t a r = 1 1   +   R e d R P S P D   +   P H   +   P V   +   P R   +   P O D   +   P O Q W   +   P M D
In PolSAR images, the S P A N value of ships is typically larger than that of the sea. Furthermore, through analyzing the scattering energy distribution of ships, it has been observed that the majority of the ship’s scattering energy is attributed to double-bounce scattering. Therefore, in order to enhance the TCR, this paper further improves the detector, as shown in Equation (13). From a mathematical principle perspective, 1 S P A N 2 × P S P D 2   +   P H   +   P V   +   P R   +   P O D   +   P O Q W   +   P M D is a monotonically increasing function, and both S P A N 2 and P D 2 are in the denominator. As their values increase, the value of the detector γ p tends to approach 1. Since the double-bounce scattering energy and total polarization power of ships are relatively large compared to clutter interference, γ p can further enhance the polarimetric coherence of targets and suppress sea clutter, resulting in improved detection performance.
γ p = 1 1   +   R e d R × 1 S P A N 2 × P S P D 2   +   P H   +   P V   +   P R   +   P O D   +   P O Q W   +   P M D

3.2.3. Combining the Third Eigenvalue to Improve the Detector

The ship detection capability of the modified GP-PNF can be enhanced through the AC mechanism and eight-component decomposition. Unfortunately, we note that the sidelobe scattering of ships is also mainly composed of double-bounce scattering power, and some azimuthal ambiguities are both with double-bounce scattering power, so they are also amplified in γ p . As mentioned earlier, the third eigenvalue λ 3 obtained through eigenvalues–eigenvector decomposition can effectively suppress noise and other interference, and it can distinguish ships from sea clutter. Therefore, this paper combines γ p and λ 3 to obtain the final detector γ ECD .
γ E C D = γ p × λ 3 = λ 3 1   +   R e d R × 1 S P A N 2 × P S P D 2   +   P H   +   P V   +   P R   +   P O D   +   P O Q W   +   P M D > T
After ship detection using γ ECD , some small false alarm areas will appear in the PolSAR image. In this paper, morphological processing methods are used to remove the false alarm and generate the final detection results.

4. Experimental Results

This paper validates the performance of the proposed ECD-PNF detector using spaceborne PolSAR datasets from GF-3 and Radarsat-2. To assess the effectiveness of the proposed method, this paper compares ECD-PNF with GP-PNF, a ZT-PNF detector proposed by Zhang et al. [33], as well as the YAMA-PNF four-component decomposition-based GP-PNF detector [34] and the SCLC PolSAR ship detector proposed by Pan et al. [30].

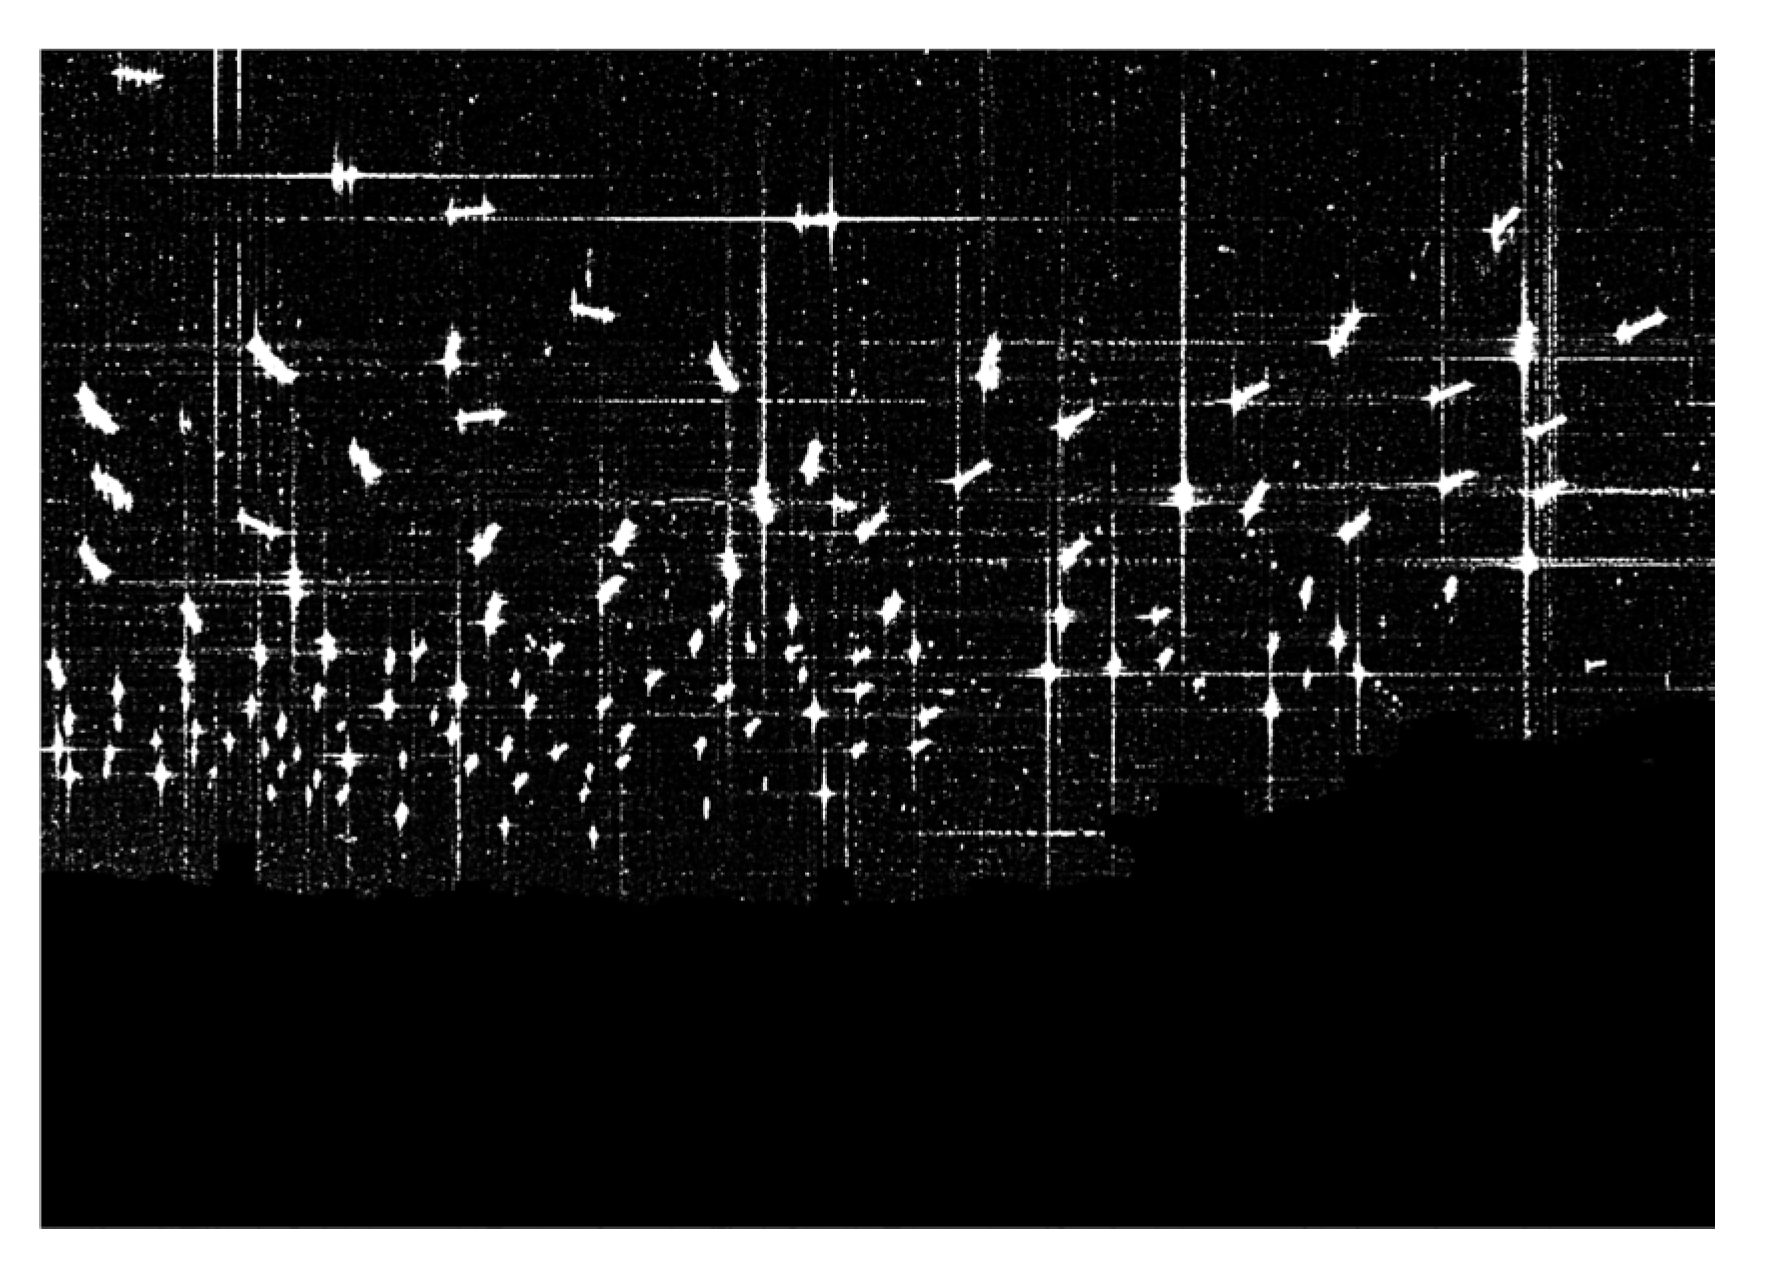
4.1. Data Description

This paper selects three spaceborne PolSAR datasets from Radarsat-2 and GF-3. All the datasets contain both land and sea areas, with a high concentration of ship distribution. Table 1 provides detailed information about the sensor, imaging area, acquisition date, data size, resolution, and ship number for each dataset.
Pauli pseudo-color images and ground-truth images of three regions are shown in Figure 4. Figure 4(a1–a3) displays the Pauli pseudo-color images, while Figure 4(b1–b3) represents the ground-truth images for their respective regions. The ground-truth images were generated based on expert knowledge, where white pixels represent ship pixels, black pixels represent sea clutter, and the land areas are also excluded in the image.

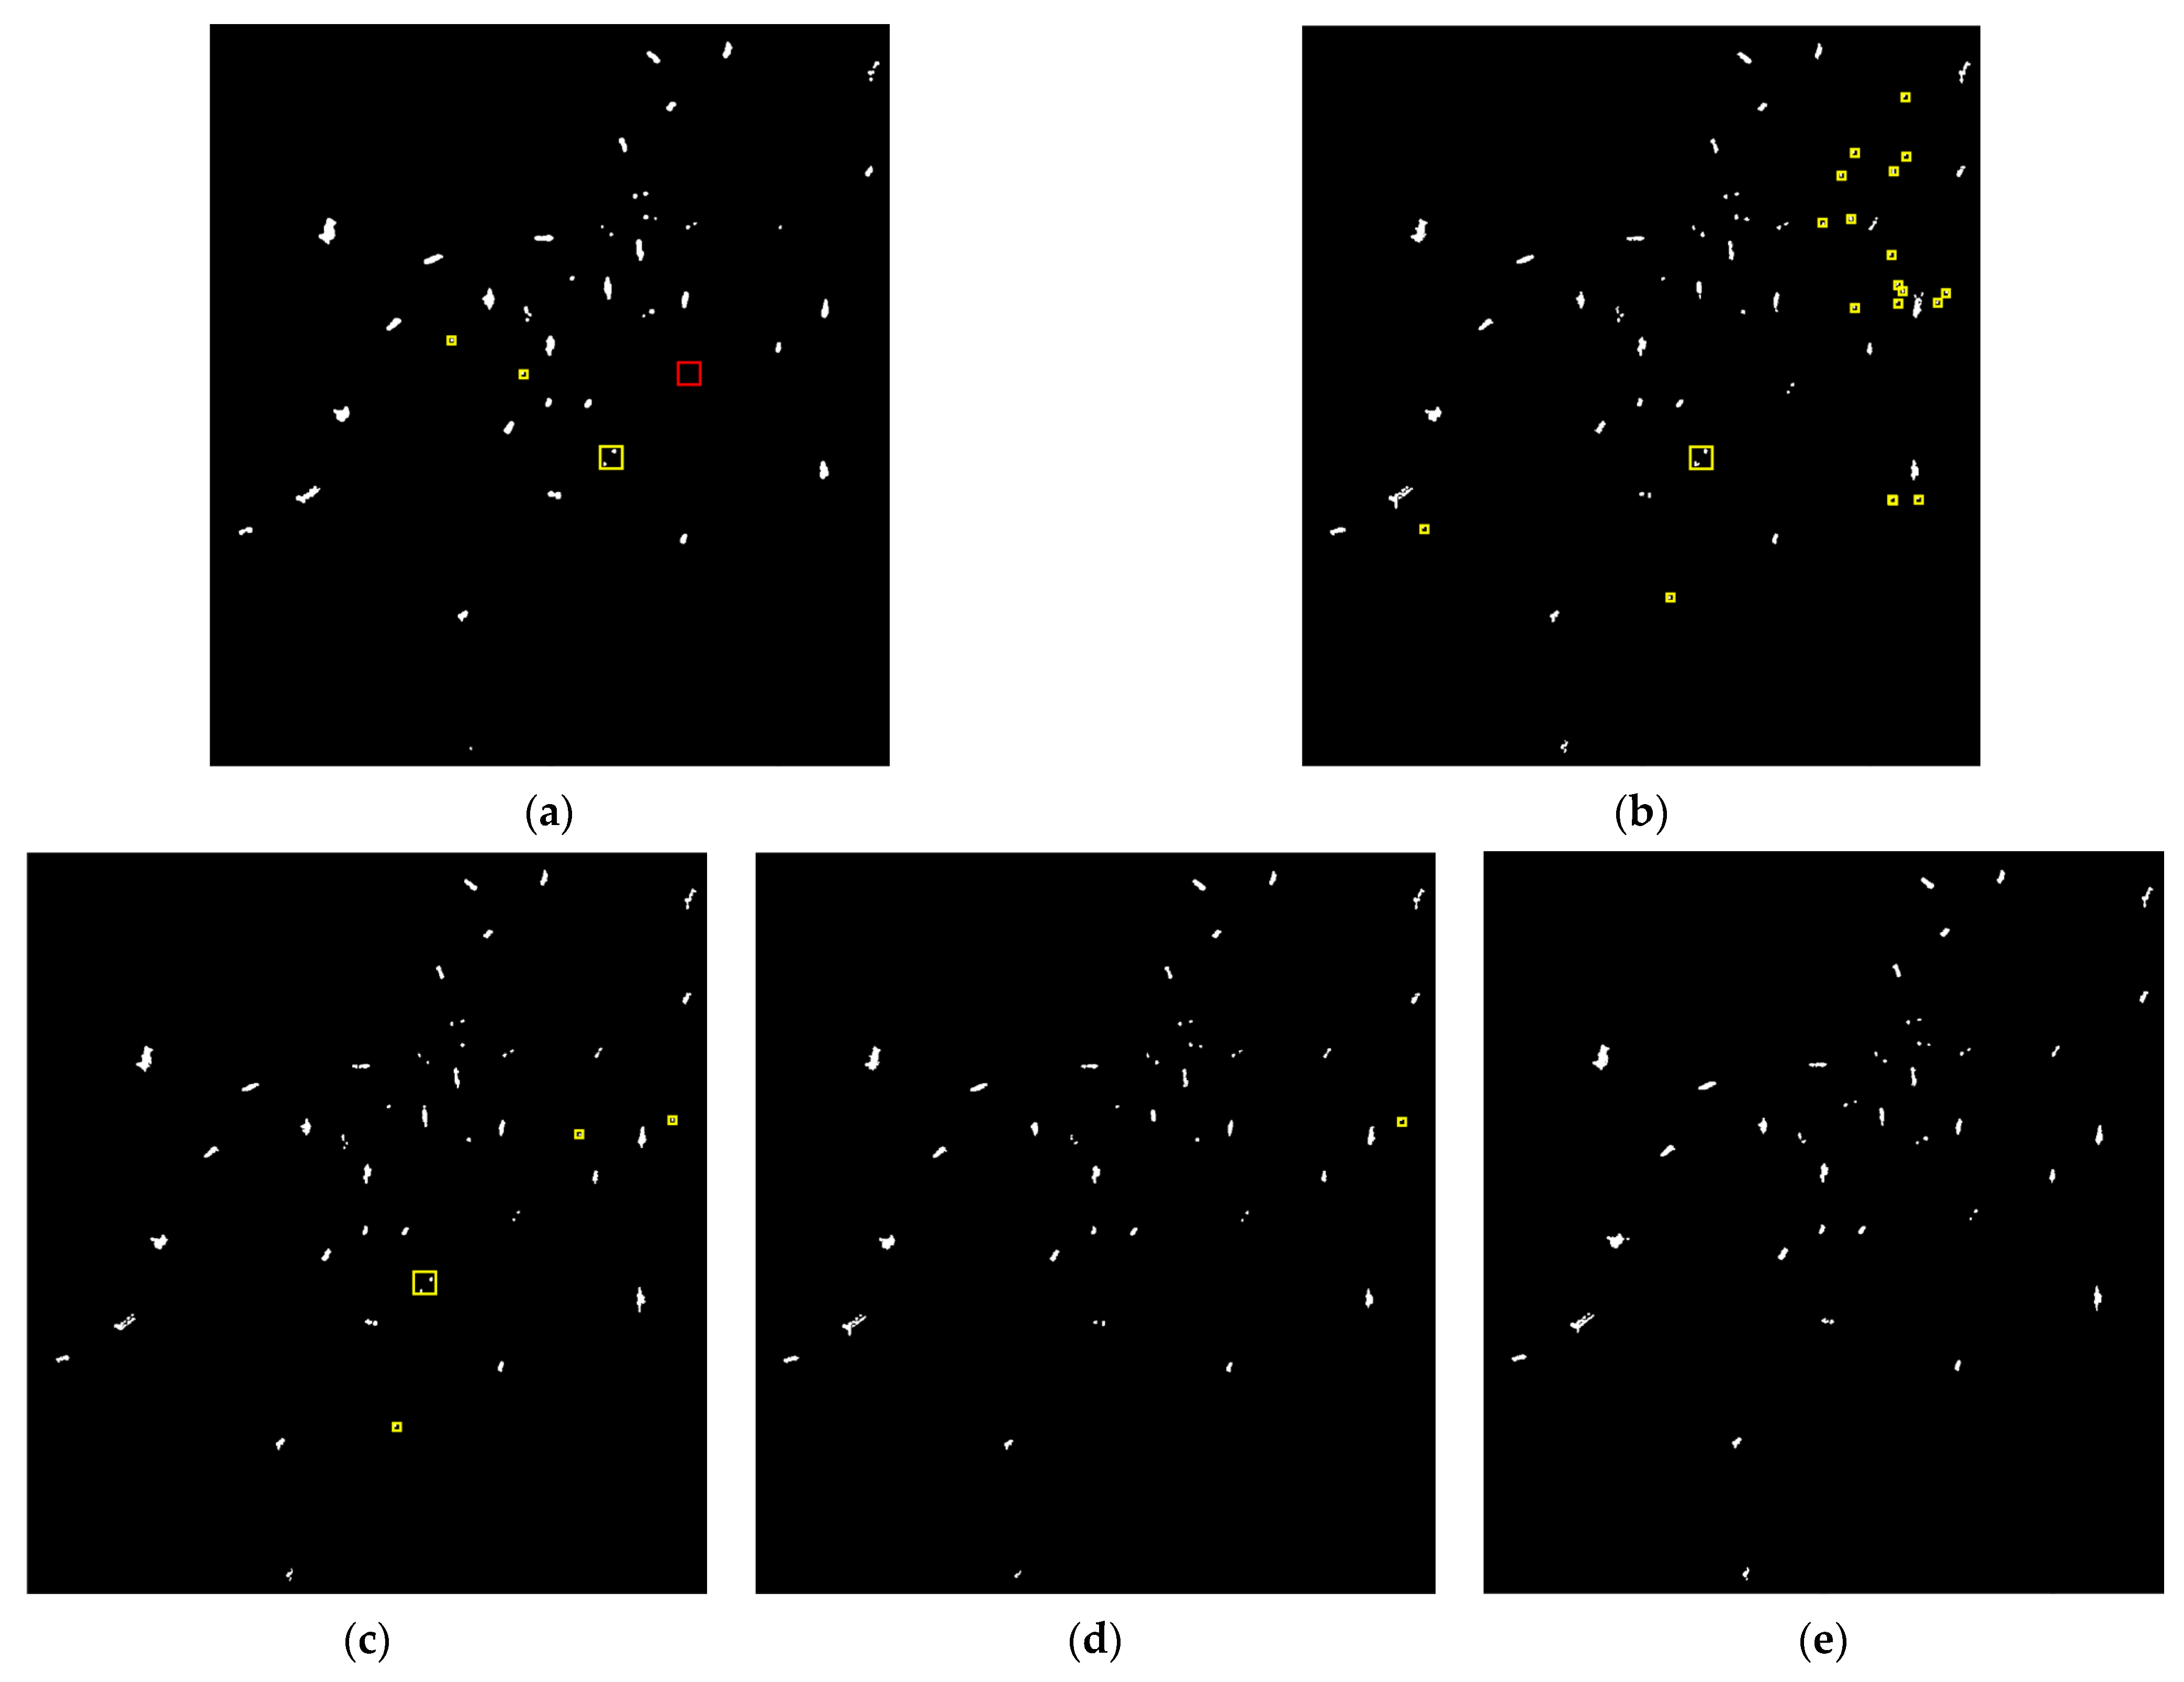
4.2. Result Comparison

The figure of merit (FoM), detection rate P d , and TCR are used as evaluation metrics, as shown in Equations (15)–(17). In Equations (15) and (16), TP represents the number of correctly detected targets, FN represents the number of missed detections, and FP represents the number of false alarms in the scene. E t and E s denote the values of the adopted detector for target and clutter, respectively.
P d = TP TP + FN
FoM = TP TP + FN + FP
TCR = 10 l o g 10 E t E s
This paper utilizes the OTSU thresholding method to obtain binary detection results for the GP-PNF, YAMA-PNF, ZT-PNF, and ECD-PNF methods. The threshold value for the SCLC method was obtained based on [30]. To minimize false alarms in the detection process, we used erosion and dilation processing to eliminate internal hollow areas of ships and obtain connected regions in the image as ship targets. Then, fewer than 15, 30, and 10 ship target pixels of the detection results are deleted in the Guangzhou area, Singapore area, and Pearl River area according to the number of minimum ship target pixels, respectively. The binary maps of the experimental results for different methods are shown in Figure 5, Figure 6 and Figure 7. False alarms are marked by the yellow rectangles, and missed detections are marked by the red rectangles. Table 2 presents the comparative detection results of different methods on different datasets.
In the PolSAR image of the Guangzhou area, the distribution of ships is relatively dense, and there are many strong scattering points in the image besides the ships. The GP-PNF method cannot distinguish between sea clutter and targets well, resulting in twelve false alarms being detected. By comparison, the SCLC method missed one target with an FoM of 0.942 and the YAMA-PNF method detected three false alarms with an FoM of 0.943. Both the ZT-PNF method and the ECD-PNF method detect one false alarm target.
In the PolSAR image of the Singapore area, the distribution of ships is denser, and the scale of ships varies greatly. There are also many strong scattering points in the image that do not belong to the targets, which can interfere with ship detection. As shown in Figure 6a,b, both the SCLC method and the GP-PNF method are not good at distinguishing strong scattering points of sea clutter from targets, and they also detect some strong scattering pixels around the ship as targets when the scattering of the ship targets is strong. As shown in Figure 6c,d, the YAMA-PNF and the ZT-PNF methods generate fewer false alarm detections with an FoM of 0.985 and 0.977, respectively. After Post-processing, the ECD-PNF method does not detect false alarms or miss targets with an FoM of 1.000. The proposed method reaches the highest among all the methods, as shown in Figure 6e.
In the PolSAR image of the Pearl River area, there is strong sea clutter and azimuth ambiguity in some regions, and the scattering energy of targets is relatively low, which could lead to false alarms and missed detections. As shown in the detection results of different methods, the SCLC method detected three false alarms targets and missed a target. The GP-PNF method detected a large number of false alarms, and it can be observed that these false alarms were mainly detected in regions with strong azimuthal ambiguity. The YAMA-PNF method also has a poor ability to remove azimuthal ambiguity and detected four false alarms. The ZT-PNF method can effectively reduce the reference of the azimuth ambiguity, and the result has an FoM of 0.974. By comparison, the ECD-PNF performed the best among all the methods, with an FoM of 1.000.
We validated the efficacy of our proposed method in enhancing the TCR by comparing the feature maps obtained by different methods. It should be noted that the features of the SCLC method were not compared with other features. Taking the PolSAR data of the Singapore area as an example, Figure 8 shows the corresponding detection feature maps obtained by the SCLC method. It can be observed that although the SCLC method can significantly enhance the contrast between ships and sea clutter, the sidelobe scattering and partial scattering of targets are very high. When ships are densely distributed, it can severely affect the detection results. Therefore, the features of the SCLC method were not presented, and the TCR values were not compared with those of other methods. Figure 9, Figure 10 and Figure 11 show the feature maps obtained by different detectors in various ROIs, which are extracted from Guangzhou, Singapore, and the Pearl River area, respectively. It can be seen that the feature values obtained by the GP-PNF detector cannot effectively suppress sea clutter and azimuth ambiguity. Compared to GP-PNF, the YAMA-PNF and ZT-PNF detectors perform better; however, their feature values still perform poorly when azimuth ambiguity is strong. In comparison to the other methods, the proposed features in this paper exhibit the best performance, and the feature values of the ships are significantly higher than the surrounding clutter even under strong azimuth ambiguity.
In this paper, we selected twelve ship targets within the blue rectangles in Figure 4(a1–a3) to compute the TCR. Table 3 shows the mean TCR values of Ship 1 to Ship 12 obtained by different detectors for different areas. Figure 12 shows the TCR comparison map from Ship 1 to Ship 12 for different detectors and areas. The radial radius represents the dB value. The red color represents the ECD-PNF detector, the yellow color represents the ZT-PNF detector, the green color represents the GP-PNF detector, and the blue color represents the YAMA-PNF detector. It can be observed that the ECD-PNF detector enhances the TCR of the targets more effectively compared to the other methods.
To further demonstrate the effectiveness of our proposed method, Figure 13 illustrates the pixel-level detection results after post-processing in terms of the ROC curve for different datasets. The P F A (false alarm probability) and P D (detection rate) within the ROC curve are calculated by the ratio of falsely detected pixels or correctly detected pixels to ground-truth pixels, as shown in Equation (18). N c is the number of false alarm pixels, N t is the number of correctly detected pixels, and N g t is the number of ground-truth pixels. From the results of the ROC curves, it can be observed that our proposed methods outperform the other methods in terms of pixel-level detection results in all three datasets.
P F A = N c N g t , P D = N t N g t

5. Discussion

By analyzing several sets of comparative experiments, we found that the ECD-PNF detector proposed in this paper can achieve the best performance. The SCLC method can effectively enhance the TCR, but it also enhances the sidelobe interference of the target and the scattering energy of some sea clutter. That is the reason why SCLC may increase false alarms during ship detection. The traditional GP-PNF method cannot enhance TCR and suppress interference well, and it was the least effective method in the experiments. ZT-PNF integrates the third eigenvalue with GP-PNF to remove azimuth ambiguity, YAMA-PNF uses the feature of four component polarimetric decomposition and reconstructs the expression of polarimetric coherence. Both methods can effectively highlight ship targets, but they do not perform well in suppressing the interference of strong scattering points around the target and in the sea clutter region. The ECD-PNF detector effectively suppresses interference while enhancing TCR, so it obtains fewer false alarms and more correct detections simultaneously. In general, the ECD-PNF detector proposed in this paper exhibits the best detection effect compared with other detectors. However, it should be noted that the proposed method still suffers from false alarms when detecting small targets or under high-sea-state conditions. Further analysis of the polarimetric scattering mechanism of ships is needed to construct more effective polarimetric features.

6. Conclusions

A novel nearshore ship detection method named ECD-PNF for PolSAR images is proposed by integrating superpixel-level GP-PNF and refined polarimetric decomposition. As part of the preprocessing, polarimetric superpixel segmentation is performed to better utilize the polarimetric and spatial information, and sea–land segmentation is performed to reduce the influence of land on ship detection. To estimate the sea clutter more accurately, an automatic censoring mechanism combined with superpixels is used to select the clutter and target superpixels. By integrating refined eight-component decomposition to better utilize the polarimetric information of the target and improve the target vector space, the physical interpretability of the detector is enhanced. Additionally, the expression of polarimetric coherence is modified to enhance the TCR. Finally, this paper combines the third eigenvalue to reduce the impact of azimuthal ambiguity, which contributes to further enhancing the TCR. Comparison studies with three kinds of spaceborne PolSAR datasets from Radarsat-2 and GF-3 clearly demonstrate the superiority of the proposed method. The FoM value reaches 0.980, 1.000, and 1.000, respectively. Through comparative experiments, it can be verified that the method proposed in this paper can effectively suppress azimuthal ambiguity and other interferences, enhance TCR in dense ship detection near the coast, and perform well in both pixel-level and target-level detection results. In future works, we will further analyze the polarimetric characteristics of ships and sea clutter, focusing on the detection of small ship targets under strong clutter interference. Additionally, we observed in our experiments that when ships are inshore, their scattering characteristics resemble those of man-made targets on land. Therefore, we will also consider the application of fine polarimetric scattering characteristics in shore-based scenarios.

Author Contributions

Conceptualization, W.W.; methodology, S.W.; resources, S.Q.; software, S.W.; supervision, W.W.; writing—original draft, S.W.; writing—review and editing, W.W., J.D., F.R., P.G. and H.F. All authors have read and agreed to the published version of the manuscript.

Funding

This work was supported by the Science and Technology Innovation Program of Hunan Province (No. 2023RC3019).

Data Availability Statement

Not applicable.

Acknowledgments

The authors would like to thank all the anonymous reviewers. Their constructive comments to improve this article are greatly appreciated.

Conflicts of Interest

The authors declare no conflicts of interest.

References

  1. Tian, C.; Liu, D.; Xue, F.; Lv, Z.; Wu, X. Faster and Lighter: A Novel Ship Detector for SAR Images. IEEE Geosci. Remote Sens. Lett. 2024, 21, 1–5. [Google Scholar] [CrossRef]
  2. Li, H.; Cui, X.; Chen, S. PolSAR Ship Detection with Optimal Polarimetric Rotation Domain Features and SVM. Remote Sens. 2021, 13, 3932. [Google Scholar] [CrossRef]
  3. Cui, X.; Tao, C.; Su, Y.; Chen, S. PolSAR Ship Detection Based on Polarimetric Correlation Pattern. IEEE Geosci. Remote Sens. Lett. 2021, 18, 471–475. [Google Scholar] [CrossRef]
  4. Gu, M.; Wang, Y.; Liu, H.; Wang, P. PolSAR Ship Detection Based on a SIFT-like PolSAR Keypoint Detector. Remote Sens. 2022, 14, 2900. [Google Scholar] [CrossRef]
  5. Gao, G.; Bai, Q.; Zhang, C.; Zhang, L.; Yao, L. Dualistic Cascade Convolutional Neural Network Dedicated to Fully PolSAR Image Ship Detection. ISPRS J. Photogramm. Remote Sens. 2023, 202, 663–681. [Google Scholar] [CrossRef]
  6. Gao, G.; Shi, G. CFAR Ship Detection in Nonhomogeneous Sea Clutter Using Polarimetric SAR Data Based on the Notch Filter. IEEE Trans. Geosci. Remote Sens. 2017, 55, 4811–4824. [Google Scholar] [CrossRef]
  7. Liu, T.; Zhang, J.; Gao, G.; Yang, J.; Marino, A. CFAR Ship Detection in Polarimetric Synthetic Aperture Radar Images Based on Whitening Filter. IEEE Trans. Geosci. Remote Sens. 2020, 58, 58–81. [Google Scholar] [CrossRef]
  8. Fan, W.; Zhou, F.; Tao, M.; Bai, X.; Shi, X.; Xu, H. An Automatic Ship Detection Method for PolSAR Data Based on K-Wishart Distribution. IEEE J. Sel. Top. Appl. Earth Obs. Remote Sens. 2017, 10, 2725–2737. [Google Scholar] [CrossRef]
  9. Liu, G.; Zhang, X.; Meng, J. A Small Ship Target Detection Method Based on Polarimetric SAR. Remote Sens. 2019, 11, 2938. [Google Scholar] [CrossRef]
  10. Chaney, R.; Bud, M.; Novak, L. On the Performance of Polarimetric Target Detection Algorithms. IEEE Aerosp. Electron. Syst. Mag. 1990, 5, 10–15. [Google Scholar] [CrossRef]
  11. Novak, L.; Burl, M.; Irving, W. Optimal Polarimetric Processing for Enhanced Target Detection. IEEE Trans. Aerosp. Electron. Syst. 1993, 29, 234–244. [Google Scholar] [CrossRef]
  12. Novak, L.; Burl, M. Optimal Speckle Reduction in Polarimetric SAR Imagery. IEEE Trans. Aerosp. Electron. Syst. 1990, 26, 293–305. [Google Scholar] [CrossRef]
  13. Pappas, O.; Achim, A.; Bull, D. Superpixel-Level CFAR Detectors for Ship Detection in SAR Imagery. IEEE Geosci. Remote Sens. Lett. 2018, 15, 1397–1401. [Google Scholar] [CrossRef]
  14. Huang, X.; Huang, P.; Dong, L.; Song, H.; Yang, W. Saliency Detection Based on Distance Between Patches in Polarimetric SAR Images. In Proceedings of the 2014 IEEE Geoscience and Remote Sensing Symposium, Quebec City, QC, Canada, 13–18 July 2014. [Google Scholar]
  15. Liu, T.; Yang, Z.; Marino, A.; Gao, G.; Yang, J. PolSAR Ship Detection Based on Neighborhood Polarimetric Covariance Matrix. IEEE Trans. Geosci. Remote Sens. 2021, 59, 4874–4887. [Google Scholar] [CrossRef]
  16. Zhang, T.; Du, Y.; Yang, Z.; Quan, S.; Liu, T.; Xue, F.; Chen, Z.; Yang, J. PolSAR Ship Detection Using the Superpixel-Based Neighborhood Polarimetric Covariance Matrices. IEEE Geosci. Remote Sens. Lett. 2022, 19, 4015105. [Google Scholar] [CrossRef]
  17. Velotto, D.; Nunziata, F.; Migliaccio, M.; Lehner, S. Dual-Polarimetric TerraSAR-X SAR Data for Target at Sea Observation. IEEE Geosci. Remote Sens. Lett. 2013, 10, 1114–1118. [Google Scholar] [CrossRef]
  18. Gao, S.; Liu, H. Polarimetric SAR Ship Detection Based on Scattering Characteristics. IEEE J. Miniaturization Air Space Syst. 2022, 3, 197–203. [Google Scholar] [CrossRef]
  19. Singh, G.; Malik, R.; Mohanty, S.; Rathore, V.; Yamada, K.; Umemura, M.; Yamaguchi, Y. Seven-Component Scattering Power Decomposition of POLSAR Coherency Matrix. IEEE Trans. Geosci. Remote Sens. 2019, 57, 8371–8382. [Google Scholar] [CrossRef]
  20. Chen, S.; Li, Y.; Wang, X.; Xiao, S.; Sato, M. Modeling and Interpretation of Scattering Mechanisms in Polarimetric Synthetic Aperture Radar: Advances and Perspectives. IEEE Signal Process. Mag. 2014, 31, 79–89. [Google Scholar] [CrossRef]
  21. Cameron, W.; Youssef, N.; Leung, L. Simulated Polarimetric Signatures of Primitive Geometrical Shapes. IEEE Trans. Geosci. Remote Sens. 1996, 34, 793–803. [Google Scholar] [CrossRef]
  22. Ringrose, R.; Harris, N. Ship Detection Using Polarimetric SAR Data. In SAR Workshop: CEOS Committee on Earth Observation Satellites; Ringrose, R., Harris, N., Eds.; European Space Agency: Paris, France, 2000; Volume 450, p. 687. [Google Scholar]
  23. Touzi, R.; Charbonneau, F.; Hawkins, R.; Murnaghan, k.; Kavoun, X. Ship-Sea Contrast Optimization When Using Polarimetric SARS. In Proceedings of the IEEE 2001 International Geoscience and Remote Sensing Symposium, Sydney, NSW, Australia, 9–13 July 2001; pp. 426–428. [Google Scholar]
  24. Cloude, S.; Pottier, E. A Review of Target Decomposition Theorems in Radar Polarimetry. IEEE Trans. Geosci. Remote Sens. 1996, 34, 498–518. [Google Scholar] [CrossRef]
  25. Guo, R.; Zhang, L.; Li, J.; Xing, M.; Zang, B.; Bao, Z. A Novel Strategy of Nonnegative-Matrix-Factorization-Based Polarimetric Ship Detection. IEEE Geosci. Remote Sens. Lett. 2011, 8, 1085–1089. [Google Scholar] [CrossRef]
  26. Freeman, A.; Durden, S. A Three-Component Scattering Model for Polarimetric SAR Data. IEEE Trans. Geosci. Remote Sens. 1998, 36, 963–973. [Google Scholar] [CrossRef]
  27. Yamaguchi, Y.; Moriyama, T.; Ishido, M.; Yamada, H. Four-Component Scattering Model for Polarimetric SAR Image Decomposition. IEEE Trans. Geosci. Remote Sens. 2005, 43, 1699–1706. [Google Scholar] [CrossRef]
  28. Sugimoto, M.; Ouchi, K.; Nakamura, Y. On the Novel Use of Model-Based Decomposition in SAR Polarimetry for Target Detection on the Sea. Remote Sens. Lett. 2013, 4, 843–852. [Google Scholar] [CrossRef]
  29. Zhang, T.; Yang, Z.; Gan, H.; Xiang, D.; Zhu, S.; Yang, J. PolSAR Ship Detection Using the Joint Polarimetric Information. IEEE Trans. Geosci. Remote Sens. 2020, 58, 8225–8241. [Google Scholar] [CrossRef]
  30. Pan, X.; Wu, Z.; Yang, L.; Huang, Z. Ship Detection Method Based on Scattering Contribution for PolSAR Image. IEEE Geosci. Remote Sens. Lett. 2022, 19, 4503205. [Google Scholar] [CrossRef]
  31. Marino, A. A Notch Filter for Ship Detection with Polarimetric SAR Data. IEEE J. Sel. Top. Appl. Earth Obs. Remote Sens. 2013, 6, 1219–1232. [Google Scholar] [CrossRef]
  32. Marino, A.; Hajnsek, I. Statistical Tests for a Ship Detector Based on the Polarimetric Notch Filter. IEEE Trans. Geosci. Remote Sens. 2015, 53, 4578–4595. [Google Scholar] [CrossRef]
  33. Zhang, T.; Marino, A.; Zhong, W.; Xiong, H. An Azimuth ambiguities removal method based on Polarimetric Notch Filter. In Proceedings of the IEEE International Geoscience and Remote Sensing Symposium, Fort Worth, TX, USA, 23–28 July 2017; pp. 2325–2328. [Google Scholar]
  34. Liu, W.; Chen, J.; Zhen, Y.; Zhao, Y. Polarimetric SAR Ship Detection Using Improved Notch Filter Based on Yamaguchi Decomposition. J. Geomat. Sci. Technol. 2017, 34, 44–48. [Google Scholar]
  35. Guo, Y.; Chen, S.; Zhan, R.; Wang, W.; Zhang, J. LMSD-YOLO: A Lightweight YOLO Algorithm for Multi-Scale SAR Ship Detection. Remote Sens. 2022, 14, 4801. [Google Scholar] [CrossRef]
  36. Zhang, T.; Zhang, X.; Shi, J.; Wei, S.; Wang, J.; Li, J.; Su, H.; Zhou, Y. Balance Scene Learning Mechanism for Offshore and Inshore Ship Detection in SAR Images. IEEE Geosci. Remote Sens. Lett. 2022, 19, 4004905. [Google Scholar] [CrossRef]
  37. Wang, D.; Zhang, C.; Han, M. FIAD Net: A Fast SAR Ship Detection Network Based on Feature Integration Attention and Self-Supervised Learning. Int. J. Remote Sens. 2022, 43, 1485–1513. [Google Scholar] [CrossRef]
  38. Fan, W.; Zhou, F.; Bai, X.; Shi, X.; Hu, X. Ship Detection Using Deep Convolutional Neural Networks for PolSAR Images. Remote Sens. 2019, 11, 2862. [Google Scholar] [CrossRef]
  39. Bai, Q.; Gao, G.; Zhang, X.; Yao, L.; Zhang, C. LSDNet: Lightweight CNN Model Driven by PNF for PolSAR Image Ship Detection. IEEE J. Miniat. Air Space Syst. 2022, 3, 135–142. [Google Scholar] [CrossRef]
  40. Deng, J.; Wang, W.; Quan, S.; Zhan, R.; Zhang, J. Hierarchical Superpixel Segmentation for PolSAR Images Based on the Boruvka Algorithm. Remote Sens. 2022, 14, 4721. [Google Scholar] [CrossRef]
  41. Gao, G.; Liu, L.; Zhao, L.; Shi, G.; Kuang, G. An Adaptive and Fast CFAR Algorithm Based on Automatic Censoring for Target Detection in High-Resolution SAR Images. IEEE Trans. Geosci. Remote Sens. 2009, 47, 1685–1697. [Google Scholar] [CrossRef]
  42. Greatbatch, I. Polarimetric Radar Imaging: From basics to applications. Int. J. Remote Sens. 2012, 33, 661–662. [Google Scholar] [CrossRef]
  43. Xiang, D.; Ban, Y.; Su, Y. Model-Based Decomposition with Cross Scattering for Polarimetric SAR Urban Areas. IEEE Geosci. Remote Sens. Lett. 2015, 12, 2496–2500. [Google Scholar] [CrossRef]
  44. Singh, G.; Yamaguchi, Y. Model-Based Six-Component Scattering Matrix Power Decomposition. IEEE Trans. Geosci. Remote Sens. 2018, 56, 5687–5704. [Google Scholar] [CrossRef]
  45. Quan, S.; Qin, Y.; Xiang, D.; Wang, W.; Wang, X. Polarimetric Decomposition-Based Unified Manmade Target Scattering Characterization with Mathematical Programming Strategies. IEEE Trans. Geosci. Remote Sens. 2022, 60, 5203718. [Google Scholar] [CrossRef]
  46. Xiang, D.; Ban, Y.; Wang, W.; Su, Y. Adaptive Superpixel Generation for Polarimetric SAR Images with Local Iterative Clustering and SIRV Model. IEEE Trans. Geosci. Remote Sens. 2017, 55, 3115–3131. [Google Scholar] [CrossRef]
Figure 1. The flowchart of the ECD-PNF detector.
Remotesensing 16 01095 g001
Figure 2. The flowchart of the superpixel-level GP-PNF with AC mechanism.
Remotesensing 16 01095 g002
Figure 3. The scattering analysis. (a) Energy map of the eight-component decomposition results for the ship. (bd) The scattering energy proportions of different ship targets. (e) The scattering energy proportions of strong sidelobe scattering. (f) The scattering energy composition of azimuthal ambiguity. (g) The scattering energy composition of sea clutter.
Remotesensing 16 01095 g003aRemotesensing 16 01095 g003b
Figure 4. Experimental datasets. (a1a3) Pauli pseudo-color images of the Guangzhou area, Singapore area, and Pearl River area, respectively. (b1b3) ground-truth images of the Guangzhou area, Singapore area, and Pearl River area, respectively.
Remotesensing 16 01095 g004
Figure 5. The detection results of different methods on the Radarsat-2 dataset of the Guangzhou area. (a) SCLC. (b) GP-PNF. (c) YAMA-PNF. (d) ZT-PNF. (e) ECD-PNF.
Remotesensing 16 01095 g005aRemotesensing 16 01095 g005b
Figure 6. The detection results of different methods on the Radarsat-2 dataset of the Singapore area. (a) SCLC. (b) GP-PNF. (c) YAMA-PNF. (d) ZT-PNF. (e) ECD-PNF.
Remotesensing 16 01095 g006aRemotesensing 16 01095 g006b
Figure 7. The detection results of different methods on the Radarsat-2 dataset of the Pearl River area. (a) SCLC. (b) GP-PNF. (c) YAMA-PNF. (d) ZT-PNF. (e) ECD-PNF.
Remotesensing 16 01095 g007
Figure 8. Detection feature maps of SCLC in the Singapore area.
Remotesensing 16 01095 g008
Figure 9. Feature maps obtained of different detectors in the Guangzhou area. (a) ROI. (b) GP-PNF. (c) YAMA-PNF. (d) ZT-PNF. (e) ECD-PNF.
Remotesensing 16 01095 g009
Figure 10. Feature maps obtained of different detectors in the Singapore area. (a) ROI. (b) GP-PNF. (c) YAMA-PNF. (d) ZT-PNF. (e) ECD-PNF.
Remotesensing 16 01095 g010
Figure 11. Feature maps obtained of different detectors in the Pearl River area. (a) ROI. (b) GP-PNF. (c) YAMA-PNF. (d) ZT-PNF. (e) ECD-PNF.
Remotesensing 16 01095 g011
Figure 12. TCR results of Ship 1–Ship 12 for different detectors and areas. (a) Guangzhou area. (b) Singapore area. (c) Pearl River area.
Remotesensing 16 01095 g012
Figure 13. The ROC curve of the detection results for different detectors and areas. (a) Guangzhou area. (b) Singapore area. (c) Pearl River area.
Remotesensing 16 01095 g013
Table 1. Experimental data information.
SensorImaging AreaAcquisition DateSize
(Range × Azimuth)
Resolution
(Range × Azimuth)
Ship Number
Radarsat-2Guangzhou31 May 2019515 pixels × 379 pixels8 m × 8 m50
GF-3Singapore27 May 20232002 pixels × 2842 pixels8 m × 8 m129
GF-3Pearl River5 August 20171008 pixels × 924 pixels8 m × 8 m37
Table 2. Quantitative result comparison of different methods on different datasets.
AreaMethodTPFNFP P d FoM
GuangzhouSCLC49120.9800.942
GP-PNF500121.0000.806
YAMA-PNF50030.9800.943
ZT-PNF50011.0000.980
ECD-PNF50011.0000.980
SingaporeSCLC1290131.0000.908
GP-PNF1290131.0000.908
YAMA-PNF129021.0000.985
ZT-PNF129031.0000.977
ECD-PNF129001.0001.000
Pearl RiverSCLC36130.9730.900
GP-PNF361190.9730.643
YAMA-PNF37041.0000.902
ZT-PNF37011.0000.974
ECD-PNF37001.0001.000
Table 3. Mean TCR values of Ship 1–Ship 12 for different areas and detectors (dB).
AreaMethod
GP-PNFYAMA-PNFZT-PNFECD-PNF
Guangzhou19.5622.1735.2744.54
Singapore36.9747.2750.6766.86
Pearl River33.3342.8750.9860.39
Disclaimer/Publisher’s Note: The statements, opinions and data contained in all publications are solely those of the individual author(s) and contributor(s) and not of MDPI and/or the editor(s). MDPI and/or the editor(s) disclaim responsibility for any injury to people or property resulting from any ideas, methods, instructions or products referred to in the content.

