
Multi-Sensor Classification Framework of Urban Vegetation for Improving Ecological Services Management

1
The Remote Sensing Laboratory, Jacob Blaustein Institutes for Desert Research, Ben-Gurion University of the Negev, Sede Boker 8499000, Israel
2
The Environmental Sensing Laboratory, Department of Civil and Environmental Engineering, Ben-Gurion University of the Negev, Beer-Sheva 8410501, Israel
3
The Goldman Sonnenfeldt School of Sustainability and Climate Change, Ben-Gurion University of the Negev, Beer-Sheva 8410501, Israel
*
Author to whom correspondence should be addressed.
Remote Sens. 2024, 16(6), 1110; https://doi.org/10.3390/rs16061110
Submission received: 28 January 2024
/
Revised: 19 March 2024
/
Accepted: 20 March 2024
/
Published: 21 March 2024
(This article belongs to the Special Issue Urban Green Spaces: Understanding Their Form, Structure and Composition Using Remote Sensing)
Abstract
:Recent climatic changes have profoundly impacted the urban microclimate, exposing city dwellers to harsh living conditions. One effective approach to mitigating these events involves incorporating more green infrastructure into the cityscape. The ecological services provided by urban vegetation play a crucial role in enhancing the sustainability and livability of cities. However, monitoring urban vegetation and accurately estimating its status pose challenges due to the heterogeneous nature of the urban environment. In response to this, the current study proposes utilizing a remote sensing-based classification framework to enhance data availability, thereby improving practices related to urban vegetation management. The aim of the current research is to explore the spatial pattern of vegetation and enhance the classification of tree species within diverse and complex urban environments. This study combines various remote sensing observations to enhance classification capabilities. High-resolution colored rectified aerial photographs, LiDAR-derived products, and hyperspectral data are merged and analyzed using advanced classifier methods, specifically partial least squares-discriminant analysis (PLS-DA) and object-based image analysis (OBIA). The OBIA method demonstrates an impressive overall accuracy of 95.30%, while the PLS-DA model excels with a remarkable overall accuracy of 100%. The findings validate the efficacy of incorporating OBIA, aerial photographs, LiDAR, and hyperspectral data in improving tree species classification and mapping within the context of PLS-DA. This classification framework holds significant potential for enhancing management practices and tools, thereby optimizing the ecological services provided by urban vegetation and fostering the development of sustainable cities.
1. Introduction
Green infrastructures (GIs) are pivotal in urban ecosystems, gaining heightened importance amid current climatic changes [1,2,3,4]. Urban vegetation’s well-documented impact on human well-being [5] and the environment underscores its significance. Urban microclimates, shaped by various factors, prominently feature the influence of urban vegetation. GIs emerge as powerful tools, notably mitigating the urban heat island (UHI) effect [6,7]. Leveraging evapotranspiration, GIs dissipate heat, effectively reducing the UHI effect [6,8]. Strategic urban planning mandates meticulous consideration of GIs, encompassing factors like vegetation composition, density, and climate conditions, to combat urban heat effectively [9]. For instance, Marando et al. (2022) ascertain that achieving a 1 °C temperature decrease in European cities requires a minimum tree cover of 16% [7]. Such findings offer invaluable insights for city planners and policymakers, guiding efforts toward cultivating cooler urban environments, a critical endeavor amid ongoing climate change.
GIs also play a role in the urban CO2 flux balance, challenging the common perception of vegetation solely acting as a net CO2 sink for cities. Contrarily, the entire urban GI system may function as a net CO2 source, introducing complexity to its environmental impact [10]. This intricate interplay is influenced by diverse factors, including climate variations [11], vegetation types [12,13], soil characteristics [14], and management practices (such as irrigation, pest control, and maintenance) [14]. Despite vegetation’s role as a clear CO2 sink through photosynthesis [15], soil CO2 fluxes can counterbalance this effect, potentially increasing overall CO2 emissions [14]. Recent studies exemplify this variability: urban areas in Seoul, even with substantial vegetation cover, were identified as CO2 sources [15], while Warsaw, accounting for diverse urban areas, functions as a CO2 sink due to its GIs [16]. Velasco et al. (2016) underline the contextual nature of GIs, acting as either sinks or sources contingent on climate and seasonality [10]. Understanding these dynamics is pivotal for effective urban carbon management strategies.
Urban GIs offer crucial benefits, including enhanced thermal comfort through shading [17,18], decreased water runoff [19], and improved air quality [20,21]. Urban vegetation effectively reduces pollutants like particulate matter, nitrogen oxide, and ozone [22], especially in pollution hotspots like urban street canyons [23]. Strategic urban vegetation planning has the potential to mitigate air pollution and positively impact environmental health. Recognizing and optimizing the ecological services of urban GIs demand improved management practices, providing city planners and policymakers with valuable tools for sustainable urban development.
Municipalities face the challenge of managing urban vegetation, including species diversity and overall vegetation health [24,25]. The wide array of urban vegetation presents difficulties in acquiring specific information, as different plant species exhibit varying capacities to absorb airborne contaminants [26]. The selection of vegetation species carries significant implications for the urban environment, as certain species may contribute to ecological damage through emissions of volatile organic compounds and allergens [27,28]. Effectively gathering this essential information is crucial for maintaining the ecological services provided by urban vegetation [26,29,30]. Improved data acquisition is vital for informed decision-making in urban vegetation management.
The expenses and time associated with monitoring urban vegetation have prompted the exploration of automated mapping approaches [31]. The intricacies of urban vegetation mapping arise from the heterogeneous land cover in the urban environment, marked by frequent land cover changes within small areas and high spectral variability [32,33]. Advances in remote sensing methods and the increased spatial resolution of satellite sensors have improved the precision of urban vegetation mapping [29,34]. Drones, airplanes, and satellites serve as key platforms for regional observations, each offering distinct spatial, temporal, and spectral resolutions. Aerial passive sensor platforms typically provide superior spatial resolutions, albeit with limited coverage and revisit times.
Light Detection and Ranging (LiDAR), an active remote sensing sensor often mounted on airplanes or drones, employs pulsed laser light to gauge variable distances to the Earth’s surface. LiDAR excels at capturing diverse structural properties among vegetation species, allowing for the differentiation between lawns, bushes, and trees. In contrast, passive spectral sensors measure the light reflected from objects, each possessing a unique spectral signature. Integrating LiDAR with spectral sensors proves instrumental in distinguishing various land covers, significantly enhancing mapping and classification accuracy in urban environments [35,36,37,38]. Numerous studies have showcased LiDAR’s capability to differentiate vegetation species and leverage tree morphology for species-specific identification in vegetation mapping [39].
Enhancing the classification of tree species involves integrating LiDAR-derived height data with hyperspectral optical information [29,40]. The hyperspectral technique, employed for land cover classification, detects radiation across numerous narrow spectral bands spanning the visible (400–700 nm), near-infrared (NIR, 700–1100 nm), and shortwave infrared (SWIR, 400 and 2500 nm) ranges. This technique can be implemented using ground-based equipment, drones, airplanes, or, to a lesser extent, satellites. While LiDAR-derived spatial features were deemed more crucial than optical data [41,42], integrating LiDAR and hyperspectral images remains indispensable for accurately classifying a diverse range of tree species [31].
Classifying tree species using hyperspectral data poses challenges, with various studies employing different methods, such as variants of linear discriminant analysis—canonical or stepwise discriminant analyses—for classification [43]. The support vector machine (SVM) algorithm, integrating terrestrial laser data with hyperspectral images, has also been utilized [44]. Some studies have explored endmember spectra for vegetation species mapping through the spectral angle mapper (SAM) or spectral mixture analysis (SMA) [45,46,47]. Recently, deep learning approaches have emerged in urban vegetation discrimination and classification [48,49,50].
Among these methods, partial least squares-discriminant analysis (PLS-DA) is an effective supervised classifier for maximizing separation among predefined classes [51,52]. PLS-DA, a parametric method, identifies variables and directions in multivariate space, determining available classes in a calibration set. By maximizing covariance between samples of each class, PLS-DA sharpens their separation, producing latent variables suitable for hyperspectral data classification. Providing understandable graphical representations, typically in 2D or 3D, PLS-DA reveals spectral regions and differences between classes and allows statistical evaluation of their significance. Therefore, PLS-DA possesses highly sought-after properties by spectral data users, particularly for urban vegetation classification.
The study explored various preprocessing transformations (PPTs) to optimize PLS-DA outcomes, including averaging, centering, smoothing, standardizing, and normalizing [51]. Previous research has highlighted the effectiveness of different combinations of these PPTs [53]. Auto-scaling (AS), a widely embraced PPT, involves dividing each variable by its standard deviation after mean-centering each sample’s spectral signature. This normalization ensures that each variable’s signal aligns equally with other variables’ signals [54].
Smoothing, implemented using the Savitzky–Golay technique, involves a convolution of successive subsets of neighboring data points fitted to a low-degree polynomial through a simplified least squares fit method. The Savitzky–Golay smoothing algorithm, applied to the second derivatives of reflectance spectra (SG2D), utilizes a second-order polynomial fit and a 15-band window. According to a related study, this low-pass filter minimizes high-frequency noise without significantly impacting the signal of interest, making it an ideal spectral PPT [55,56].
Given the geometric variability of features in urban areas, object-based image analysis (OBIA) provides a viable approach for assessing the spatial distribution of urban features [36,57]. In contrast to pixel-based methods, OBIA breaks down images into objects through segmentation, classifying them based on their texture, shape, contrast, size, spatial, and spectral properties [58,59]. While some researchers still rely on manual demarcation of vegetation features [29,60,61], eCognition Developer algorithms automate the segmentation/classification processes [34,62,63]. Due to the complexity of urban environments and mixed pixel issues, studies often favor OBIA for mapping urban vegetation [32,57,64]. Integrating LiDAR and high spatial resolution imagery with OBIA further enhances classification accuracy [40,65,66].
The present study posits that integrating multiple remote sensing observation systems and employing advanced image processing methods will enhance the classification capabilities of urban vegetation. The aim of the current research is to explore the spatial pattern of vegetation and enhance the classification of tree species within diverse and complex urban environments. This study has two specific objectives: (1) to employ object-based image analysis (OBIA) with high-resolution orthophoto and LiDAR-derived features to scrutinize the spatial distribution patterns within the study area and (2) to utilize the partial least squares-discriminant analysis (PLS-DA) model with hyperspectral samples for discerning and categorizing tree species within the study area. To achieve these objectives, the project integrates high-resolution colored rectified aerial photographs, LiDAR-derived products, and hyperspectral data, subjecting them to advanced classifier methods, including PLS-DA and OBIA. This proposed framework is demonstrated in an urban neighborhood characterized by diverse tree species.
2. Materials and Methods
2.1. Study Area
This study was conducted in Modi’in, situated in the central region of Israel. Founded in 1996, the city now boasts a population of nearly 100,000 people. Modi’in features a Mediterranean climate, with an average annual precipitation of 525 mm and an elevation averaging around 200 m above mean sea level, with hills reaching 300 m. The research focused on a neighborhood spanning approximately 0.25 km2. Constructed between 2013 and 2018, the neighborhood primarily consists of low-rise buildings ranging from 2 to 5 stories. In situ measurements were carried out in a local open green space of about 4500 m2 at the neighborhood’s center (Figure 1).
2.2. Methodology
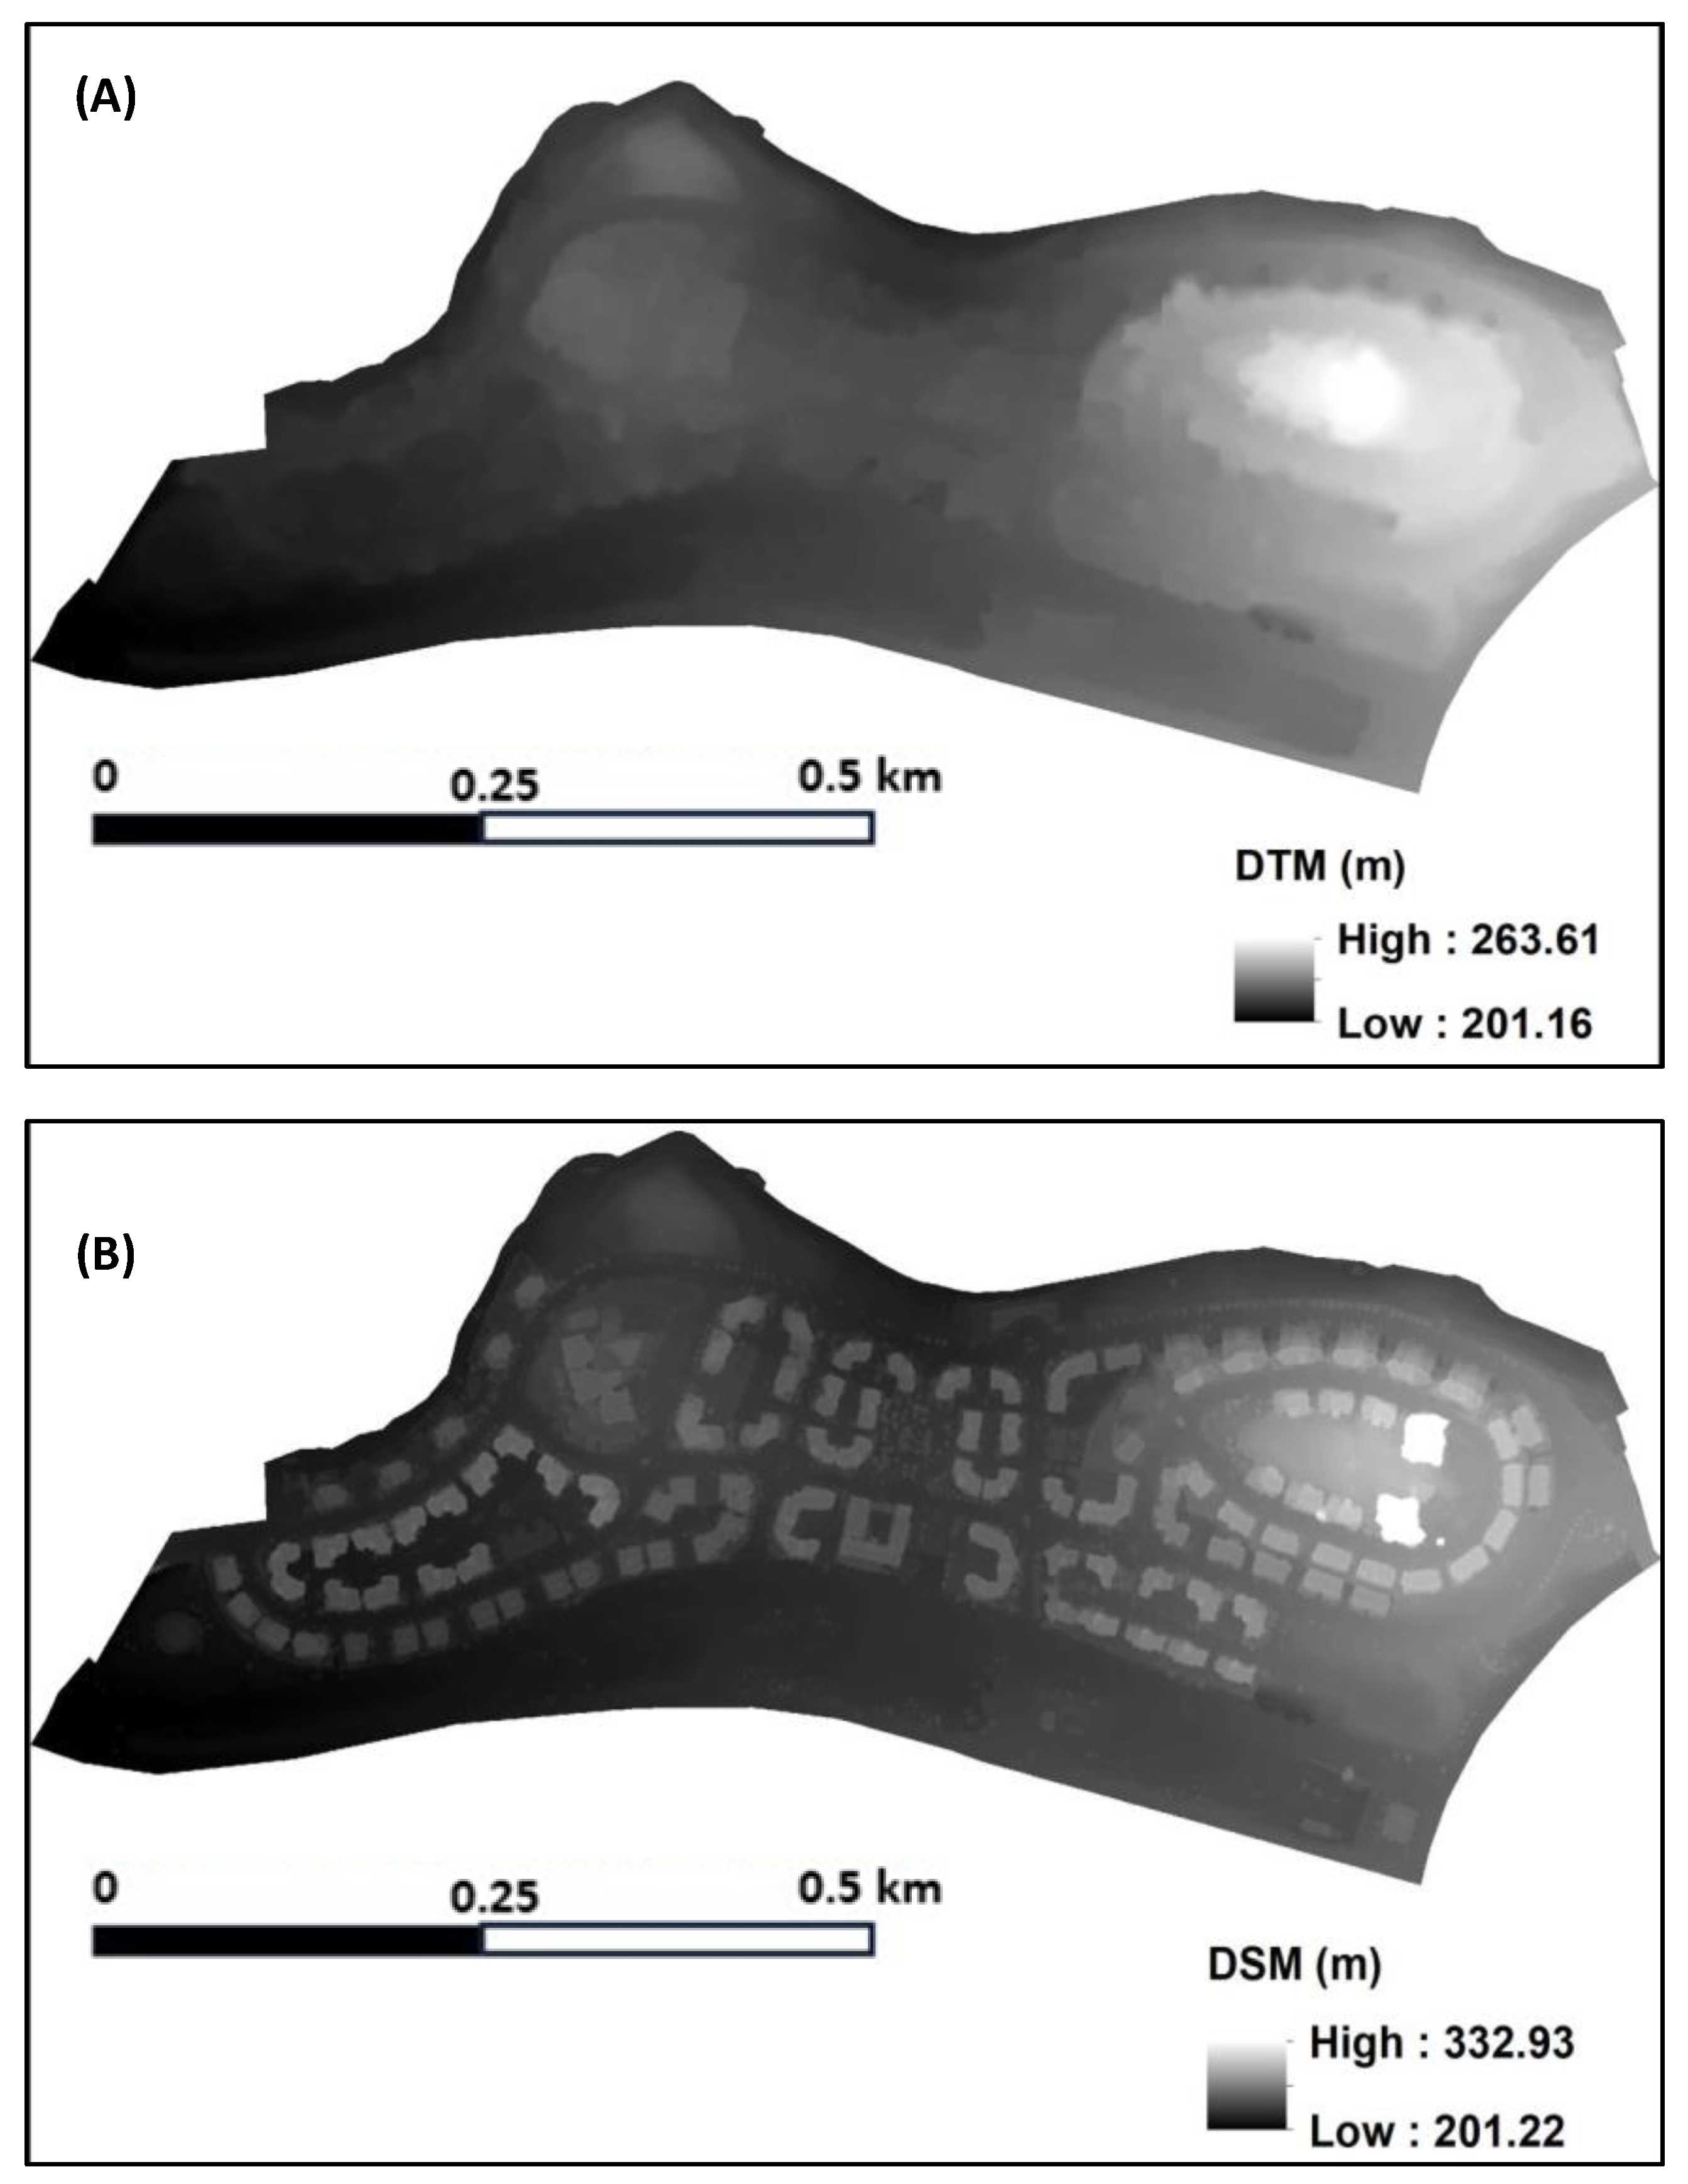
This study integrated high-resolution geo-rectified aerial photographs (orthophoto), airborne LiDAR imagery, and hyperspectral data. The LiDAR data collected in 2023 featured a raw point cloud density of two points per m2. The Digital Terrain Model (DTM) (Figure 2A) and the Digital Surface Model (DSM) (Figure 2B) were obtained at a 0.2 m resolution from Ofek Aerial Photography. Additionally, a high-resolution geo-rectified orthophoto, acquired in 2021 at the same 0.2 m resolution from Ofek Aerial Photography, comprised four bands (Red, Green, Blue, and NIR). The hyperspectral data were gathered using portable analytical spectral devices (ASD) spectrometers in the designated open green space.
The methodology, depicted in Figure 3, unfolds through distinct stages to fulfill the study objective. Initiating with LiDAR data, the groundwork and surface elevations—termed DTM and DSM, respectively—were derived. Applying object-based image analysis (OBIA) to the orthophoto and LiDAR outputs yielded the spatial characteristics within the study zone. A precision evaluation was conducted on the OBIA-classified image. Subsequently, the partial least squares-discriminant analysis (PLS-DA) classifier processed collected the hyperspectral samples to distinguish diverse tree species. Comprehensive insights into each process are expounded in the ensuing subsections.
2.3. Object-Based Image Analysis (OBIA) and Accuracy Assessment
The eCognition Developer program, applying an object-oriented approach [67], played a pivotal role in unraveling spatial intricacies within the available area. Object-based image analysis (OBIA) commenced by treating a single pixel as an object, fostering amalgamation based on homogeneity factors like shape, color, texture, and size. Employing a multiresolution image segmentation algorithm, the orthophoto, digital DSM, and DTM coalesced into distinct image objects. Table 1 illustrates input parameters for the multiresolution segmentation algorithm at the pixel level.
Object-based image classification was applied to the segmented image to discern land use and land cover features. The segmentation facilitated a two-level classification (Level I and Level II) (Figure 4), incorporating a normalized DSM (nDSM) (Figure 5A), providing elevation insights derived from the DSM and DTM disparity. nDSM values facilitated the delineation of three primary classes: Buildup area, Vegetation, and Roads. Extracting urban vegetation involved computing the Normalized Difference Vegetation Index (NDVI) [68] from the orthophoto’s red and NIR spectral values (Figure 5B):
The following decision rules were derived for Level-I classification:
- Buildup area (1 < nDSM > 6)
- Roads (nDSM < 0.4)
- Vegetation (NDVI > 0.3)
Finally, the Level-II classification (see Figure 6) hierarchy separates the “Vegetation” class into four other classes, namely Grass, Bushes, Young trees, and Mature trees.
- Grass (nDSM < 0.2)
- Bushes (0.2 < nDSM ≤ 1)
- Young trees (1 < nDSM ≤ 2)
- Mature trees (2 < nDSM)
Figure 4.
The performed object-based classification decision rules.

Figure 5.
Maps depicting the studied neighborhood in Modi’in are derived from (A) the normalized DSM (nDSM) and (B) the Normalized Difference Vegetation Index (NDVI).
Figure 5.
Maps depicting the studied neighborhood in Modi’in are derived from (A) the normalized DSM (nDSM) and (B) the Normalized Difference Vegetation Index (NDVI).

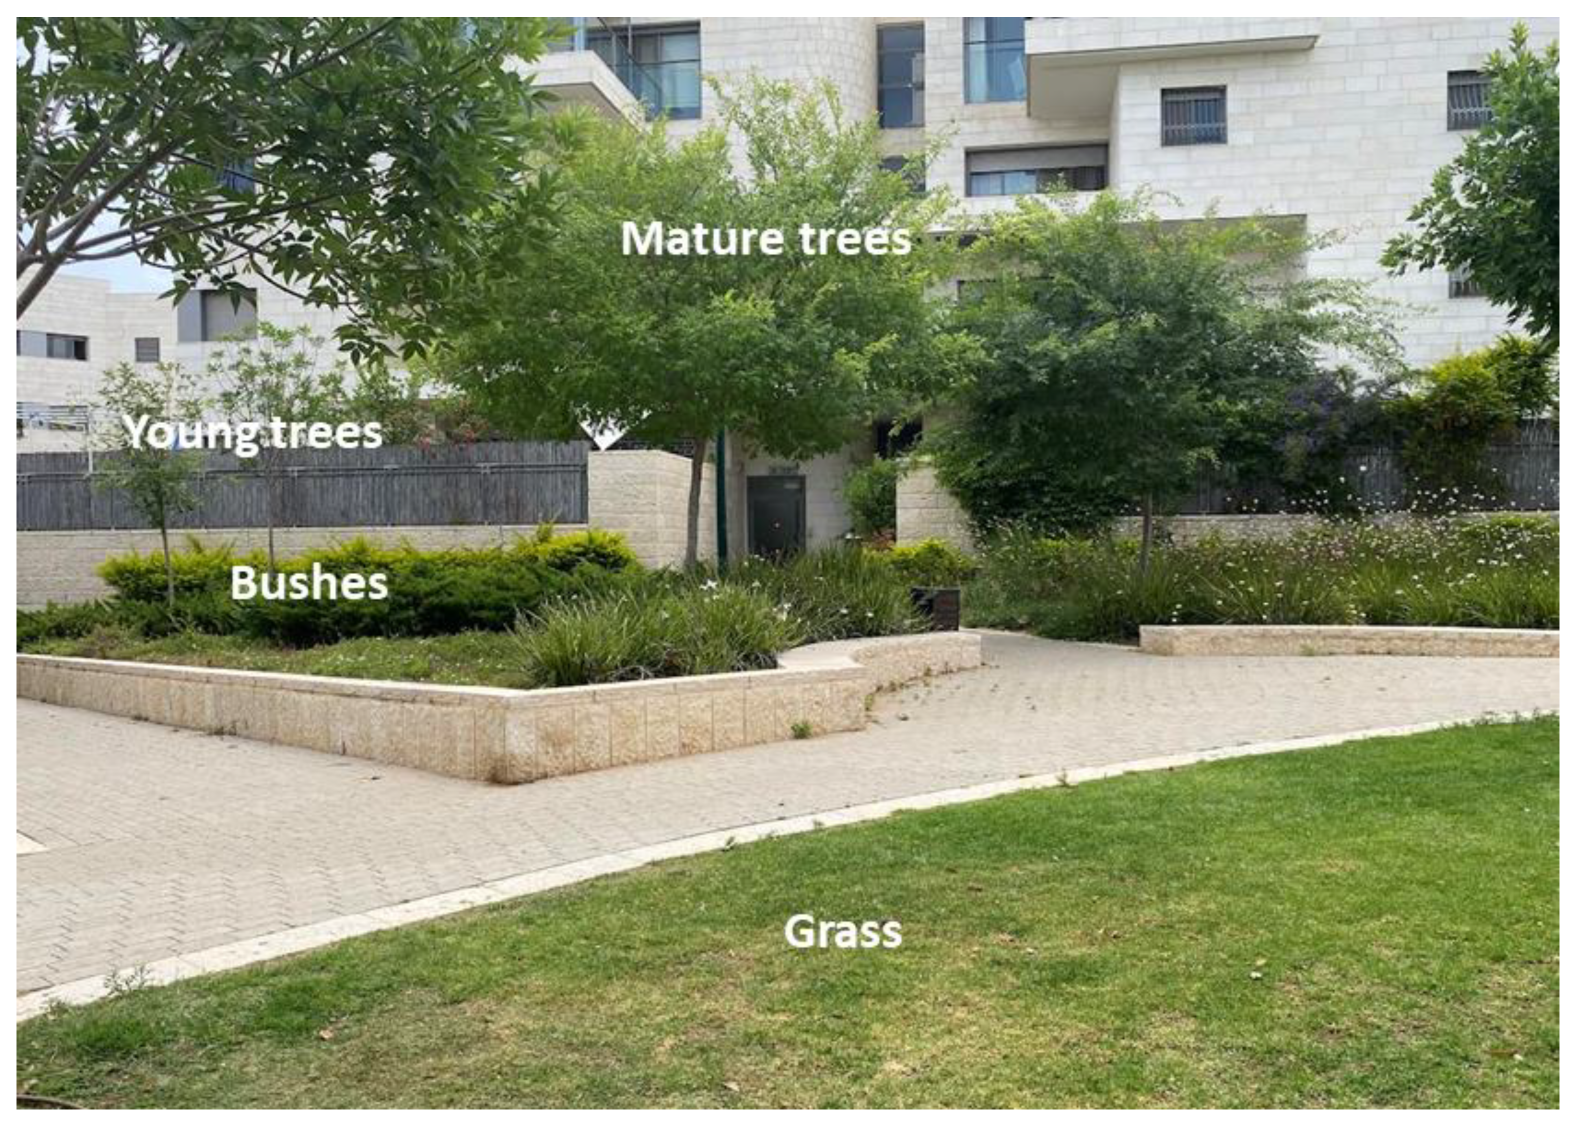
Figure 6.
Different classes of Level-II classification. These classes were captured in the open green space in the studied neighborhood at Modi’in.
Figure 6.
Different classes of Level-II classification. These classes were captured in the open green space in the studied neighborhood at Modi’in.

The classification accuracy assessment utilized a high-resolution orthophoto overlaid with a canopy layer from the Survey of Israel (Figure 7). A tree canopy map served as a reference, and individual trees were precisely mapped using a real-time kinematic global positioning system (RTK-GPS) with a 10 m accuracy. A total of 675 samples were collected for the “Vegetation” class, while approximately 100 random reference samples were generated for the “Buildup area” and “Roads” classes. OBIA provided feature statistics (NDVI and nDSM), which were extracted as vector polygon features using eCognition Developer. Spatial joining of two vector polygon features—random reference samples and image objects—occurred in ArcGIS. The 873 reference samples underwent object-based classification based on the decision rules outlined in Section 2.3. The comprehensive accuracy assessment procedure is illustrated in Figure 8, culminating in the comparison of all reference sample polygon classes with the object-based classified image and the calculation of a confusion matrix to estimate overall accuracy [69,70].
2.3.1. PLS-DA Classification Modeling and Accuracy Assessment
Field Data
During the growing season, a field campaign was conducted in May 2023 as part of this study. The geographic coordinates of specific trees identified by the municipal agronomist were assessed using an RTK-GPS. Fresh leaf samples were promptly collected and scanned using a plant probe equipped with a leaf clip connected to portable analytical spectral device (ASD) spectrometers. This instrument encompasses 2150 bands spanning the 350–2500 nm range, covering the visible, near-infrared (NIR), and shortwave infrared (SWIR) spectra, with a spectral resolution of approximately 1–2 nm.
Leaves from seven tree species—namely Platanus orientalis, Ulmus parvifolia, Cercis siliquastrum, Koelreuteria bipinnata, Fraxinus uhdei, Olea europaea, and Ceratonia siliqua—were identified and sampled (Figure 8). These specific species were marked and cross-referenced with the OBIA classification. Approximately 50 samples were collected from each species, and their reflectance values were subsequently averaged.
Species Classification and Accuracy Assessment
The PPTs in this study were ordered as GSLW + SG2D + AS. To create the filter matrix via generalized least squares weighting (GLSW), implemented in the PLS Toolbox (Eigen-vector Research Incorporated) within MATLAB R2020a (Mathworks, Natick, MA, USA), the variations between pairs or groups of samples that should be comparable were considered [54]. The α parameter, crucial for specifying how significantly GLSW reduces weight interferences, was set to 0.02 after optimization. Smaller adjustments increase filtering, while higher adjustments reduce it (usually below 0.001 and above 0.02).
In the post-PT application, the PLS-DA algorithm was executed using the PLS Toolbox. The classification was performed for each tree species based on sampled leaves collected near the urban open green space where most species were available. Only the “Mature trees” class from the OBIA classification was considered for this analysis. The optimized algorithms yielded multiple latent variables (LVs) [54]. Cross-validation employed the Venetian blinds method with ten repetitive random subsets, maintaining a 70:30 split ratio for calibration and validation sets [71,72]. Accuracy evaluation was performed iteratively across the same ten validation subgroups, and the outcomes for the ten classes were averaged.
3. Results
3.1. Object-Based Classification and Accuracy Assessment
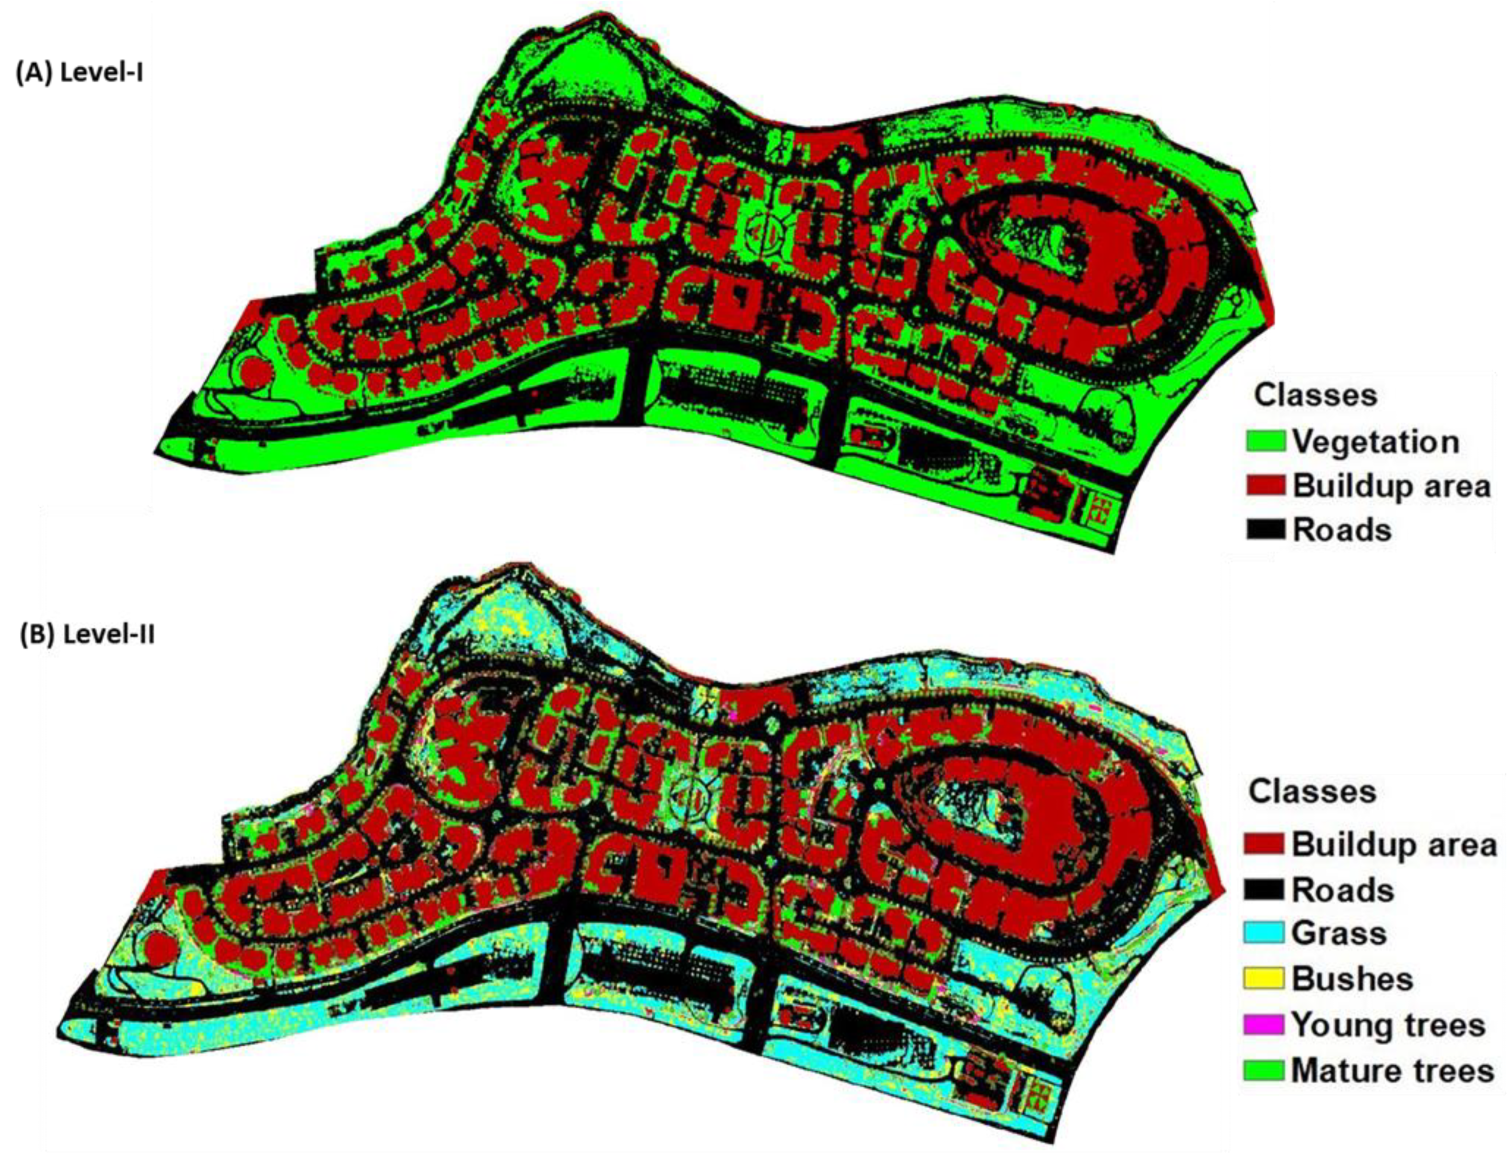
The multiresolution segmentation algorithm was employed to introduce objects into the OBIA, and a two-level classification system (Level I and Level II) was applied. Level I classified the map into three major categories: Buildup area, Vegetation, and Roads (Figure 9A). The “Vegetation” class underwent further classification in Level II, distinguishing Grass, Bushes, Young Trees, and Mature trees (Figure 9B).
For Level-I classification, an error confusion matrix was computed using the spatial statistics of the objects. Cross-validation of selected reference samples was performed with the final classified image. Achieving an overall accuracy of 95.30%, the study considered some misclassification among the major classes (Buildup area, Vegetation, and Roads) (Table 2). The User and Producer accuracy for the “Vegetation” class, the focal point of the study, were 95.70% and 99.54%, respectively.
3.2. PLS-DA Classification Modeling and Accuracy Assessment
The PLS-DA cross-validation (CV) hyperspectral model for the identified seven species was fine-tuned using six latent variables (LVs), representing the score coefficients of individual samples in a specific projection. Figure 10 displays the scores of each class for the three potential combinations of LVs. Remarkably, a substantial enhancement in model accuracy was observed with the adopted sequence of combinations of PPTs (GSLW + SG2D + AS). The overall accuracy of species classification reached 100%.
4. Discussion
4.1. The Developed Framework Performance
The presented study employs a method that integrates OBIA with high-resolution orthophoto and LiDAR-derived features to analyze the spatial pattern distribution of the study area. Additionally, the PLS-DA model is implemented with hyperspectral samples to distinguish and categorize the tree species present in the area.
This study enhances previous efforts utilizing PLS-DA models for tree species classification [73]. Three remote sensing data sources were fused and preprocessed to prepare for the PLS-DA model. Firstly, terrain features were derived using LiDAR. In contrast to prior studies [74], where LiDAR data were employed to differentiate vegetation species, the terrain features, such as DTM and DSM, were combined with aerial photographs to identify the spatial distribution of significant features.
Secondly, a high-resolution orthophoto was utilized to extract and categorize more vegetation classes based on the NDVI to enhance classification. OBIA was employed to recognize and classify spatial features using LiDAR observations and multispectral aerial photographs. This resulted in a group of homogeneous pixels classified into three major categories: Buildup area, Vegetation, and Roads. Since Vegetation exhibits a diverse variety but appears to have a similar NDVI value, the LiDAR elevation information, nDSM, assisted in distinguishing four additional classes: Grass, Bushes, Young trees, and Mature trees. Subsequently, hyperspectral samples were collected and utilized with the PLS-DA model to differentiate between the identified tree species [52,53]. The primary intended benefit of this OBIA procedure was to map various spatial features in the area and aid in geolocating the mature trees, further classified into seven tree species using the PLS-DA model.
All the collected hyperspectral samples underwent PPTs before being integrated into the PLS-DA model for training and testing. The study analysis demonstrated that when subjected to preprocessing, spectral data were accurately classified with PLS-DA. The highest classification accuracy was attained through the application of specific preprocessing steps, namely GSLW + SG2D + AS. Rozenstein et al. compared different preprocessing transformations (PPTs) and found these three to be the most effective ones associated with PLS-DA [51].
This study highlights the effectiveness of PLS-DA in accurately classifying tree-leaf reflectance data. In the presented case study, two classifications were conducted. The first aim was to map the vegetation in the area, further categorizing it into four classes: Grass, Bushes, Young trees, and Mature trees. The second aim involved the optimal application of PPTs to classify Mature tree species. In both instances, the classification accuracy approached perfection. These findings underscore the importance of selecting the appropriate PPT, as it can significantly enhance the accuracy of the classification model when dealing with spectral data, particularly in scenarios where class separability is minimal.
4.2. The Developed Framework Merits and Limitations
The methodology showcased in this study exhibited high performance in classifying vegetation types. However, the presented decision rules may not prove as efficient in a different, more complex environment with a greater variety of vegetation types and higher structural density. For instance, local shrubs, being relatively small in this region, might be inaccurately classified as trees in areas where they can grow higher than one meter. Therefore, it is imperative to tailor the methodology to the specific characteristics of the region of interest to ensure its optimal applicability.
This study revealed that the combination of GSLW + SG2D + AS was particularly effective in increasing the variance across tree species while reducing within-species variance. These PPTs could prove suitable for applications requiring consistent spectral information in the VIS-NIR-SWIR region. Although optimal preprocessing techniques may vary for specific datasets, predicting a priori which strategy will be most effective poses a challenge. This paper elucidates the suitable PPTs for a specific dataset (leaf spectra, in the current case). The same methodology can be applied to airborne or satellite hyperspectral data [75].
Creating a precise spectral model poses a significant challenge, and determining the optimal preprocessing strategy is crucial for accurate classification. Parameters such as spectrum variation across classes, noise effects, the total number of classes, and spectral resolution further influence classification accuracy. Environmental factors, including sunlight, temperature, water content, humidity, and composition, impact leaf spectra, necessitating standardized data preparation and assessment methods. Utilizing multiple PPTs may be instrumental in developing a precise model, particularly when the input data exhibit significant class separability [51]. PPTs might perform exceptionally well in achieving the most accurate model when dealing with low spectral differences or a limited number of samples for calibration. This complexity is heightened when transitioning from single-point observations to hyperspectral image spectroscopy, introducing new challenges.
The tree canopy map facilitated locating the mature trees, which is crucial for sampling and PLS-DA modeling through OBIA. However, the main challenge arose in species classification due to insufficient feature information. Initially, the field-marked trees were considered reliable ground-truth samples. Yet the primary difficulty arose from the visual similarity of leaves among some species. Hyperspectral sampling proved essential for effective discrimination in such instances. Combining LiDAR and hyperspectral sensing was found to improve tree classification in a much-condensed environment [76]. Zhang et al. (2012) demonstrated the ability to use hyperspectral imaging only to classify six urban tree species [77]. However, the examined trees had a much different morphology from one another, which assisted in feature extraction.
The overall accuracy of the PLS-DA model reached an impressive 100%. However, this high accuracy is expected when considering the measurement type—specifically, in situ hyperspectral leaf measurements. Hyperspectral measurements encompass numerous features, unlike the constrained information in airborne or satellite multispectral imagery. Moreover, this method avoids atmospheric interference, distinguishing it from remotely sensed reflectance. Nevertheless, there are significant testimonies of the ability to use locally generated models using in situ measurements with remote sensing imagery, at least for quantitative models [78,79].
4.3. Possible Contributions to Urban Vegetation Management and Ecological Services
The motivation behind developing such a classification framework is to enhance urban vegetation management, potentially replacing traditional, labor-intensive vegetation surveys in the future [80]. Utilizing a similar framework based on remotely sensed observations can enable local municipalities to streamline survey procedures, saving human resources. Knowing the specific vegetation species facilitates more efficient analysis of remotely sensed observations, aiding in assessing their health status and enhancing urban vegetation control.
Moreover, advanced, remotely sensed-based methods can benefit from this classification framework for deeper insights. For instance, predictive methods for evapotranspiration and photosynthesis achieve better accuracy when observing a known vegetation species. Each species has unique transpiration and photosynthetic capacities [81,82], and employing generic models might introduce significant biases. Generating species-specific models with the aid of this classification framework is poised to reduce uncertainty levels.
Furthermore, the classification framework offers insights into understanding vegetation’s impact on UHI and urban air pollution. Cross-referencing the classified vegetation maps with heat or air pollution maps helps discern the role of each vegetation type in mitigating these issues [18,83]. Moreno et al. (2023) showed that there are tree species that impact the UHI effect more significantly than others [83]. Some GIs reduce heat through efficient transpiration and shading [9,82], while others excel at capturing air pollutants [21]. This knowledge empowers city planners to optimize the composition of urban GIs to create more sustainable cities amid current climate uncertainties.
5. Conclusions
In this study, OBIA was employed to delineate the spatial pattern distribution of a neighborhood in Modi’in, Israel. The high-resolution orthophoto yielded more precise spatial data, complemented by LiDAR, providing valuable terrain information and spatial feature demarcations. OBIA facilitated the geolocation of mature trees and the mapping of various spatial attributes in the area. The NDVI amplified the identification of vegetation cover. Leveraging LiDAR elevation data, specifically the nDSM, allowed for a more detailed sub-classification of vegetation. This study utilized a hyperspectral camera to measure the spectra of seven distinct tree species, enabling their identification and categorization. The results affirm the suitability of PLS-DA for highly accurate modeling of spectral reflectance in tree leaves, with the combination of GSLW + SG2D + AS yielding the most accurate results.
Identifying specific plant species enables the mapping and monitoring of their distribution, offering a valuable tool for effective vegetation management in urban areas. This classification framework not only aids in distinguishing vegetation species but also opens avenues for utilizing various remote sensing applications to assess the ecological functions of the vegetation, such as evapotranspiration and productivity estimations. Urban vegetation is crucial to enhancing the urban environment, yet human resource limitations often constrain conventional monitoring practices. The development of remote sensing-based applications facilitates more efficient monitoring of vegetation, maximizing its contributions. This advancement holds the potential to foster the creation of sustainable and people-friendly cities. Future endeavors will involve tackling more challenging urban landscape scenarios and incorporating time-lapse studies to effectively showcase the efficiency gains in vegetation recording and mapping.
Author Contributions
Conceptualization, A.T., O.K. and A.K.; Methodology, A.T., O.K. and A.K.; Software, A.T.; Formal analysis, A.T.; Investigation, J.B. and H.B.; Resources, O.K.; Writing—original draft, A.T., O.K. and A.K.; Writing—review & editing, O.K. and A.K.; Supervision, O.K. and A.K. All authors have read and agreed to the published version of the manuscript.
Funding
This research was supported by the Goldman Sonnenfeldt School of Sustainability and Climate Change, Ben Gurion University of the Negev, and the Environment and Sustainability Research Center of the Open University of Israel.
Data Availability Statement
Data are contained within the article.
Conflicts of Interest
The authors declare no conflicts of interest.
References
- Cadenasso, M.L.; Pickett, S.T.A.; Grove, M.J. Integrative Approaches to Investigating Human-Natural Systems: The Baltimore Ecosystem Study. Nat. Sci. Soc. 2006, 14, 4–14. [Google Scholar] [CrossRef]
- Pickett, S.T.A.; Cadenasso, M.L.; Grove, J.M.; Boone, C.G.; Groffman, P.M.; Irwin, E.; Kaushal, S.S.; Marshall, V.; McGrath, B.P.; Nilon, C.H.; et al. Urban Ecological Systems: Scientific Foundations and a Decade of Progress. J. Environ. Manag. 2011, 92, 331–362. [Google Scholar] [CrossRef] [PubMed]
- Andersson, E.; Mcphearson, T.; Kremer, P.; Gomez-Baggethun, E.; Haase, D.; Tuvendal, M.; Wurster, D. Scale and Context Dependence of Ecosystem Service Providing Units. Ecosyst. Serv. 2014, 12, 157–164. [Google Scholar] [CrossRef]
- Mcphearson, T.; Kremer, P.; Hamstead, Z.A. Mapping Ecosystem Services in New York City: Applying a Social-Ecological Approach in Urban Vacant Land. Ecosyst. Serv. 2013, 5, 11–26. [Google Scholar] [CrossRef]
- Nutsford, D.; Pearson, A.L.; Kingham, S. An Ecological Study Investigating the Association between Access to Urban Green Space and Mental Health. Public Health 2013, 127, 1005–1011. [Google Scholar] [CrossRef] [PubMed]
- Winbourne, J.B.; Jones, T.S.; Garvey, S.M.; Harrison, J.L.; Wang, L.; Li, D.; Templer, P.H.; Hutyra, L.R. Tree Transpiration and Urban Temperatures: Current Understanding, Implications, and Future Research Directions. Bioscience 2020, 70, 576–588. [Google Scholar] [CrossRef]
- Marando, F.; Heris, M.P.; Zulian, G.; Udías, A.; Mentaschi, L.; Chrysoulakis, N.; Parastatidis, D.; Maes, J. Urban Heat Island Mitigation by Green Infrastructure in European Functional Urban Areas. Sustain. Cities Soc. 2022, 77, 103564. [Google Scholar] [CrossRef]
- Gao, K.; Santamouris, M.; Feng, J. On the Efficiency of Using Transpiration Cooling to Mitigate Urban Heat. Climate 2020, 8, 69. [Google Scholar] [CrossRef]
- Zhou, W.; Yu, W.; Zhang, Z.; Cao, W.; Wu, T. How Can Urban Green Spaces Be Planned to Mitigate Urban Heat Island Effect under Different Climatic Backgrounds? A Threshold-Based Perspective. Sci. Total Environ. 2023, 890, 164422. [Google Scholar] [CrossRef] [PubMed]
- Velasco, E.; Roth, M.; Norford, L.; Molina, L.T. Does Urban Vegetation Enhance Carbon Sequestration? Landsc. Urban Plan. 2016, 148, 99–107. [Google Scholar] [CrossRef]
- Wang, J.; Xiang, Z.; Wang, W.; Chang, W.; Wang, Y. Impacts of Strengthened Warming by Urban Heat Island on Carbon Sequestration of Urban Ecosystems in a Subtropical City of China. Urban Ecosyst. 2021, 24, 1165–1177. [Google Scholar] [CrossRef]
- Li, P.; Wang, Z.H. Environmental Co-Benefits of Urban Greening for Mitigating Heat and Carbon Emissions. J. Environ. Manag. 2021, 293, 112963. [Google Scholar] [CrossRef]
- Zhang, K.; Gong, Y.; Fa, H.; Zhao, M. CO2 Flux Characteristics of Different Plant Communities in a Subtropical Urban Ecosystem. Sustainability 2019, 11, 4879. [Google Scholar] [CrossRef]
- Dorendorf, J.; Eschenbach, A.; Schmidt, K.; Jensen, K. Both Tree and Soil Carbon Need to Be Quantified for Carbon Assessments of Cities. Urban Urban Green 2015, 14, 447–455. [Google Scholar] [CrossRef]
- Park, C.; Jeong, S.; Park, M.S.; Park, H.; Yun, J.; Lee, S.S.; Park, S.H. Spatiotemporal Variations in Urban CO2 Flux with Land-Use Types in Seoul. Carbon Balance Manag. 2022, 17, 3. [Google Scholar] [CrossRef]
- Bezyk, Y.; Sówka, I.; Górka, M. Assessment of Urban CO2 Budget: Anthropogenic and Biogenic Inputs. Urban Clim. 2021, 39, 100949. [Google Scholar] [CrossRef]
- Zhao, Q.; Wentz, E.A.; Murray, A.T. Tree Shade Coverage Optimization in an Urban Residential Environment. Build Environ. 2017, 115, 269–280. [Google Scholar] [CrossRef]
- Speak, A.; Montagnani, L.; Wellstein, C.; Zerbe, S. The Influence of Tree Traits on Urban Ground Surface Shade Cooling. Landsc. Urban Plan. 2020, 197, 103748. [Google Scholar] [CrossRef]
- Li, L.; Uyttenhove, P.; Van Eetvelde, V. Planning Green Infrastructure to Mitigate Urban Surface Water Flooding Risk—A Methodology to Identify Priority Areas Applied in the City of Ghent. Landsc. Urban Plan. 2020, 194, 103703. [Google Scholar] [CrossRef]
- Han, L.; Tan, X.; Zhou, W.; Li, W.; Qian, Y. Better Urban Vegetation Planning for Maximum Utility in Air Pollutant Reduction: A Theoretical Perspective and Preliminary Analysis in Chinese Cities. Sustain. Cities Soc. 2020, 62, 102377. [Google Scholar] [CrossRef]
- Lindén, J.; Gustafsson, M.; Uddling, J.; Watne, Å.; Pleijel, H. Air Pollution Removal through Deposition on Urban Vegetation: The Importance of Vegetation Characteristics. Urban For. Urban Green. 2023, 81, 127843. [Google Scholar] [CrossRef]
- Araminienė, V.; Sicard, P.; Černiauskas, V.; Coulibaly, F.; Varnagirytė-Kabašinskienė, I. Estimation of Air Pollution Removal Capacity by Urban Vegetation from Very High-Resolution Satellite Images in Lithuania. Urban Clim. 2023, 51, 101594. [Google Scholar] [CrossRef]
- Chen, X.; Wang, X.; Wu, X.; Guo, J.; Zhou, Z. Influence of Roadside Vegetation Barriers on Air Quality inside Urban Street Canyons. Urban For. Urban Green. 2021, 63, 127219. [Google Scholar] [CrossRef]
- Roman, L.A.; Pearsall, H.; Eisenman, T.S.; Conway, T.M.; Fahey, R.T.; Landry, S.; Vogt, J.; van Doorn, N.S.; Grove, J.M.; Locke, D.H.; et al. Human and Biophysical Legacies Shape Contemporary Urban Forests: A Literature Synthesis. Urban For. Urban Green. 2018, 31, 157–168. [Google Scholar] [CrossRef]
- Behm, J.E. Is Biodiversity Needed for Sustainability? A Spotlight on Urban Landscapes. Am. J. Bot. 2020, 107, 703–706. [Google Scholar] [CrossRef] [PubMed]
- Sæbø, A.; Popek, R.; Nawrot, B.; Hanslin, H.M.; Gawronska, H.; Gawronski, S.W. Plant Species Differences in Particulate Matter Accumulation on Leaf Surfaces. Sci. Total Environ. 2012, 427–428, 347–354. [Google Scholar] [CrossRef] [PubMed]
- Eisenman, T.S.; Churkina, G.; Jariwala, S.P.; Kumar, P.; Lovasi, G.S.; Pataki, D.E.; Weinberger, K.R.; Whitlow, T.H. Urban Trees, Air Quality, and Asthma: An Interdisciplinary Review. Landsc. Urban Plan. 2019, 187, 47–59. [Google Scholar] [CrossRef]
- Roy, S.; Byrne, J.; Pickering, C. A Systematic Quantitative Review of Urban Tree Benefits, Costs, and Assessment Methods across Cities in Different Climatic Zones. Urban For. Urban Green. 2012, 11, 351–363. [Google Scholar] [CrossRef]
- Hartling, S.; Sagan, V.; Sidike, P.; Maimaitijiang, M.; Carron, J. Urban Tree Species Classification Using a Worldview-2/3 and LiDAR Data Fusion Approach and Deep Learning. Sensors 2019, 19, 1284. [Google Scholar] [CrossRef] [PubMed]
- Raupp, M.J.; Cumming, A.B.; Raupp, E.C. Street Tree Diversity in Eastern North America and Its Potential for Tree Loss to Exotic Borers. Arboric. Urban For. 2006, 32, 297–304. [Google Scholar] [CrossRef]
- Alonzo, M.; Bookhagen, B.; Roberts, D.A. Urban Tree Species Mapping Using Hyperspectral and Lidar Data Fusion. Remote Sens. Environ. 2014, 148, 70–83. [Google Scholar] [CrossRef]
- Tiwari, A.; Meir, I.A.; Karnieli, A. Object-Based Image Procedures for Assessing the Solar Energy Photovoltaic Potential of Heterogeneous Rooftops Using Airborne LiDAR and Orthophoto. Remote Sens. 2020, 12, 223. [Google Scholar] [CrossRef]
- van der Linden, S.; Hostert, P. The Influence of Urban Structures on Impervious Surface Maps from Airborne Hyperspectral Data. Remote Sens. Environ. 2009, 113, 2298–2305. [Google Scholar] [CrossRef]
- Li, D.; Ke, Y.; Gong, H.; Li, X. Object-Based Urban Tree Species Classification Using Bi-Temporal Worldview-2 and Worldview-3 Images. Remote Sens. 2015, 7, 16917–16937. [Google Scholar] [CrossRef]
- Tiwari, A.; Silver, M.; Karnieli, A. A Deep Learning Approach for Automatic Identification of Ancient Agricultural Water Harvesting Systems. Int. J. Appl. Earth Obs. Geoinf. 2023, 118, 103270. [Google Scholar] [CrossRef] [PubMed]
- Degerickx, J.; Hermy, M.; Somers, B. Mapping Functional Urban Green Types Using High Resolution Remote Sensing Data. Sustainability 2020, 12, 2144. [Google Scholar] [CrossRef]
- Katz, D.S.W.; Batterman, S.A.; Brines, S.J. Improved Classification of Urban Trees Using a Widespread Multi-Temporal Aerial Image Dataset. Remote Sens. 2020, 12, 2475. [Google Scholar] [CrossRef]
- Liu, L.; Coops, N.C.; Aven, N.W.; Pang, Y. Mapping Urban Tree Species Using Integrated Airborne Hyperspectral and LiDAR Remote Sensing Data. Remote Sens. Environ. 2017, 200, 170–182. [Google Scholar] [CrossRef]
- Hermosilla, T.; Recio, J.; Balsa-Barreiro, J. Land-Use Mapping of Valencia City Area from Aerial Images and LiDAR Data. In Proceedings of the GEOProcessing 2012 Conference: The Fourth International Conference in Advanced Geographic Information Systems, Applications and Services, Valencia, Spain, 30 January–4 February 2012; ISBN 9781612081786. [Google Scholar]
- Zięba-Kulawik, K.; Hawryło, P.; Wężyk, P.; Matczak, P.; Przewoźna, P.; Inglot, A.; Mączka, K. Improving Methods to Calculate the Loss of Ecosystem Services Provided by Urban Trees Using LiDAR and Aerial Orthophotos. Urban For. Urban Green. 2021, 63, 127195. [Google Scholar] [CrossRef]
- Pu, R.; Landry, S. Mapping Urban Tree Species by Integrating Multi-Seasonal High Resolution Pléiades Satellite Imagery with Airborne LiDAR Data. Urban For. Urban Green. 2020, 53, 126675. [Google Scholar] [CrossRef]
- Wallace, L.; Sun, Q.; Hally, B.; Hillman, S.; Both, A.; Hurley, J.; Martin Saldias, D.S. Linking Urban Tree Inventories to Remote Sensing Data for Individual Tree Mapping. Urban For. Urban Green. 2021, 61, 127106. [Google Scholar] [CrossRef]
- Alonzo, M.; Roth, K.; Roberts, D. Identifying Santa Barbara’s Urban Tree Species from AVIRIS Imagery Using Canonical Discriminant Analysis. Remote Sens. Lett. 2013, 4, 513–521. [Google Scholar] [CrossRef]
- Puttonen, E.; Jaakkola, A.; Litkey, P.; Hyyppä, J. Tree Classification with Fused Mobile Laser Scanning and Hyperspectral Data. Sensors 2011, 11, 5158–5182. [Google Scholar] [CrossRef] [PubMed]
- Xiao, Q.; Ustin, S.L.; McPherson, E.G. Using AVIRIS Data and Multiple-Masking Techniques to Map Urban Forest Tree Species. Int. J. Remote Sens. 2004, 25, 5637–5654. [Google Scholar] [CrossRef]
- Chance, C.M.; Coops, N.C.; Plowright, A.A.; Tooke, T.R.; Christen, A.; Aven, N. Invasive Shrub Mapping in an Urban Environment from Hyperspectral and LiDAR-Derived Attributes. Front. Plant. Sci. 2016, 7, 1528. [Google Scholar] [CrossRef] [PubMed]
- Pontius, J.; Hanavan, R.P.; Hallett, R.A.; Cook, B.D.; Corp, L.A. High Spatial Resolution Spectral Unmixing for Mapping Ash Species across a Complex Urban Environment. Remote Sens. Environ. 2017, 199, 360–369. [Google Scholar] [CrossRef]
- Abbas, S.; Peng, Q.; Wong, M.S.; Li, Z.; Wang, J.; Ng, K.T.K.; Kwok, C.Y.T.; Hui, K.K.W. Characterizing and Classifying Urban Tree Species Using Bi-Monthly Terrestrial Hyperspectral Images in Hong Kong. ISPRS J. Photogramm. Remote Sens. 2021, 177, 204–216. [Google Scholar] [CrossRef]
- Branson, S.; Wegner, J.D.; Hall, D.; Lang, N.; Schindler, K.; Perona, P. From Google Maps to a Fine-Grained Catalog of Street Trees. ISPRS J. Photogramm. Remote Sens. 2018, 135, 13–30. [Google Scholar] [CrossRef]
- Xu, Z.; Zhou, Y.; Wang, S.; Wang, L.; Li, F.; Wang, S.; Wang, Z. A Novel Intelligent Classification Method for Urban Green Space Based on High-Resolution Remote Sensing Images. Remote Sens. 2020, 12, 3845. [Google Scholar] [CrossRef]
- Rozenstein, O.; Paz-Kagan, T.; Salbach, C.; Karnieli, A. Comparing the Effect of Preprocessing Transformations on Methods of Land-Use Classification Derived from Spectral Soil Measurements. IEEE J. Sel. Top. Appl. Earth Obs. Remote Sens. 2015, 8, 2393–2404. [Google Scholar] [CrossRef]
- Herrmann, I.; Berenstein, M.; Paz-Kagan, T.; Sade, A.; Karnieli, A. Spectral Assessment of Two-Spotted Spider Mite Damage Levels in the Leaves of Greenhouse-Grown Pepper and Bean. Biosyst. Eng. 2017, 157, 72–85. [Google Scholar] [CrossRef]
- Paz-Kagan, T.; Shachak, M.; Zaady, E.; Karnieli, A. A Spectral Soil Quality Index (SSQI) for Characterizing Soil Function in Areas of Changed Land Use. Geoderma 2014, 230–231, 171–184. [Google Scholar] [CrossRef]
- Wise, B.M.; Gallagher, N.B.; Bro, R.; Shaver, J.M.; Windig, W. Chemometrics Tutorial for PLS_Toolbox and Solo; Eigenvector Research, Inc.: Wenatchee, WA, USA, 2006. [Google Scholar]
- Savitzky, A.; Golay, M.J. Smoothing and Differentiation of Data by Simplified Least Squares Procedures. Z. Physiol. Chem. 1951, 40, 1832. [Google Scholar] [CrossRef]
- Vågen, T.G.; Shepherd, K.D.; Walsh, M.G. Sensing Landscape Level Change in Soil Fertility Following Deforestation and Conversion in the Highlands of Madagascar Using Vis-NIR Spectroscopy. Geoderma 2006, 133, 281–294. [Google Scholar] [CrossRef]
- Pu, R.; Landry, S.; Yu, Q. Object-Based Urban Detailed Land Cover Classification with High Spatial Resolution IKONOS Imagery. Int. J. Remote Sens. 2011, 32, 3285–3308. [Google Scholar] [CrossRef]
- Jombo, S.; Adam, E.; Odindi, J. Classification of Tree Species in a Heterogeneous Urban Environment Using Object-Based Ensemble Analysis and World View-2 Satellite Imagery. Appl. Geomat. 2021, 13, 373–387. [Google Scholar] [CrossRef]
- Blaschke, T.; Hay, G.J.; Kelly, M.; Lang, S.; Hofmann, P.; Addink, E.; Queiroz Feitosa, R.; van der Meer, F.; van der Werff, H.; van Coillie, F.; et al. Geographic Object-Based Image Analysis–Towards a New Paradigm. ISPRS J. Photogramm. Remote Sens. 2014, 87, 180–191. [Google Scholar] [CrossRef] [PubMed]
- Mozgeris, G.; Juodkiene, V.; Jonikavičius, D.; Straigyte, L.; Gadal, S.; Ouerghemmi, W. Ultra-Light Aircraft-Based Hyperspectral and Colour-Infrared Imaging to Identify Deciduous Tree Species in an Urban Environment. Remote Sens. 2018, 10, 1668. [Google Scholar] [CrossRef]
- Pu, R.; Landry, S. A Comparative Analysis of High Spatial Resolution IKONOS and WorldView-2 Imagery for Mapping Urban Tree Species. Remote Sens. Environ. 2012, 124, 516–533. [Google Scholar] [CrossRef]
- Zhang, Z.; Kazakova, A.; Monika Moskal, L.; Styers, D.M.; Hopkinson, C.; Chasmer, L.; Mahoney, C. Object-Based Tree Species Classification in Urban Ecosystems Using LiDAR and Hyperspectral Data. Forests 2016, 7, 122. [Google Scholar] [CrossRef]
- Baker, F.; Smith, C.L.; Cavan, G. A Combined Approach to Classifying Land Surface Cover of Urban Domestic Gardens Using Citizen Science Data and High Resolution Image Analysis. Remote Sens. 2018, 10, 537. [Google Scholar] [CrossRef]
- Shafri, H.; Mansor, S.; Hasmadi Ismail, M. The Use of Worldview-2 Satellite Data in Urban Tree Species Mapping by Object-Based Image Analysis Technique Multiple Moving Object Detection from UAV Videos View Project Lineament Mapping from Satellite Imagery View Project. Sains Malays. 2016, 45, 1025–1034. [Google Scholar]
- Tiwari, A.; Silver, M.; Karnieli, A. Developing Object-Based Image Procedures for Classifying and Characterising Different Protected Agriculture Structures Using LiDAR and Orthophoto. Biosyst. Eng. 2020, 198, 91–104. [Google Scholar] [CrossRef]
- Hanssen, F.; Barton, D.N.; Venter, Z.S.; Nowell, M.S.; Cimburova, Z. Utilizing LiDAR Data to Map Tree Canopy for Urban Ecosystem Extent and Condition Accounts in Oslo. Ecol. Indic. 2021, 130, 108007. [Google Scholar] [CrossRef]
- Tansey, K.; Chambers, I.; Anstee, A.; Denniss, A.; Lamb, A. Object-oriented classification of very high resolution airborne imagery for the extraction of hedgerows and field margin cover in agricultural areas. Appl. Geogr. 2009, 29, 145–157. [Google Scholar] [CrossRef]
- Van Leeuwen, W.J.D.; Huete, A.R.; Laing, T.W. MODIS Vegetation Index Compositing Approach: A Prototype with AVHRR Data. Remote Sens. Environ. 1999, 69, 264–280. [Google Scholar] [CrossRef]
- Congalton, R.G. A Review of Assessing the Accuracy of Classifications of Remotely Sensed Data. Remote Sens. Environ. 1991, 37, 35–46. [Google Scholar] [CrossRef]
- Foody, G.M. Status of Land Cover Classification Accuracy Assessment. Remote Sens. Environ. 2002, 80, 185–201. [Google Scholar] [CrossRef]
- He, Y. The Effect of Precipitation on Vegetation Cover over Three Landscape Units in a Protected Semi-Arid Grassland: Temporal Dynamics and Suitable Climatic Index. J. Arid. Environ. 2014, 109, 74–82. [Google Scholar] [CrossRef]
- Cros, L.; Piera, J.; Soria-Frisch, A.; Aymerich, I.F. A Rapid Technique for Classifying Phytoplankton Fluorescence Spectra Based on Self-Organizing Maps. Appl. Spectrosc. 2009, 63, 716–726. [Google Scholar]
- Huelsman, K.; Epstein, H.; Yang, X.; Mullori, L.; Červená, L.; Walker, R. Spectral Variability in Fine-Scale Drone-Based Imaging Spectroscopy Does Not Impede Detection of Target Invasive Plant Species. Front. Remote Sens. 2023, 3, 1085808. [Google Scholar] [CrossRef]
- Matasci, G.; Coops, N.C.; Williams, D.A.R.; Page, N. Mapping Tree Canopies in Urban Environments Using Airborne Laser Scanning (ALS): A Vancouver Case Study. For. Ecosyst. 2018, 5, 31. [Google Scholar] [CrossRef]
- Paz-Kagan, T.; Caras, T.; Herrmann, I.; Shachak, M.; Karnieli, A. Multiscale Mapping of Species Diversity under Changed Land Use Using Imaging Spectroscopy. Ecol. Appl. 2017, 27, 1466–1484. [Google Scholar] [CrossRef] [PubMed]
- Wang, B.; Liu, J.; Li, J.; Li, M. UAV LiDAR and Hyperspectral Data Synergy for Tree Species Classification in the Maoershan Forest Farm Region. Remote Sens. 2023, 15, 1000. [Google Scholar] [CrossRef]
- Zhang, K.; Hu, B. Individual urban tree species classification using very high spatial resolution airborne multi-spectral imagery using longitudinal profiles. Remote Sens. 2012, 4, 1741–1757. [Google Scholar] [CrossRef]
- Kira, O.; Nguy-Robertson, A.L.; Arkebauer, T.J.; Linker, R.; Gitelson, A.A. Toward generic models for green LAI estimation in maize and soybean: Satellite observations. Remote Sens. 2017, 9, 318. [Google Scholar] [CrossRef]
- Kira, O.; Nguy-Robertson, A.L.; Arkebauer, T.J.; Linker, R.; Gitelson, A.A. Informative spectral bands for remote green LAI estimation in C3 and C4 crops. Agric. For. Meteorol. 2016, 218–219, 243–249. [Google Scholar] [CrossRef]
- Neyns, R.; Canters, F. Mapping of Urban Vegetation with High-Resolution Remote Sensing: A Review. Remote Sens. 2022, 14, 1031. [Google Scholar] [CrossRef]
- Weissert, L.F.; Salmond, J.A.; Schwendenmann, L. Photosynthetic CO2 uptake and carbon sequestration potential of deciduous and evergreen tree species in an urban environment. Urban Ecosyst. 2017, 20, 663–674. [Google Scholar] [CrossRef]
- Zhao, D.; Lei, Q.; Shi, Y.; Wang, M.; Chen, S.; Shah, K.; Ji, W. Role of species and planting configuration on transpiration and microclimate for urban trees. Forests 2020, 11, 825. [Google Scholar] [CrossRef]
- Moreno, R.; Zamora, R.; Moreno-García, N.; Galán, C. Effects of composition and structure variables of urban trees in the reduction of heat islands; case study, Temuco city, Chile. Build. Environ. 2023, 245, 110859. [Google Scholar] [CrossRef]
Figure 1.
(A) Map of Israel’s location; (B) Municipal boundary of Modi’in (WorldView-2) (blue lines); (C) Study area within the neighborhood of Modi’in city (WorldView-2) (blue lines). The images are superimposed with a building layer provided by the Survey of Israel.
Figure 1.
(A) Map of Israel’s location; (B) Municipal boundary of Modi’in (WorldView-2) (blue lines); (C) Study area within the neighborhood of Modi’in city (WorldView-2) (blue lines). The images are superimposed with a building layer provided by the Survey of Israel.

Figure 2.
(A) Digital Terrain Model (DTM); (B) Digital Surface Model (DSM) with a 0.2 m resolution, depicting the examined neighborhood in Modi’in. The data were sourced from Ofek Aerial Photography.
Figure 2.
(A) Digital Terrain Model (DTM); (B) Digital Surface Model (DSM) with a 0.2 m resolution, depicting the examined neighborhood in Modi’in. The data were sourced from Ofek Aerial Photography.

Figure 3.
A flowchart of the overall applied methodology.

Figure 7.
(A) An orthophoto image (Ofek Aerial Photography) overlaid with a tree canopy layer from the Survey of Israel; (B) A close-up view of the open green space where species samples were collected as reference.
Figure 7.
(A) An orthophoto image (Ofek Aerial Photography) overlaid with a tree canopy layer from the Survey of Israel; (B) A close-up view of the open green space where species samples were collected as reference.

Figure 8.
Leaves of the selected tree species: (A) Platanus orientalis, (B) Ulmus parvifolia, (C) Cercis siliquastrum, (D) Koelreuteria bipinnata, (E) Fraxinus uhdei, (F) Olea europaea, and (G) Ceratonia siliqua.
Figure 8.
Leaves of the selected tree species: (A) Platanus orientalis, (B) Ulmus parvifolia, (C) Cercis siliquastrum, (D) Koelreuteria bipinnata, (E) Fraxinus uhdei, (F) Olea europaea, and (G) Ceratonia siliqua.

Figure 9.
(A) Level-I classification delineates three primary classes: Buildup area (~110,000 m2), Vegetation (~125,000 m2), and Roads (~20,000 m2). (B) Level-II classification further refines the “Vegetation” class, identifying subcategories such as Grass (~59,000 m2), Bushes (~34,000 m2), Young trees (~8000 m2), and Mature trees (~24,000 m2).

Figure 10.
The PLS-DA cross-validation hyperspectral model scores in three latent variables (LVs) for seven tree species.
Figure 10.
The PLS-DA cross-validation hyperspectral model scores in three latent variables (LVs) for seven tree species.


Table 1.
Parameters used in the multiresolution segmentation algorithm.
| Domain | Image Layer Weights | Scale Parameter | Shape Factor | Compactness |
|---|---|---|---|---|
| Pixel level | R, G, B, NIR, DSM, DTM = 1 | 5 | 0.7 | 0.8 |
Table 2.
Confusion matrix of object-based classification.
| Reference Class | |||||
|---|---|---|---|---|---|
| Classification Class | Vegetation | Buildup Area | Roads | Row Total | Users Accuracy (%) |
| Vegetation | 646 | 20 | 9 | 675 | 95.70 |
| Buildup area | 3 | 94 | 3 | 100 | 94.00 |
| Roads | 0 | 6 | 92 | 98 | 93.88 |
| Column total | 649 | 120 | 104 | ||
| Producers Accuracy (%) | 99.54 | 78.33 | 88.46 | ||
| Overall accuracy | 95.30 | ||||
Disclaimer/Publisher’s Note: The statements, opinions and data contained in all publications are solely those of the individual author(s) and contributor(s) and not of MDPI and/or the editor(s). MDPI and/or the editor(s) disclaim responsibility for any injury to people or property resulting from any ideas, methods, instructions or products referred to in the content. |
© 2024 by the authors. Licensee MDPI, Basel, Switzerland. This article is an open access article distributed under the terms and conditions of the Creative Commons Attribution (CC BY) license (https://creativecommons.org/licenses/by/4.0/).
Share and Cite
MDPI and ACS Style
Tiwari, A.; Kira, O.; Bamah, J.; Boneh, H.; Karnieli, A. Multi-Sensor Classification Framework of Urban Vegetation for Improving Ecological Services Management. Remote Sens. 2024, 16, 1110. https://doi.org/10.3390/rs16061110
AMA Style
Tiwari A, Kira O, Bamah J, Boneh H, Karnieli A. Multi-Sensor Classification Framework of Urban Vegetation for Improving Ecological Services Management. Remote Sensing. 2024; 16(6):1110. https://doi.org/10.3390/rs16061110
Chicago/Turabian StyleTiwari, Arti, Oz Kira, Julius Bamah, Hagar Boneh, and Arnon Karnieli. 2024. "Multi-Sensor Classification Framework of Urban Vegetation for Improving Ecological Services Management" Remote Sensing 16, no. 6: 1110. https://doi.org/10.3390/rs16061110
Note that from the first issue of 2016, this journal uses article numbers instead of page numbers. See further details here.