Article

Comparison and Validation of Multiple Medium- and High-Resolution Land Cover Products in Southwest China

1
Chongqing Jinfo Mountain National Field Scientific Observation and Research Station for Karst Ecosystem, School of Geographical Sciences, Southwest University, Chongqing 400715, China
2
Chongqing Engineering Research Center for Remote Sensing Big Data Application, School of Geographical Sciences, Southwest University, Chongqing 400715, China
3
Chongqing Engineering Research Center for Spatial Big Data Intelligent Technology, Chongqing University of Posts and Telecommunications, Chongqing 400065, China
4
Faculty of Geo-Information Science and Earth Observation (ITC), University of Twente, 7522 NH Enschede, The Netherlands
5
Southwest University Library, Southwest University, Chongqing 400715, China
*
Author to whom correspondence should be addressed.
Remote Sens. 2024, 16(6), 1111; https://doi.org/10.3390/rs16061111
Submission received: 25 January 2024 / Revised: 18 March 2024 / Accepted: 19 March 2024 / Published: 21 March 2024
(This article belongs to the Special Issue Recent Progress in Remote Sensing of Land Cover Change)

Abstract

:
The rapid advancement of remote sensing technology has given rise to numerous global- and regional-scale medium- to high-resolution land cover (LC) datasets, making significant contributions to the exploration of worldwide environmental shifts and the sustainable governance of natural resources. Nonetheless, owing to the inherent uncertainties embedded within remote sensing imagery, LC datasets inevitably exhibit inaccuracies. In this study, a local accuracy assessment of LC datasets in Southwest China was conducted. The datasets utilized in our analysis include ESA WorldCover, CLCD, Esri Land Cover, CRLC, FROM-GLC10, GLC_FCS30, GlobeLand30, and SinoLC-1. This study employed a sampling approach that combines proportional allocation and stratified random sampling (SRS) to gather sample points and compute confusion matrices to validate eight LC products. The local accuracy of the eight LC maps differs significantly from the overall accuracy provided by the original authors in Southwest China. ESA WorldCover and CLCD demonstrate higher local accuracy than other products in Southwest China, with their overall accuracy (OA) values being 87.1% and 85.48%, respectively. Simultaneously, we computed the area for each LC map based on categories, quantifying uncertainty through the reporting of confidence intervals for both accuracy and area parameters. This study aims to validate and compare eight LC datasets and assess precision and area of diverse spatial resolution datasets for mapping and monitoring across Southwest China.

Graphical Abstract

1. Introduction

The impacts of the greenhouse effect, such as global climate warming [1], extreme oceanic events [2], precipitation extremes [3,4], and glacial retreat [5], are significantly affecting the future survival of humanity. The emissions of greenhouse gases such as carbon dioxide (CO2) are detected as the primary drivers of global warming [6,7,8]. With the continuous advancement of urbanization and industrialization, a substantial amount of carbon dioxide is released into the atmosphere due to human activities [9]. Among these, land cover change (LCC) emerges as a pivotal factor in carbon emissions, comprising roughly one-third of the carbon emissions attributed to human activities throughout the Industrial Revolution period [10]. The carbon emission coefficients differ across various land types. For instance, cropland stands at approximately 0.04, whereas forest is approximately −0.06 [11]. To quantify the carbon emissions, LCC reconstructions are needed and utilized in relevant carbon models [12,13,14]. But the carbon emissions it causes are also one of the most uncertain factors in the global carbon budget. Hence, the information acquiring accurate land cover (LC) data about the current state of the Earth’s land surface holds theoretical significance for studying the interrelationship between LCC and carbon emissions [15], contributing to the realization of the objective of carbon neutrality [16].
With the rapid development of Earth observation technology, remote sensing (RS) monitoring offers a more efficient and effective approach to generate LC products. Scholars are making active efforts on both domestic and international levels to develop region-specific LC maps with varying resolutions, and the spatial resolution has been increased from 1 km [17] to 500 m [18], 30 m [19,20,21], 10 m [22,23,24,25], and even as fine as 1 m [26]. These LC data have been widely utilized to analyze the carbon stocks of terrestrial ecosystems [27,28,29]. However, the differences in the acquisition time of remote sensing data, LC classification techniques, classification systems, etc., used in existing LC products, result in inconsistent classification standards and accuracy [30]. For example, inaccurate data of LCC in China led to a serious underestimation of the terrestrial carbon sink [31]. It is a challenge for us to choose suitable products for related research. With the growing demand for more detailed and accurate LCC information, it becomes essential to document the accuracy of these LC products [32]. Commonly employed techniques for validating LC maps include classic methods like Multiple-Resolution Cross Tabulation, Cross-Tabulation Matrix, Soft Classification Maps, and Pattern Analysis (Map Curves), etc. [33]. Researchers and various organizations have actively utilized these diverse methods to validate LC maps. For example, Chaaban [34] used stratified random sampling (SRS) and equalized stratified random (ESR) to assess the accuracy of existing 10 m spatial resolution LC products: ESA WorldCover and Esri Land Cover. Gao [35] evaluated three 30 m LC products concerning areal and spatial consistency using the Land Use/Cover Area Frame Statistical Survey (LUCAS) reference dataset over the European Union (EU). Each approach possesses unique strengths and applicability [36,37,38,39,40]. However, it is important to note that limitations still exist.
Such “accuracy” generated by existing research mainly involves national and intercontinental scales (such as global accuracy), and further verification is needed to determine whether it meets the requirements in the specified research area. Bai found that even for the same LC product, GLCD-2005, there are significant differences in accuracy among different regions in China [36]. Most LC products primarily rely on RS images as their main data source. During production, they are often affected by issues related to the accuracy of these images itself, such as cloud cover and mixed pixels [41]. This impact is particularly important in areas with complex and fragmented LC distributions, leading to a noticeable decrease in accuracy. Consequently, traditional per-pixel sampling designs are ill-suited for these environments, as they fail to adequately characterize the complex spatial variability and relationships within fragmented area [42]. This gap highlights the need for optimized sampling techniques to enhance the representation of spatial variability in accuracy assessments of heterogeneous regions. Area estimation, especially for forested areas, can be utilized to quantify global forest carbon losses through remote sensing estimates [43]. Keenan believes that furnishing reliable information on global forest area trends is invaluable for all people in decision-making on policies and investments [44]. However, estimates of LCC, particularly those related to critical factors like forest change in carbon accounting [45], are often susceptible to significant errors [46]. The key to addressing certain global environmental science issues lies in the accurate measurement of LCC areas. Traditional methods of obtaining this involve directly extracting information from categorized LC products. However, it is possible that the area computed from the LC map could be badly biased even when the two classifications are both highly accurate [47,48,49].
Southwest China has a robust carbon sequestration capacity, becoming the largest terrestrial carbon sink in China over the past 30 years [50]. Its carbon absorption constitutes slightly over 35% of Chinese total absorption [51]. On the other hand, Southwest China has experienced a “once-in-a-century” prolonged severe drought, triggering severe impacts on vegetation growth and thereby suppressing this carbon sink [52]. Therefore, LCC in Southwest China is undoubtedly necessary to pay high attention to prevent further degradation of the existing environment. However, it poses significant challenges for obtaining sufficient high-quality and high-resolution remote sensing images in this place, because of its frequently cloudy and foggy weather [53]. At the same time, the geomorphological structure of this area is complex, and the distribution of land classes is extremely fragmented. Driven by such factors, the challenges in classifying LC in the southwestern region have consequently increased. Therefore, it is quite important to obtain an accurate assessment for LC products in this region.
In this paper, the primary objective is to validate the accuracy of medium- and high- resolution LC data in Southwest China, an area with diverse and fragmented landscapes, by comparing it with independent LC samples obtained by optimized sampling methods. Secondly, we will produce scientifically rigorous and transparent estimates of area for each LC category based on the sampled points. Through this analysis, our objective is to improve the estimates of the carbon budget in Southwest China, where forests are widespread, representing an extensive carbon sink and contributing to the global carbon balance.

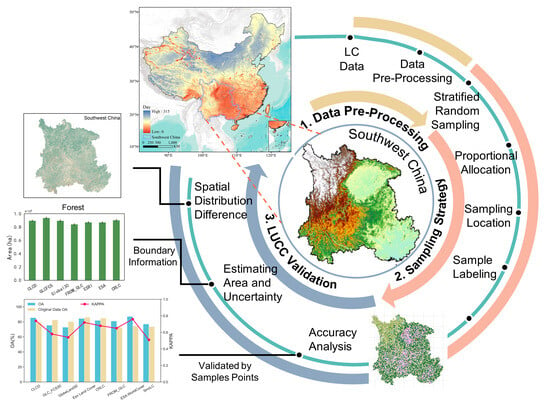
2. Materials and Methods

2.1. Study Area

Southwest China is located between 21°04′~34°23′N and 97°26′~112°06′E, including Sichuan Province, Yunnan Province, Guizhou Province, Chongqing City, and Guangxi Zhuang Autonomous Region (Figure 1). The region is often covered by extensive cloud cover (Figure 1a), making it hard to obtain high-quality satellite images [53]. Moreover, the subtropical humid monsoon climate results in extremely hot and abundant rainfall in summer. Rainfall has led to the southwestern mountainous regions becoming one of the most severely affected areas by water-eroded desertification in China [54]. The topography in this area is varied and complex, featuring deeply incised valleys and expansive karst areas, with a relative elevation difference exceeding 7000 m from the northwest to the southeast [55]. These combined influences have intensified land fragmentation in this region.

2.2. Medium- and High-Resolution LC Products

Eight LC maps with widely used and recent production dates, featuring different spatial resolutions, were sourced from various sensors, including Landsat and Sentinel-2 (Table 1). The products selected for this study are all from 2020. Since the latest production year for FROM_GLC extends only up to 2017, considering the proximity of dataset phases, it is still included in this study.
(1)
CLCD [19] land cover map with 30 m spatial resolution from Wuhan University. It is the annual long-term Landsat-derived land cover dataset, established by utilizing visually interpreted samples from satellite time-series data and a random forest classifier.
(2)
GLC_FCS30 [20] land cover map with 30 m spatial resolution from Aerospace Information Research Institute, Chinese academy of science (AIR). It offered the most refined classification system in the dataset used for this study (encompassing 16 global LCCS land cover types along with 14 intricate regional land cover types). The data adopted a local adaptive random forest model.
(3)
GlobeLand30 [21] (Global land cover dataset with 30 m spatial resolution) land cover map with 30 m spatial resolution based on the integration of pixel- and object-based methods with knowledge (POK-based) from National Geomatics Center of China (NGCC).
(4)
ESA WorldCover [22] land cover map with 10 m spatial resolution from European Space Agency (ESA) from the WorldCover project. This product was based on both the Sentinel-1 and Sentinel-2 satellite data and used the pixel-based strategy.
(5)
Esri Land Cover [23] land cover map with 10 m spatial resolution from ESRI and Microsoft’s Planetary Computer. It was used for building the global map based on a deep learning artificial intelligence (AI) land classification model.
(6)
CRLC [24] land cover map with 10 m spatial resolution from Wuhan University. They have introduced a cross-resolution land cover mapping framework that incorporates the principles of noisy label learning.
(7)
FROM_GLC [25] (Finer Resolution Observation and Monitoring of Global Land Cover) land cover map with 10 m and 30 m spatial resolution from the team of Professor Gong Peng of Tsinghua University. It was developed on Google Earth Engine (GEE) using a supervised random forest classifier with FROM-GLC Plus (FGP).
(8)
SinoLC-1 [26] land cover map established by Wuhan University, is the first land cover dataset which has 1 m spatial resolution of China, utilizing a deep learning-based framework and open-access data.
The above eight LC products used in this study have undergone independent accuracy assessments. Nonetheless, the results of these independent accuracy evaluations cannot be directly compared due to the use of different verification methods and reference data. In this research, these LC products were validated in Southwest China to obtain local accuracy.

2.3. Methods

Since obtaining the actual LC information for the whole study area is both expensive and challenging, conducting accuracy assessments based on statistical sampling is a more common practice. Given the significant spatial heterogeneity of the land surface in the Southwest China, this study integrates stratified random sampling and proportional allocation while considering the rare classes, building upon traditional probability statistical models.
Figure 2 presents the validation flowchart for LC products in Southwest China.
Step 1: Data pre-processing. Main contents of data pre-processing include projection transformation, mosaic, extraction, reclassification, etc. This step was performed in the ArcGIS 10.8 platforms, a desktop Geographic Information System (GIS) software developed by ESRI (www.esri.com, accessed on 16 March 2024).
Step 2: Sample collection using SRS. Olofsson proposed that regardless of which map is used to define the strata when assessing multiple maps, the data from the sample references remain available for evaluating any map [56]. Considering both prior knowledge and computational costs, this study chose CLCD products to define the strata. Strata were delineated based on eight LC types. Based on SRS, calculate the total sample size and determine sample allocation based on the area of each LC types. The samples obtained through this method serve for accuracy estimation, area calculation, and quantifying the associated uncertainty.
Step 3: Integration of data sources for sample points interpretation. In this step, a combination of field survey data, multiple remote sensing images from diverse sources and periods, and high-resolution Google Earth Images was employed. Each sample points underwent interpretation, leading to the identification of its corresponding LC type.
Step 4: Validate the accuracy of the LC data using the chosen sampling points, encompassing both accuracy validation and area estimation. Sample points were applied to all LC products to calculate validation indicators and the area of each category. In order to comprehensively characterize the LC patterns in the southwestern region of China, an analysis emphasizing the spatial distribution differences among various LC datasets was conducted.

2.3.1. Reclassification

We contrasted the diverse classification systems of various products and converted it into a consistent classification system. Additionally, as both the CLRC and Esri Land Cover merge shrubland and grassland into a single category named “Grassland/Shrubland”, we have also unified these two classes. This study simplified the classification system to eight classes: Forest, Grassland (including Shrubland), Cropland, Impervious, Barren, Ice, Water, and Wetland (Table 2).

2.3.2. Stratified Random Sampling Method

Sampling design is the protocol for selecting a subset of spatial units, which will constitute the foundation for accuracy assessment. The crucial recommendation is that the sampling design should be a probability sampling design. Multiple probability sampling designs are applicable for precision assessment and area estimation, with the most common designs being simple random, stratified random, and systematic designs [57]. The implementation of stratification has two advantages: The first purpose is if there are strata of interest for the reported results, such as the accuracy of various categories divided by LC type. In the stratified random sampling method, the partitioning of each stratum must include certain probabilities, and these probabilities form the basis for accuracy and area estimation. Because of the diverse LC types and significant area variations in our study area (Figure 1b), aiming to obtain adequate samples for each LC type in the classification system, we collected reference samples for all LC classes using stratified random sampling method (SRS) following good practices as recommended by Olofsson [56].
For SRS, assuming equal sampling costs for each stratum, the formula for calculating the sample size (n) is as follows:
n = ( W i S i ) 2 [ S ( O ^ ) ] 2 + ( 1 / N ) W i S i 2 ( W i S i S ( O ^ ) ) 2
where S ( O ^ ) is the standard error of the estimated overall accuracy we aim to achieve, Wi is the mapped proportion of area of class i, S i is the standard deviation of stratum i, calculated as S i = U i ( 1 U i ) ( U i is the user accuracy), and N is the number of units in the study area. Because N is typically large, the second term in the formula always can be ignored. Based on prior knowledge, we assume a user’s accuracy of 0.6 and the standard error of 0.005.
When using SRS for sampling, it is necessary to determine the total number of samples and the distribution method of the samples required for each stratum. The sample allocation methods commonly used include random allocation, proportional allocation, Neyman allocation, etc. [58].
Proportional allocation ensures all strata are represented proportionally, relative to the size of the landscape areas within it, preventing under-sampling of some strata. We choose the proportional allocation which is in stratified sampling, where the sample size ni in each stratum is proportional to the stratum size N i :
n i = n W i
Finally, the sample size for rarer categories is appropriately increased, catering to samples from all categories to ensure a more equitable distribution of samples for each stratum compared to proportional allocation results.

2.3.3. Sample Labeling

In practice, it is not always possible to visit the sample locations we selected, as they may be located in excessively high mountains or in overly dangerous ravines. The cost of accessing all sample points is excessively high. Therefore, we use the following multi-source remote sensing data as reference data to identify the LC types of validation points (Table 3):
(1)
GF-2 imagery from National Major Projects on High-Resolution Earth Observation System. Southwest China has unique weather, with an exceptionally short duration of effective sunlight (Figure 1a). Therefore, we have chosen multiple time-series data from 2019 to 2020.
(2)
Google Earth Images.
Another issue to consider is that the size represented by the sampling points should be appropriate for the pixel size of the LC map to be evaluated. This study aims to select sample points from homogeneous areas of at least 60 m × 60 m to ensure the representativeness of the sample points and mitigate the scale effect on verification accuracy. If the representative size of the sample points equals only a single pixel, the validation results can be unduly influenced by inherent location errors in satellite imaging and the impact of mixed pixels.
We employed various independent interpretation methods by different individuals, involving three experts with extensive remote sensing image interpretation experience and one quality controller in this process. The three experts independently interpreted sample land classes, recording interpretation confidence levels (high, medium, low). These independently interpreted results were passed on to another expert for cross-verification. After removing obvious errors, the consistency among the results from the three experts now exceeds 95%. The cross-verified interpretation results are submitted to the quality control personnel for final inspection. In cases where a consensus on interpretation results cannot be reached through discussion, those particular samples are discarded.
A total of 9579 samples were collected, encompassing eight categories: Forest, Grassland, Cropland, Impervious, Barren, Ice, Water, and Wetland (Figure 3). In Figure 3d, the distribution of sampling points is depicted, with a predominant focus on Forest, Cropland, and Grassland, showcasing the quantity of each category. In Figure 3f, the distribution of sampling points in latitude can be observed. Forests are most widely distributed, with lower latitudes corresponding to the Impervious. Conversely, regions with higher latitudes demonstrate the distribution of snow and ice, grassland, and wetlands.
Typical regions to showcase the sampling results are presented in Figure 3a–c. Figure 3a depicts Chongqing city on the edge of the Sichuan Basin, characterized by persistent cloud cover and fog, restricting access to high-quality remote sensing data. Due to intensive human activities and complex karst topography in the region, land cover is highly fragmented. Figure 3b shows the southwestern region of Mount Siguniang in Sichuan Province, characterized by diverse LC types due to significant terrain variations. Figure 3c illustrates Kunming city in Yunnan Province, where the terrain, landforms, and Land Use and Land Cover (LUCC) are complex and variable.

2.3.4. Validation Indicators

The collected sample points generated error matrices, offering detailed measurements, including overall accuracy (OA), producer accuracy (PA), user accuracy (UA), and the Kappa coefficient (Kappa), to assess accuracy variations among different products [58].
O A = i = 1 q n i i N
P A = n i i n i
U A = n i i n i
K a p p a = N i = 1 q n i i i = 1 q ( n i + n + i ) N 2 i = 1 q ( n i + n + i )
where i is the LC type of the product; nii is the number of pixels correctly classified in type i; n+i is the number of pixels of type i in the reference product; ni+ is the number of pixels of type i in the product to be evaluated number.
Differences in area and spatial distribution are also crucial metrics for evaluating the accuracy of LC datasets. Because of classification error, relying solely on area weighting and total area to calculate the areas of each category often introduces biases. The sample size for each map class is proportional to the relative area of the map class, allowing us to estimate the area using the sample points. Equation (7) serves as an area estimator, relying on the reference classification of each sample unit rather than directly obtaining the area from the map classification [56].
A ^ j = A t o t i W i n i j n i
where A ^ j is an estimate of the area for category j; and A t o t is the total area.
Articles published between 2005 and 2010 in several mainstream remote sensing journals with a track record of publishing articles on land change were surveyed by Olofsson. He found that these articles rarely presented accuracy information for calculating the error-adjusted estimated area and confidence intervals [59]. Once the product has been validated, and an error matrix is created, estimating these parameters is not difficult but can yield a wealth of valuable information.
The estimated standard error of the estimated area proportion is
S ( p ^ j ) = i = 1 q W i 2 n i j n i ( 1 n i j n i ) n i 1
The standard error of the error-adjusted estimated area is
S ( A ^ j ) = A t o t × S ( p ^ j )
An approximate 95% confidence interval (for 95% confidence, z = 1.96) for A j is A ^ J ˙   ± 1.96 × S A ^ j .

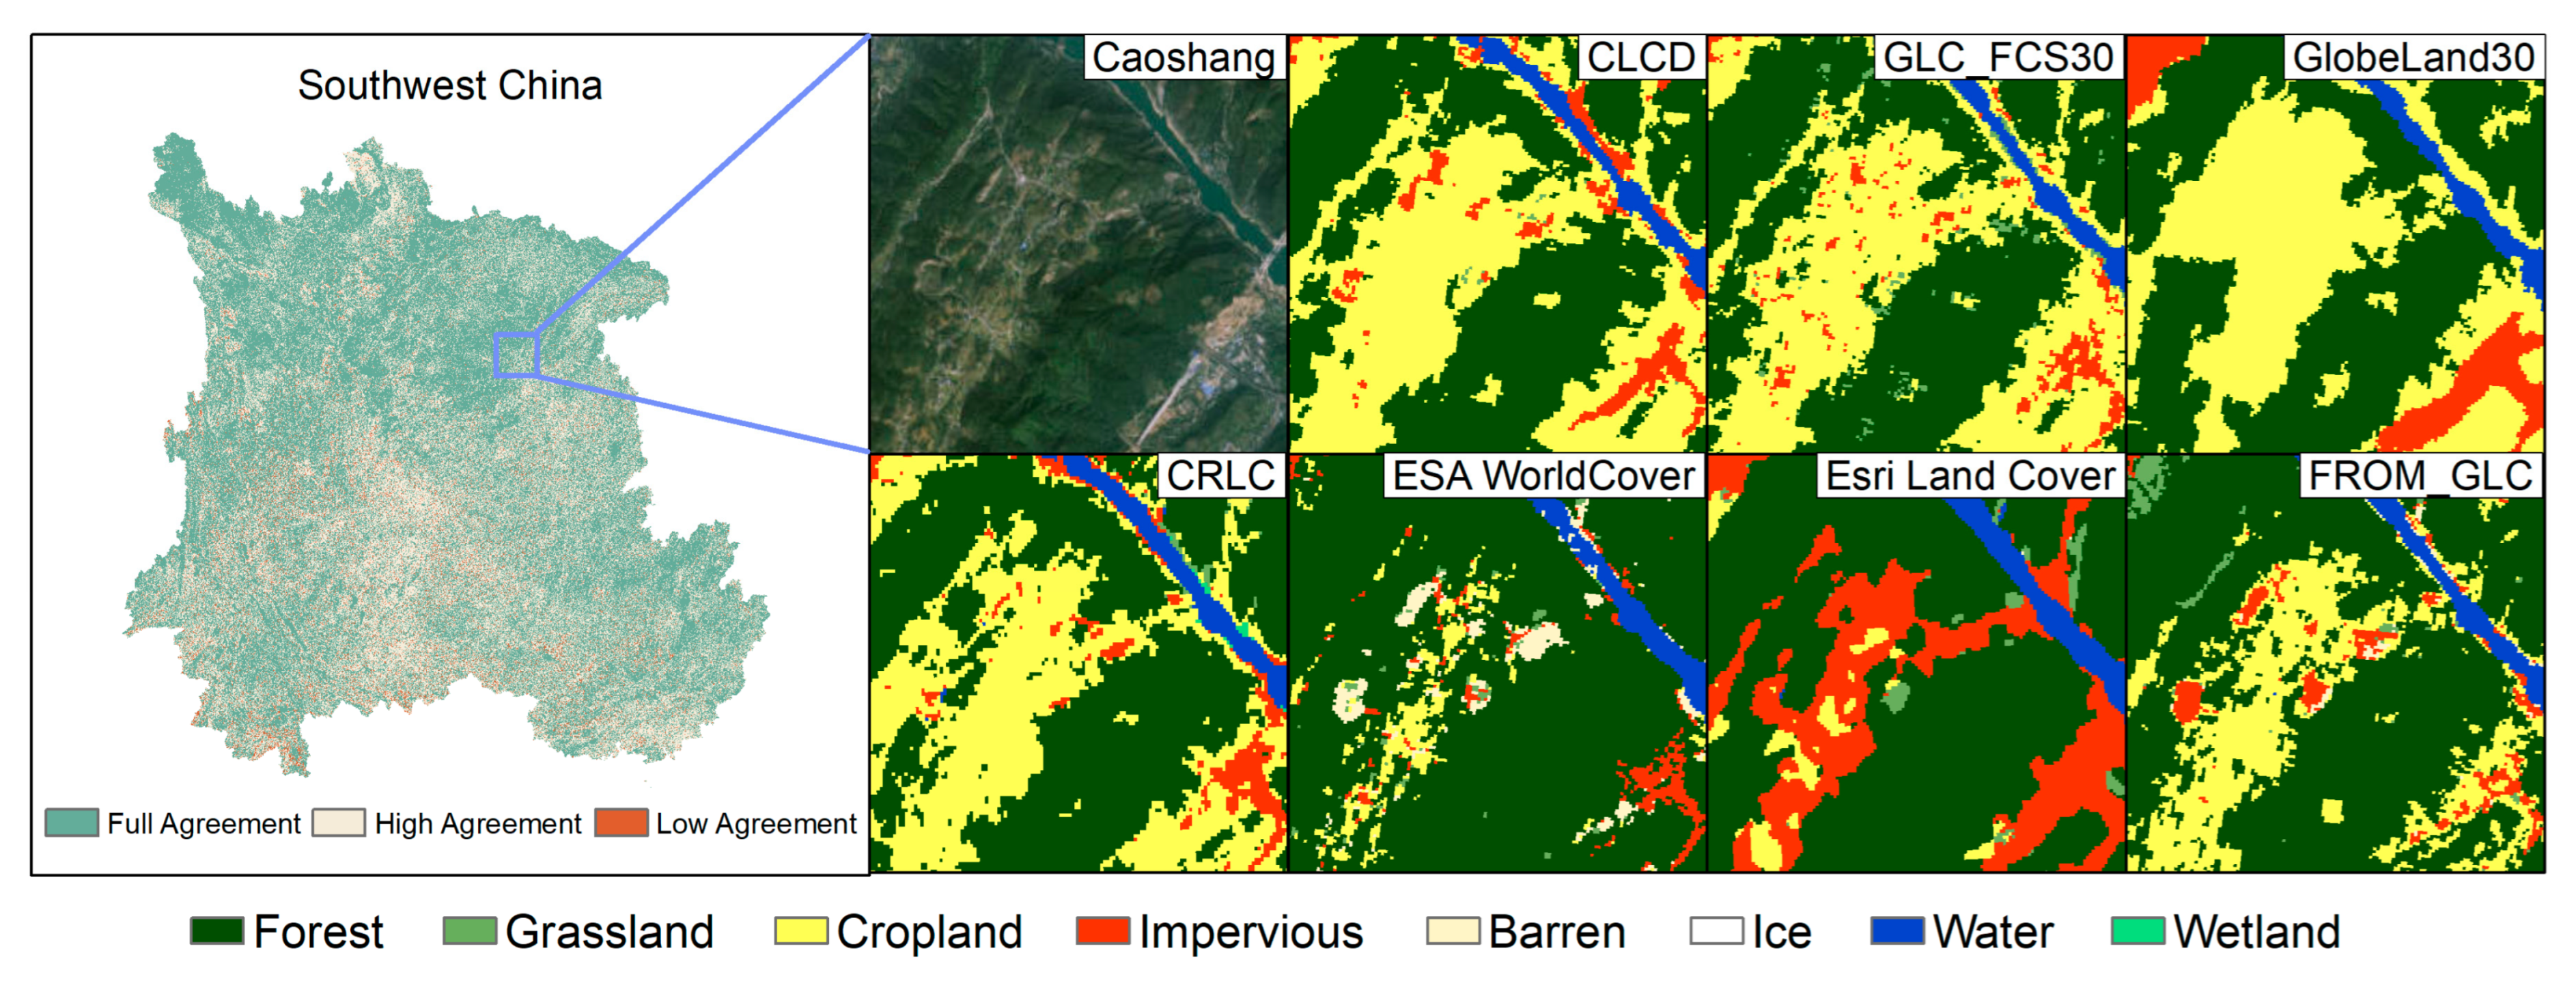
2.3.5. Spatial Distribution Consistency Analysis

It is imperative to include an analysis that highlights the disparities in spatial distribution among various land cover datasets to comprehensively characterize the land cover patterns in southwestern China. LC products with different spatial resolutions cannot be directly compared for consistency. It is necessary to resample the product with a 10 m spatial resolution to 30 m (due to computational costs, the experiment did not utilize data with a 1 m spatial resolution). The resampling method employed the maximum area resampling approach.
Through spatial analysis overlay, a Boolean comparison was employed to generate a consistency map. Pixels with the same LC type were labeled as consistent, while those with different LC types were labeled as inconsistent, further categorized into full agreement, high agreement, and low agreement.

3. Results

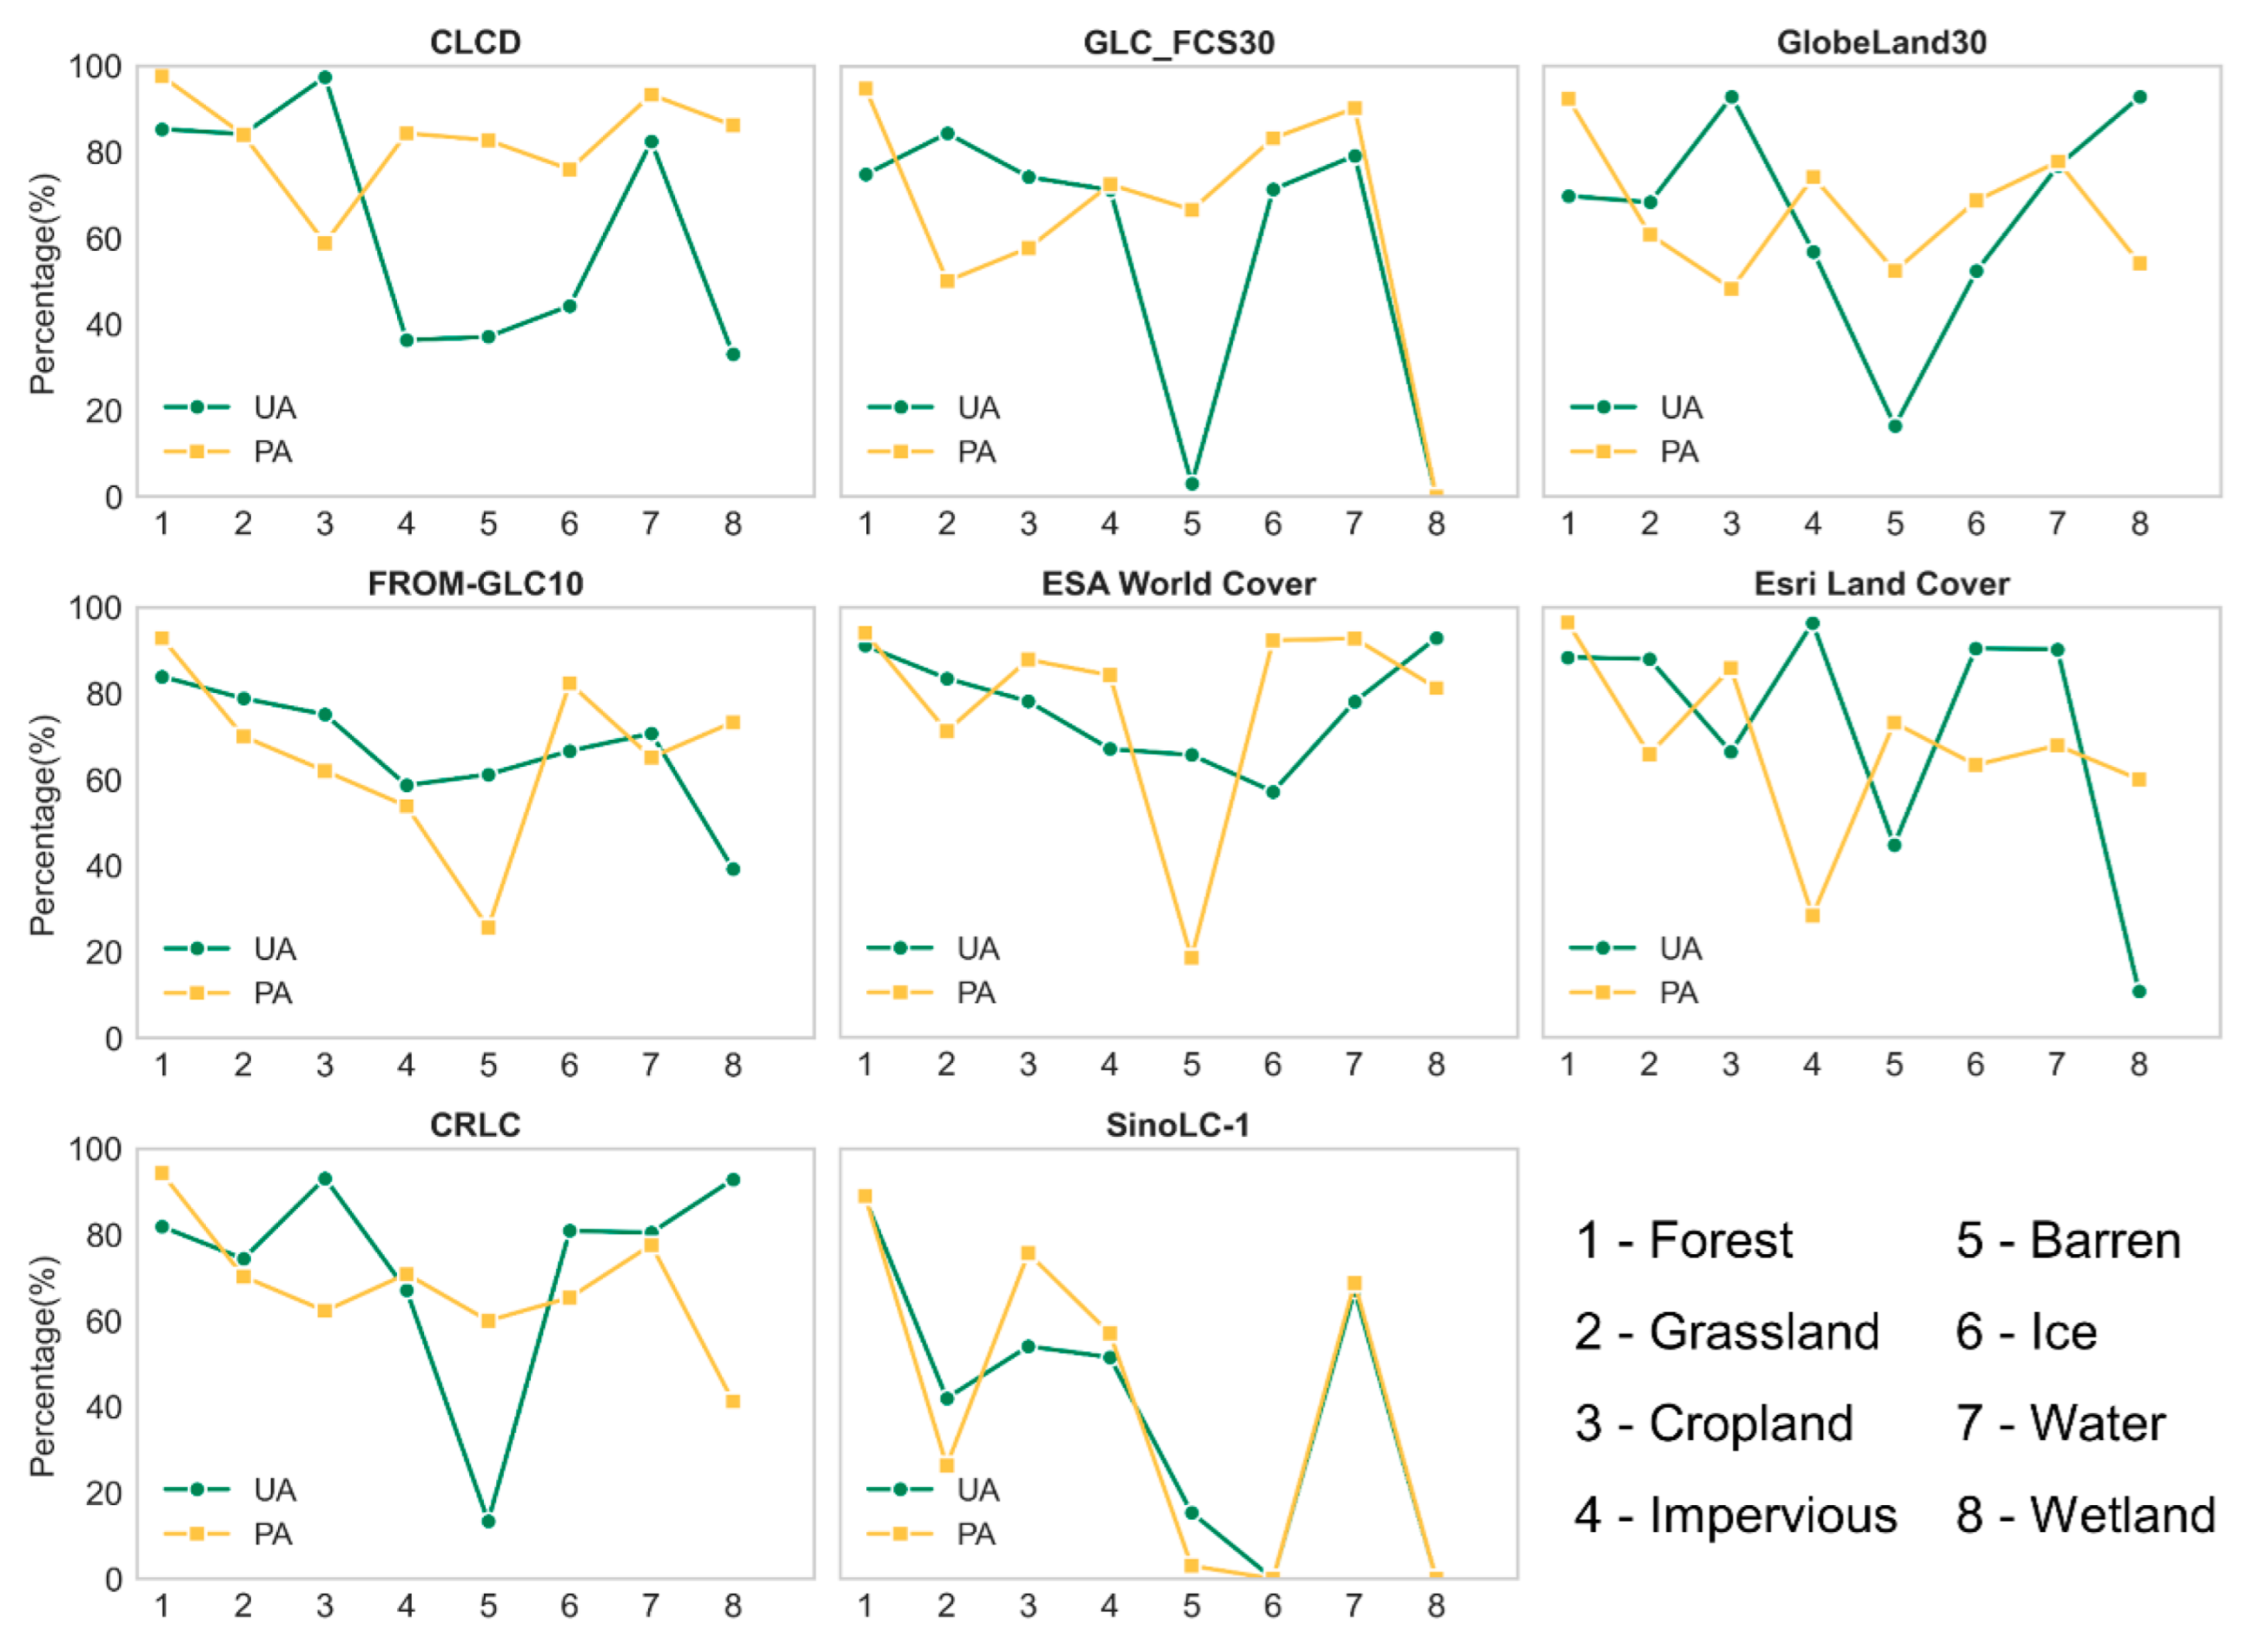
3.1. Validation of LC Products

A summary of the calculated results for OA and Kappa between each map pair and LC samples are given in Figure 4 and Table 4 separately. OA of the eight LC maps across Southwest China are ESA WorldCover (87.10%), CLCD (85.48%), Esri Land Cover (84.43%), CRLC (81.85%), FROM-GLC10 (80.89%), SinoLC-1 (77.03%), GLC_FCS30 (75.47%), and GlobeLand30 (72.78%) in the descending order. Among the 30 m resolution datasets, the CLCD data achieved the highest overall accuracy and Kappa coefficient, with values of 85.48% and 0.74, respectively. For the 10 m resolution datasets, the ESA WorldCover data had the highest overall accuracy and Kappa coefficient, with values of 87.10% and 0.76, respectively. As for the 1 m resolution LC data, the overall accuracy was 77.03%, and the Kappa coefficient was 0.51. In addition, we compared OA of our results with the OA reported by the source data authors. The OA for CLCD, FROM_GLC10, ESA WorldCover, and SinoLC-1 is higher than original data OA, while GLC_FCS30, GlobeLand30, Esri Land Cover, and CRLC have OA lower than that.
Subsequently, we calculated the UA and PA of the eight classes in the eight LC maps (Figure 5). Neither of the eight maps can achieve high accuracy for both UA and PA across all categories. The Forest and Water categories demonstrate high accuracy, displaying strong PA and UA. In the Forest category ESA WorldCover data achieves the highest accuracy, with both PA and UA exceeding 85%. Water is effectively classified in most datasets, with ESA WorldCover, CRLC, and GLC_FCS30 data showing notably high accuracy. Impervious performs well with GLC_FCS30 data, with both PA and UA reaching 80%. For Barren, Ice, and Wetland categories, the accuracy is relatively poor. Most datasets for Barren and Ice have significant differences between PA and UA. Wetland category accuracy is low, with GLC_FCS30 data even lacking wetland classes in Southwest China.

3.2. Area Comparison of the Eight Classes

The area of eight classes of all LC maps was calculated, excluding SinoLC-1, due to its significantly higher computational cost compared to other datasets (Table 5 and Figure 6).
In Southwest China, the areas of various LC categories show notable inconsistencies. Among all categories, the area of the Forest category is the closest, with GLC_FCS30 having the largest coverage. The Grassland and Cropland categories exhibit relatively small differences among all categories. In Grassland categories, CRLC has the largest area, while FROM_GLC10 has the smallest area. In Cropland categories, CRLC has the largest area, and GLC_FCS30 has the smallest area. However, there is quite a difference in the Ice and Wetland categories, even though they cover the smallest proportion, collectively making up less than 1%. E.g., the area of Ice in Esri Land Cover is 3.16 times than that of GLC_FCS30, while the area of Wetland in Esri Land Cover is 4.43 times than that of GLC_FCS30. GLC_FCS30 depicts more areas in Forest categories than the other datasets, resulting in lower calculated areas for other categories. In terms of standard errors for total area among various products, CLCD has the smallest, followed by ESA WorldCover. This indicates better performance of these land cover products.

3.3. Spatial Distribution Difference Comparison

Figure 7 illustrates the spatial consistency of different LC products in Southwest China. Generally, high spatial consistency is more prevalent in typical homogeneous regions, such as vast grasslands in the Western Sichuan Plateau and cropland and impervious in the Sichuan Basin. In contrast, low spatial consistency is more widely distributed in the complex terrain of Southwest China. For example, for the Yunnan–Guizhou Plateau, intense crustal movements result in its rugged topography. The Guangxi Zhuang Autonomous Region, as the region with the largest area of artificial forests in the Southwest, has frequent human activities, and the distribution of land categories is extremely scattered, resulting in highly intense LUCC. In the northeastern and southeastern parts of Chongqing, the dual impact of complex topography and frequent cloud cover poses challenges to LC map production. To provide a more intuitive understanding of spatial consistency, we selected Caoshang in Chongqing city for an in-depth display of land cover patterns in this typical region. In this region, characterized by a mixture of Forest, Impervious, and Cropland, CLCD, GLC_FCS30, and CRLC exhibit similar LC patterns. Esri Land Cover shows a greater extent of Impervious, while GlobeLand30 shows a higher proportion of Cropland in this area.

4. Discussion

4.1. Comparison and Analysis of Accuracy

Generally, the accuracy of the eight LC datasets is good, the value of OA are large than 70%, and the accuracy metrics show consistency. In the 30 m resolution data, CLCD data have the highest overall accuracy and Kappa coefficient. In the 10 m resolution data, ESA World Cover data have the highest overall accuracy and Kappa coefficient. Additionally, the producer accuracy and user accuracy of these two datasets also reach high levels. Liu [60] examined five datasets in the South China region in 2020, including CCI-LC, MCD12Q1, GlobeLand30, GlobCover, and CGLS-LC. The five products were resampled to a resolution of 1 km, yielding consistency results similar to this study. During area comparison, relying solely on area weighting and total area to calculate the area of each category often introduces biases. In this study, error-adjusted estimates of area and confidence intervals were calculated, providing more robust results. Notably, our assessment result, focused specifically on Southwest China, partially revealed lower accuracy compared to the national-scale assessment provided by the authors (Figure 4). This highlights the importance of validating global products at regional scales. This warrants caution when utilizing the product for localized assessments in these areas where LC is fragmented, given higher challenges in classification.
There are various reasons for the discrepancies among different LC data, which may include the difficulty in different LC categories, classification algorithms, as well as considerations related to the spectral, spatial, and temporal resolutions of the datasets. In terms of LC categories, the classification accuracy for Forest and Water bodies is higher. This may be attributed to the distinct spectral characteristics of these two LC types, coupled with their continuous and extensive distribution in the study area, making their boundaries easily identifiable in remote sensing imagery. On the other hand, the accuracy of the classification results for bare land, ice/snow, and wetland is lower. The similarity of these land cover types to other categories with confusing spectral and textural features may give rise to this discrepancy. Particularly in regions characterized by complex land classes and heterogeneity, accurately identifying these types becomes more challenging. Regarding the method for generating LC products, machine learning remains the mainstream approach. FROM-GLC, GLC_FCS30, CLCD, and ESA WorldCover employ a machine learning method known as random forest method. GlobeLand30 utilizes the POK strategy. Due to the different classification methods used, GlobeLand30 exhibits a significantly higher classification of cultivated land compared to other LC products (Figure 7). In terms of data sources, the OA of LC data derived from time-series remote sensing images surpasses that obtained from single-period images. LC data produced using Sentinel data as the data source demonstrate high accuracy. For example, ESA WorldCover integrates data from the Sentinel-1 radar satellite and the Sentinel-2 optical satellite. Radar Imagery is less affected by clouds and rain, performing well in regions with frequent cloud cover, such as the Southwest China.
Each LC map should take various factors into account early in the generation process, including not only accuracy but also classification categories, mapping time, mapping area, and more. Researchers should pay more attention to choosing LC data that suit their specific needs.

4.2. The Advantage and Limitation of Sampling Method

Compared to simple random sampling, sampling methods that combine proportional allocation and stratified random sampling better cater to the quantity of rare LC samples, taking into account the spatial heterogeneity of the land surface and the scale differences among various products. At the end, we obtained 9579 sample points. The number of sample points satisfy the minimum sample size requirement. For regions with highly unbalanced LC category areas, it is worth considering improvements to the sampling method. In terms of sample location selection, additional reference data can be utilized to reduce the sample size while maintaining relatively objective results.
In addressing potential sources of error, despite using multi-source remote sensing data as references, the confidence in obtaining sample points is low due to the scarcity of high-quality images of the Sichuan Basin (Figure 1a). Although the research team conducted field observations, the obtained sample quantity constitutes a relatively small proportion of the total samples. Future efforts should incorporate additional measures to bolster confidence in the samples, such as collecting more reference data or conducting further field investigations. While adhering to globally recognized sampling methods, there are still some shortcomings in our sample point selection. For example, the impact of sample location poses a challenging problem that is not easily quantifiable. In the sampling of LUCC, attention is focused not only on the accuracy of classification but also on the rationality of the classification boundaries. Due to spatial heterogeneity, these boundaries are inherently fuzzy. Designing evaluation metrics becomes a crucial consideration. In this study, the approach used involves sampling from sufficiently large and uniform land surfaces. However, based on the literature review, there are alternative approaches, such as using semivariogram functions to assess the spatial representativeness of measurement points, which is a consideration that precedes our research.

4.3. Reference of Regional-Scale LC Products

Accurate monitoring of LCC is pivotal in developing science-based strategies for managing conservation needs and promoting sustainable development. Many environmental problems in Southwest China, such as the continuous expansion of rocky desertification, have hindered the increase in carbon sinks and severely limited the sustainable development of the region [61]. In recent years, China has implemented various forest protection policies in Southwest China, effectively preserving the existing forest ecosystem. This ecosystem plays a crucial role in supporting our carbon-neutral policy. These policies’ development and maintenance rely on precise LC data for guidance. Specifically, understanding the accuracy of land overlay data in Southwest China greatly helps us to obtain LCC signal. We advocate that these effects should be considered when developing land-use policies. For example, the huge impact of these bias corrections on China’s carbon dynamic assessment since 1900 proves [31]. Therefore, emphasizing accurate descriptions of LCC becomes paramount in carbon budget accounting, biodiversity assessment, and ecosystem services evaluation.
This study validates the accuracy of existing medium- to high-resolution LC data in Southwest China, with the goal of aiding scholars in selecting appropriate data for their research. Each LC map should take various factors into account early in the generation process, including not only accuracy but also classification categories, mapping time, mapping area, and more. Researchers should consider not only the accuracy of products but also comprehensively choose LC data that suit their specific needs.

5. Conclusions

In this study, we synthesized the findings from validating and comparing eight LC datasets. By employing a stratified random sampling method, the research offers a detailed assessment of the accuracy and area estimates of these LC products.
The result shows the SRS method to obtain sampling points for validating existing medium- to high-resolution LC data. Based on the map classes, we stratified the classification, allocate samples to each stratum through proportional assignment, aiming to minimize the standard errors associated with accuracy estimates for each class. The accuracy of the eight LC datasets was relatively high, with ESA WorldCover being the highest among them. There was also a significant difference between UA and PA. Among them, the “Forest” and “Water” categories performed well among all classes, while the “Barren”, “Ice”, and “Wetland” categories exhibited relatively lower accuracy. The area of each category was determined based on classification estimates derived from reference data, using unbiased or consistent accuracy and area estimators to determine the area for each category.
In this research, the different spatial resolutions of land cover datasets are evaluated by different indicators such as OA, PA, UA, and Kappa coefficient. Our results provide a guide for users to selected the most suitable land cover dataset based on various research topics in Southwest China. Moreover, fully leveraging the results of accuracy assessment and consistency evaluation, combining the strengths of multiple sources of LC data products for data fusion is crucial in providing a comprehensive and more accurate LC data product for regional studies. This is an important aspect of future work.

Author Contributions

Conceptualization, X.J. and X.H.; Data curation, X.J.; Formal analysis, X.J. and Y.H.; Investigation, X.J.; Methodology, X.J. and X.H.; Resources, X.W.; Software, X.H.; Supervision, X.W.; Validation, J.W. and M.Z.; Visualization, X.J.; Writing—original draft, X.J.; Writing—review and editing, X.Z., Z.S. and X.W. All authors have read and agreed to the published version of the manuscript.

Funding

This work is supported by the Chinese High-resolution Earth Observation System of China (project number: 21-Y20B01-9001-19/22) and the special fund for youth team of Southwest University project (grant numbers: SWU-XJLJ202305).

Data Availability Statement

The data presented in this study are available on request from the corresponding author. The data are not publicly available due to privacy.

Acknowledgments

We are grateful to those who participated in the data processing. We also appreciate the fruitful suggestions from the anonymous reviewers which made the work better.

Conflicts of Interest

The authors declare no conflicts of interest.

References

  1. Mitchell, J.F.B. The “Greenhouse” Effect and Climate Change. Rev. Geophys. 1989, 27, 115–139. [Google Scholar] [CrossRef]
  2. Jo, H.-S.; Ham, Y.-G. Enhanced Joint Impact of Western Hemispheric Precursors Increases Extreme El Niño Frequency under Greenhouse Warming. Nat. Commun. 2023, 14, 6356. [Google Scholar] [CrossRef]
  3. Huang, Z.; Tan, X.; Gan, T.Y.; Liu, B.; Chen, X. Thermodynamically Enhanced Precipitation Extremes Due to Counterbalancing Influences of Anthropogenic Greenhouse Gases and Aerosols. Nat. Water 2023, 1, 614–625. [Google Scholar] [CrossRef]
  4. Tan, X.; Wu, X.; Huang, Z.; Fu, J.; Tan, X.; Deng, S.; Liu, Y.; Gan, T.Y.; Liu, B. Increasing Global Precipitation Whiplash Due to Anthropogenic Greenhouse Gas Emissions. Nat. Commun. 2023, 14, 2796. [Google Scholar] [CrossRef] [PubMed]
  5. Wei, J.; Fontaine, L.; Valiente, N.; Dörsch, P.; Hessen, D.O.; Eiler, A. Trajectories of Freshwater Microbial Genomics and Greenhouse Gas Saturation upon Glacial Retreat. Nat. Commun. 2023, 14, 3234. [Google Scholar] [CrossRef] [PubMed]
  6. Mishra, U.; Wu, J.-Z.; Sarkar, B. A Sustainable Production-Inventory Model for a Controllable Carbon Emissions Rate under Shortages. J. Clean. Prod. 2020, 256, 120268. [Google Scholar] [CrossRef]
  7. Khan, S.A.R. The Nexus between Carbon Emissions, Poverty, Economic Growth, and Logistics Operations-Empirical Evidence from Southeast Asian Countries. Environ. Sci. Pollut. Res. 2019, 26, 13210–13220. [Google Scholar] [CrossRef] [PubMed]
  8. Walsh, B.; Ciais, P.; Janssens, I.A.; Peñuelas, J.; Riahi, K.; Rydzak, F.; van Vuuren, D.P.; Obersteiner, M. Pathways for Balancing CO2 Emissions and Sinks. Nat. Commun. 2017, 8, 14856. [Google Scholar] [CrossRef] [PubMed]
  9. Canadell, J.G.; Le Quéré, C.; Raupach, M.R.; Field, C.B.; Buitenhuis, E.T.; Ciais, P.; Conway, T.J.; Gillett, N.P.; Houghton, R.A.; Marland, G. Contributions to Accelerating Atmospheric CO2 Growth from Economic Activity, Carbon Intensity, and Efficiency of Natural Sinks. Proc. Natl. Acad. Sci. USA 2007, 104, 18866–18870. [Google Scholar] [CrossRef]
  10. Houghton, R.A.; House, J.I.; Pongratz, J.; van der Werf, G.R.; DeFries, R.S.; Hansen, M.C.; Le Quéré, C.; Ramankutty, N. Carbon Emissions from Land Use and Land-Cover Change. Biogeosciences 2012, 9, 5125–5142. [Google Scholar] [CrossRef]
  11. Zhang, C.; Zhao, L.; Zhang, H.; Chen, M.; Fang, R.; Yao, Y.; Zhang, Q.; Wang, Q. Spatial-Temporal Characteristics of Carbon Emissions from Land Use Change in Yellow River Delta Region, China. Ecol. Indic. 2022, 136, 108623. [Google Scholar] [CrossRef]
  12. Ouyang, Z.; Zheng, H.; Xiao, Y.; Polasky, S.; Liu, J.; Xu, W.; Wang, Q.; Zhang, L.; Xiao, Y.; Rao, E.; et al. Improvements in Ecosystem Services from Investments in Natural Capital. Science 2016, 352, 1455–1459. [Google Scholar] [CrossRef]
  13. Sun, J.; Zhang, Y.; Qin, W.; Chai, G. Estimation and Simulation of Forest Carbon Stock in Northeast China Forestry Based on Future Climate Change and LUCC. Remote Sens. 2022, 14, 3653. [Google Scholar] [CrossRef]
  14. Li, Z.; Zhong, J.; Sun, Z.; Yang, W. Spatial Pattern of Carbon Sequestration and Urban Sustainability: Analysis of Land-Use and Carbon Emission in Guang’an, China. Sustainability 2017, 9, 1951. [Google Scholar] [CrossRef]
  15. Jung, M.; Henkel, K.; Herold, M.; Churkina, G. Exploiting Synergies of Global Land Cover Products for Carbon Cycle Modeling. Remote Sens. Environ. 2006, 101, 534–553. [Google Scholar] [CrossRef]
  16. Zhu, L.; Xing, H.; Hou, D. Analysis of Carbon Emissions from Land Cover Change during 2000 to 2020 in Shandong Province, China. Sci. Rep. 2022, 12, 8021. [Google Scholar] [CrossRef]
  17. Loveland, T.R.; Reed, B.C.; Brown, J.F.; Ohlen, D.O.; Zhu, Z.; Yang, L.; Merchant, J.W. Development of a Global Land Cover Characteristics Database and IGBP DISCover from 1 km AVHRR Data. Int. J. Remote Sens. 2000, 21, 1303–1330. [Google Scholar] [CrossRef]
  18. Friedl, M.A.; McIver, D.K.; Hodges, J.C.F.; Zhang, X.Y.; Muchoney, D.; Strahler, A.H.; Woodcock, C.E.; Gopal, S.; Schneider, A.; Cooper, A.; et al. Global Land Cover Mapping from MODIS: Algorithms and Early Results. Remote Sens. Environ. 2002, 83, 287–302. [Google Scholar] [CrossRef]
  19. China Land Cover Dataset. Available online: https://zenodo.org/records/5816591#.ZAWM3BVBy5c (accessed on 16 March 2024).
  20. GLC_FCS30 Dataset. Available online: https://data.casearth.cn/ (accessed on 16 March 2024).
  21. Globaland30 Dataset. Available online: https://www.webmap.cn/mapDataAction.do?method=globalLandCover (accessed on 16 March 2024).
  22. The European Space Agency (ESA) WorldCover Dataset. Available online: https://viewer.esa-worldcover.org/worldcover/ (accessed on 16 March 2024).
  23. Esri Land Cover Dataset. Available online: https://www.arcgis.com/apps/mapviewer/index.html (accessed on 16 March 2024).
  24. CRLC Dataset. Available online: https://github.com/LiuGalaxy/CRLC (accessed on 16 March 2024).
  25. Finer Resolution Observation and Monitoring of Global Land Cover Dataset. Available online: https://data-starcloud.pcl.ac.cn/zh/resource/1 (accessed on 16 March 2024).
  26. SinoLC-1. Available online: https://zenodo.org/records/8214871 (accessed on 16 March 2024).
  27. Richards, D.R.; Thompson, B.S.; Wijedasa, L. Quantifying Net Loss of Global Mangrove Carbon Stocks from 20 Years of Land Cover Change. Nat. Commun. 2020, 11, 4260. [Google Scholar] [CrossRef]
  28. Zhu, E.; Deng, J.; Zhou, M.; Gan, M.; Jiang, R.; Wang, K.; Shahtahmassebi, A. Carbon Emissions Induced by Land-Use and Land-Cover Change from 1970 to 2010 in Zhejiang, China. Sci. Total Environ. 2019, 646, 930–939. [Google Scholar] [CrossRef]
  29. Fan, S.; Guan, F.; Xu, X.; Forrester, D.I.; Ma, W.; Tang, X. Ecosystem Carbon Stock Loss after Land Use Change in Subtropical Forests in China. Forests 2016, 7, 142. [Google Scholar] [CrossRef]
  30. Mayaux, P.; Eva, H.; Gallego, J.; Strahler, A.H.; Herold, M.; Agrawal, S.; Naumov, S.; De Miranda, E.E.; Di Bella, C.M.; Ordoyne, C.; et al. Validation of the Global Land Cover 2000 Map. IEEE Trans. Geosci. Remote Sens. 2006, 44, 1728–1739. [Google Scholar] [CrossRef]
  31. Yu, Z.; Ciais, P.; Piao, S.; Houghton, R.A.; Lu, C.; Tian, H.; Agathokleous, E.; Kattel, G.R.; Sitch, S.; Goll, D.; et al. Forest Expansion Dominates China’s Land Carbon Sink since 1980. Nat. Commun. 2022, 13, 5374. [Google Scholar] [CrossRef]
  32. Olofsson, P.; Stehman, S.V.; Woodcock, C.E.; Sulla-Menashe, D.; Sibley, A.M.; Newell, J.D.; Friedl, M.A.; Herold, M. A Global Land-Cover Validation Data Set, Part I: Fundamental Design Principles. Int. J. Remote Sens. 2012, 33, 5768–5788. [Google Scholar] [CrossRef]
  33. García-Álvarez, D.; Camacho Olmedo, M.T.; Paegelow, M.; Mas, J.F. (Eds.) Land Use Cover Datasets and Validation Tools: Validation Practices with QGIS; Springer International Publishing: Cham, Switzerland, 2022; ISBN 978-3-030-90997-0. [Google Scholar]
  34. Chaaban, F.; El Khattabi, J.; Darwishe, H. Accuracy Assessment of ESA WorldCover 2020 and ESRI 2020 Land Cover Maps for a Region in Syria. J. Geovisualization Spat. Anal. 2022, 6, 31. [Google Scholar] [CrossRef]
  35. Gao, Y.; Liu, L.; Zhang, X.; Chen, X.; Mi, J.; Xie, S. Consistency Analysis and Accuracy Assessment of Three Global 30-m Land-Cover Products over the European Union Using the LUCAS Dataset. Remote Sens. 2020, 12, 3479. [Google Scholar] [CrossRef]
  36. Bai, Y.; Feng, M.; Jiang, H.; Wang, J.; Liu, Y. Validation of Land Cover Maps in China Using a Sampling-Based Labeling Approach. Remote Sens. 2015, 7, 10589–10606. [Google Scholar] [CrossRef]
  37. Fritz, S.; See, L.; Rembold, F. Comparison of Global and Regional Land Cover Maps with Statistical Information for the Agricultural Domain in Africa. Int. J. Remote Sens. 2010, 31, 2237–2256. [Google Scholar] [CrossRef]
  38. Ran, Y.; Li, X.; Lu, L. Evaluation of Four Remote Sensing Based Land Cover Products over China. Int. J. Remote Sens. 2010, 31, 391–401. [Google Scholar] [CrossRef]
  39. Wu, W.; Shibasaki, R.; Yang, P.; Ongaro, L.; Zhou, Q.; Tang, H. Validation and Comparison of 1 Km Global Land Cover Products in China. Int. J. Remote Sens. 2008, 29, 3769–3785. [Google Scholar] [CrossRef]
  40. Yang, Y.; Xiao, P.; Feng, X.; Li, H. Accuracy Assessment of Seven Global Land Cover Datasets over China. ISPRS J. Photogramm. Remote Sens. 2017, 125, 156–173. [Google Scholar] [CrossRef]
  41. Foody, G.M. Harshness in Image Classification Accuracy Assessment. Int. J. Remote Sens. 2008, 29, 3137–3158. [Google Scholar] [CrossRef]
  42. Tsendbazar, N.E.; de Bruin, S.; Herold, M. Assessing Global Land Cover Reference Datasets for Different User Communities. ISPRS J. Photogramm. Remote Sens. 2015, 103, 93–114. [Google Scholar] [CrossRef]
  43. Mo, L.; Zohner, C.M.; Reich, P.B.; Liang, J.; de Miguel, S.; Nabuurs, G.-J.; Renner, S.S.; van den Hoogen, J.; Araza, A.; Herold, M.; et al. Integrated Global Assessment of the Natural Forest Carbon Potential. Nature 2023, 624, 92–101. [Google Scholar] [CrossRef]
  44. Keenan, R.J.; Reams, G.A.; Achard, F.; de Freitas, J.V.; Grainger, A.; Lindquist, E. Dynamics of Global Forest Area: Results from the FAO Global Forest Resources Assessment 2015. For. Ecol. Manag. 2015, 352, 9–20. [Google Scholar] [CrossRef]
  45. Kuemmerle, T.; Olofsson, P.; Chaskovskyy, O.; Baumann, M.; Ostapowicz, K.; Woodcock, C.E.; Houghton, R.A.; Hostert, P.; Keeton, W.S.; Radeloff, V.C. Post-Soviet Farmland Abandonment, Forest Recovery, and Carbon Sequestration in Western Ukraine. Glob. Change Biol. 2011, 17, 1335–1349. [Google Scholar] [CrossRef]
  46. Skole, D.; Tucker, C. Tropical Deforestation and Habitat Fragmentation in the Amazon: Satellite Data from 1978 to 1988. Science 1993, 260, 1905–1910. [Google Scholar] [CrossRef]
  47. Czaplewski, R. Misclassification Bias in Areal Estimates. Photogramm. Eng. 1992, 58, 189–192. [Google Scholar]
  48. Gallego, F.J. Remote Sensing and Land Cover Area Estimation. Int. J. Remote Sens. 2004, 25, 3019–3047. [Google Scholar] [CrossRef]
  49. Stehman, S. Comparing Estimators of Gross Change Derived from Complete Coverage Mapping versus Statistical Sampling of Remotely Sensed Data. Remote Sens. Environ. 2005, 96, 466–474. [Google Scholar] [CrossRef]
  50. Piao, S.; Fang, J.; Ciais, P.; Peylin, P.; Huang, Y.; Sitch, S.; Wang, T. The Carbon Balance of Terrestrial Ecosystems in China. Nature 2009, 458, 1009–1013. [Google Scholar] [CrossRef]
  51. Wang, J.; Feng, L.; Palmer, P.I.; Liu, Y.; Fang, S.; Bösch, H.; O’Dell, C.W.; Tang, X.; Yang, D.; Liu, L.; et al. Large Chinese Land Carbon Sink Estimated from Atmospheric Carbon Dioxide Data. Nature 2020, 586, 720–723. [Google Scholar] [CrossRef] [PubMed]
  52. Li, X.; Li, Y.; Chen, A.; Gao, M.; Slette, I.J.; Piao, S. The Impact of the 2009/2010 Drought on Vegetation Growth and Terrestrial Carbon Balance in Southwest China. Agric. For. Meteorol. 2019, 269–270, 239–248. [Google Scholar] [CrossRef]
  53. Yu, W.; Tan, J.; Ma, M.; Li, X.; She, X.; Song, Z. An Effective Similar-Pixel Reconstruction of the High-Frequency Cloud-Covered Areas of Southwest China. Remote Sens. 2019, 11, 336. [Google Scholar] [CrossRef]
  54. Zhou, H.Y.; Pan, X.Y.; Zhou, W.Z. Assessing Spatial Distribution of Soil Erosion in a Karst Region in Southwestern China: A Case Study in Jinfo Mountains. IOP Conf. Ser. Earth Environ. Sci. 2017, 52, 012047. [Google Scholar] [CrossRef]
  55. Wei, L.; Hu, K.; Liu, S. Spatial Distribution of Debris Flow-Prone Catchments in Hengduan Mountainous Area in Southwestern China. Arab. J. Geosci. 2021, 14, 2650. [Google Scholar] [CrossRef]
  56. Olofsson, P.; Foody, G.M.; Herold, M.; Stehman, S.V.; Woodcock, C.E.; Wulder, M.A. Good Practices for Estimating Area and Assessing Accuracy of Land Change. Remote Sens. Environ. 2014, 148, 42–57. [Google Scholar] [CrossRef]
  57. Stehman, S.V. Sampling Designs for Accuracy Assessment of Land Cover. Int. J. Remote Sens. 2009, 30, 5243–5272. [Google Scholar] [CrossRef]
  58. Stehman, S.V.; Foody, G.M. Key Issues in Rigorous Accuracy Assessment of Land Cover Products. Remote Sens. Environ. 2019, 231, 111199. [Google Scholar] [CrossRef]
  59. Olofsson, P.; Foody, G.M.; Stehman, S.V.; Woodcock, C.E. Making Better Use of Accuracy Data in Land Change Studies: Estimating Accuracy and Area and Quantifying Uncertainty Using Stratified Estimation. Remote Sens. Environ. 2013, 129, 122–131. [Google Scholar] [CrossRef]
  60. Liu, P.; Pei, J.; Guo, H.; Tian, H.; Fang, H.; Wang, L. Evaluating the Accuracy and Spatial Agreement of Five Global Land Cover Datasets in the Ecologically Vulnerable South China Karst. Remote Sens. 2022, 14, 3090. [Google Scholar] [CrossRef]
  61. Jiang, Z.; Lian, Y.; Qin, X. Rocky Desertification in Southwest China: Impacts, Causes, and Restoration. Earth Sci. Rev. 2014, 132, 1–12. [Google Scholar] [CrossRef]
Figure 1. Overview of the study area. (a) Distributions of days with high-quality images in China, the days in the MODIS products, (b) the topography of the study area.
Remotesensing 16 01111 g001
Figure 2. Work flow for validation of LC products in Southwest China using a stratified random sampling method.
Remotesensing 16 01111 g002
Figure 3. Distribution of sample points in the study area. (a) Chongqing; (b) Mount Siguniang, Sichuan Province; (c) Kunming, Yunnan Province; (d) Sampling count and proportion by category; (e) The distribution of LC samples collected in Southwest China; (f) Scatterplots of the map data with each category to highlight latitudinal patterns.
Remotesensing 16 01111 g003
Figure 4. OA, Kappa coefficient, the OA and Kappa coefficient provided by the author of eight LC products.
Remotesensing 16 01111 g004
Figure 5. UA and PA of eight land cover types in Southwest China.
Remotesensing 16 01111 g005
Figure 6. Area of the eight classes among the seven LC maps except for SinoLC-1. (ah) shows the area of each category in different LC maps.
Remotesensing 16 01111 g006
Figure 7. The spatial consistency among different land cover maps is demonstrated in a typical region—Caoshang, Chongqing.
Remotesensing 16 01111 g007
Table 1. Parameters of LC products used in the study.
ProductSensorProduction OrganizationTimeClassification NumberOverall AccuracySource
CLCDLandsatWuhan University1985–2022979.31%https://zenodo.org/records/5816591#.ZAWM3BVBy5c (accessed on 16 March 2024)
GLC_FCS30LandsatAIR1985–2020 *2982.50%https://data.casearth.cn/ (accessed on 16 March 2024)
GlobeLand30LandsatNGCC2000, 2010, 20201080.33%https://www.webmap.cn/mapDataAction.do?method=globalLandCover (accessed on 16 March 2024)
ESA WorldCoverSentinel-1, Sentinel-2ESA2020, 20211174.40%https://viewer.esa-worldcover.org/worldcover/ (accessed on 16 March 2024)
Esri Land CoverSentinel-2ESRI2017–2022985.96%https://www.arcgis.com/apps/mapviewer/index.html (accessed on 16 March 2024)
CRLCSentinel-2Wuhan University2020884.87%https://github.com/LiuGalaxy/CRLC (accessed on 16 March 2024)
FROM_GLC10Sentinel-2Tsinghua University20171072.76%https://data-starcloud.pcl.ac.cn/zh/resource/1 (accessed on 16 March 2024)
SinoLC-1Sentinel-2Wuhan University20201173.61%https://zenodo.org/records/8214871 (accessed on 16 March 2024)
* GLC_FCS30 dataset was generated every five years from 1985 to 2020.
Table 2. Correspondence between target classification system and original classification system.
ProductForestGrasslandCroplandImperviousBarrenIceWaterWetland
GLC_FCS3012/51/52,61/62/71/72/81/82/91/92 *11/120/121/122/130/140/150/152/15310/20190200/201/202220210180
GlobeLand302030/401080901006050
CLCD23/4187659
FROM_GLC102030/401080901006050
ESA WorldCover1020/30405060708090
Esri Land Cover2/611578914
CRLC231891065
SinoLC-123/451/678910
* The numbers presented in the table denote the category codes of the original classification system for different remote sensing product.
Table 3. Feature classification and description of imagery.
Class NameImagesGoogle EarthFeature Description
ForestRemotesensing 16 01111 i001Remotesensing 16 01111 i002Dark green in RGB, red in false color composite, dark and coarse texture.
GrasslandRemotesensing 16 01111 i003Remotesensing 16 01111 i004Thin lines of fine textured vegetation in moss green (on the bands 8, 4, 3)
CroplandRemotesensing 16 01111 i005Remotesensing 16 01111 i006With geometric shapes of the rules and finely, uneven color
ImperviousRemotesensing 16 01111 i007Remotesensing 16 01111 i008Regular or irregular distribution, violet in false color composite
BarrenRemotesensing 16 01111 i009Remotesensing 16 01111 i010Objects (in bands 8, 4, 3) are pink to dark red area sometimes brown.
IceRemotesensing 16 01111 i011Remotesensing 16 01111 i012Light blue in false color composite, white in RGB
WaterRemotesensing 16 01111 i013Remotesensing 16 01111 i014Light blue, whitish blue or black (on bands 8, 4, 3), shape is linear or block
WetlandRemotesensing 16 01111 i015Remotesensing 16 01111 i016Mainly distributed in rivers and lakes around, rivers and lakes as the center
Table 4. Summary of OA and Kappa of eight LC maps in Southwest China.
NameCLCDGLCFCSGlobal30FROM_GLCESRIESACRLCSINOLC
OA85.48%75.47%72.78%80.89%84.43%87.10%81.85%77.03%
KAPPA0.740.580.540.650.720.760.680.51
Table 5. Area and error range (95% CI) for each land cover category in the southwestern region land cover product. All area estimates are provided in units of ten thousand hectares.
ClassCLCDGLC_FCS30Globaland30FROM_GLCEsri Land CoverESA World CoverCRLC
Forest8953 ± 2569379 ± 3058945 ± 3378408 ± 2858719 ± 2698697 ± 2649025 ± 336
Grassland2089 ± 1872046 ± 2472098 ± 2541931 ± 2182264 ± 2352322 ± 2312441 ± 262
Cropland2095 ± 2281725 ± 2411989 ± 2512068 ± 2432018 ± 2221888 ± 1912532 ± 255
Impervious280 ± 105255 ± 80272 ± 82252 ± 102328 ± 120265 ± 80295 ± 97
Barren113 ± 64109 ± 74123 ± 75138 ± 77163 ± 69132 ± 81119 ± 75
Ice22 ± 1013 ± 731 ± 1137 ± 1842 ± 1323 ± 1540 ± 15
Water112 ± 19103 ± 17157 ± 23122 ± 29146 ± 29131 ± 21159 ± 30
Wetland11 ± 1111 ± 1327 ± 830 ± 1950 ± 2619 ± 1135 ± 17
Disclaimer/Publisher’s Note: The statements, opinions and data contained in all publications are solely those of the individual author(s) and contributor(s) and not of MDPI and/or the editor(s). MDPI and/or the editor(s) disclaim responsibility for any injury to people or property resulting from any ideas, methods, instructions or products referred to in the content.

