Article

Assessing Drought Stress of Sugarcane Cultivars Using Unmanned Vehicle System (UAS)-Based Vegetation Indices and Physiological Parameters

by
Ittipon Khuimphukhieo
1,2,3,
Mahendra Bhandari
2,4,
Juan Enciso
3,5 and
Jorge A. da Silva
2,3,*
1
Department of Plant Production Technology, Kalasin University, Kalasin 46000, Thailand
2
Department of Soil and Crop Sciences, Texas A&M University, College Station, TX 77843, USA
3
Texas A&M AgriLife Research, Weslaco, TX 78596, USA
4
Texas A&M AgriLife Research and Extension Center, Corpus Christi, TX 78406, USA
5
Department of Biological and Agricultural Engineering, Texas A&M University, College Station, TX 77843, USA
*
Author to whom correspondence should be addressed.
Remote Sens. 2024, 16(8), 1433; https://doi.org/10.3390/rs16081433
Submission received: 19 March 2024 / Revised: 8 April 2024 / Accepted: 13 April 2024 / Published: 18 April 2024

Abstract

:
Sugarcane breeding for drought tolerance is a sustainable strategy to cope with drought. In addition to biotechnology, high-throughput phenotyping has become an emerging tool for plant breeders. The objectives of the present study were to (1) identify drought-tolerant cultivars using vegetation indices (VIs), compared to the traditional method and (2) assess the accuracy of VIs-based prediction model estimating stomatal conductance (Gs) and chlorophyll content (Chl). A field trial was arranged in a randomized complete block design, consisting of seven cultivars of sugarcane. At the tillering and elongation stages, irrigation was withheld, and then furrow irrigation was applied to relieve sugarcane from stress. The physiological assessment measuring Gs and Chl using a handheld device and VIs were recorded under stress and recovery periods. The results showed that the same cultivars were identified as drought-tolerant cultivars when VIs and traditional methods were used for identification. Likewise, the results derived from genotype by trait biplot and heatmap were comparable, in which TCP93-4245 and CP72-1210 cultivars were classified as tolerant cultivars, while sensitive cultivars were CP06-2400 and CP89-2143 for both physiological parameters and VIs-based identification. In the prediction model, the random forest outperformed linear models in predicting the performance of cultivars in untested crops/environments for both Gs and Chl. In contrast, it underperformed linear models in the tested crops/environments. The identification of tolerant cultivars through prediction models revealed that at least two out of three cultivars had consistent rankings in both measured and predicted outcomes for both traits. This study shows the possibility of using UAS mounted with sensors to assist plant breeders in their decision-making.

Graphical Abstract

1. Introduction

With global warming, drought is expected to become more intense, unpredictable, and long-lasting in many regions around the world [1]. As a result, technologies in plant science enabling the maintenance of high yields in limited water resources are essential to ensure food sustainability. These are, for example, smart agriculture, soil conservation, as well as drought tolerance of cultivars. In plant science, drought stress is known as one of the most detrimental abiotic stresses for the growth and development of plants [2]. Sugarcane is primarily grown in tropical and subtropical regions up to approximately 35°N to 35°S of the equator [3] and mostly in rain-fed conditions. With its long life cycle (12 to 18 months), sugarcane encounters water-deficit stress at some points in its lifetime. In the process of evolution, plants have developed complex regulatory mechanisms to overcome drought, including escape, avoidance, tolerance, and recovery after stress. Drought avoidance and drought tolerance are the main mechanisms for the improvement of plant drought resistance [4]. Morphologically, sugarcane mainly responds to drought by leaf rolling, cell wall shrinking, leaf senescence, and deep root growth [5]. Stomatal closure to prevent internal water loss, damaged chloroplast caused by reactive oxidative species (ROS), and reduction in plant relative water content (RWC) have been reported as major effects of drought on the physiology of sugarcane [6]. In addition, reduction in biochemical activities in the mesophyll and bundle sheath cell such as phosphoenolpyruvate carboxylase (PEPCase), RuBisCo, malic enzyme (NADP-ME), fructose-1, 6-bisphosphatase (FBPase), and pyruvate orthophosphate dikinase (PPDK) is responsible for photosynthesis reductions under severe stress [6]. Eventually, drought significantly reduces sugarcane yield, and up to 80% yield reduction was reported [7]. Breeding for drought tolerance is an economic and sustainable mitigation strategy against the current and projected drought stress [8].
When it comes to selecting a genotype for drought tolerance, not only how genotypes perform under stress is monitored, but consideration of the ability to recover from the stress is also important. The recovery from drought is a complicated process involving the reorganization of several metabolic pathways to repair drought-induced damage and resume plant growth [9]. Various methods have been proposed to assess drought stress on sugarcane for identification of drought-tolerant genotypes. Unlike yield and its components, drought tolerance cannot be directly quantified; instead, it is indirectly measured in the plant through drought-related traits, including yield, crop height, visual assessment, and physiological and biochemical traits. Drought intensity and crop tolerance response could also be evaluated by estimating the total water applied to the crop and comparing it with estimated crop evapotranspiration. Conventionally, sugarcane breeding for drought tolerance has been primarily based on cane yield [10]. However, yield is the final performance, which is impossible to measure during the stress period, such as at the vegetative growth stage. Visual assessment to quantify the drought tolerance of sugarcane was reported by Wagih and Kaiulo [11]. As is well known, this assessment is very subjective and prone to human error. Although biochemical parameters such as proline and amino acids have been widely used to assess the effect of drought in many crops, they are limited to only experiments conducted in a greenhouse or small sample size with the disadvantage of being time-consuming, labor-intensive, destructive, and expensive. As a result, this assessment is impractical when thousands of genotypes in a segregating population need to be screened. Physiological traits are the most widely used parameters to identify drought-tolerant genotypes, especially in field trials as they could be non-destructively measured using a handheld device. Identification of drought-tolerant genotypes of sugarcane using this means has been reported by Silva et al. [12], Gomathi et al. [13], and Sajid et al. [14]. As non-destructive measurements, it used to be considered a fast tool for the identification of drought-tolerant genotypes [12]. However, it is currently viewed as being time-consuming, labor-intensive, and expensive these days, since there is an emerging phenotyping tool able to assess more phenotyping in a relatively shorter time [15], compared to traditional measurements. Unmanned aerial systems (UAS)-based vegetation indices (VIs) have been widely used as an efficient tool to assess the effect of drought on many crops, such as wheat [15,16], corn [17], and sugarcane [18].
With UAS-based VIs, two types of applications have been widely used as a plant breeder’s toolbox for the identification of drought-tolerant genotypes. Firstly, UAS-based VIs are used directly to differentiate drought-tolerant genotypes, where the plant breeder’s decision is solely based on the performance of those UAS-based VIs. This application has been applied in many crops, such as wheat [19,20]. Wen et al. [20] identified drought-tolerant wheat genotypes using VIs instead of plant physiological and biological traits and found that VIs can be used as alternative and inexpensive measures for identifying drought tolerance in wheat. Although recent work reported the use of aerial phenotyping for sugarcane yield and drought tolerance, Hoffman et al. [18] did not compare the aerial method with traditional assessment. So far, we are not aware of any studies that have identified drought-tolerant genotypes of sugarcane by using VIs, compared to the physiological methods. Secondly, these VIs are used to establish a prediction model and the model is used to estimate the performance of traits such as chlorophyll content, biomass, and yield that are related to drought tolerance. Then, the plant breeder’s decision is based on predicted values derived from such a model. This application solely relies on a prediction model, and the accuracy of the model depends on the association between independent variables with target traits, as well as the reliability of the model. The success of this application has been reported in many crops such as sugarcane [21] and corn [17]. However, few approaches and applications were designed in a plant breeding context, where genotype ranking based on their performance is our priority in addition to genotype x environment interaction.
Moreover, even though the study of using VIs to assess drought tolerance is well studied, there are still gaps in plant breeding application, as explained previously. Therefore, the objectives of the present study were (1) to identify drought-tolerant and susceptible cultivars using UAS-based VIs and compare them with traditional physiological traits for validation, and (2) to evaluate the accuracy of VIs-based prediction models predicting stomatal conductance (Gs) and chlorophyll content (Chl) through different cross-validation schemes.

2. Materials and Methods

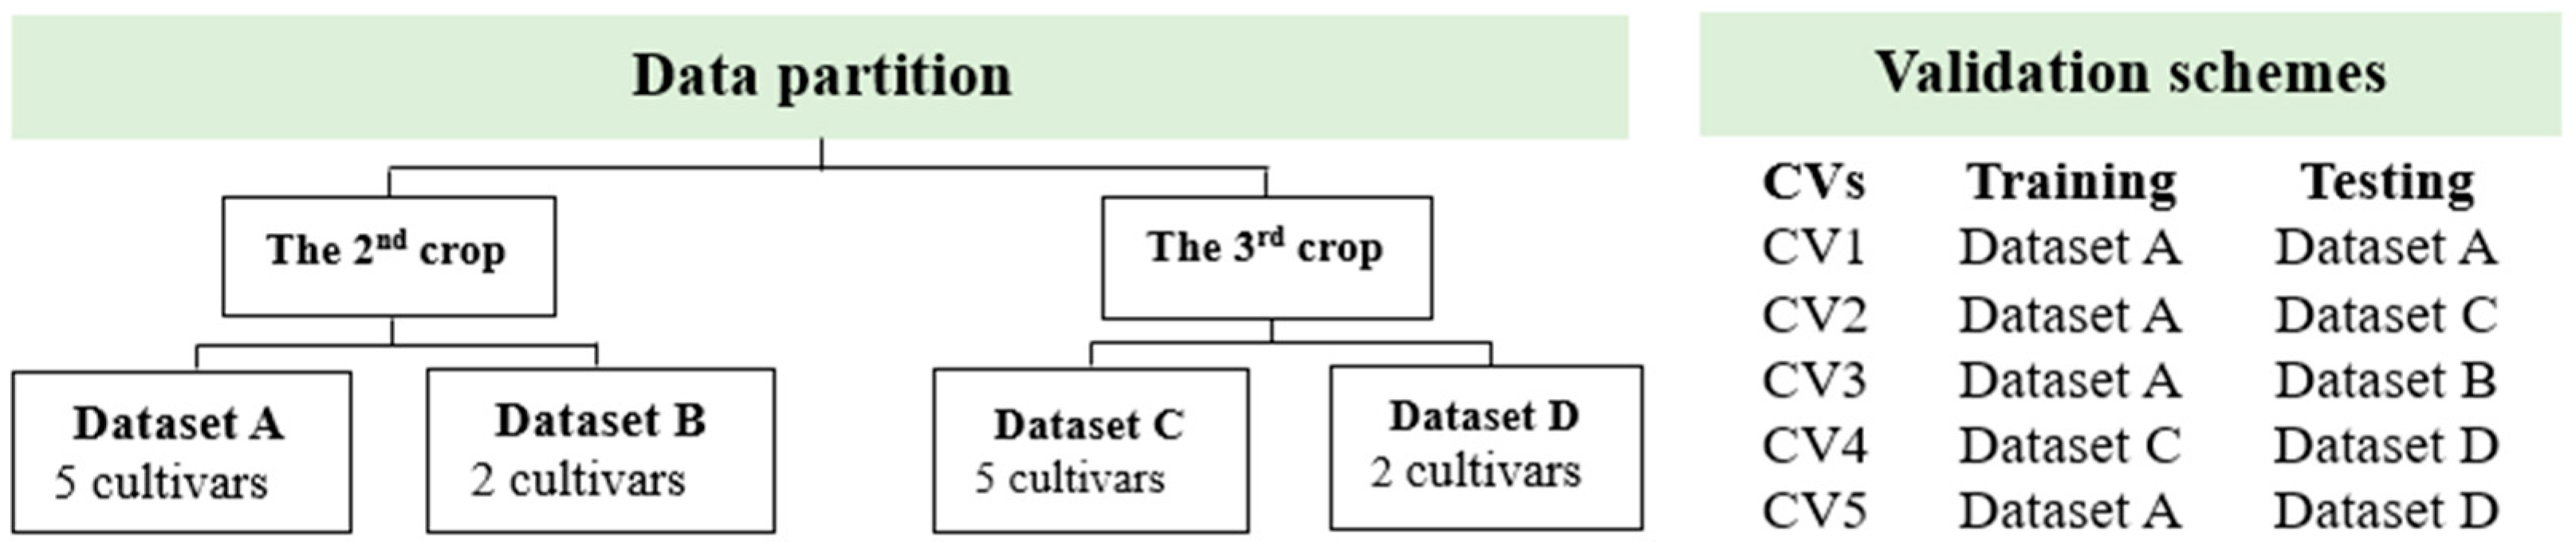
2.1. Plant Materials and Experimental Design

A characteristic description of the seven commercial cultivars of sugarcane used in this study is presented in Table 1. The cultivars used for this study were chosen to include recently released sugarcane cultivars planted in commercial areas in both Florida and Texas, two of the three states where sugarcane is commercially grown in the USA. In addition, this set includes cultivars known to have contrasting reactions to drought stress (which is considered the main limiting factor for the Texas sugar industry, where the area allocated to the crop requires irrigation) either drought sensitive (as in the case of CP89-2143) or tolerant (as in the case of TCP93-4245), representing a substantial range on the reaction to this particular abiotic stress, to allow the comparison between physiological and high throughput phenotyping parameters. These cultivars were planted in a randomized complete block design (RCBD) with four replications at the Texas A&M AgriLife Research and Extension Center in Weslaco, Texas (26°9.78′N, 97°56.40′W, 21 m AMSL). This experiment was carried out in a field with a known variation within the field. To reduce experimental error, the RCBD design was chosen in this study because, with this design, variation within the block is accounted for in homogenous blocks. The study area and experimental plots of this trial were described previously by Khuimphuhieo et al. [22]. The study area is humid subtropical with an average annual precipitation of 632 mm [23]. This study involves data from the 2nd (May 2022–May 2023) and the 3rd ratoon of sugarcane (May 2023–December 2023).

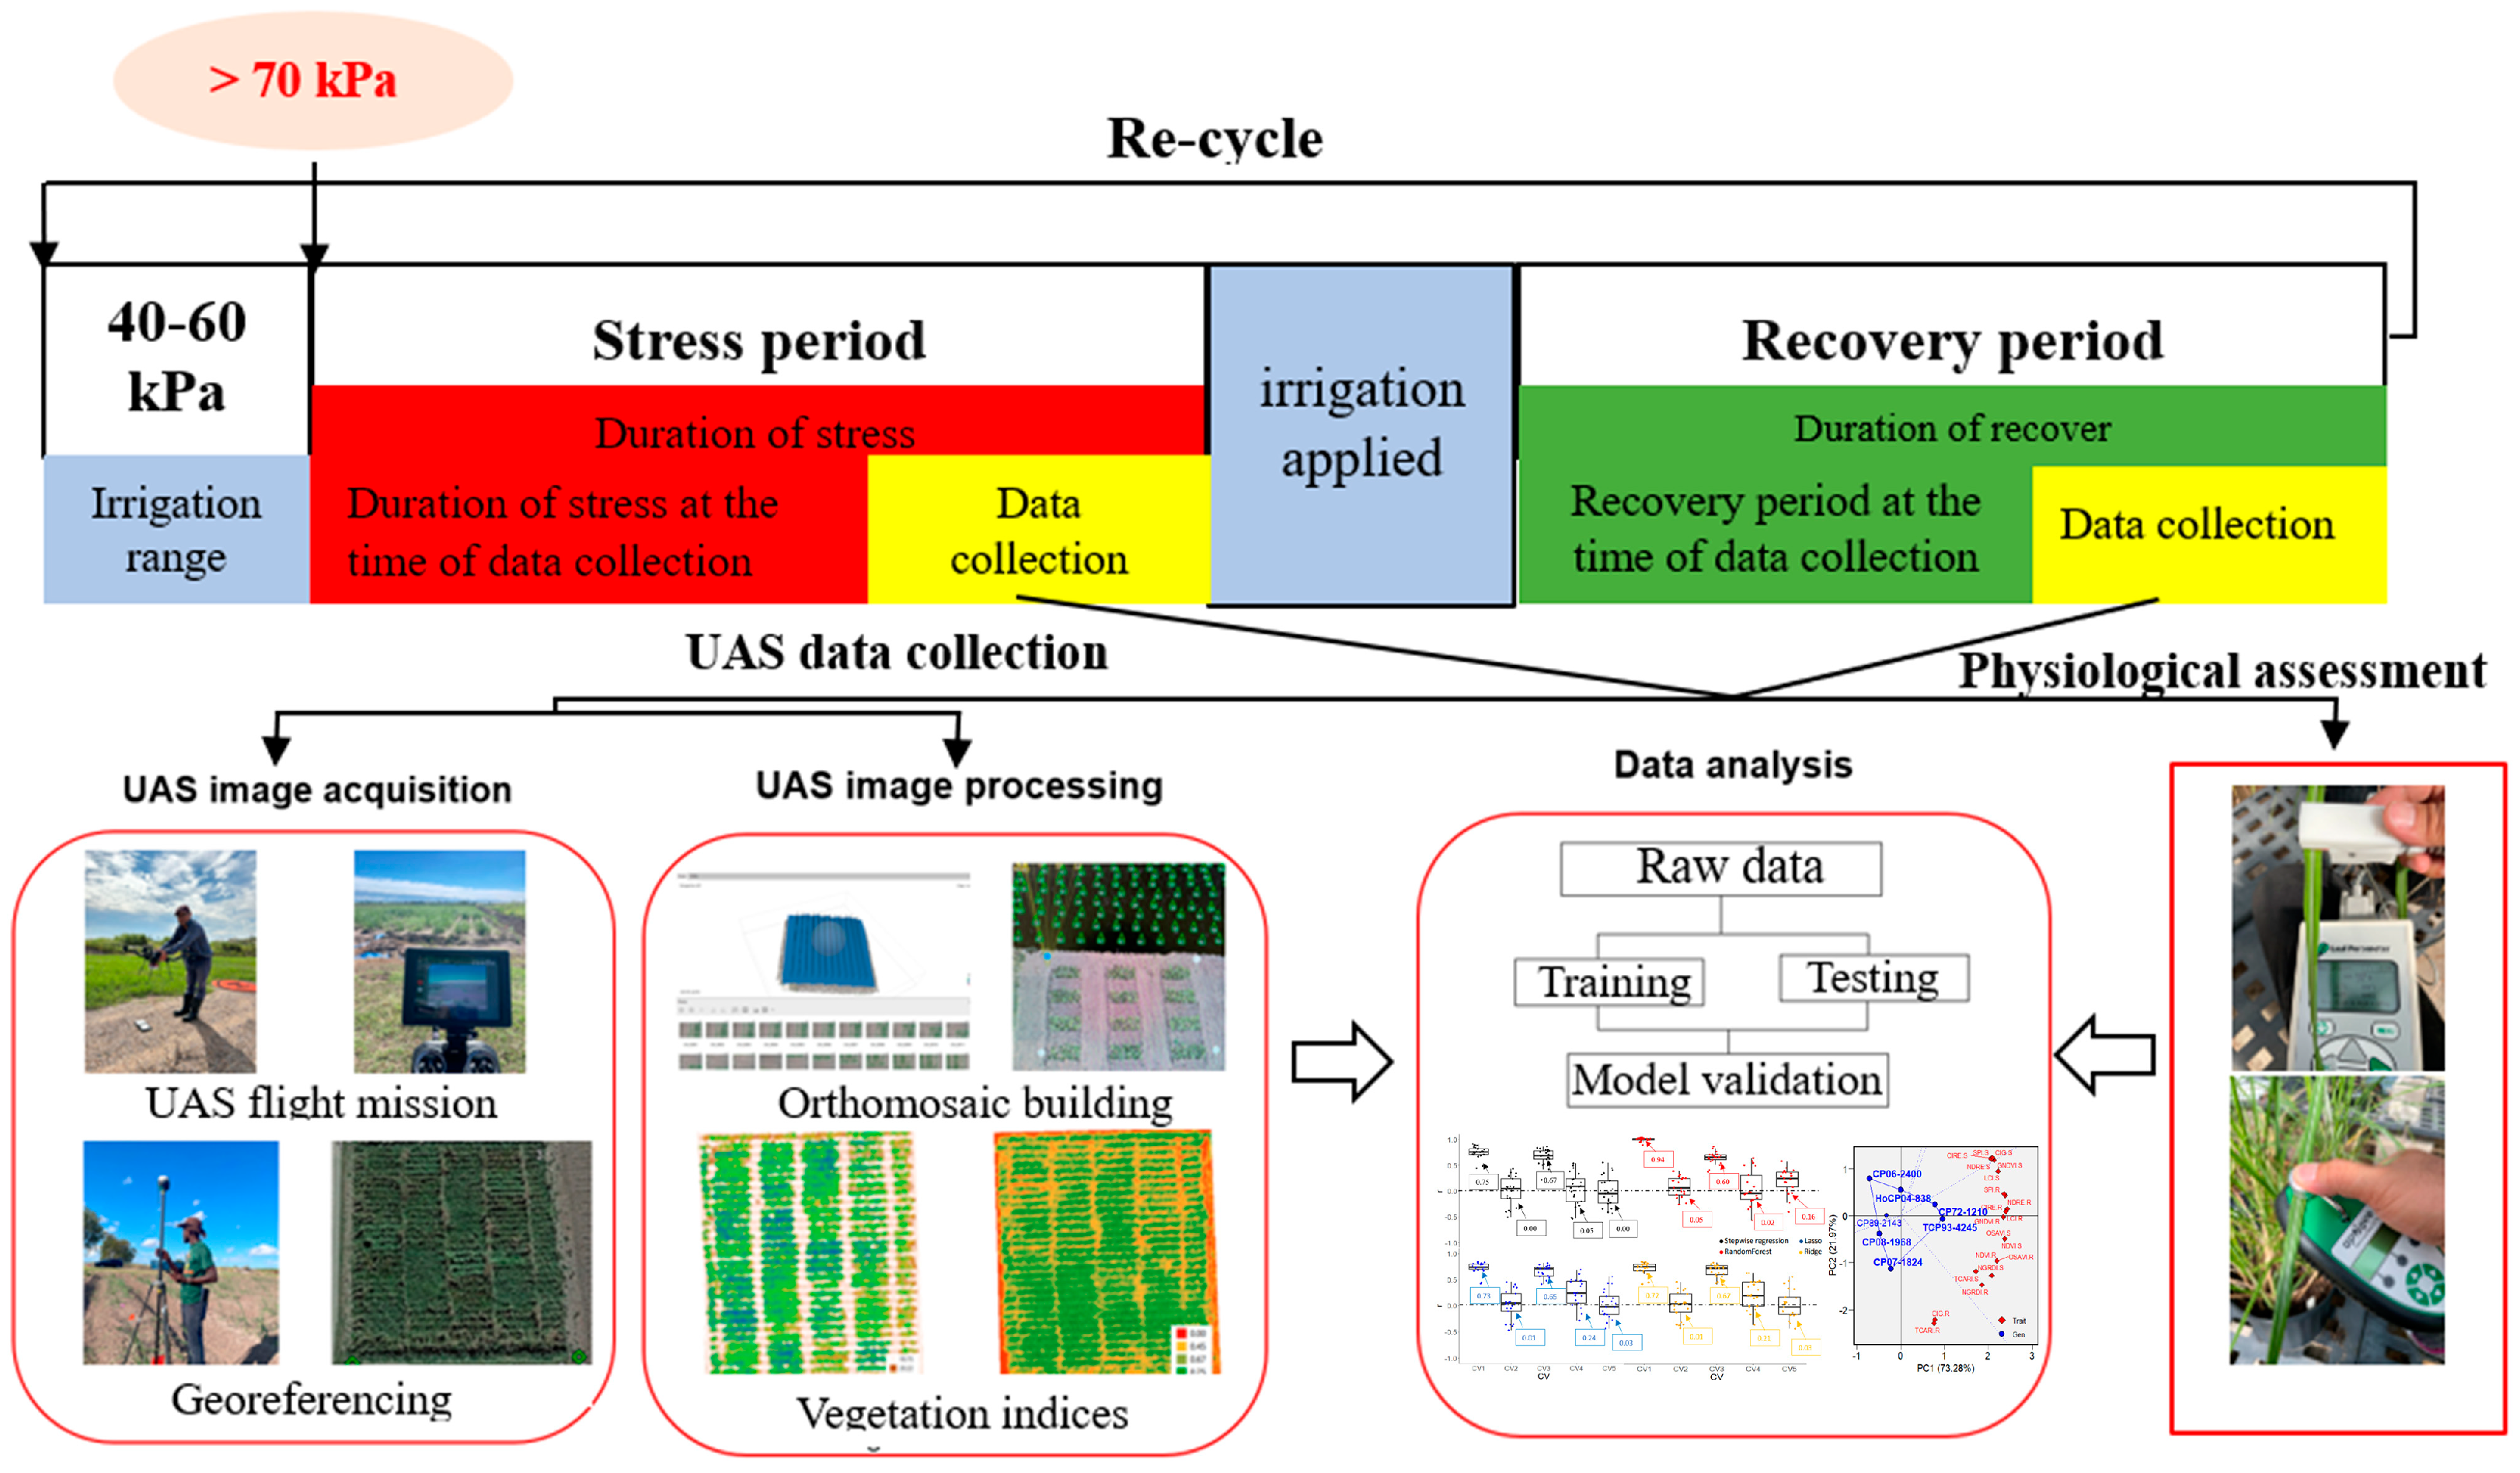
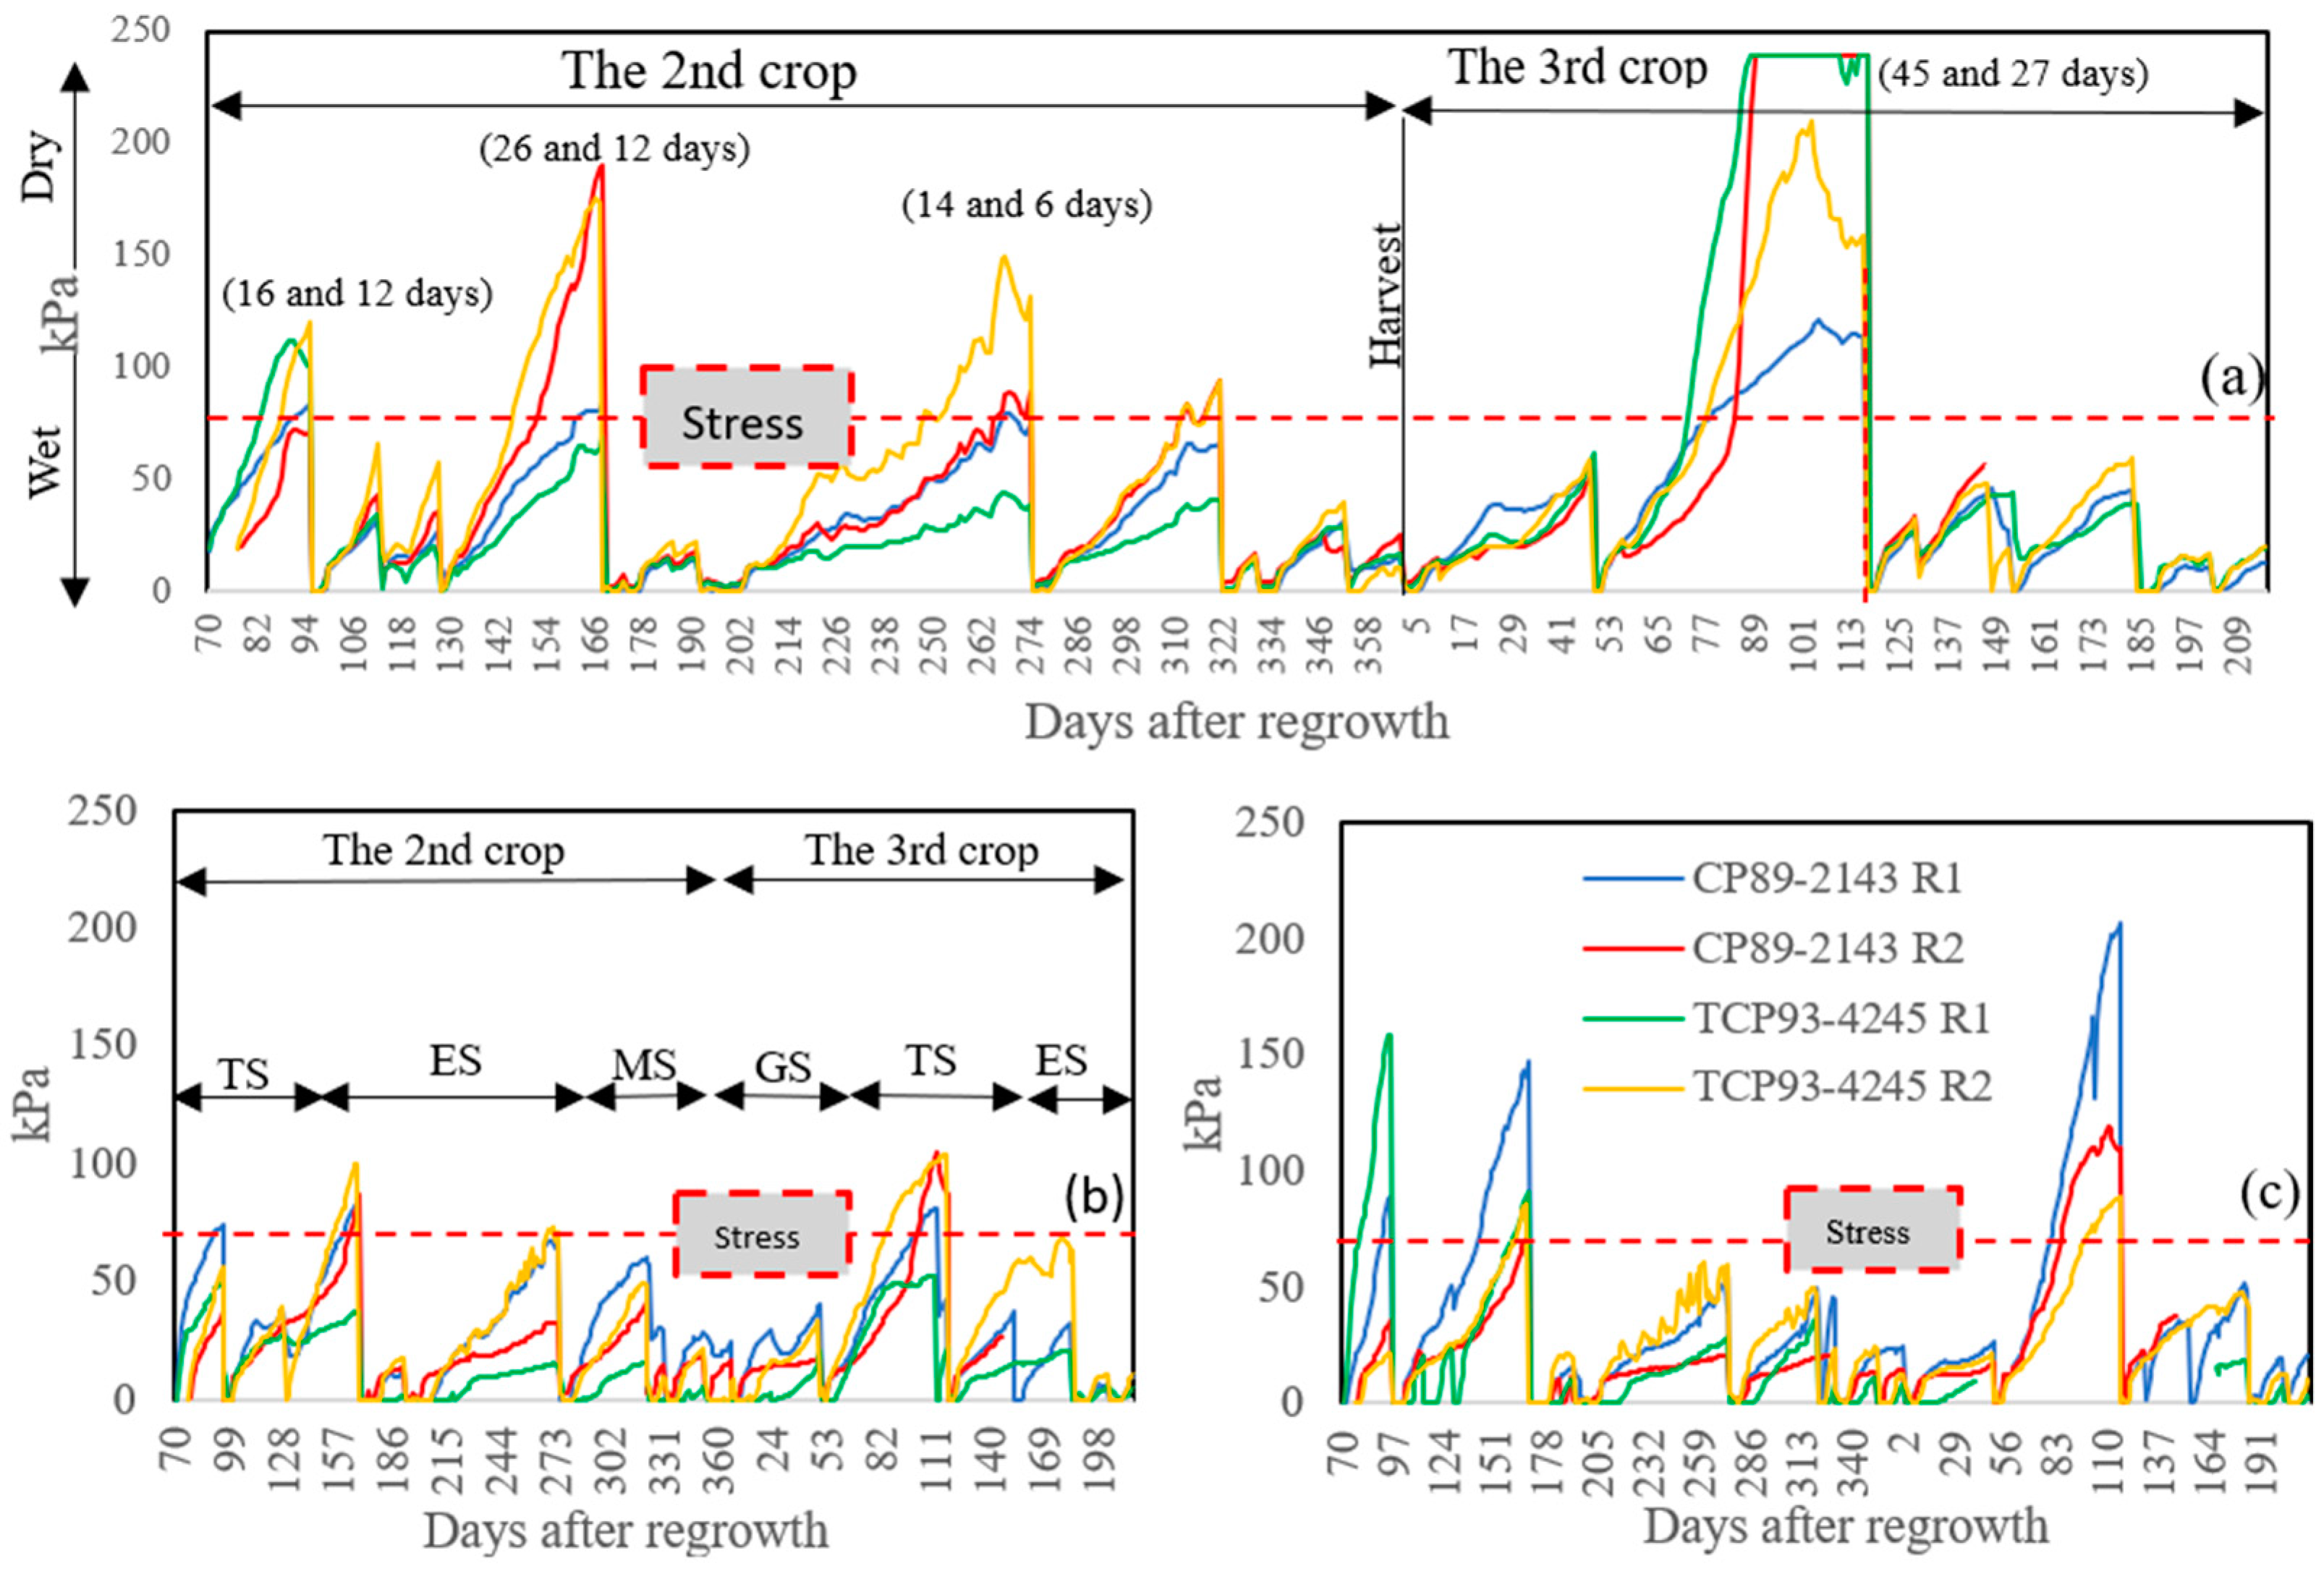
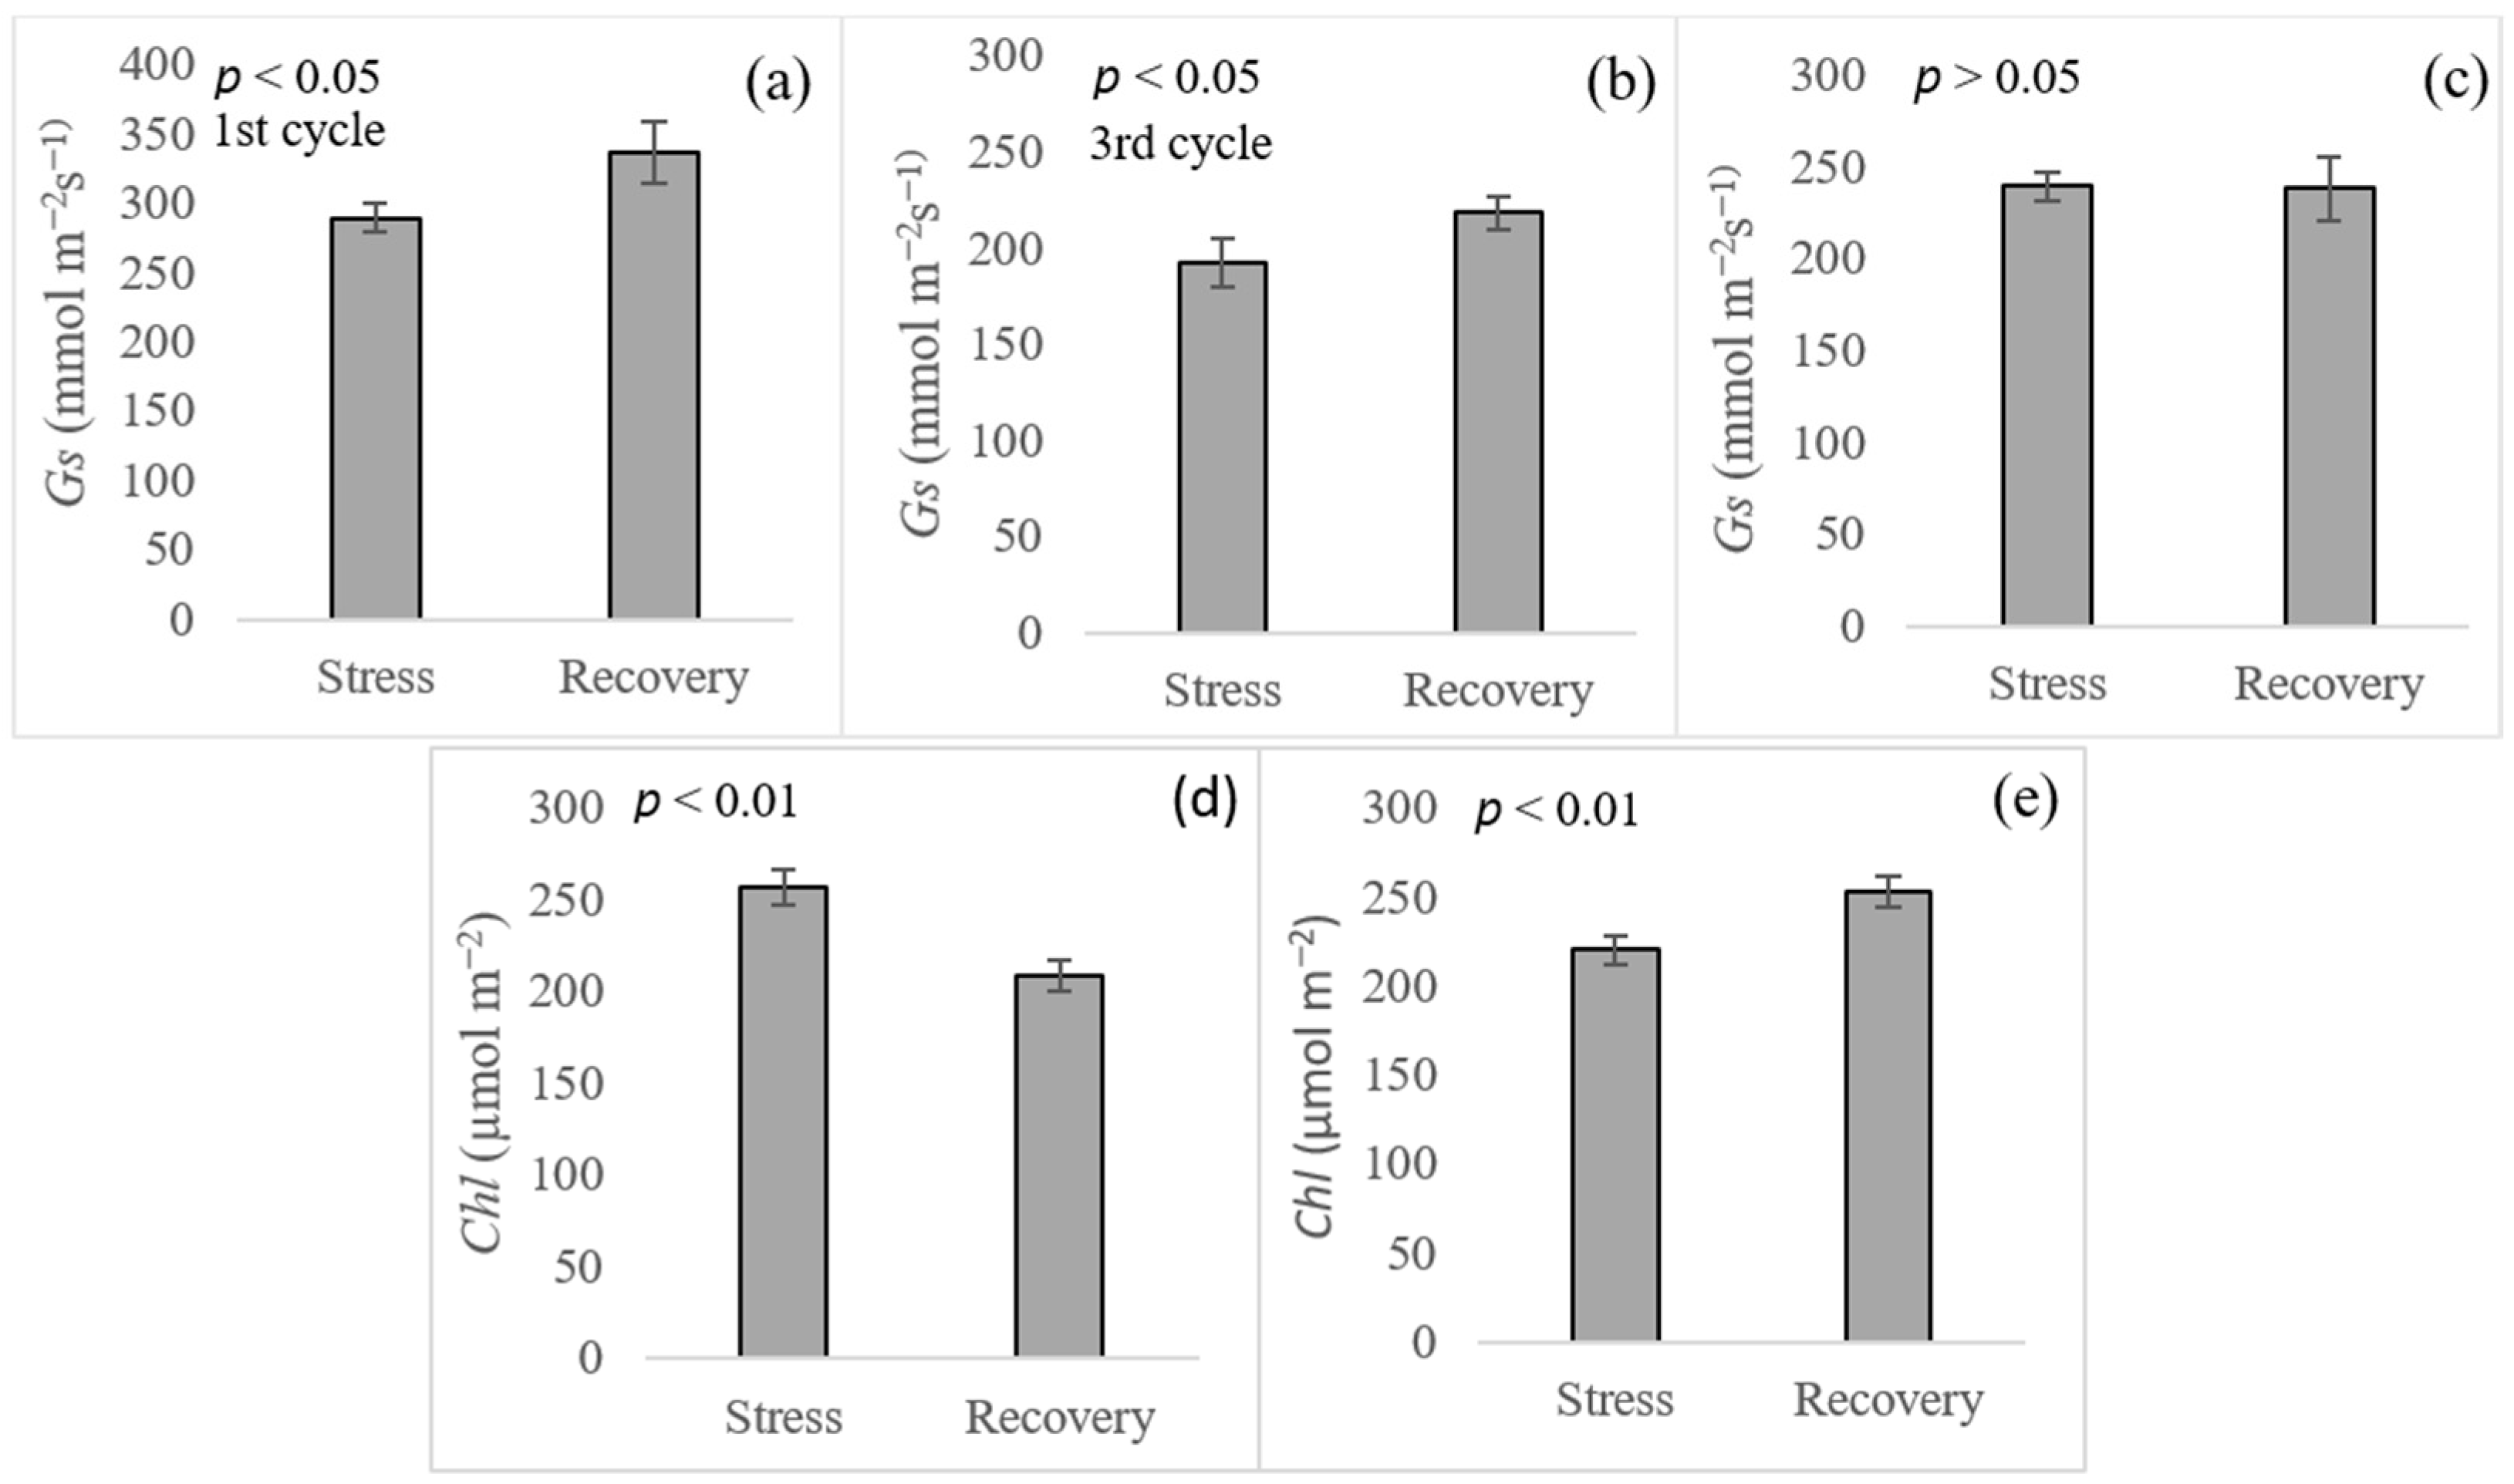
2.2. Drought Stress and Recovery Determination

Twelve watermark sensors (Irrometer Company Inc., Riverside, CA, USA) were installed in the ground at 4 locations with 3 soil depths per location (15, 46, and 79 cm). Two locations of the sensor were installed at an experimental unit of the cultivar CP89-2143 (susceptible), while the other two were installed at the cultivar TCP93-4245 (tolerant). The drought stress and recovery cycles were applied during tillering to elongation stages because these stages are most sensitive to water stress in sugarcane [32]. Drought stress was triggered when two of the four positions of soil moisture meters embedded at 15 cm reached over 70 kPa. Then physiological parameters were assessed using handheld devices as explained below in Section 2.4, and UAS mounted with sensors was flown as explained below in Section 2.3. During this phase, they were considered under stress. Afterward, furrow irrigation was applied to relieve sugarcane from stress. Then, the UAS mission and physiological parameters were conducted again as the recovery phase (Figure 1). Dates of stress started, irrigation applied, and data collection for each drought cycle are provided in Table 2. A weather station was located approximately 20 m away from the trial to record rainfall and temperature throughout the studied period. Approximately 40 mm were applied through furrow irrigation.

2.3. UAS Data Collection and Processing

2.3.1. UAS Image Acquisition

The UAS image data collection was performed between 10.00 AM to 2.00 PM on sunny days with wind speeds below 10 mph. We flew DJI Phantom 4 Pro and DJI Phantom 4 RTK (SZ DJI Technology Co., Ltd., Shenzhen, China) attached with 20 megapixels one-inch CMOS (complementary metal-oxide-semiconductor) red, green, and blue (RGB) for RGB sensor in this study. A DJI P4 Multispectral mounted with P4 Multispectral sensor and a SlantRange 4P+ sensor (SlantRange, Inc., San Diego, CA, USA) mounted on DJI Matrice M 200 was used for multispectral (MS) data collection. For georeferencing, four ground control points (GCPs) were placed in each corner of the trial, and we used a V-map system (Micro Aerial Projects, Gainesville, FL, USA) to obtain the accurate coordinates of each GCP.

2.3.2. Image Processing

The SlantView 2.17.4.3605 software (SlantRange, Inc., San Diego, CA, USA) was used to obtain radiometrically calibrated MS images. These images, along with RGB images, were processed using Agisoft Metashape Professional 1.7.1 software (Agisoft LLC, St. Petersburg, Russia) to obtain RGB and MS orthomosaics. We incorporated the coordinates of each GCP into Agisoft Metashape Professional 1.7.1 software for georeferencing. The DJI Terra software 2.3.0 (SZ DJI Technology Co., Ltd., Shenzhen, China) was used to process MS images obtained by the P4 Multispectral sensor. Georeferencing was also implemented by incorporating the coordinates of GCPs into DJI Terra 2.3.0 software. For radiometric calibration of P4 multispectral images, they were implemented automatically when they were processed with DJI Terra 2.3.0 software [33]. Afterwards, MS orthomosaics were exported. Shapefile polygons were drawn in QGIS 3.16 software (QGIS project, Böschacherstrasse, Switzerland), and VIs as average values from each polygon were extracted from those orthomosaics. Ten VIs used in the present study are shown in Table 3. These VIs were chosen because they have been previously reported as promising VIs in assessing physiological traits of plants [17,34,35].

2.4. Physiological Assessments

2.4.1. Stomatal Conductance (Gs)

Gs was measured using a leaf porometer (SC-1 Decagon Devices, Inc., Pullman, WA USA). For each measurement, Gs of the youngest fully expanded leaf of twelve plants from each experimental unit were measured between 10:00 h and 14:00 h, according to the previous study reported by Basnayake et al. [44].

2.4.2. Chlorophyll Content Meter (Chl)

Chl was quantified by using an MC-100 Chlorophyll Concentration Meter (Apogee Instrument, Inc., Logan, UT, USA). For each measurement, Chl of the youngest fully expanded leaf of twelve plants from each experiment unit was randomly measured between 10:00 h to 14:00 h.

2.5. Data Analysis

Analysis of variance according to RCBD was performed for Gs and Chl. The least significant difference (LSD) method was analyzed for mean separation at 0.05 level. The relationship between physiological traits with tons of cane per hectare (TCH) and VIs was implemented using Pearson’s correlation. A t-test analysis was used to determine if there was a significant difference between the means of the two periods (stress and recovery).

2.5.1. Identification of Drought-Tolerant Cultivars of Sugarcane

Genotypes by traits biplot (GT biplot) were graphically analyzed using ten VIs and physiological parameters (Gs and Chl) and combined all traits. The RStudio 4.2.2 software (RStudio, Boston, MA, USA), along with the “metan” package, was used to obtain this GT biplot. A heatmap analysis was also implemented using RStudio. The scale() function in RStudio was used to standardize the data. Once all data were standardized, a heatmap was graphically generated using the “ComplexHeatmap” package in RStudio.

2.5.2. Vegetation Indices (VIs)-Based Gs and Chl Prediction Model

The validation scheme used in this study was specially designed for plant breeding applications. This cross-validation scheme was recently presented by Adak et al. [45] where both genotypes and environments were considered. This information is crucial to plant breeders, as it provides significant information on how accurate the models we can expect in various scenarios. Moreover, the performance of a given genotype is likely to be inconsistent across environments, so both genotypes and environments are important considerations in plant breeding. Therefore, the scheme used to validate the models in the present study considered both genotypes and crop/environment. The raw data was divided into four datasets (A, B, C, and D) (Table 4). Datasets A and B were derived from the 2nd ratoon, while C and D were derived from the 3rd ratoon. All models were trained using datasets A and C. Additionally, to get reliable results, twenty-one iterations were performed. For example, the 1st iteration; CP06-2400 and CP07-1824 were chosen as datasets B and D, while the other five cultivars were chosen as datasets A and C. Similarly, for the 21st interaction; we used HoCP04-838, and TCP93-4245 as dataset B and D, while the other five cultivars were chosen as dataset A and C. With this approach, accuracies were obtained from all possible combinations of datasets (Table 4). Five cross-validation schemes (CVs) were implemented as follows: tested cultivar in tested crop/environment (CV1), tested cultivar in untested crop/environment (CV2), untested cultivar in tested crop/environment for the 2nd ratoon (CV3), untested cultivar in tested crop/environment for the 3rd ratoon (CV4), and untested cultivar in untested crop/environment (CV5) (Figure 2). For validation, to have the consistency of sample size for model validation making it comparable to each other, forty percent of datasets A and C was used for CV1 and CV2 validation, while all data points of datasets B and D were used for the CV3, CV4, and CV5 schemes. As a result, there were 16 data points in the testing dataset for all CVs.
A linear regression (stepwise regression, lasso, and ridge) and non-linear regression (random forest) were adopted to establish the prediction model estimating Gs and Chl, using ten VIs as independent variables. Prediction accuracies (correlation coefficient; r and root mean square error; RMSE) were evaluated based on mean numeric values from those 21 iterations. Because the same set.seed number was used for different algorithms, as well as the sample size of the model validation, they are directly comparable. We used the lm function in RStudio to obtain the stepwise regression. The “randomForest” package was used to establish random forest while we used the “glmnet” package to obtain lasso and ridge regression using RStudio. All model establishments were performed using RStudio.

3. Results

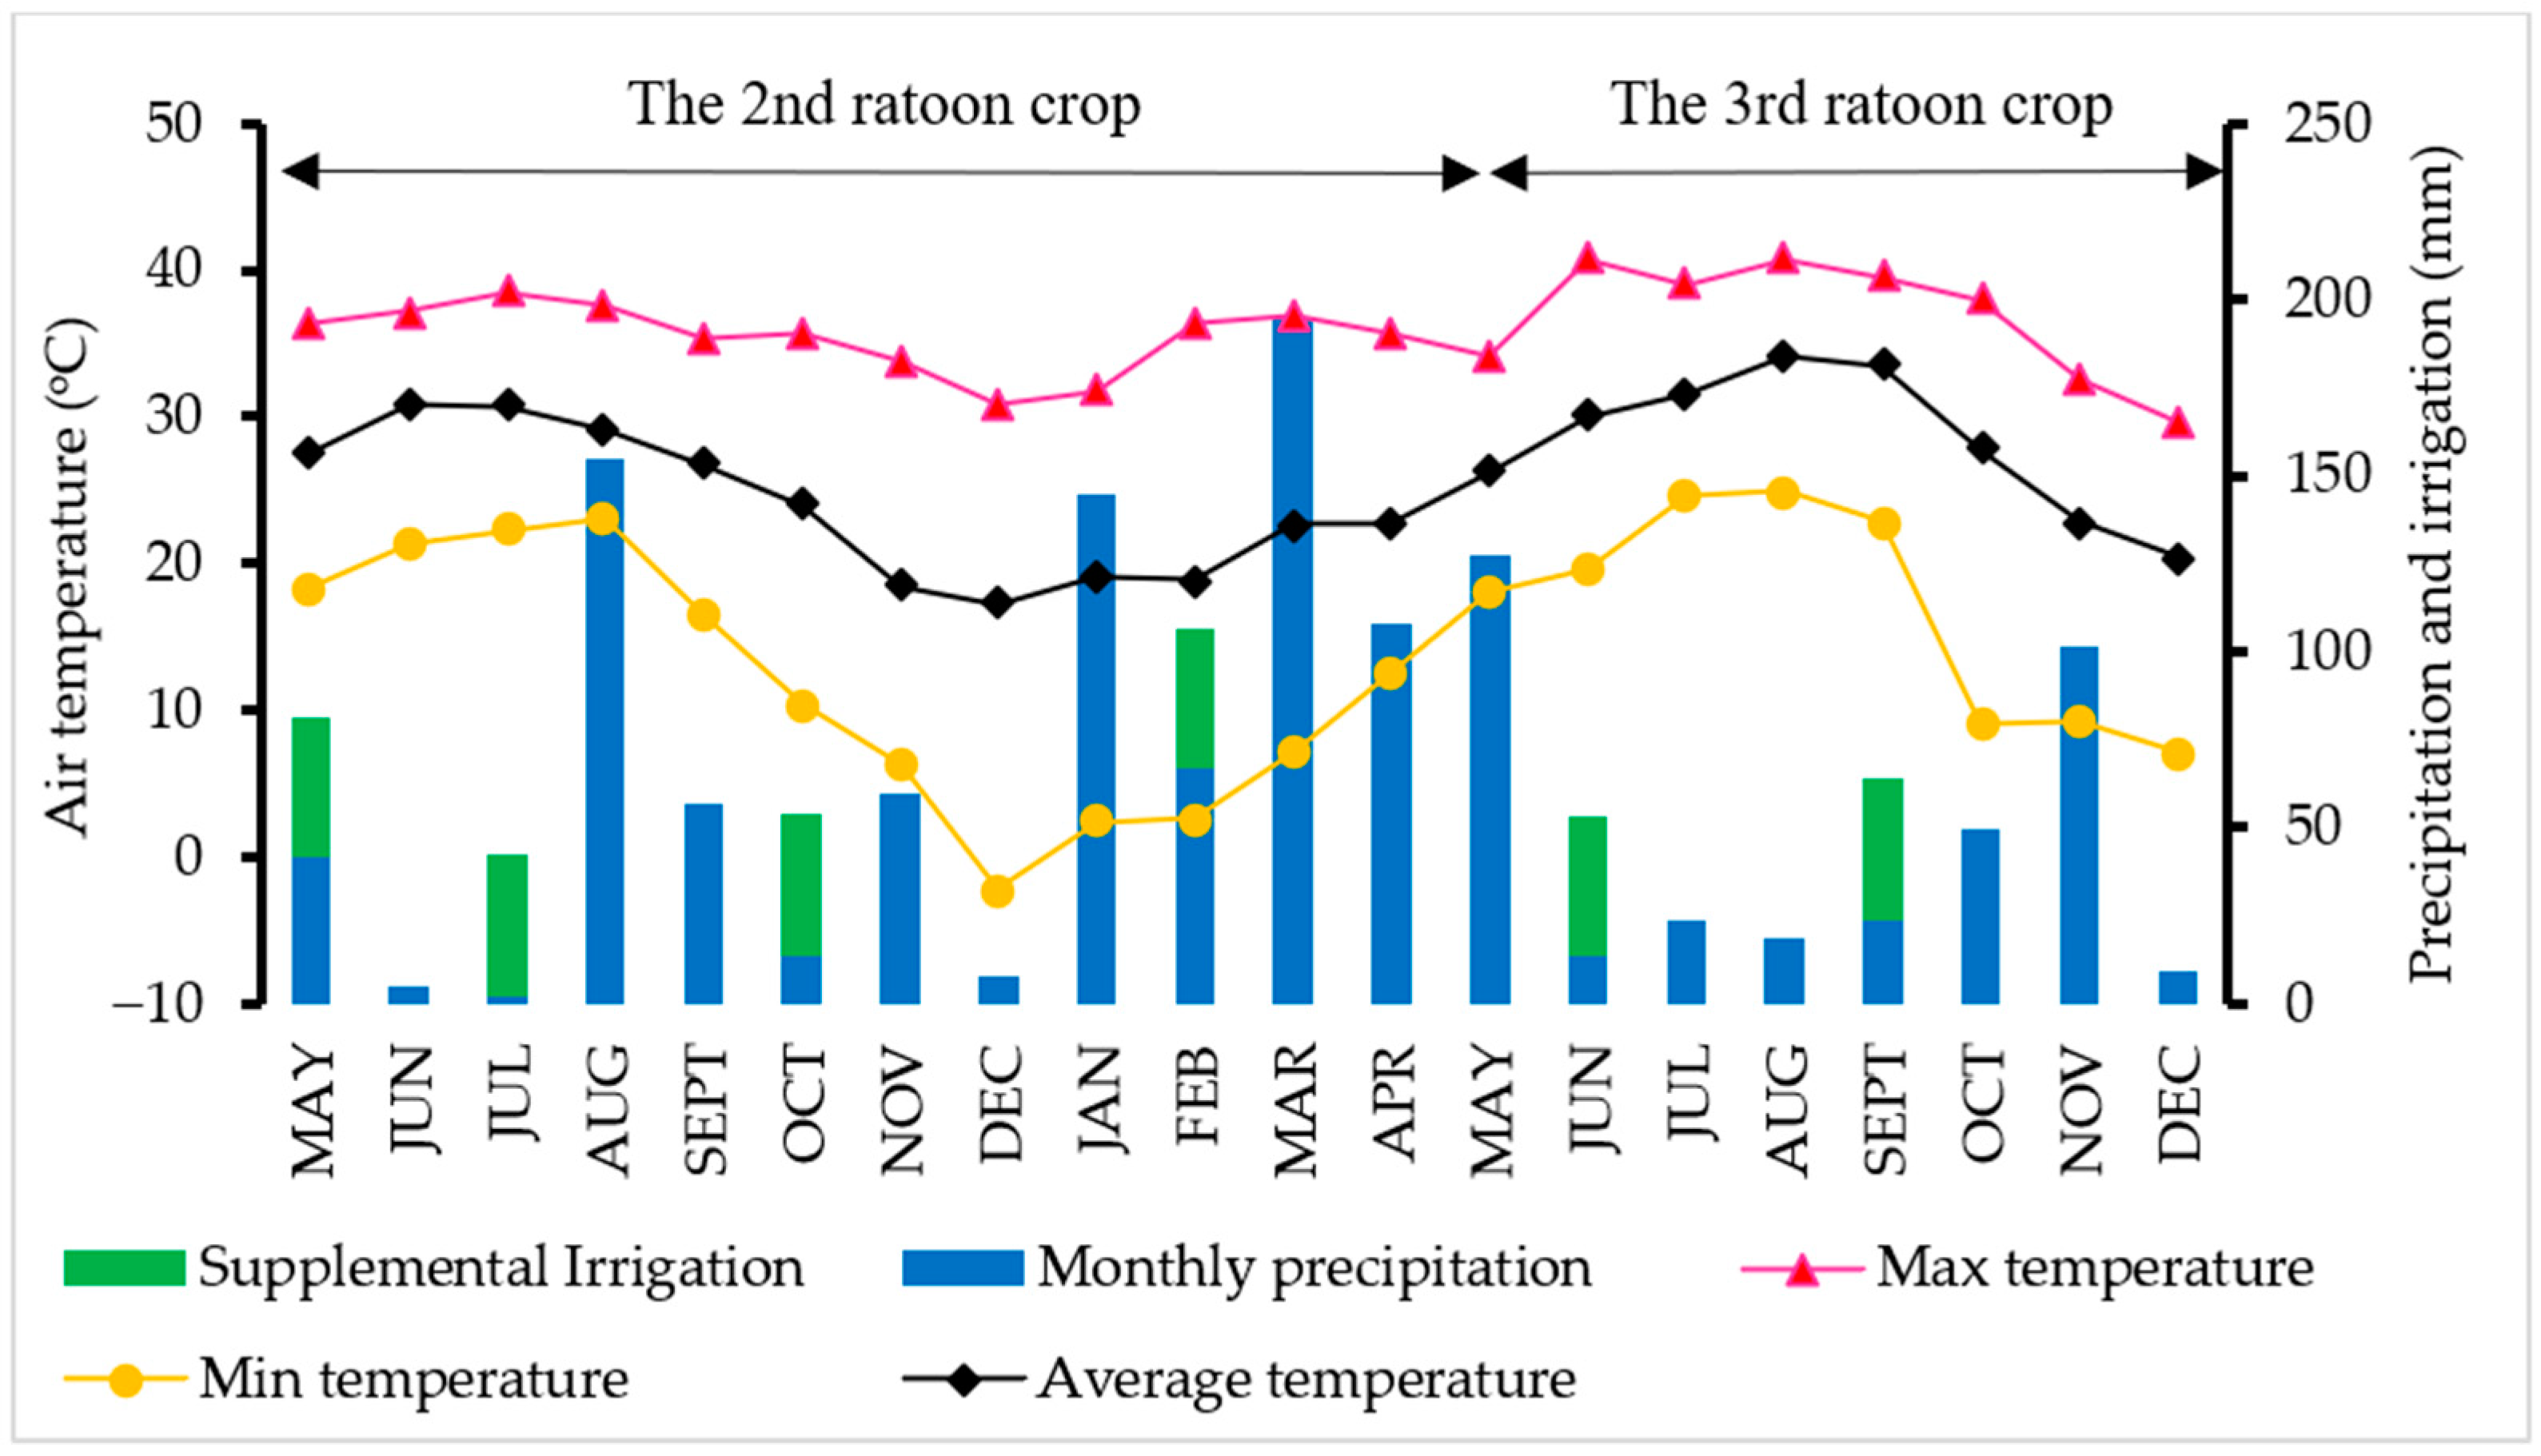
3.1. Soil Moisture and Weather Data across the Growing Season

Precipitation was recorded at 855.98 mm for the 2nd ratoon crop, while only 366.52 mm was received for the 3rd ratoon crop (Figure 3). This was because the 3rd ratoon crop was four months shorter than the twelve months of the 2nd ratoon crop. An early harvest was implemented at the 3rd ratoon crop to prevent data loss because of suspected ratoon stunting disease (RSD). However, the 3rd ratoon season was still dryer than the 2nd ratoon season. Considering rainfall plus irrigation, sugarcane received only 1015.98 and 446.52 mm during the 2nd and 3rd ratoon, respectively. At the 2nd ratoon crop, the cane encountered drought stress for three cycles. One cycle was recorded at the tillering stage, and the other two were observed at the elongation stage (Figure 4). Only one drought stress cycle was observed at the tillering stage for the 3rd ratoon crop because of the interruption of seasonal rain. Moreover, we observed symptoms of RSD at this ratoon, so early harvest was implemented to prevent data loss.

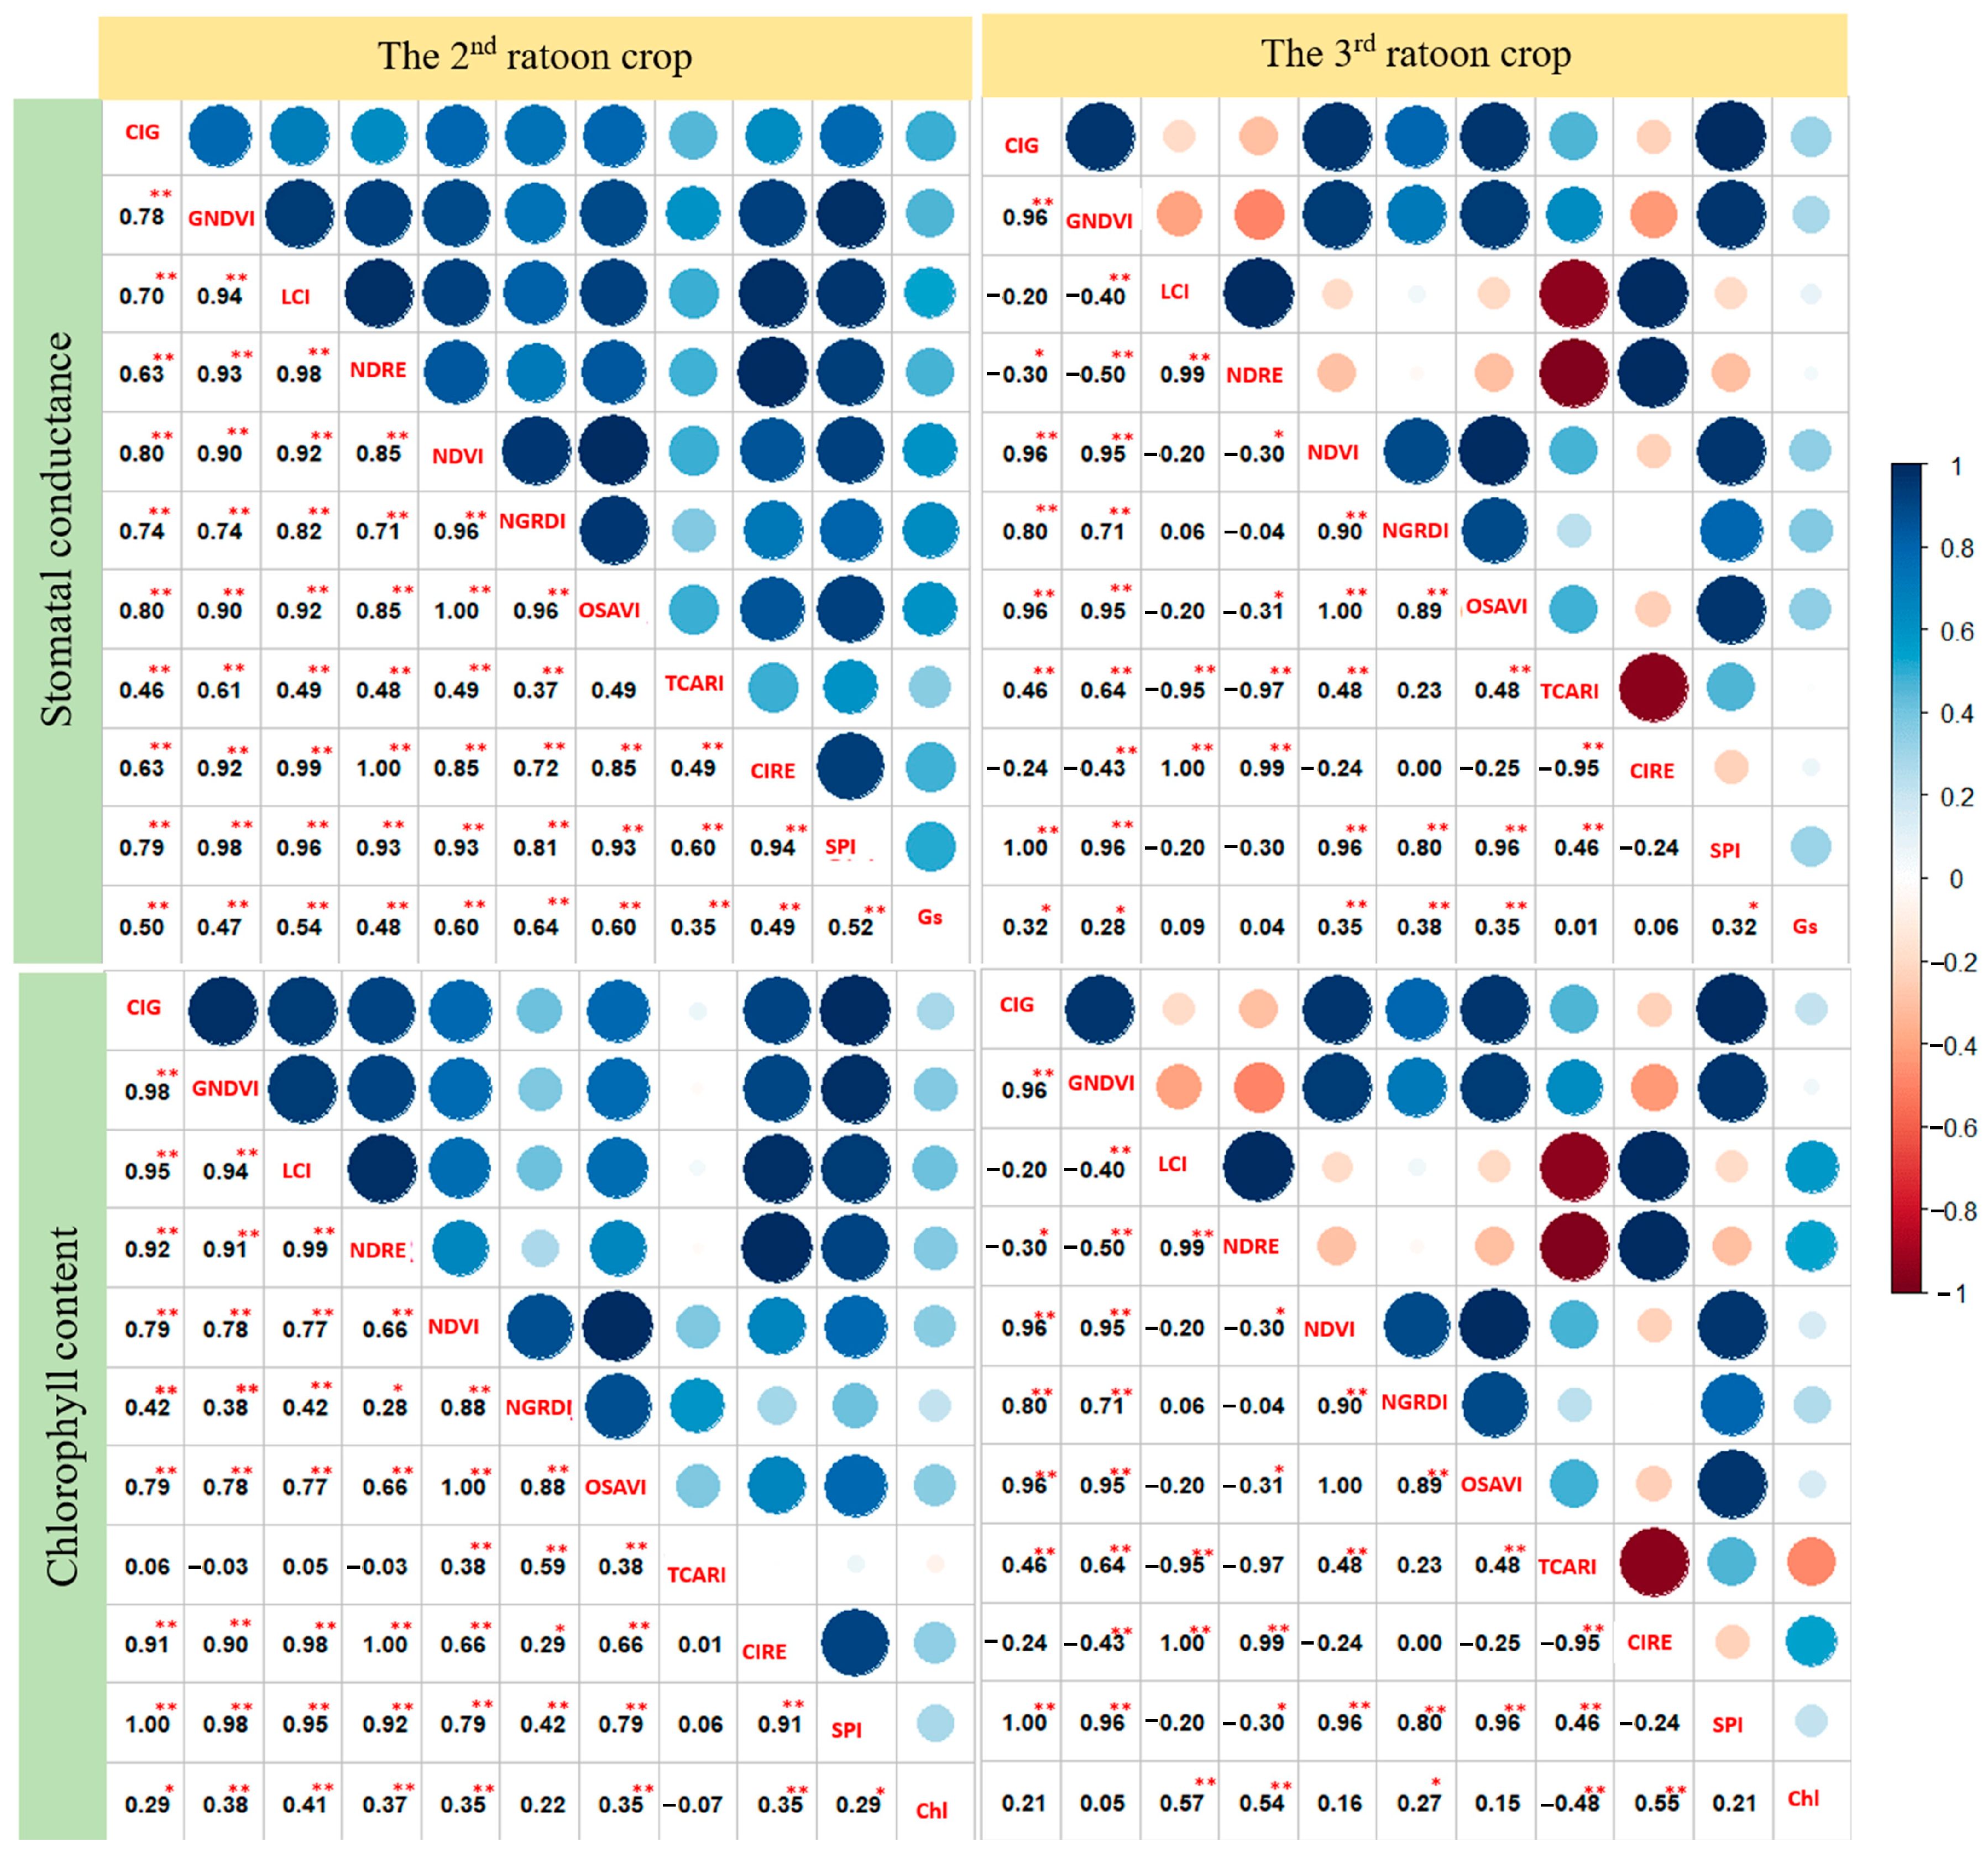
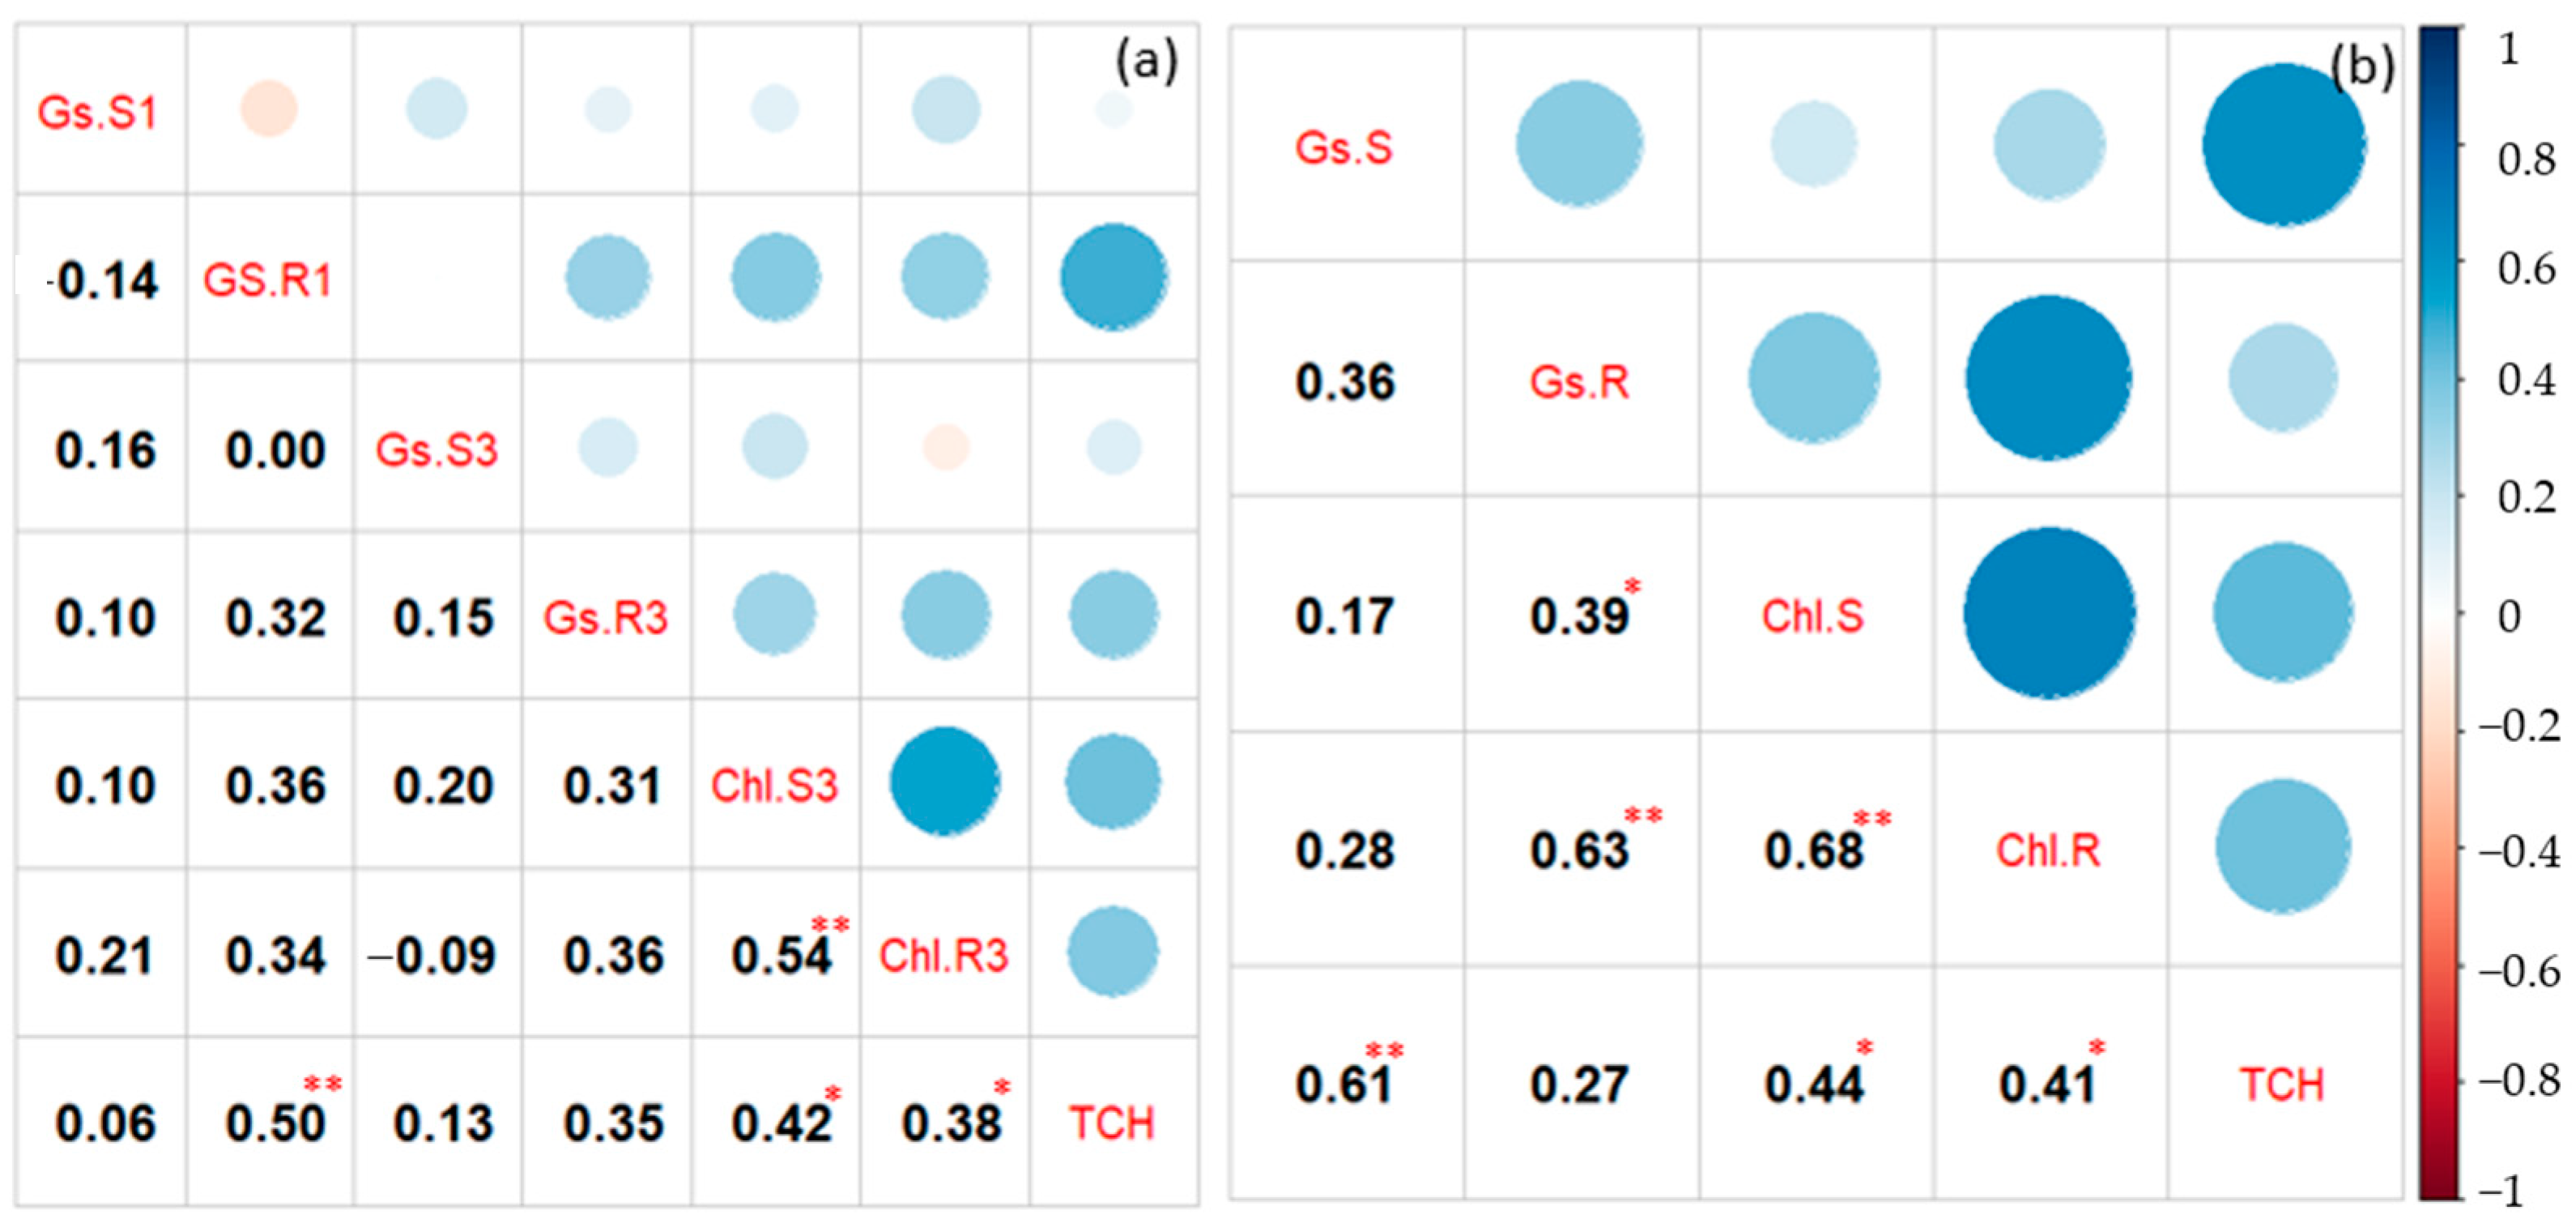
3.2. Analysis of Variance and Correlation among the Studied Traits

Analysis of variance showed significant differences among the studied cultivars for Gs under recovery at the 1st cycle and under stress at the 3rd cycle for the 2nd ratoon. Significant differences among the seven cultivars of Chl for both periods for the 3rd cycle were found at this ratoon. Overall, CP72-1210 and TCP93-4245 had the highest performance for Gs, as well as Chl for both periods at the 2nd ratoon crop (Table 5). In contrast, CP89-2143 and HoCP04-838 appeared to have the worst performance for those traits. At the 3rd ratoon crop, a significant difference among the seven cultivars was found for Gs during the recovery period, while that was found for Chl during the stress period. Overall, CP72-1210 and HoCP04-838 were found to have the best physiological performance, while Gs and Chl of CP06-2400 and CP83-2143 were the worst (Table 6).
Gs during the recovery period was significantly greater than stress for both cycles of stress at the 2nd ratoon crop (Figure 5). However, no significant difference was found between these two periods at the 3rd ratoon crop. Unexpectedly, Chl under stress was significantly greater than that of the recovery period at the 2nd ratoon crop, whereas the contrast result was observed at the 3rd ratoon crop.
The correlation between physiological traits with tons of cane per hectare (TCH) is shown in Figure 6. Gs was significantly correlated with TCH under the recovery period for the 2nd ratoon crop, and under stress for the 3rd ratoon crop. A consistently significant relationship between Chl with TCH was found for both periods and crops.
The relationship between VIs with Gs and Chl is shown in Figure 7. Correlation between VIs with Gs showed that all VIs were highly significantly correlated with Gs (p < 0.01) for the 2nd ratoon. Six out of ten VIs achieved a correlation coefficient above 0.50 in this ratoon. A poorer coefficient was found at the 3rd ratoon, as compared to those collected at the 2nd ratoon, and six out of ten VIs were found to be significantly related to Gs, and none achieved above 0.50 of correlation coefficient at this ratoon. The result shows that NDVI, NGRDI, and OSAVI had the highest coefficient with Gs for both ratoon crops. For Chl, eight out of ten were significantly correlated with Chl at the 2nd ratoon crop, while only five VIs were found to be related to Chl at the 3rd ratoon crop. Additionally, LCI, NDRE, and CIRE had the highest correlation coefficient with Chl for both crops, and only the TCARI index was negatively correlated with Chl for both crops.

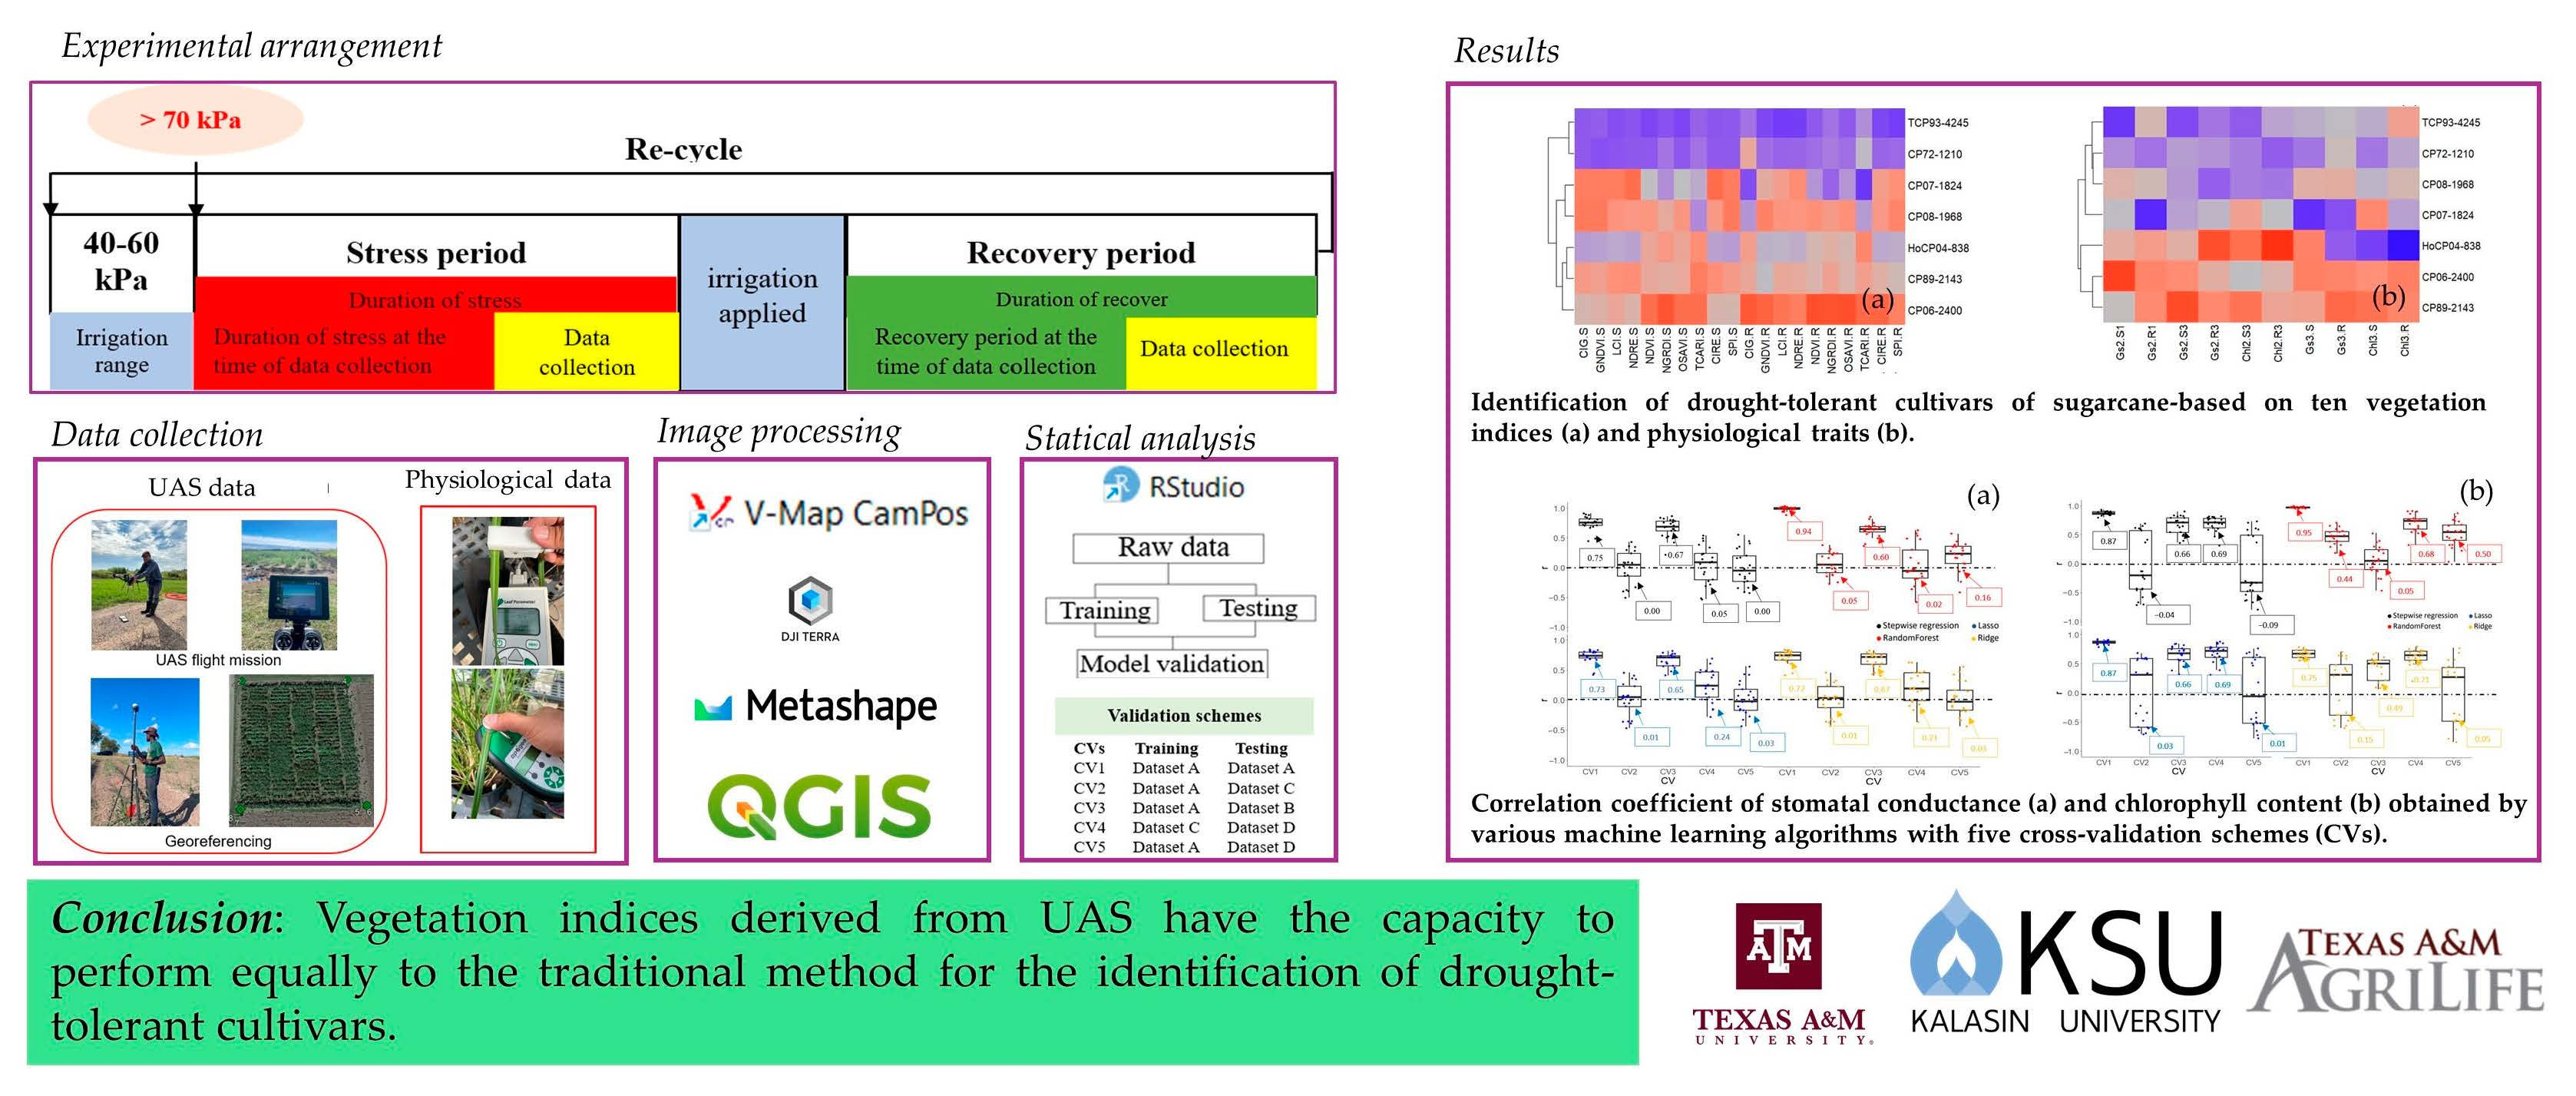
3.3. Identification of Drought-Tolerant Cultivar

3.3.1. Cultivar Ranking Based on the Performance of Vegetation Indices (VIs)

Overall, the identification of drought-tolerant cultivars based on genotype by trait biplot showed similar results to those derived from heatmap analysis. Genotypes appearing in a section with specific traits indicate good performance relative to those traits. Based on VIs, CP72-1210, and TCP93-4245 were classified as tolerant cultivars because most VIs were located in the same section with those cultivars, while CP08-1968 and CP07-1824 had a good performance for CIG and TCARI under the recovery period as they appeared in the same section. No VI appeared in the same section as CP06-2400 and CP89-2143, so they were classified as sensitive cultivars. A heatmap was generated based on the ten VIs captured under stress and recovery periods, and this map provides the relative performance of the seven sugarcane cultivars. A negative value shows poor performance of a given trait, whereas a good performance is represented by a positive value. Based on VIs, the heatmap shows that TCP93-4245 and CP72-1210 had an outstanding performance of VIs, whereas that of CP06-2400 and CP89-2143 was poor. Similar results were observed when physiological traits were used for identification (TCP93-4245 and CP72-1210 were classified as a tolerant cultivar, while CP06-2400 and CP89-2143 were classified as a sensitive cultivar) (Figure 8). More importantly, when all VIs, physiological traits, and TCH were used, the same result was obtained, confirming that TCP93-4245 and CP72-1210 were tolerant, while CP06-2400 and CP89-2143 were drought-sensitive cultivars.

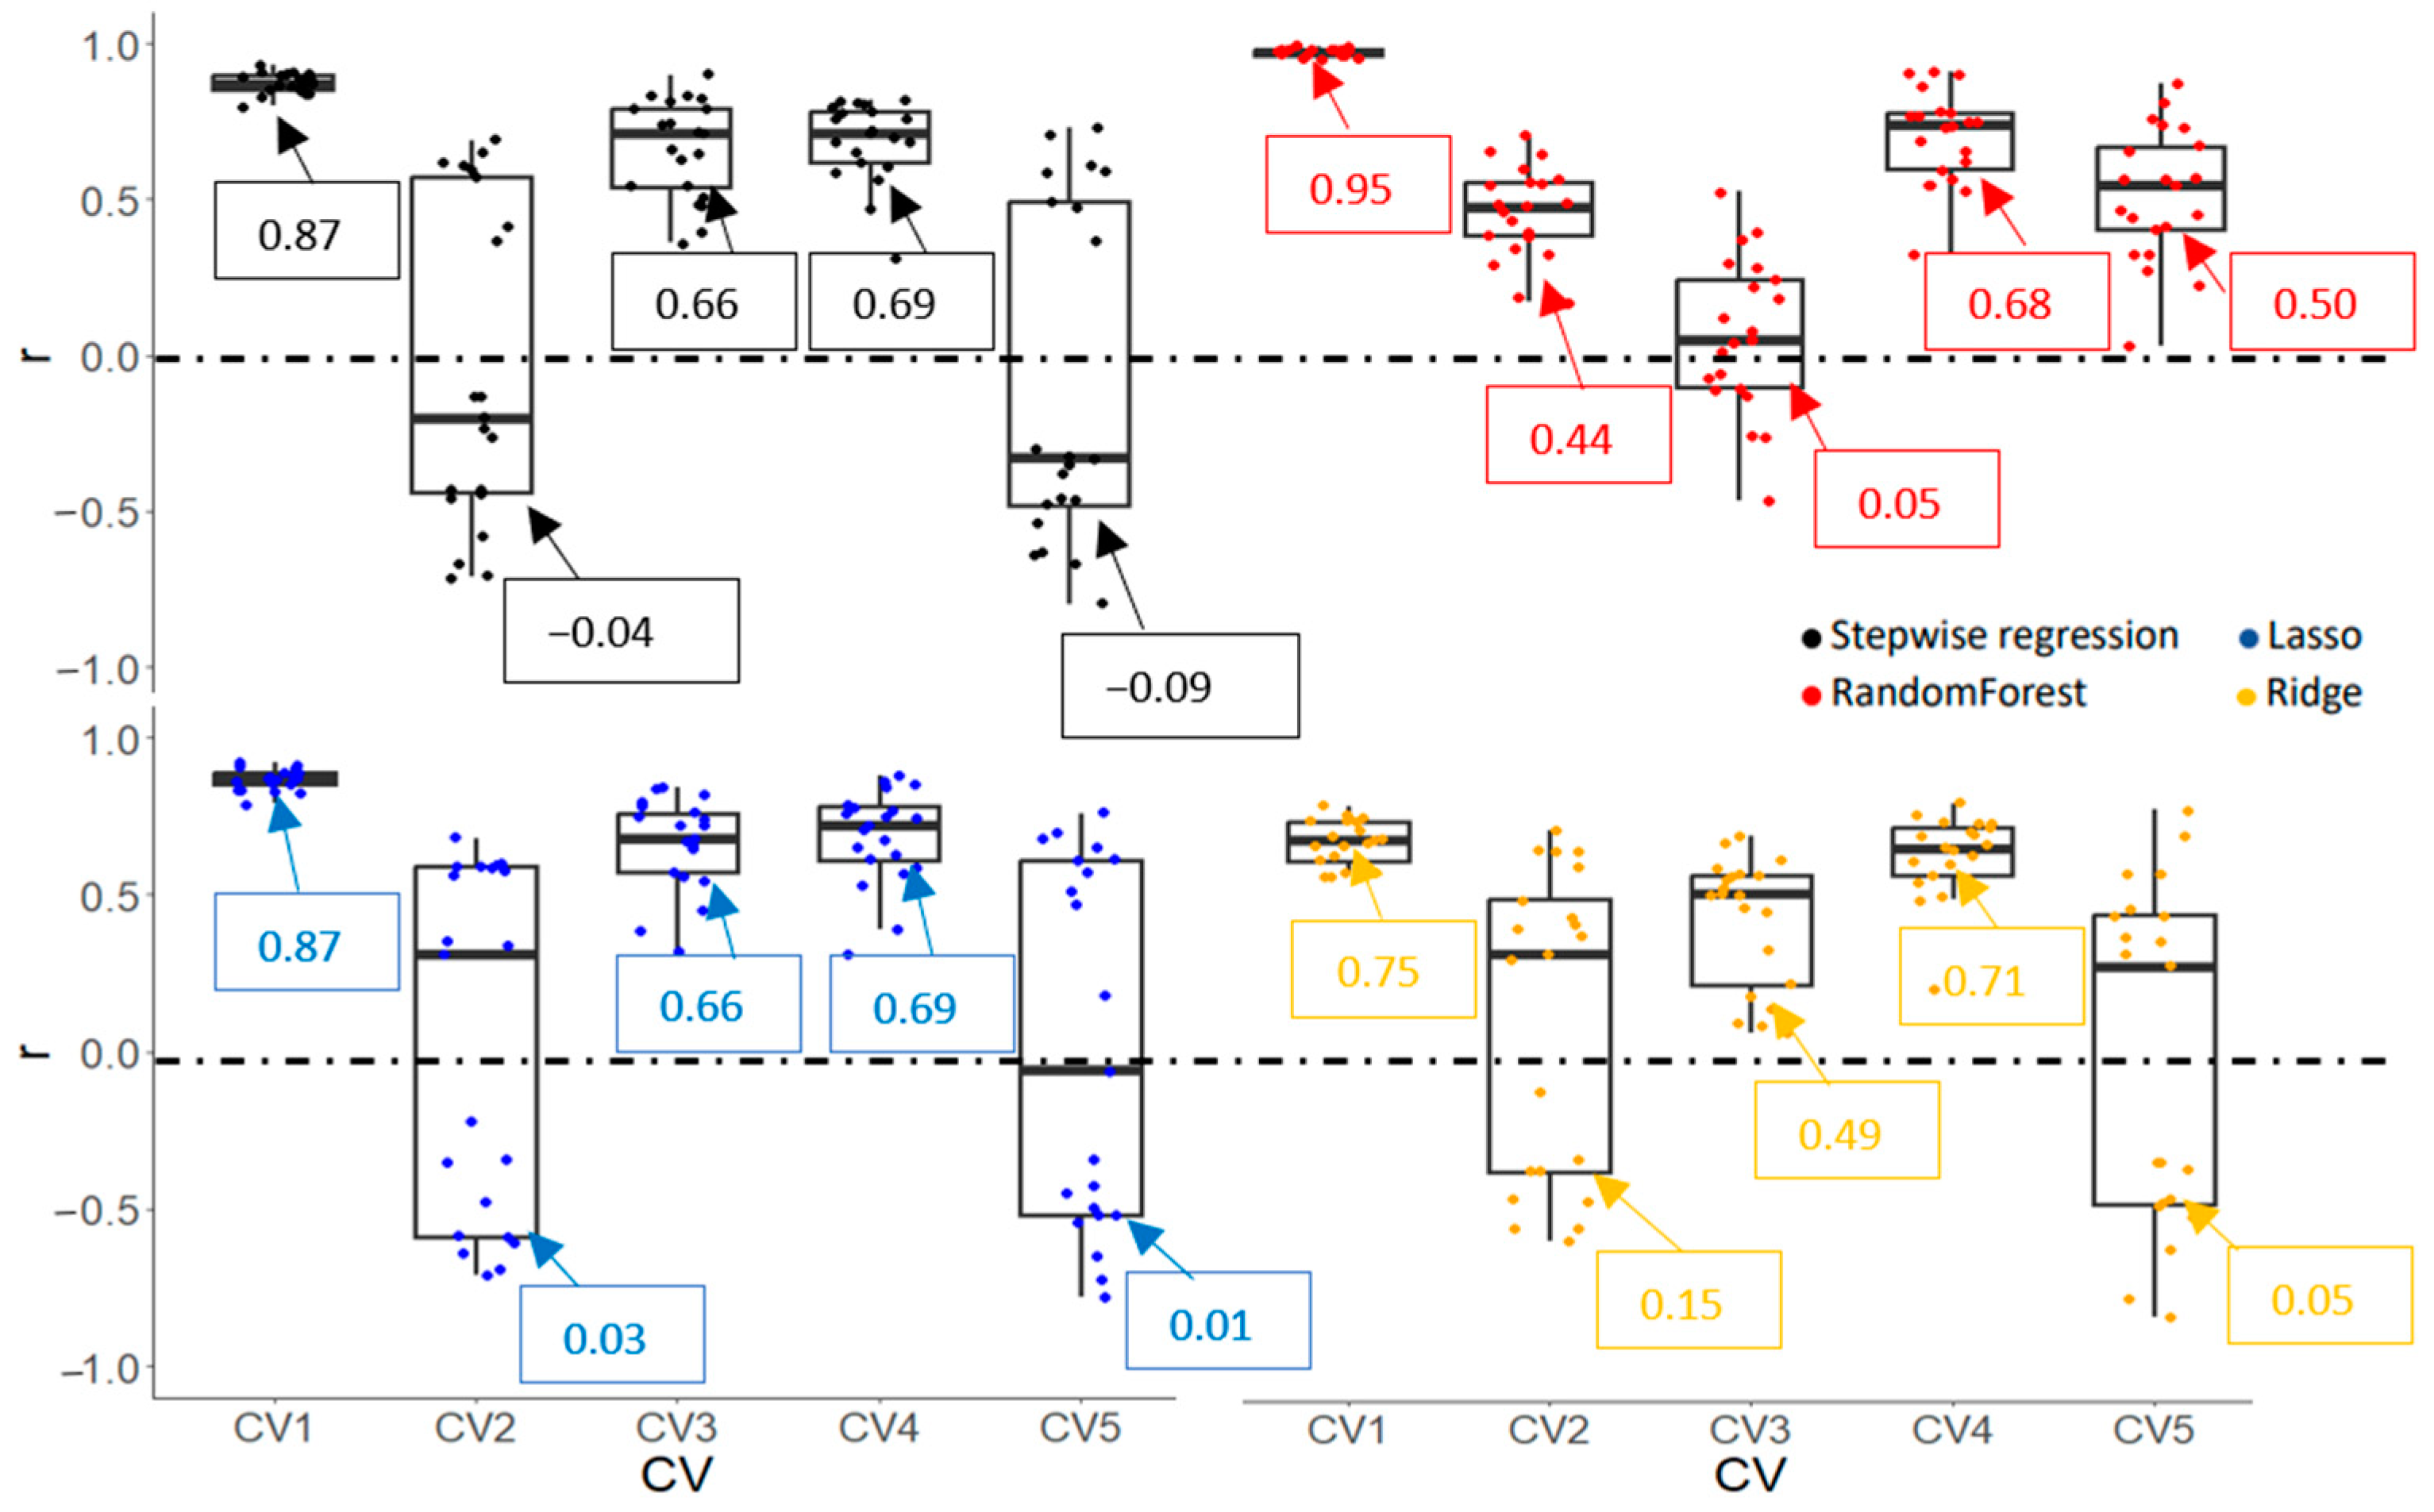
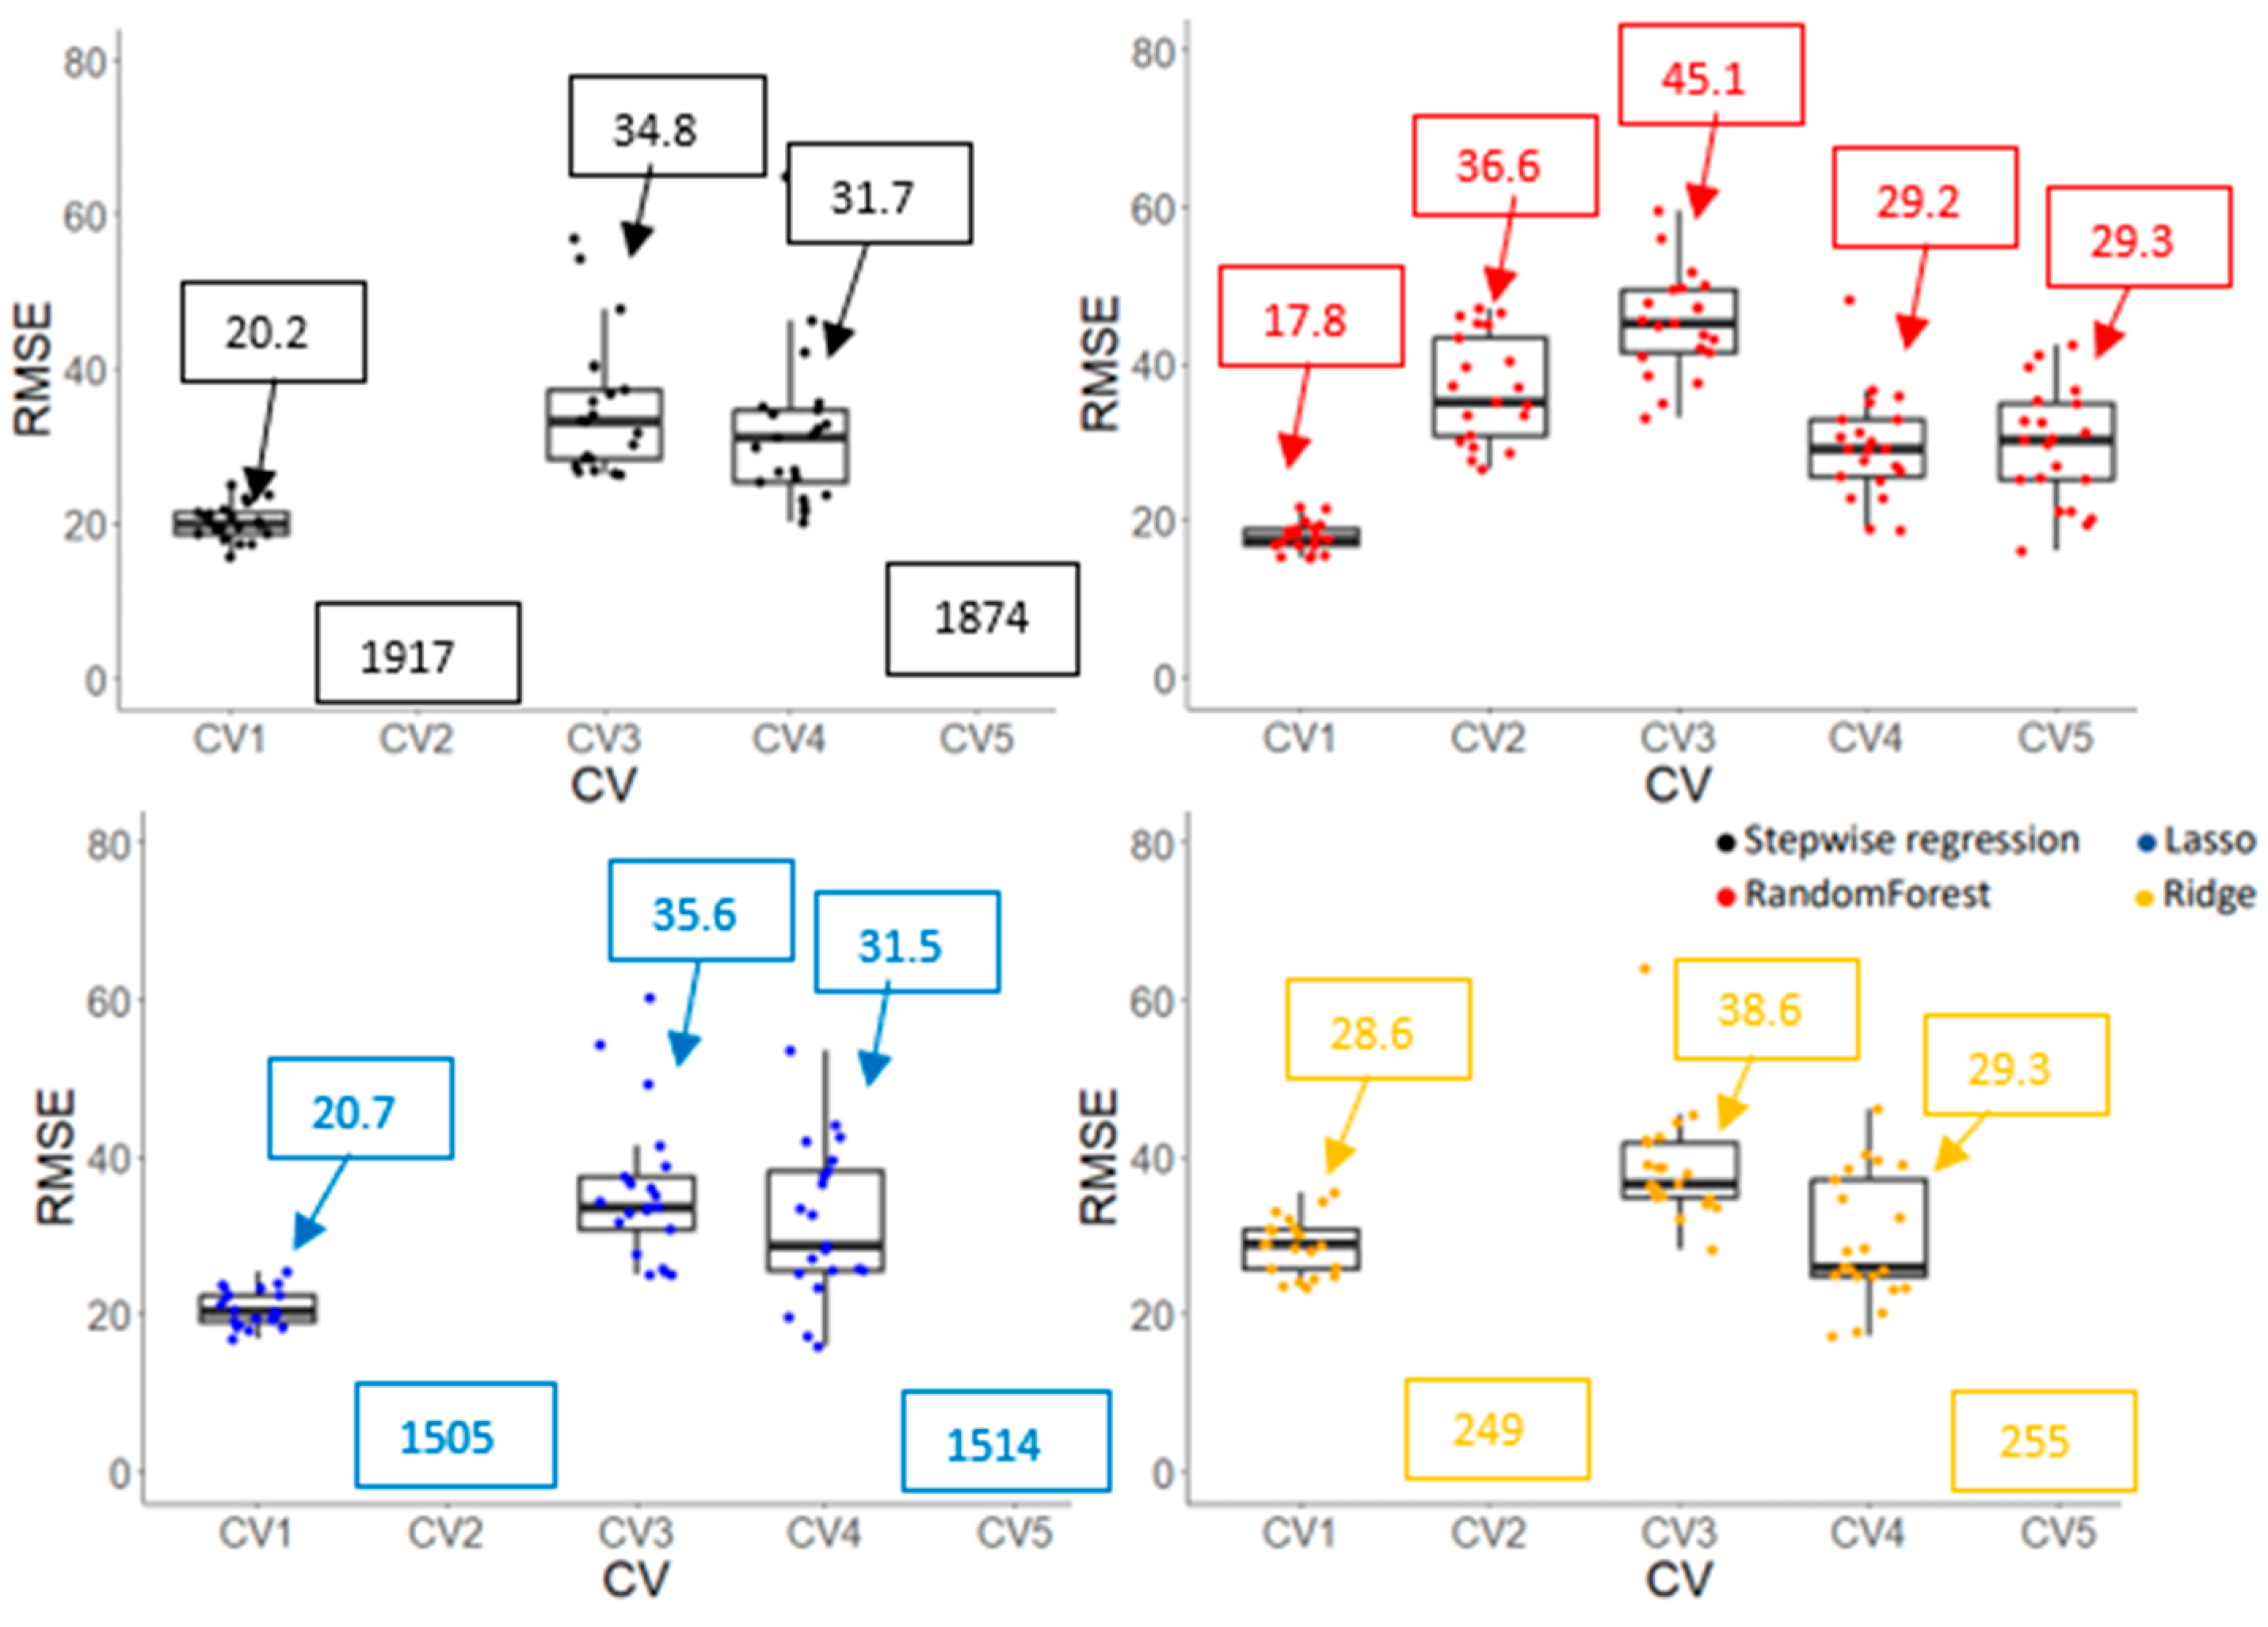
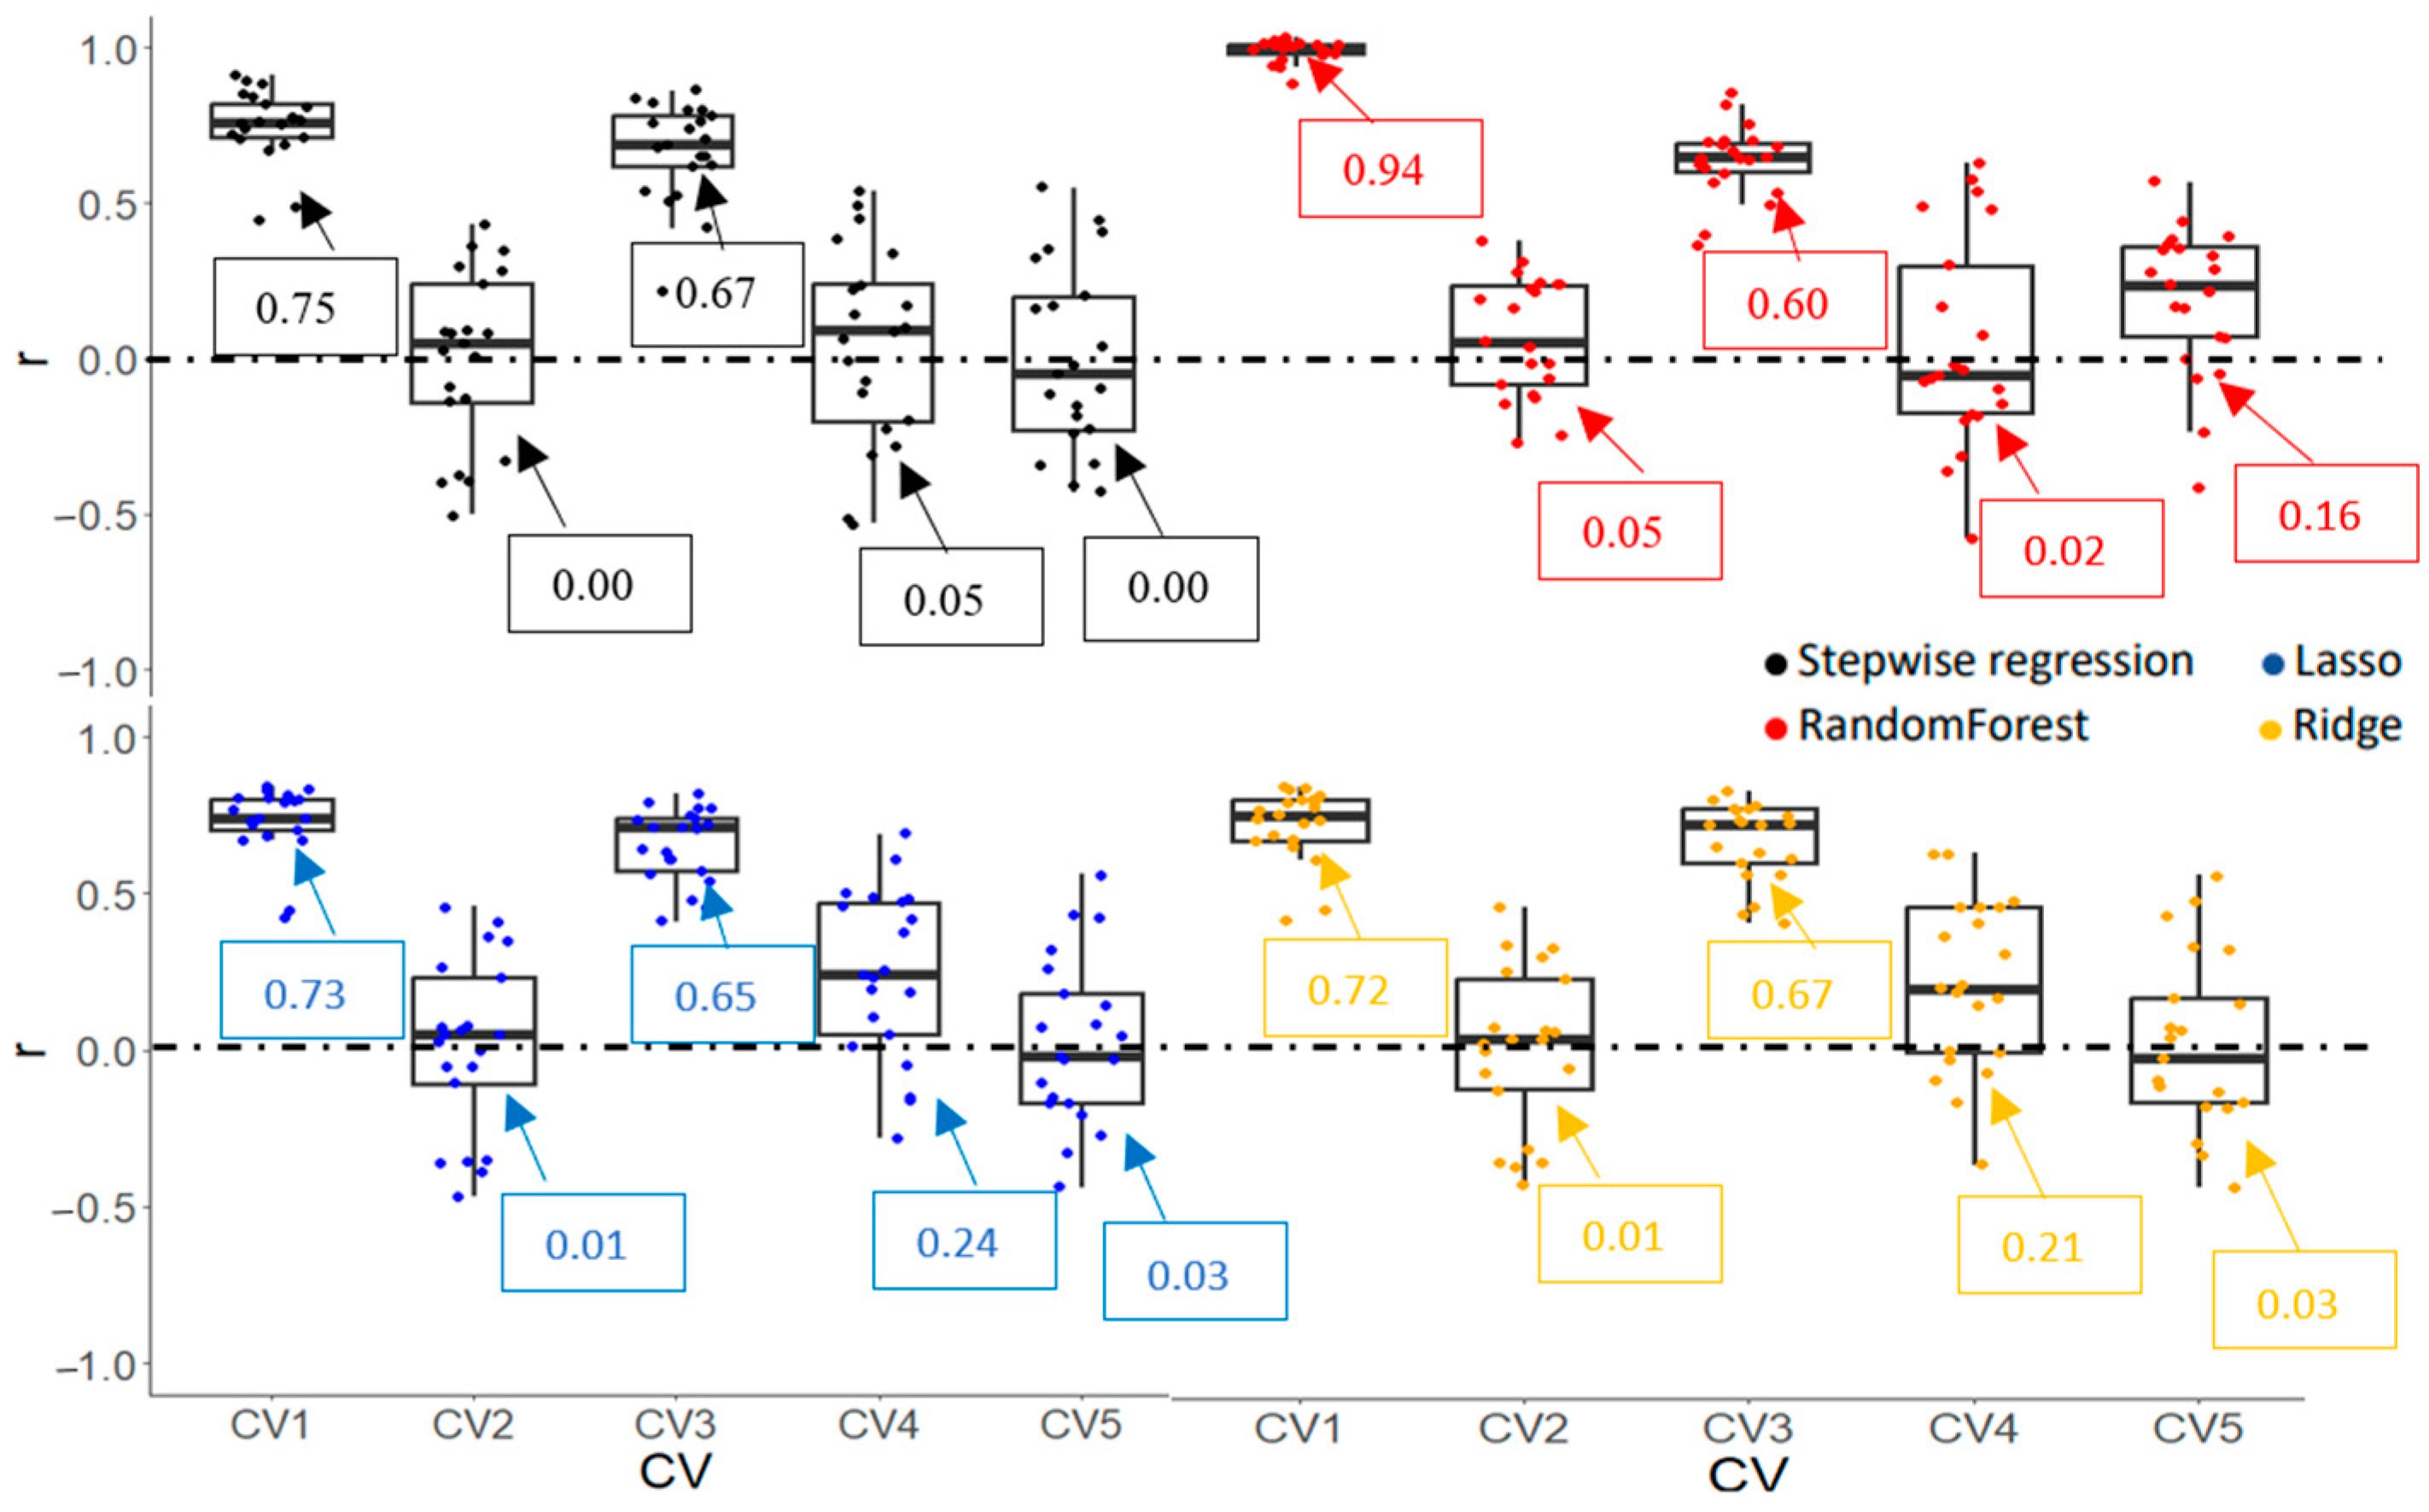
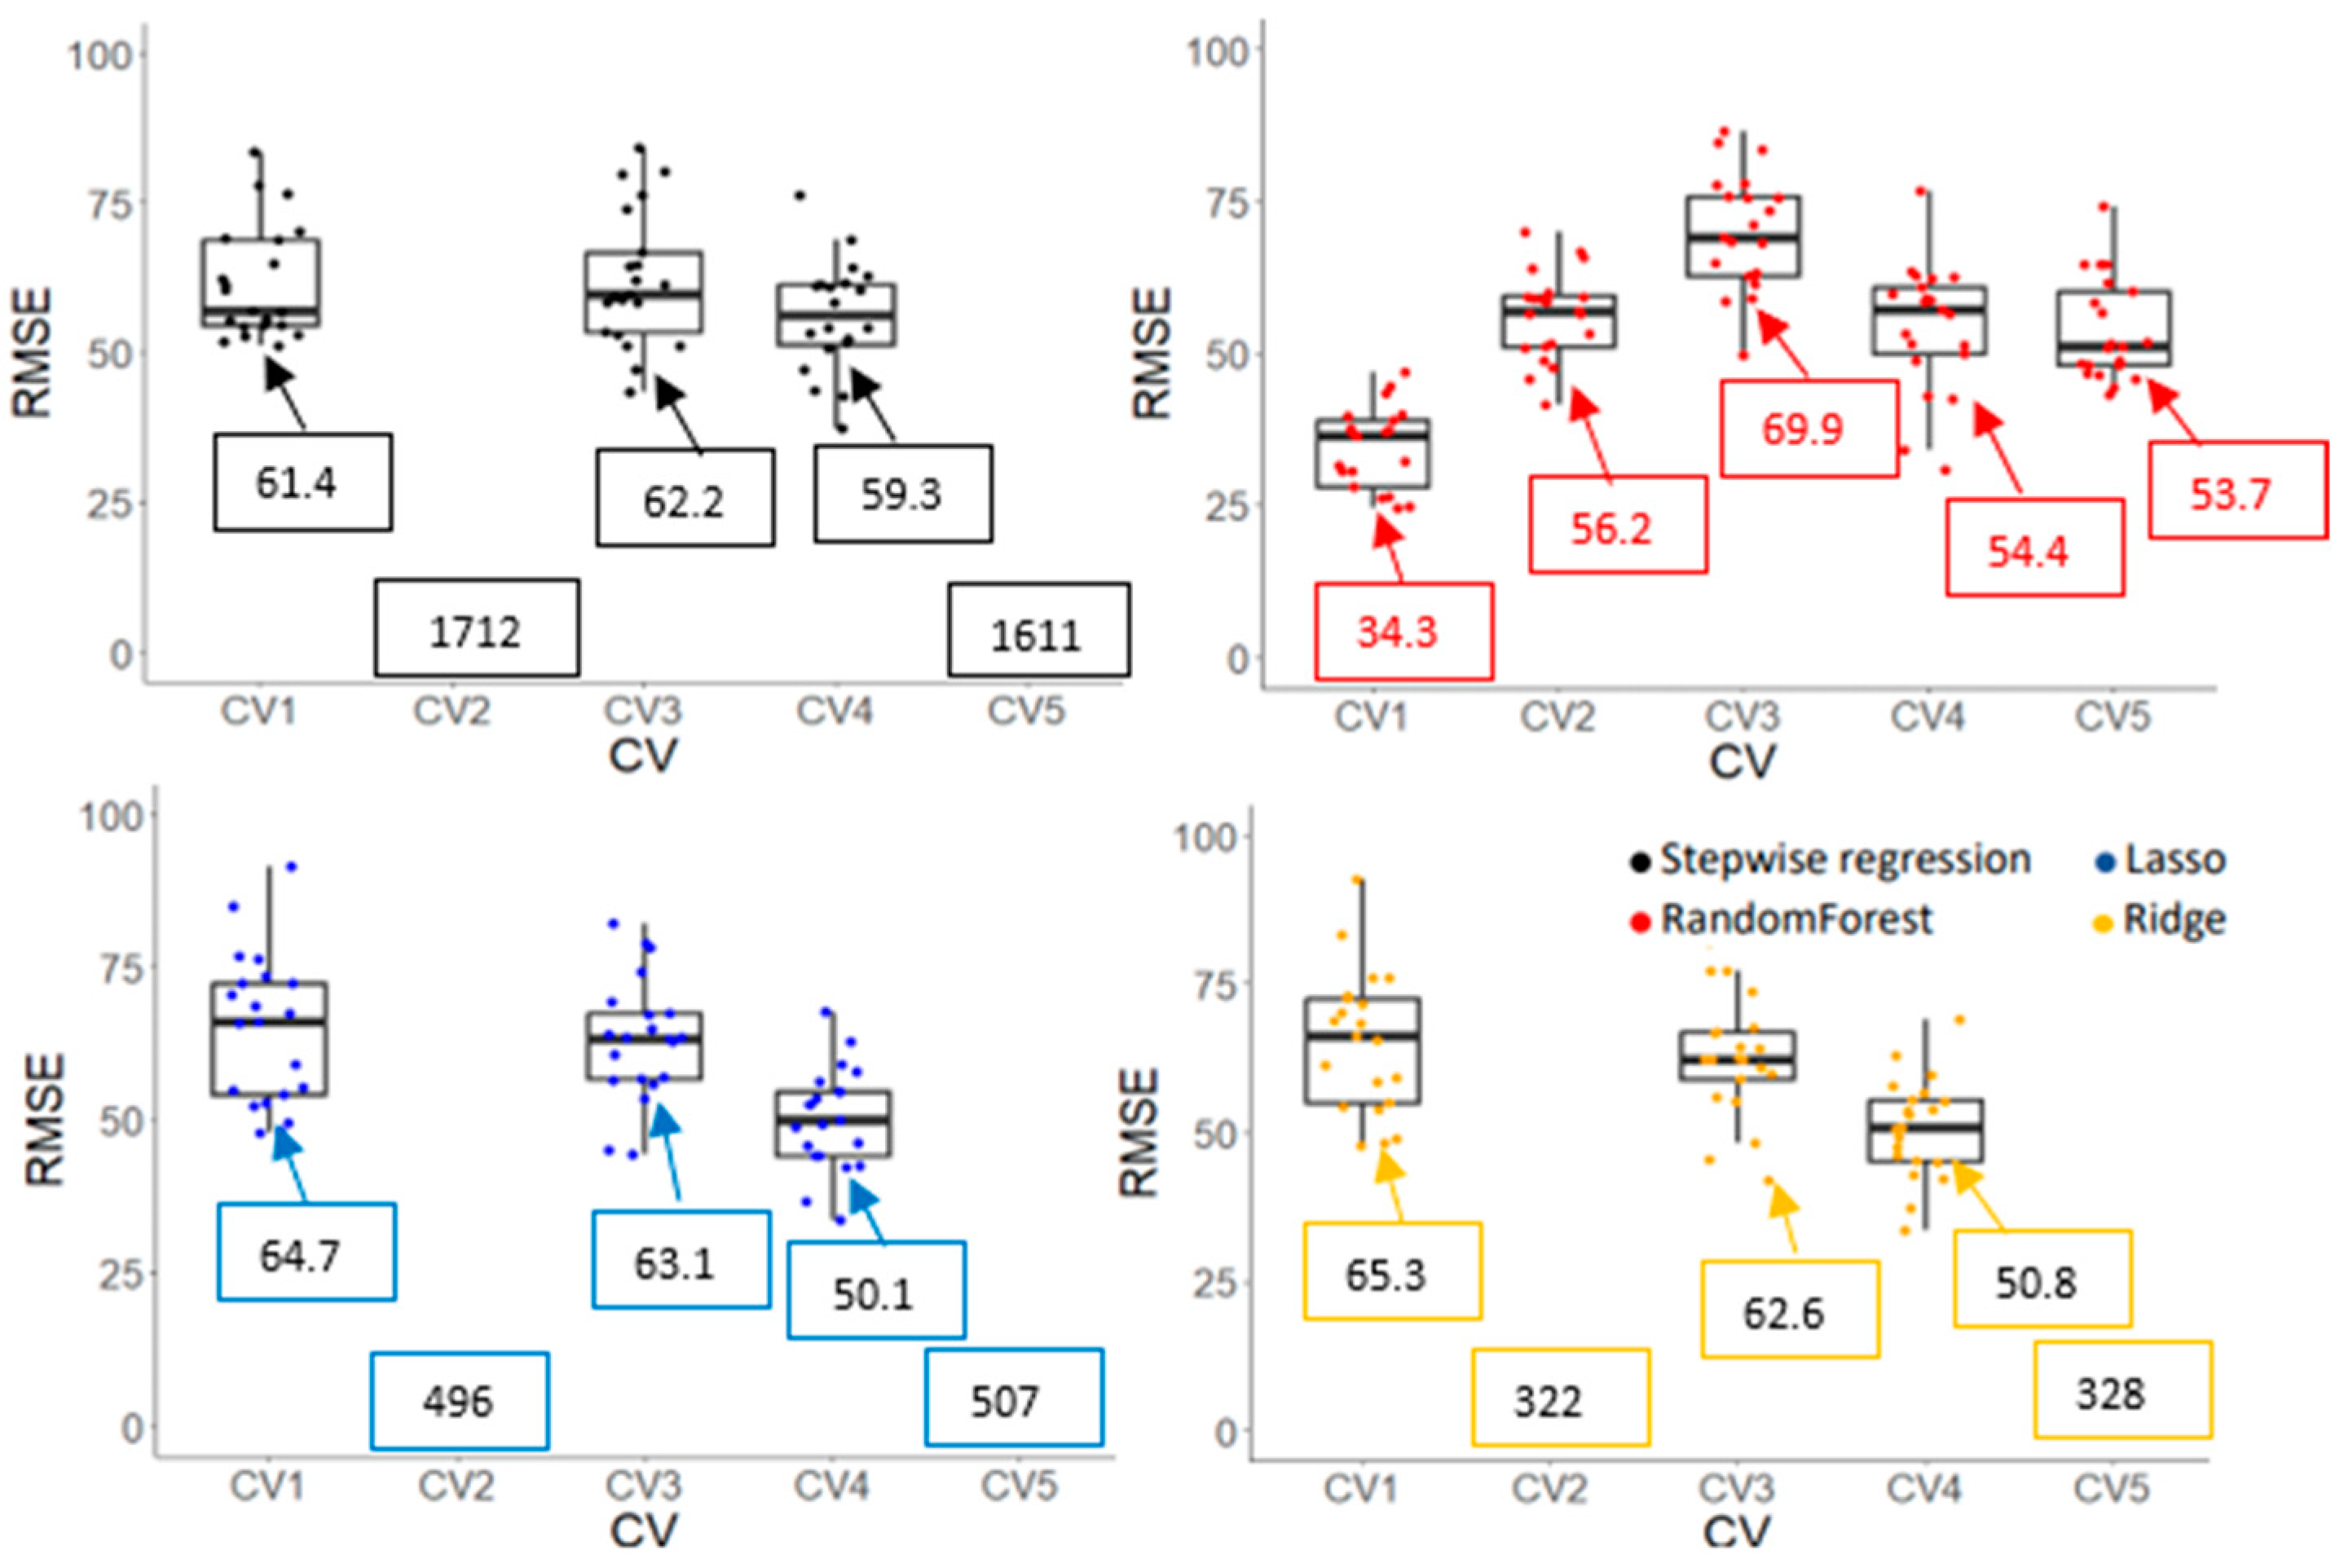
3.3.2. Model Accuracy and Cultivar Ranking Based on Predicted Values Derived from Prediction Models

Prediction accuracies (r and RMSE) of Gs and Chl obtained from various machine learning algorithms are shown in Figure 9, Figure 10, Figure 11 and Figure 12. CV1, a negative control, had the highest r and lowest RMSE due to overfitting for all algorithms and traits. For the Gs model, a stepwise regression was completely off when it was used to predict the performance of cultivars in an untested crop/environment with errors of 1712 and 1611 mmol m−2s−1 for CV2 and CV5, respectively. Similarly, the RMSE of penalized linear regressions (lasso and ridge) was also high in such scenarios with an error greater than 300 mmol m−2s−1. Only the random forest (a non-linear regression) had an acceptable RMSE when it was used in those scenarios, although its correlation coefficients were low (0.05 and 0.16). However, linear models (stepwise, lasso, and ridge) outperformed a non-linear model in the tested crop/environment (CV3 and CV4). Additionally, decent accuracies were observed in CV3 for all algorithms. Similar results were observed for the Chl model. An unreasonably high RMSE was observed when we used linear models to predict Chl in the untested crop/environment (CV2 and CV5) (Figure 12). Like the Gs model, only random forest (a non-linear model) seemed promising to be used in such scenarios as it had the highest r (0.44 and 0.50) and lowest RMSE (36.6 and 29.3 µmol m−2) for CV2 and CV5, respectively. However, it underperformed linear models when it was tested in the same crop/environment (CV3 and CV4). All models had higher accuracies when training and validation data were obtained in the same crop/environment.
Cultivars ranked based on measured and predicted values are shown in Table 7 and Table 8. Overall, at least two out of three were common cultivars that fell under the top-three ranking based on both measured and predicted values for both Gs and Chl and under both periods. Under stress period, TCP93-4245 and CP72-1210 fell into the top three—three cultivars ranking based on measured values for both Gs and Chl and for both ratoon crops. This result agreed with those derived from the top-three ranking based on predicted values, although TCP93-4245 was not included in the ranking for Gs at the 3rd cycle of the 2nd ratoon crop (Table 7). Under the recovery period, TCP93-4245 and CP72-1210 appeared at the top-three ranking based on measured values for both Gs and Chl at the 2nd ratoon. Similar results were observed when cultivars ranked based on predicted values, although TCP93-4245 was not included in the ranking for Gs at the 3rd cycle (Table 8). Based on the prediction model, TCP93-4245 and CP72-1210 were the most frequent cultivars in the top-three ranking, and this result was in accordance with identification based on VIs performance.

4. Discussion

4.1. Soil Moisture and Weather Data across the Growing Season

Precipitation and soil moisture data are important to determine whether sugarcane is under drought. Drought incidents were observed for the studied years with rainfall of 855.98 and 366.52 mm, for the 2nd (12 months) and 3rd (8 months) ratoon crops, respectively. Sugarcane received water from rainfall combined with supplemental irrigation recorded only 1015.98 and 446.52 mm for the 2nd and the 3rd ratoon, respectively, in which they were lower than the water requirement of 1500 to 2000 mm per season [46], confirming that sugarcane in this study had been under drought stress. As sugarcane is most sensitive to water-deficit stress during tillering and elongation stages [32], all four drought cycles imposed in this study were at those stages (two cycles per each stage). The 3rd ratoon crop experienced drought more severe and longer than the 2nd ratoon crop (Figure 3 and Figure 4), regardless of the number of cycles. Duration of stress varied from cycle to cycle due to an interruption of rain, and availability of irrigation resources. Because of this, we were not able to keep it consistent.

4.2. Analysis of Variance and Correlation among the Studied Traits

Physiological traits such as Gs and Chl have been suggested as potential selection criteria in sugarcane breeding programs for abiotic stress [12,44,47]. Although the number of cultivars used in the experiment was small, differences among them for Gs and Chl were observed, indicating that variation in those traits existed for this germplasm. Overall, CP72-1210 and TCP93-4245 were outstanding for both periods (stress and recovery) as well as both traits, whereas CP06-2400 and CP89-2143 were on the opposite side. After drought relief, stomata were open with a higher conductance under-recovery (Figure 5). The same result was observed in rice reported by Dien et al. [48]. Most cultivars had higher Gs after drought relief, compared to those under stress, but no difference between stress and recovery of Gs for TCP93-4245 was observed for both ratoons. Our hypothesis is that mild to moderate drought stress (6 to 27 days at the time of data collection) imposed in this study was not severe enough to trigger the stomata closing mechanisms of that cultivar, being drought tolerant. Surprisingly, a Chl reduction was observed during the recovery period at the 2nd ratoon crop (Figure 5). This was because sugarcane was entering a maturity phase when the assessment during recovery was being performed, in which chlorophyll breakdown was ongoing due to leaf senescence. Correlations of Gs with TCH were variable ranging from 0.06 to 0.61 (Figure 6). Our results were in accordance with Basnayake et al. [44], who found a correlation among these traits ranging from −0.29 to 0.94 in sugarcane, depending on the date of assessment. Similarly, correlations between Gs and sugarcane yield, ranging from 0.06 to 0.91 in well-water, and −0.81 to 0.77 in water deficit were recently reported by Hoffman et al. [18]. In addition, positive correlations between Gs and yield have been observed in other crops such as rice [49], wheat [50,51], and cotton [50]. However, positive correlations of Chl with TCH were consistent across periods (stress and recovery) and ratoon crops. Comparable findings were observed in sugarcane [52] and in other crops such as wheat [53] and rice [54]. Maintaining high Gs and retaining Chl are indicators of drought-tolerant genotypes [55] because crop biomass and yield depend upon CO2 assimilation and photosynthesis [49].
On average, lower correlations between VIs with Gs and Chl were observed in the 3rd ratoon crop, where drought stress was more severe and prolonged, compared to those in the 2nd ratoon crop, indicating higher correlations between those traits were observed when they were measured under mild to moderate drought stress, rather than severe condition. This observation provides a lead for further investigations. NDVI, NGRDI, and OSAVI had the greatest correlation coefficient with Gs for both ratoon crops. This result was similar to those reported by Zhang et al. [17] who found that NDVI and OSAVI had the consistently highest correlation with Gs among eight VIs in maize for both studied years. The formulas of those three VIs have a red band in common. The literature review that supports this observation is that the red-light response is considered the primary mechanism linking stomatal behavior with mesophyll demands for CO2 [56]. In the same way, the promising VIs that showed the highest correlation with Chl for both crops were LCI, NDRE, and CIRE. In addition, NIR and red edge were common bands in their formulas. Red edge has been found to be highly related to Chl by many reports [34,57,58].

4.3. Identification of Drought-Tolerant Cultivar

Traditional plant phenotyping becomes a bottleneck in plant breeding due to its labor-intensive, and time-consuming nature. In this study, we utilized the VIs as indicators to identify drought-tolerant cultivars, compared to the traditional hand-held method, aiming to investigate if the traditional method could be replaced by the VIs. Additionally, genotype by traits biplot and heat map analyses were used as a statistical tool for identification. Biplot is an appropriate tool for identifying cultivars and traits interaction, where cultivars are considered as lines and traits as testers [59], while the Heatmap analysis provides the relative performance of the cultivars [20] as well as the ranking of cultivars based on their performance. A potentially important finding of this study was the fact that when the traditional method and VIs were used for the identification of drought-tolerant cultivars, similar results were observed (Figure 8), indicating its potential for a replacement of the traditional method. Even though many studies have reported the use of physiological [12,47,60] and VIs parameters [15,19] for identifying drought-tolerant genotypes, very few studies have compared the efficiency of these two criteria in such identification. Recent research reported by Wen et al. [20] was in accordance with our study in which they found that using VIs for identifying drought-tolerant genotypes of wheat provided similar results, compared to the yield-based drought tolerance indices criteria. Elfanah et al. [61] used hyperspectral reflectance, along with agro-physiological traits for the identification of salt-tolerant wheat genotypes, but their objectives were not to compare the efficiency among these two criteria. Our results confirmed the recent findings by Wen et al. [20], indicating the potential of VIs to be used as an alternative, inexpensive, and high throughput assessment in screening drought-tolerant cultivars. Additionally, TCP93-4245 and CP72-1210 were identified as drought-tolerant cultivars, whereas CP89-2143 and CP06-2400 were identified as drought-sensitive cultivars, according to heatmap and biplot analyses. As expected, cultivars with good performances under stress also resulted in decent performances during the recovery period and vice versa.
Gs and Chl prediction models have been successfully reported in the literature [17,21], but no validation scheme designed especially for plant breeding applications has been reported where not only genotypes but also crop/environment, are considered. In this study, we designed validation, especially for the plant breeding context. Based on r and RMSE, linear models (stepwise, lasso, and ridge) outperformed non-linear for both the Gs and Chl models in a situation where training and validation datasets were obtained from the same crop/environment. However, that was not the case when those datasets were derived from different crops/environments (CV2 and CV5). In such a scenario, random forest showed the highest accuracy among those algorithms. This result was in accordance with our previous findings in yield predictions [62]. Therefore, when it comes to using the prediction model applied to a new environment (untested), a random forest would be recommended. On average, all models performed better when they were applied in a tested crop/environment (CV3 and CV4) compared to those in an untested crop/environment (CV2 and CV5). Similar results were reported by Adak et al. [45] and Khuimphukhieo et al. [62]. This result supported the previous findings by Adak et al. [63] who suggested that the most challenging scenario is predicting the performance of genotypes under untested genotypes in untested environments (CV5).
When it comes to selecting genotypes for the further stage of plant breeding, genotype ranking of target traits is the ultimate consideration for such selection. Therefore, the cultivars were ranked based on measured and predicted values. Overall, the prediction model was able to differentiate the cultivars with good performance from those with poor performance, as the results based on measured values, in relation to predicted values, were roughly comparable. At least two out of three cultivars (66.7%) were common in the top-three ranking for Gs and Chl based on measured and predicted values. Moreover, all cultivars were common in the rankings for those traits under stress at the 3rd ratoon. This indicates the potential to predict Gs and Chl of sugarcane using VIs derived from UAS for genotype selection.
The result of this study showed that both identification methods (VIs performance and prediction model) are applicable for identifying drought-tolerant cultivars. Considering identification based on a prediction model, traditional phenotyping is still needed to obtain a reliable model because this method relies on the association between independent variables with target traits and the reliability of a prediction model, where a large number of the training datasets (ground truth data) is required to obtain such a model. In contrast, with identification based on VIs performance, traditional phenotyping may not be necessary as the selection is solely made on VIs itself.

4.4. Limitations and Future Investigations

The inconsistent result of a prediction model is always challenging (Figure 9, Figure 10, Figure 11 and Figure 12), and this is because plant phenotypes are complex and governed by multiple genes, environments, and their interaction. Additionally, there were possibilities in which prediction models could mislead plant breeders in the wrong direction (Table 7 and Table 8). For the identification based on VIs, this approach might not be useful in a situation where there is very little variation of VIs among the studied genotypes. This situation is likely to happen when siblings and offspring, which are genetically similar, are screened.
Further investigation is needed to evaluate if the results of the present study could be replicable in the early stage of genotype selection, where more diverse genotypes are tested. Additionally, the proposed approach should be validated in multiple locations to see if the approach is still reliable in extreme environments. Moreover, the identification of drought-tolerant genotypes based on VIs, compared to biochemical parameters and molecular markers is also interesting.

5. Conclusions

This study revealed positive correlations between Gs and Chl with sugarcane yield, confirming previous research. NDVI, NGRDI, and OSAVI were promising indices to assess Gs, while LCI, NDRE, and CIRE had the potential to assess Chl, indicating the ability of VIs in assessing drought stress. Moreover, the same result was obtained when VIs and physiological parameters were used for the identification of drought-tolerant cultivars, indicating that VIs derived from UAS have the capacity to perform equally to the traditional method for such identification. In prediction models, linear models outperformed the non-linear model when training and validation data were derived from the same crop/environment, whereas the non-linear model was outstanding in untested crop/environment for both Gs and Chl. The results from this study suggest that VIs could be used as an alternative, high throughput, and inexpensive assessments for identifying drought tolerance in sugarcane breeding. More importantly, this approach would be the most useful in a situation where there are a ton of genotypes to be screened with limited resources.

Author Contributions

Conceptualization, I.K. and J.A.d.S.; methodology, I.K. and J.A.d.S.; software, I.K., M.B. and J.E.; validation, I.K., M.B., J.E. and J.A.d.S.; formal analysis, I.K.; investigation, I.K. and J.A.d.S.; resources, M.B., J.E. and J.A.d.S.; data curation, I.K.; writing—original draft preparation, I.K.; writing—review and editing, I.K., M.B., J.E. and J.A.d.S.; visualization, I.K.; supervision, M.B., J.E. and J.A.d.S.; funding acquisition, I.K., M.B., J.E. and J.A.d.S. All authors have read and agreed to the published version of the manuscript.

Funding

This research received funding from Texas A&M AgriLife Research and Texas Water Development Board Grant (Contract no. 2013582450).

Data Availability Statement

The data presented in this study are available upon request from the corresponding author.

Acknowledgments

The authors would like to thank the leadership of the Texas A&M AgriLife Research and Extension Center, Weslaco, and all its staff for their assistance in fieldwork. The Office of the Civil Service Commission (OCSC), Thailand is acknowledged for its support of Ittipon Khuimphukhieo’s Ph.D. scholarship.

Conflicts of Interest

The authors declare no conflicts of interest.

References

  1. Li, X.; Piao, S.; Huntingford, C.; Peñuelas, J.; Yang, H.; Xu, H.; Chen, A.; Friedlingstein, P.; Keenan, T.F.; Sitch, S.; et al. Global Variations in Critical Drought Thresholds that Impact Vegetation. Natl. Sci. Rev. 2023, 10, nwad049. [Google Scholar] [CrossRef]
  2. Lamba, K.; Kumar, M.; Singh, V.; Chaudhary, L.; Sharma, R.; Yashveer, S.; Dalal, M.S. Heat Stress Tolerance Indices for Identification of the Heat Tolerant Wheat Genotypes. Sci. Rep. 2023, 13, 10842. [Google Scholar] [CrossRef] [PubMed]
  3. Cheavegatti-Gianotto, A.; de Abreu, H.M.C.; Arruda, P.; Bespalhok Filho, J.C.; Burnquist, W.L.; Creste, S.; di Ciero, L.; Ferro, J.A.; de Oliveira Figueira, A.V.; de Sousa Filgueiras, T.; et al. Sugarcane (Saccharum X officinarum): A Reference Study for the Regulation of Genetically Modified Cultivars in Brazil. Trop. Plant Biol. 2011, 4, 62–89. [Google Scholar] [CrossRef] [PubMed]
  4. Zhang, H.; Sun, X.; Dai, M. Improving Crop Drought Resistance with Plant Growth Regulators and Rhizobacteria: Mechanisms, Applications, and Perspectives. Plant Commun. 2022, 3, 100228. [Google Scholar] [CrossRef]
  5. Waraich, E.A.; Ahmad, R.; Saifullah; Ashraf, M.Y.; Ehsanullah. Role of Mineral Nutrition in Alleviation of Drought Stress in Plants. Aust. J. Crop Sci. 2011, 5, 764–777. [Google Scholar]
  6. Dlamini, P.J. Drought Stress Tolerance Mechanisms and Breeding Effort in Sugarcane: A Review of Progress and Constraints in South Africa. Plant Stress 2021, 2, 100027. [Google Scholar] [CrossRef]
  7. Chapae, C.; Songsri, P.; Gonkhamdee, S.; Jongrungklang, N. Understanding Drought Responses of Sugarcane Cultivars Controlled under Low Water Potential Conditions. Chil. J. Agric. Res. 2020, 80, 370–380. [Google Scholar] [CrossRef]
  8. Yahaya, M.A.; Shimelis, H. Drought Stress in Sorghum: Mitigation Strategies, Breeding Methods and Technologies—A Review. J. Agron. Crop Sci. 2022, 208, 127–142. [Google Scholar] [CrossRef]
  9. Devi, K.; Gomathi, R.; Arun Kumar, R.; Manimekalai, R.; Selvi, A. Field Tolerance and Recovery Potential of Sugarcane Varieties Subjected to Drought. Indian. J. Plant Physiol. 2018, 23, 271–282. [Google Scholar] [CrossRef]
  10. Basnayake, J.; Jackson, P.A.; Inman-Bamber, N.G.; Lakshmanan, P. Sugarcane for Water-Limited Environments. Genetic Variation in Cane Yield and Sugar Content in Response to Water Stress. J. Exp. Bot. 2012, 63, 6023–6033. [Google Scholar] [CrossRef]
  11. Wagih, M.E.; Kaiulo, J.V. Screening Sugarcane Varieties for Drought Tolerance. Sci. New Guinea 2001, 26, 38–45. [Google Scholar]
  12. De Silva, M.A.; Jifon, J.L.; da Silva, J.A.G.; Sharma, V. Use of Physiological Parameters as Fast Tools to Screen for Drought Tolerance in Sugarcane. Braz. J. Plant Physiol. 2007, 19, 193–201. [Google Scholar] [CrossRef]
  13. Gomathi, R.; Krishnapriya, V.; Arunkumar, R.; Govindaraj, P.; Ram, B. Physiological Traits Imparting Drought Stress Tolerance to Promising Sugarcane (Saccharum spp.) Clones. Plant Physiol. Rep. 2020, 25, 509–515. [Google Scholar] [CrossRef]
  14. Sajid, M.; Amjid, M.; Munir, H.; Ahmad, M.; Zulfiqar, U.; Ali, M.F.; Abul Farah, M.; Ahmed, M.A.A.; Artyszak, A. Comparative Analysis of Growth and Physiological Responses of Sugarcane Elite Genotypes to Water Stress and Sandy Loam Soils. Plants 2023, 12, 2759. [Google Scholar] [CrossRef] [PubMed]
  15. Bhandari, M.; Baker, S.; Rudd, J.C.; Ibrahim, A.M.H.; Chang, A.; Xue, Q.; Jung, J.; Landivar, J.; Auvermann, B. Assessing the Effect of Drought on Winter Wheat Growth Using Unmanned Aerial System (UAS)-Based Phenotyping. Remote Sens. 2021, 13, 1144. [Google Scholar] [CrossRef]
  16. Han, X.; Wei, Z.; Chen, H.; Zhang, B.; Li, Y.; Du, T. Inversion of Winter Wheat Growth Parameters and Yield Under Different Water Treatments Based on UAV Multispectral Remote Sensing. Front. Plant Sci. 2021, 12, 609876. [Google Scholar] [CrossRef] [PubMed]
  17. Zhang, L.; Han, W.; Niu, Y.; Chávez, J.L.; Shao, G.; Zhang, H. Evaluating the Sensitivity of Water Stressed Maize Chlorophyll and Structure Based on UAV Derived Vegetation Indices. Comput. Electron. Agric. 2021, 185, 106174. [Google Scholar] [CrossRef]
  18. Hoffman, N.; Singels, A.; Joshi, S. Aerial Phenotyping for Sugarcane Yield and Drought Tolerance. Field Crop. Res. 2024, 308, 109275. [Google Scholar] [CrossRef]
  19. Thapa, S.; Rudd, J.C.; Xue, Q.; Bhandari, M.; Reddy, S.K.; Jessup, K.E.; Liu, S.; Devkota, R.N.; Baker, J.; Baker, S. Use of NDVI for Characterizing Winter Wheat Response to Water Stress in a Semi-Arid Environment. J. Crop Improv. 2019, 33, 633–648. [Google Scholar] [CrossRef]
  20. Wen, P.; Meng, Y.; Gao, C.; Guan, X.; Wang, T.; Feng, W. Field Identification of Drought Tolerant Wheat Genotypes Using Canopy Vegetation Indices Instead of Plant Physiological and Biochemical Traits. Ecol. Indic. 2023, 154, 110781. [Google Scholar] [CrossRef]
  21. Narmilan, A.; Gonzalez, F.; Salgadoe, A.S.A.; Kumarasiri, U.W.L.M.; Weerasinghe, H.A.S.; Kulasekara, B.R. Predicting Canopy Chlorophyll Content in Sugarcane Crops Using Machine Learning Algorithms and Spectral Vegetation Indices Derived from UAV Multispectral Imagery. Remote Sens. 2022, 14, 1140. [Google Scholar] [CrossRef]
  22. Khuimphukhieo, I.; Marconi, T.; Enciso, J.; da Silva, J.A. The Use of UAS-Based High Throughput Phenotyping (HTP) to Assess Sugarcane Yield. J. Agric. Food Res. 2023, 11, 100501. [Google Scholar] [CrossRef]
  23. Cholula, U.; da Silva, J.A.; Marconi, T.; Thomasson, J.A.; Solorzano, J.; Enciso, J. Forecasting Yield and Lignocellulosic Composition of Energy Cane Using Unmanned Aerial Systems. Agronomy 2020, 10, 718. [Google Scholar] [CrossRef]
  24. Park, J.-W.; Benatti, T.R.; Marconi, T.; Yu, Q.; Solis-Gracia, N.; Mora, V.; da Silva, J.A. Cold Responsive Gene Expression Profiling of Sugarcane and Saccharum Spontaneum with Functional Analysis of a Cold Inducible Saccharum Homolog of NOD26-like Intrinsic Protein to Salt and Water Stress. PLoS ONE 2015, 10, e0125810. [Google Scholar] [CrossRef]
  25. Shabbir, R.; Zhaoli, L.; Yueyu, X.; Zihao, S.; Pinghua, C. Transcriptome Analysis of Sugarcane Response to Sugarcane Yellow Leaf Virus Infection Transmitted by the Vector Melanaphis Sacchari. Front. Plant Sci. 2022, 13, 921674. [Google Scholar] [CrossRef] [PubMed]
  26. Todd, J.R.; White, W.H.; Dufrene, E.O.; Tew, T.L.; Pan, Y.-B.; Duet, M.J.; Verdun, D.L.; Hale, A.L.; Dalley, C.D.; Grisham, M.P.; et al. Registration of ‘HoCP 04-838’ Sugarcane. J. Plant Regist. 2018, 12, 324–332. [Google Scholar] [CrossRef]
  27. Zhao, D.; Comstock, J.C.; Sandhu, H.S.; Glaz, B.; Edmé, S.J.; Davidson, R.W.; Sood, S.; Gilbert, R.A.; McCorkle, K.; Glynn, N.C. Registration of ‘CP 06-2400’ Sugarcane. J. Plant Regist. 2015, 9, 71–77. [Google Scholar] [CrossRef]
  28. Richard, J.; Yong-Bao, P.; Hannah, P.; Alice, W.; Paul, W. New Crop Production and Protection Practices to Increase Sugarcane Ratoon Longevity and Maximize Economic Sustainability; USDA: Washington, DC, USA, 2022. [Google Scholar]
  29. Sandhu, H.; Gilbert, A.R. Performance of CP Sugarcane Cultivars Grown in Different Locations in Florida; IFAS: Gainesville, FL, USA, 2017. [Google Scholar]
  30. Davidson, R.W.; Scott, A.W.; Hernandez, E.; Gordon, V.S.; McCord, P.; Sandhu, H.S.; Zhao, D.; Comstock, J.C.; Sood, S.; Singh, M.P.; et al. Registration of ‘CP 08-1968’ Sugarcane. J. Plant Regist. 2019, 13, 178–186. [Google Scholar] [CrossRef]
  31. Irvine, J.E.; Rozeff, N.; Hernandez, E.; Miller, J.D. Registration of ‘TCP 93-4245’ Sugarcane. Crop Sci. 2003, 43, 1132. [Google Scholar] [CrossRef]
  32. Ferreira, T.H.S.; Tsunada, M.S.; Bassi, D.; Araújo, P.; Mattiello, L.; Guidelli, G.V.; Righetto, G.L.; Gonçalves, V.R.; Lakshmanan, P.; Menossi, M. Sugarcane Water Stress Tolerance Mechanisms and Its Implications on Developing Biotechnology Solutions. Front. Plant Sci. 2017, 8, 1077. [Google Scholar] [CrossRef]
  33. Awika, H.O.; Solorzano, J.; Cholula, U.; Shi, A.; Enciso, J.; Avila, C.A. Prediction Modeling for Yield and Water-Use Efficiency in Spinach Using Remote Sensing via an Unmanned Aerial System. Smart Agric. Technol. 2021, 1, 100006. [Google Scholar] [CrossRef]
  34. Clevers, J.G.P.W.; Gitelson, A.A. Remote Estimation of Crop and Grass Chlorophyll and Nitrogen Content Using Red-Edge Bands on Sentinel-2 and -3. Int. J. Appl. Earth Obs. Geoinf. 2013, 23, 344–351. [Google Scholar] [CrossRef]
  35. Qi, H.; Wu, Z.; Zhang, L.; Li, J.; Zhou, J.; Jun, Z.; Zhu, B. Monitoring of Peanut Leaves Chlorophyll Content Based on Drone-Based Multispectral Image Feature Extraction. Comput. Electron. Agric. 2021, 187, 106292. [Google Scholar] [CrossRef]
  36. Gitelson, A.A.; Viña, A.; Ciganda, V.; Rundquist, D.C.; Arkebauer, T.J. Remote Estimation of Canopy Chlorophyll Content in Crops. Geophys. Res. Lett. 2005, 32, L08403. [Google Scholar] [CrossRef]
  37. Gitelson, A.A.; Merzlyak, M.N. Remote Sensing of Chlorophyll Concentration in Higher Plant Leaves. Adv. Space Res. 1998, 22, 689–692. [Google Scholar] [CrossRef]
  38. Barnes, E.M.; Clarke, T.R.; Richards, S.E.; Colaizzi, P.D.; Haberland, J.; Kostrzewski, M.; Waller, P.; Choi, C.; Riley, E.; Thompson, T.; et al. Coincident Detection of Crop Water Stress, Nitrogen Status and Canopy Density Using Ground-Based Multispectral Data. In Proceedings of the Fifth International Conference on Precision Agriculture, Bloomington, MN, USA, 16–19 July 2019; ASA-CSSA-SSSA: Madison, WI, USA, 2000. [Google Scholar]
  39. Rouse, J.W.; Haas, R.H.; Shell, J.A.; Deering, D.W. Monitoring Vegetation Systems in the Great Plains with ERTS. In Monitoring Vegetation Systems in the Great Plains with ERTS; NASA Goddard Space Flight Center: Greenbelt, MD, USA, 1974; pp. 309–317. [Google Scholar]
  40. Gitelson, A.A.; Viña, A.; Arkebauer, T.J.; Rundquist, D.C.; Keydan, G.; Leavitt, B. Remote Estimation of Leaf Area Index and Green Leaf Biomass in Maize Canopies. Geophys. Res. Lett. 2003, 30, 52-1–52-4. [Google Scholar] [CrossRef]
  41. Rondeaux, G.; Steven, M.; Baret, F. Optimization of Soil-Adjusted Vegetation Indices. Remote Sens. Environ. 1996, 55, 95–107. [Google Scholar] [CrossRef]
  42. Haboudane, D.; Miller, J.R.; Tremblay, N.; Zarco-Tejada, P.J.; Dextraze, L. Integrated Narrow-Band Vegetation Indices for Prediction of Crop Chlorophyll Content for Application to Precision Agriculture. Remote Sens. Environ. 2002, 81, 416–426. [Google Scholar] [CrossRef]
  43. Jordan, C.F. Derivation of Leaf-Area Index from Quality of Light on the Forest Floor. Ecology 1969, 50, 663–666. [Google Scholar] [CrossRef]
  44. Basnayake, J.; Jackson, P.A.; Inman-Bamber, N.G.; Lakshmanan, P. Sugarcane for Water-Limited Environments. Variation in Stomatal Conductance and Its Genetic Correlation with Crop Productivity. J. Exp. Bot. 2015, 66, 3945–3958. [Google Scholar] [CrossRef]
  45. Adak, A.; Murray, S.C.; Anderson, S.L. Temporal Phenomic Predictions from Unoccupied Aerial Systems Can Outperform Genomic Predictions. G3 2023, 13, jkac294. [Google Scholar] [CrossRef] [PubMed]
  46. De Oliveira, L.A.; de Miranda, J.H.; Cooke, R.A.C. Water Management for Sugarcane and Corn under Future Climate Scenarios in Brazil. Agric. Water Manag. 2018, 201, 199–206. [Google Scholar] [CrossRef]
  47. De Almeida Silva, M.; Jifon, J.L.; Sharma, V.; da Silva, J.A.G.; Caputo, M.M.; Damaj, M.B.; Guimarães, E.R.; Ferro, M.I.T. Use of Physiological Parameters in Screening Drought Tolerance in Sugarcane Genotypes. Sugar Tech. 2011, 13, 191–197. [Google Scholar] [CrossRef]
  48. Dien, D.C.; Yamakawa, T.; Mochizuki, T.; Htwe, A.Z. Dry Weight Accumulation, Root Plasticity, and Stomatal Conductance in Rice (Oryza sativa L.) Varieties under Drought Stress and Re-Watering Conditions. Am. J. Plant Sci. 2017, 08, 3189–3206. [Google Scholar] [CrossRef]
  49. Takai, T.; Yano, M.; Yamamoto, T. Canopy Temperature on Clear and Cloudy Days Can Be Used to Estimate Varietal Differences in Stomatal Conductance in Rice. Field Crops Res. 2010, 115, 165–170. [Google Scholar] [CrossRef]
  50. Lu, Z.; Percy, R.G.; Qualset, C.O.; Zeiger, E. Stomatal Conductance Predicts Yields in Irrigated Pima Cotton and Bread Wheat Grown at High Temperatures. J. Exp. Bot. 1998, 49, 453–460. [Google Scholar] [CrossRef]
  51. Jiang, G.M.; Sun, J.Z.; Liu, H.Q.; Qu, C.M.; Wang, K.J.; Guo, R.J.; Bai, K.Z.; Gao, L.M.; Kuang, T.Y. Changes in the Rate of Photosynthesis Accompanying the Yield Increase in Wheat Cultivars Released in the Past 50 years. J. Plant Res. 2003, 116, 347–354. [Google Scholar] [CrossRef] [PubMed]
  52. Garkar, R.M.; Bharud, R.W.; Mate, S.N. Effect of Water Stress on Chlorophyll, Nitrate Reductase Activity and Cane Yield in Sugarcane (Saccharum officinarum L.). J. Sugarcane Res. 2011, 1, 43–49. [Google Scholar]
  53. Olivares-Villegas, J.J.; Reynolds, M.P.; McDonald, G.K. Drought-Adaptive Attributes in the Seri/Babax Hexaploid Wheat Population. Funct. Plant Biol. 2007, 34, 189. [Google Scholar] [CrossRef]
  54. Chen, W.; Sheng, Z.; Cai, Y.; Li, Q.; Wei, X.; Xie, L.; Jiao, G.; Shao, G.; Tang, S.; Wang, J.; et al. Rice Morphogenesis and Chlorophyll Accumulation Is Regulated by the Protein Encoded by NRL3 and Its Interaction with NAL9. Front. Plant Sci. 2019, 10, 175. [Google Scholar] [CrossRef]
  55. Benešová, M.; Holá, D.; Fischer, L.; Jedelský, P.L.; Hnilička, F.; Wilhelmová, N.; Rothová, O.; Kočová, M.; Procházková, D.; Honnerová, J.; et al. The Physiology and Proteomics of Drought Tolerance in Maize: Early Stomatal Closure as a Cause of Lower Tolerance to Short-Term Dehydration? PLoS ONE 2012, 7, e38017. [Google Scholar] [CrossRef] [PubMed]
  56. Matthews, J.S.A.; Vialet-Chabrand, S.; Lawson, T. Role of Blue and Red Light in Stomatal Dynamic Behaviour. J. Exp. Bot. 2020, 71, 2253–2269. [Google Scholar] [CrossRef] [PubMed]
  57. Clevers, J.G.P.W.; de Jong, S.M.; Epema, G.F.; van der Meer, F.; Bakker, W.H.; Skidmore, A.K.; Addink, E.A. MERIS and the Red-Edge Position. Int. J. Appl. Earth Obs. Geoinf. 2001, 3, 313–320. [Google Scholar] [CrossRef]
  58. Dash, J.; Curran, P.J. The MERIS Terrestrial Chlorophyll Index. Int. J. Remote Sens. 2004, 25, 5403–5413. [Google Scholar] [CrossRef]
  59. Stansluos, A.A.L.; Öztürk, A.; Niedbała, G.; Türkoğlu, A.; Haliloğlu, K.; Szulc, P.; Omrani, A.; Wojciechowski, T.; Piekutowska, M. Genotype–Trait (GT) Biplot Analysis for Yield and Quality Stability in Some Sweet Corn (Zea mays L. Saccharata Sturt.) Genotypes. Agronomy 2023, 13, 1538. [Google Scholar] [CrossRef]
  60. Jumrani, K.; Bhatia, V.S. Identification of Drought Tolerant Genotypes Using Physiological Traits in Soybean. Physiol. Mol. Biol. Plants 2019, 25, 697–711. [Google Scholar] [CrossRef] [PubMed]
  61. Elfanah, A.M.S.; Darwish, M.A.; Selim, A.I.; Elmoselhy, O.M.A.; Ali, A.M.; El-Maghraby, M.A.; Abdelhamid, M.T. Hyperspectral Reflectance and Agro-Physiological Traits for Field Identification of Salt-Tolerant Wheat Genotypes Using the Genotype by Yield*trait Biplot Technique. Front. Plant Sci. 2023, 14, 1165113. [Google Scholar] [CrossRef]
  62. Khuimphukhieo, I.; Bhandari, M.; Enciso, J.; da Silva, J. Estimating Sugarcane Yield and Its Components Using Unmanned Aerial Systems (Uas)-Based High Throughput Phenotyping (Htp). SSRN, 2024; preprint. [Google Scholar] [CrossRef]
  63. Adak, A.; Anderson, S.L.; Murray, S.C. Pedigree-management-flight Interaction for Temporal Phenotype Analysis and Temporal Phenomic Prediction. Plant Phenome J. 2023, 6, e20057. [Google Scholar] [CrossRef]
Figure 1. The flowchart of an experimental arrangement of drought stress and recovery from the stress of sugarcane in this study and unmanned vehicle systems (UAS) data collection and processing.
Remotesensing 16 01433 g001
Figure 2. Five cross-validation schemes (CVs) were designed for the breeding context used in this study.
Remotesensing 16 01433 g002
Figure 3. Minimum, maximum, average temperature, precipitation, and irrigation collected throughout the growing season for both ratoon crops.
Remotesensing 16 01433 g003
Figure 4. Soil moisture (Kpa) at 15 (a), 46 (b), and 79 cm (c) soil depth were collected throughout the growing season and in four locations for each depth for the 2nd and the 3rd ratoon crops. Numbers in parenthesis are the total duration of drought stress and the duration of stress at the time of data collection, respectively. TS = tillering stage, ES = elongation stage, MS = maturity stage, GS = germination stage. R1 and R2 after cultivar names represent replication of experimental units where sensors were embedded.
Remotesensing 16 01433 g004
Figure 5. Stomatal conductance (Gs) and chlorophyll content (Chl) averaged across seven sugarcane cultivars under stress and recovery periods. (a,b,d) for the 2nd ratoon, (c,e) for the 3rd ratoon.
Remotesensing 16 01433 g005
Figure 6. Correlogram showing the association between physiological traits and tons of cane per hectare (TCH) for the 2nd (a) and the 3rd ratoon crops (b). Gs = stomatal conductance, Chl = chlorophyll content. S and R after each trait represent data collected at stress and recovery periods, respectively. The number of 1 and 3 at the end of each trait of the 2nd ratoon crop represents data collected at the 1st and 3rd cycle, respectively. * and ** indicate significant difference at 0.05 and 0.01%, respectively. n = 28.
Remotesensing 16 01433 g006
Figure 7. Correlogram showing the association among the independent variables and between vegetation indices (VIs) with stomatal conductance (Gs) and chlorophyll content (Chl). GIG = green chlorophyll index, GNDVI = green normalized difference vegetation index, LCI = leaf chlorophyll index, NDRE = normalized difference red edge index, NDVI = normalized difference vegetation index, NGRDI = normalized green, red difference index, OSAVI = optimized soil-adjusted vegetation index, TCARI = transformed chlorophyll absorption in refection index, CIRE = red-edge chlorophyll index, SPI = simple ration index. * and ** indicate significant differences at 0.05 and 0.01%, respectively. n = 112 for Gs at 2nd ratoon crop while the rest n = 56.
Remotesensing 16 01433 g007
Figure 8. Identification of drought-tolerant cultivars of sugarcane-based on ten vegetation indices (VIs) and physiological traits. (ac) represent genotypes by traits biplot (GT biplot) based on VIs, physiological traits, and all traits, respectively. (df) represent heatmap analysis based on VIs, physiological traits, and all traits, respectively. GIG = green chlorophyll index, GNDVI = green normalized difference vegetation index, LCI = leaf chlorophyll index, NDRE = normalized difference red edge index, NDVI = normalized difference vegetation index, NGRDI = normalized green, red difference index, OSAVI = optimized soil-adjusted vegetation index, TCARI = transformed chlorophyll absorption in refection index, CIRE = red-edge chlorophyll index, SPI = simple ration index, Gs = stomatal conductance, Chl = chlorophyll content, TCH2 and TCH3 = tons of cane per hectare of the 2nd and the 3rd ratoon crop, respectively. S and R at the end of each trait represent data collected under stress and recovery stages, respectively.
Remotesensing 16 01433 g008
Figure 9. Correlation coefficient (r) of stomatal conductance (Gs) obtained by various machine learning algorithms with five cross-validation schemes (CVs). The values in the boxes show the mean values of r.
Remotesensing 16 01433 g009
Figure 10. Root means square error (RMSE) of stomatal conductance (Gs) obtained by various machine learning algorithms with five cross-validation schemes (CVs). The values in the boxes show the mean values of RMSE. Boxplot was not generated if values were greater than 100 mmol m−2s−1 as it exceeds maximum value for Y-axis.
Remotesensing 16 01433 g010
Figure 11. Correlation coefficient (r) of chlorophyll content (Chl) obtained by various machine learning algorithms with five cross-validation schemes (CVs). The values in the boxes show the mean values of r.
Remotesensing 16 01433 g011
Figure 12. Root means square error (RMSE) of chlorophyll content (Chl) obtained by various machine learning algorithms with five cross-validation schemes (CVs). The values in the boxes show the mean values of RMSE. Boxplot was not generated if values were greater than 80 µmol m−2 as it exceeds the maximum value for Y-axis.
Remotesensing 16 01433 g012
Table 1. The characteristic description of cultivars used in this study.
CultivarsCharacteristic DescriptionReferences
CP72-1210Cold susceptible and yellow leaf disease[24,25]
HoCP04-838Resistant to smut, mosaic caused by Sorghum mosaic virus, brown rust, sugarcane borer, ratoon stunt but susceptible to yellow leaf [26]
CP06-2400High cane, sucrose yields, acceptable levels of resistance to brown rust, orange rust, leaf scald, ratoon stunt, smut, and freeze tolerance[27]
CP07-1824Resistant to sugarcane borer in South Texas[28]
CP89-2143High, stable sucrose concentration and sucrose yield[29]
CP08-1968High cane and sucrose yield on sand soils. Acceptable levels of brown rust, smut, mosaic, yellow leaf, ratoon stunt, moderate to good freeze tolerance but susceptible to orange rust[30]
TCP93-4245High sugar yield, acceptable ratoon ability, resistance to ratoon stunting disease, Mexican rice borer, and sugarcane borer[31]
Table 2. Dates of stress triggered, irrigation applied, and unmanned aerial systems (UAS) data collection for each drought cycle.
RatoonsCyclesStress
Triggered
UAS Data CollectionPhysiological Data CollectionIrrigation
Applied
UAS Data CollectionPhysiological Data Collection
2nd crop1st30 July 202210 August 202211 August 202214 August 2022 18 August 202217 August 2022
2nd1 October 202212 October 2022-26 October 20222 November 2022-
3rd22 January 202327 January 202325 January 20239 February 202314 February 202315 February 2023
3rd crop 21 July 202316 August 202317 August 20234 September 202322 September 202319 September 2023
Received water from rain.
Table 3. Vegetation indices (VIs) were used in this study.
Vegetation Indices (VIs)Equation References
Green chlorophyll indexGIG = (NIR/G) − 1[36]
Green normalized difference vegetation indexGNDVI = (NIR − G)/(NIR + G)[37]
Leaf chlorophyll index LCI = (NIR − RE)/(NIR + R)[21]
Normalized difference red edge index NDRE = (NIR − RE)/(NIR + RE)[38]
Normalized difference vegetation index NDVI = (NIR − R)/(NIR + R)[39]
Normalized green, red difference indexNGRDI = (G − R)/(G + R)[40]
Optimized soil-adjusted vegetation indexOSAVI = (1 + 0.16) × (NIR − R)/(NIR + R +0.16)[41]
Transformed chlorophyll absorption in refection indexTCARI = 3 × [(RE − R) − 0.2 × (RE − G) × (RE/R)][42]
Red-edge chlorophyll indexCIRE = (NIR/RE) − 1[36]
Simple ration indexSPI = NIR/G[43]
B, G, R, RE, and NIR represent the blue, green, red, red edge, and NIR bands, respectively in the above formulas.
Table 4. Iterations and data partitions are used for model validation.
C2C3C4C5C6C7
C1 C1, C2 (I1 ) (I1)C1, C3 (I2)C1, C4 (I3)C1, C5 (I4)C1, C6 (I5)C1, C7 (I6)
C2 C2, C3 (I7)C2, C4 (I8)C2, C5 (I9)C2, C6 (I10)C2, C7 (I11)
C3 C3, C4 (I12)C3, C5 (I13)C3, C6 (I14)C3, C7 (I15)
C4 C4, C5 (I16)C4, C6 (I17)C4, C7 (I18)
C5 C5, C6 (I19)C5, C7 (I20)
C6 C6, C7 (I21)
C1 = CP06-2400, C2 = CP07-1824, C3 = CP08-1968, C4 = CP72-1210, C5 = CP89-2143, C6 = HoCP04-838, C7 = TCP93-4245. I = Iteration. Two cultivars in each iteration above were assigned to the validation dataset.
Table 5. Mean ± SD of stomatal conductance (mmol m−2s−1) and chlorophyll content (µmol m−2) for the 2nd ratoon crop.
CultivarsThe 1st CycleThe 3rd Cycle
Gs.S Gs.RGs.SGs.RChl.SChl.R
CP06-2400240.6 ± 120.9280.4 ± 37.0 c164.9 ± 36.6 bc211.1 ± 32.9258.0 ± 10.5 abc204.1 ± 17.5 ab
CP07-1824292.0 ± 88.8440.0 ± 96.4 a206.2 ± 12.2 ab221.9 ± 50.1244.4 ± 35.6 bc209.2 ± 25.7 a
CP08-1968282.7 ± 71.7329.7 ± 98.8 bc209.5 ± 61.1 ab246.0 ± 18.3278.9 ± 31.7 ab228.6 ± 43.7 a
CP72-1210308.6 ± 131.8394.3 ± 95.8 ab207.3 ± 8.1 ab231.4 ± 28.9278.3 ± 2.7 ab235.1 ± 38.6 a
CP89-2143289.2 ± 106.9286.8 ± 83.1 c139.4 ± 22.7 c198.8 ± 18.0227.2 ± 21.8 c198.7 ± 19.6 ab
HoCP04-838280.5 ± 78.0301.9 ± 83.9 bc182.6 ± 59.6 bc182.5 ± 63.3226.3 ± 31.1 c169.5 ± 31.8 b
TCP93-4245336.8 ± 83.9326.7 ± 38.4 bc239.9 ± 45.1 a240.1 ± 33.5288.9 ± 30.3 a216.7 ± 10.2 a
F-testns **ns***
CV (%)28.5719.0519.7816.099.8712.78
 Gs.S = stomatal conductance collected under stress period, Gs.R = stomatal conductance collected under recovery period, Chl.S = chlorophyll content collected under stress period, Chl.R = chlorophyll content collected under recovery period. ns, * and ** indicate non-significant, significant difference at 0.05 and 0.01%, respectively. Means in the same column with the same letters are not significantly different by LSD at p ≤ 0.05.
Table 6. Mean ± SD of stomatal conductance (mmol m−2s−1) and chlorophyll content (µmol m−2) for the 3rd ratoon crop.
CultivarsThe 3rd Ratoon Crop
Gs.S Gs.RChl.SChl.R
CP06-2400217.9 ± 38.1195.6 ± 62.5 b203.4 ± 19.3 bc230.1 ± 14.2
CP07-1824275.5 ± 22.7300.6 ± 60.4 a201.0 ± 13.7 c262.1 ± 18.0
CP08-1968233.0 ± 28.9223.3 ± 48.3 b224.2 ± 33.6 abc249.2 ± 51.2
CP72-1210259.2 ± 46.9235.5 ± 29.6 ab240.7 ± 39.0 ab260.2 ± 19.7
CP89-2143228.3 ± 25.6179.2 ± 37.2 b194.4 ± 17.1 c232.3 ± 6.2
HoCP04-838218.4 ± 18.3294.4 ± 36.0 a253.9 ± 30.0 a295.9 ± 39.1
TCP93-4245244.5 ± 52.7241.4 ± 29.8 ab226.4 ± 13.5 abc241.4 ± 17.5
F-testns **ns
CV (%)14.0219.4611.9511.18
 Gs.S = stomatal conductance collected under stress period, Gs.R = stomatal conductance collected under recovery period, Chl.S = chlorophyll content collected under stress period, Chl.R = chlorophyll content collected under recovery period. ns and * indicate non-significant and significant difference at 0.05%, respectively. Means in the same column with the same letters are not significantly different by LSD at p ≤ 0.05.
Table 7. Top-three cultivar ranking based on measured (MVs) and predicted values (PVs) for stomatal conductance (Gs) and chlorophyll content (Chl) under stress period.
CropsTraitsModelCVs CultivarsRanking Based on MVsMVsPVsRanking Based on PVs
The 2nd ratoon Gs
(1st)
RidgeCV3TCP93-42451336.8313.31
CP72-12102308.6292.82
CP07-18243292.0274.94
Gs
(3rd)
RidgeCV3TCP93-42451239.9211.64
CP08-19682209.5215.12
CP72-12103207.3214.03
Chl
(3rd)
LassoCV3TCP93-42451288.9275.42
CP08-19682278.9242.24
CP72-12103278.3275.81
The 3rd ratoonGsRandom forestCV5CP07-18241275.5210.23
CP72-12102259.2263.51
TCP93-42453244.5246.92
ChlRandom forestCV5HoCP04-8381253.9235.93
CP72-12102240.7240.12
TCP93-42453226.4245.41
CV, cross validation.
Table 8. Top-three cultivar ranking based on measured (MVs) and predicted values (PVs) for stomatal conductance (Gs) and chlorophyll content (Chl) under recovery period.
CropsTraitsModelCVs CultivarsRanking Based on MVsMVsPVsRanking Based on PVs
The 2nd ratoon Gs
(1st)
RidgeCV3CP07-18241440.0319.05
CP72-12102394.3339.63
TCP93-42453326.7376.71
Gs
(3rd)
RidgeCV3CP08-19681246.0237.82
TCP93-42452240.1215.35
CP72-12103231.4228.53
Chl
(3rd)
LassoCV3CP72-12101235.1243.51
CP08-19682228.6212.24
TCP93-42453216.7230.03
The 3rd ratoonGsRandom forestCV5CP07-18241300.6276.22
HoCP04-8382294.4270.34
TCP93-42453241.4277.51
ChlRandom forestCV5HoCP04-8381295.9260.11
CP07-18242262.1236.24
CP72-12103260.2239.83
CV, cross validation.
Disclaimer/Publisher’s Note: The statements, opinions and data contained in all publications are solely those of the individual author(s) and contributor(s) and not of MDPI and/or the editor(s). MDPI and/or the editor(s) disclaim responsibility for any injury to people or property resulting from any ideas, methods, instructions or products referred to in the content.

