Article

Impact of Wildfires on Land Surface Cold Season Climate in the Northern High-Latitudes: A Study on Changes in Vegetation, Snow Dynamics, Albedo, and Radiative Forcing

by
Melissa Linares
1,2,* and
Wenge Ni-Meister
2
1
CUNY Graduate Center, City University of New York, New York, NY 10016, USA
2
Hunter College, City University of New York, New York, NY 10065, USA
*
Author to whom correspondence should be addressed.
Remote Sens. 2024, 16(8), 1461; https://doi.org/10.3390/rs16081461
Submission received: 21 February 2024 / Revised: 12 April 2024 / Accepted: 13 April 2024 / Published: 20 April 2024
(This article belongs to the Special Issue Remote Sensing of Solar Radiation Absorbed by Land Surfaces)

Abstract

:
Anthropogenic climate change is increasing the occurrence of wildfires, especially in northern high latitudes, leading to a shift in land surface climate. This study aims to determine the predominant climatic effects of fires in boreal forests to assess their impact on vegetation composition, surface albedo, and snow dynamics. The influence of fire-induced changes on Earth’s radiative forcing is investigated, while considering variations in burn severity and postfire vegetation structure. Six burn sites are explored in central Alaska’s boreal region, alongside six control sites, by utilizing Moderate Resolution Imaging Spectroradiometer (MODIS)-derived albedo, Leaf Area Index (LAI), snowmelt timing data, AmeriFlux radiation, National Land Cover Database (NLCD) land cover, and Monitoring Trends in Burn Severity (MTBS) data. Key findings reveal significant postfire shifts in land cover at each site, mainly from high- to low-stature vegetation. A continuous increase in postfire surface albedo and negative surface shortwave forcing was noted even after 12 years postfire, particularly during the spring and at high-severity burn areas. Results indicate that the cooling effect from increased albedo during the snow season may surpass the warming effects of earlier snowmelt. The overall climate impact of fires depends on burn severity and vegetation composition.

1. Introduction

Over the past three decades, the northern high-latitude land surface has experienced climate warming at a rate of 1.36 °C per century from 1875 to 2008, almost twice as strong as the Northern Hemisphere trend [1,2]. Due to this accelerated warming, fire frequency and severity have increased in the boreal forest [3,4,5]. The Multivariate Adaptive Regression Spline (MARS) empirical fire model suggests that under projected climate conditions in the future, the average area burned in North American boreal forests will increase by 3.5–5.5 times relative to 1991–2000 [6].
Increased fire activity in these high northern latitudes may impact Earth’s surface radiative budget and overall climate [5,7]. The magnitude of this potential outcome is compounded by the fact that boreal forest wildfires are typically high-intensity crown fires that result in nearly 100% tree mortality [8,9]. The immediate aftermath of such wildfires alters the existing vegetation and deposits charcoal and ash layers on the surface [10]. These changes in land cover have subsequent impacts on various physical and ecological processes such as the water cycle, energy balance, climate patterns, and carbon storage [11,12].
Fires, in the boreal forest of Alaska specifically, significantly affect forest compositions and vegetation structure due to the dominant presence of conifer and deciduous land cover types [13,14,15]. After a fire, the conifer canopy is replaced by grass, shrub/scrub, and deciduous forest [16]. This change in the dominant vegetation type is usually established in the first few years following the fire [17]. Specifically, the increase in fire frequency and burn severity caused by climate warming affects postfire vegetation succession [9,14,18], where high-severity fires are conducive to establishing deciduous forests [4,19].
Postfire forest composition and vegetation structure change can directly influence surface albedo and energy exchange. Surface albedo is spatially and temporally heterogeneous and depends on various factors related to land cover/vegetation type, vegetation structure, leaf reflectance spectrum, soil/snow background albedo, topography, successional dynamics, time since fire, the ratio of ash/char deposition, season, and burn severity [6,7,15,20,21,22,23,24,25]. During the non-snow season, grass and deciduous types have leaves with higher reflectance than evergreens, increasing postfire albedo and leading to a net cooling [8,14,24,25,26]. However, during the snow season, the openness of sparse vegetation, as a result of fires, allows for more bright background snow albedo contribution to the surface albedo; thus, sparsely vegetated snow-covered areas tend to have a higher albedo than densely vegetated snow-covered areas [21,27,28]. The fire-induced forest structure change results in a higher surface albedo during the snow-covered season in the boreal forest of Alaska. The surface albedo response to fires is further complicated by the burn severity, which significantly affects vegetation structure and density. Wang et al. [5] found that postfire albedo values generally increase with burn severity; this effect is most pronounced immediately after the fire and during the early spring seasons following the fire. Additionally, higher burn severity results in greater amounts of black carbon generation, which lowers snow albedo [29]. The magnitude and duration of postfire albedo change strongly depend on burn severity, snow dynamics, and the changes to vegetation structure and density. However, how these variables interact to influence albedo is not well understood.
Fires, as the primary disturbance in boreal forests, can generate positive and negative climate forcings, resulting in warming and cooling climates. Fires produce a negative radiative forcing and cooling effect due to increased albedo, yet this impact significantly changes over the first few decades postfire [7,30]. However, fires can also result in a positive forcing due to aerosol emissions from wildfires [31,32]. Increased snow exposure to the sun due to the aftermath of fires also creates positive feedback, resulting in increased solar radiation that reaches the snow more easily, causing rapid melting [33,34]. Fire reduces maximum snow water equivalent (SWE) and causes earlier melt dates [35]. Additionally, changing from spruce to either birch or mixed forest leads to a marked decrease in end-of-winter snowpack depths and water equivalent [36]. So far, most studies have mainly focused on the cooling or warming effects caused by fires; however, a competing phenomenon is observed between the postfire negative radiative forcing due to increased snow exposure and the positive radiative forcing due to early onset snowmelt. The challenge is determining the net effect of fires on climate due to the multiple ways fires influence the land cover.
This study aims to elucidate this matter and expands upon prior research by analyzing a wider range of site conditions, such as densely and sparsely vegetated areas and varying burn severities while utilizing an extended time series for a more comprehensive analysis. Key variables such as burn severity, prefire vegetation conditions, species establishment in postfire ecosystems, and the duration of winter snow cover are vital factors that are likely to determine the balance between negative and positive radiative forcing associated with fires in the boreal biome [12]. Satellite-derived fire products are utilized, along with the National Land Cover Database (NLCD), Moderate Resolution Imaging Spectroradiometer (MODIS) albedo, leaf area index, and snowmelt timing data to investigate how burn severity impacts land cover, vegetation density, snow dynamics, and how fire-induced changes in vegetation structure and snow dynamics affect snow albedo and radiative forcing.

2. Materials and Methods
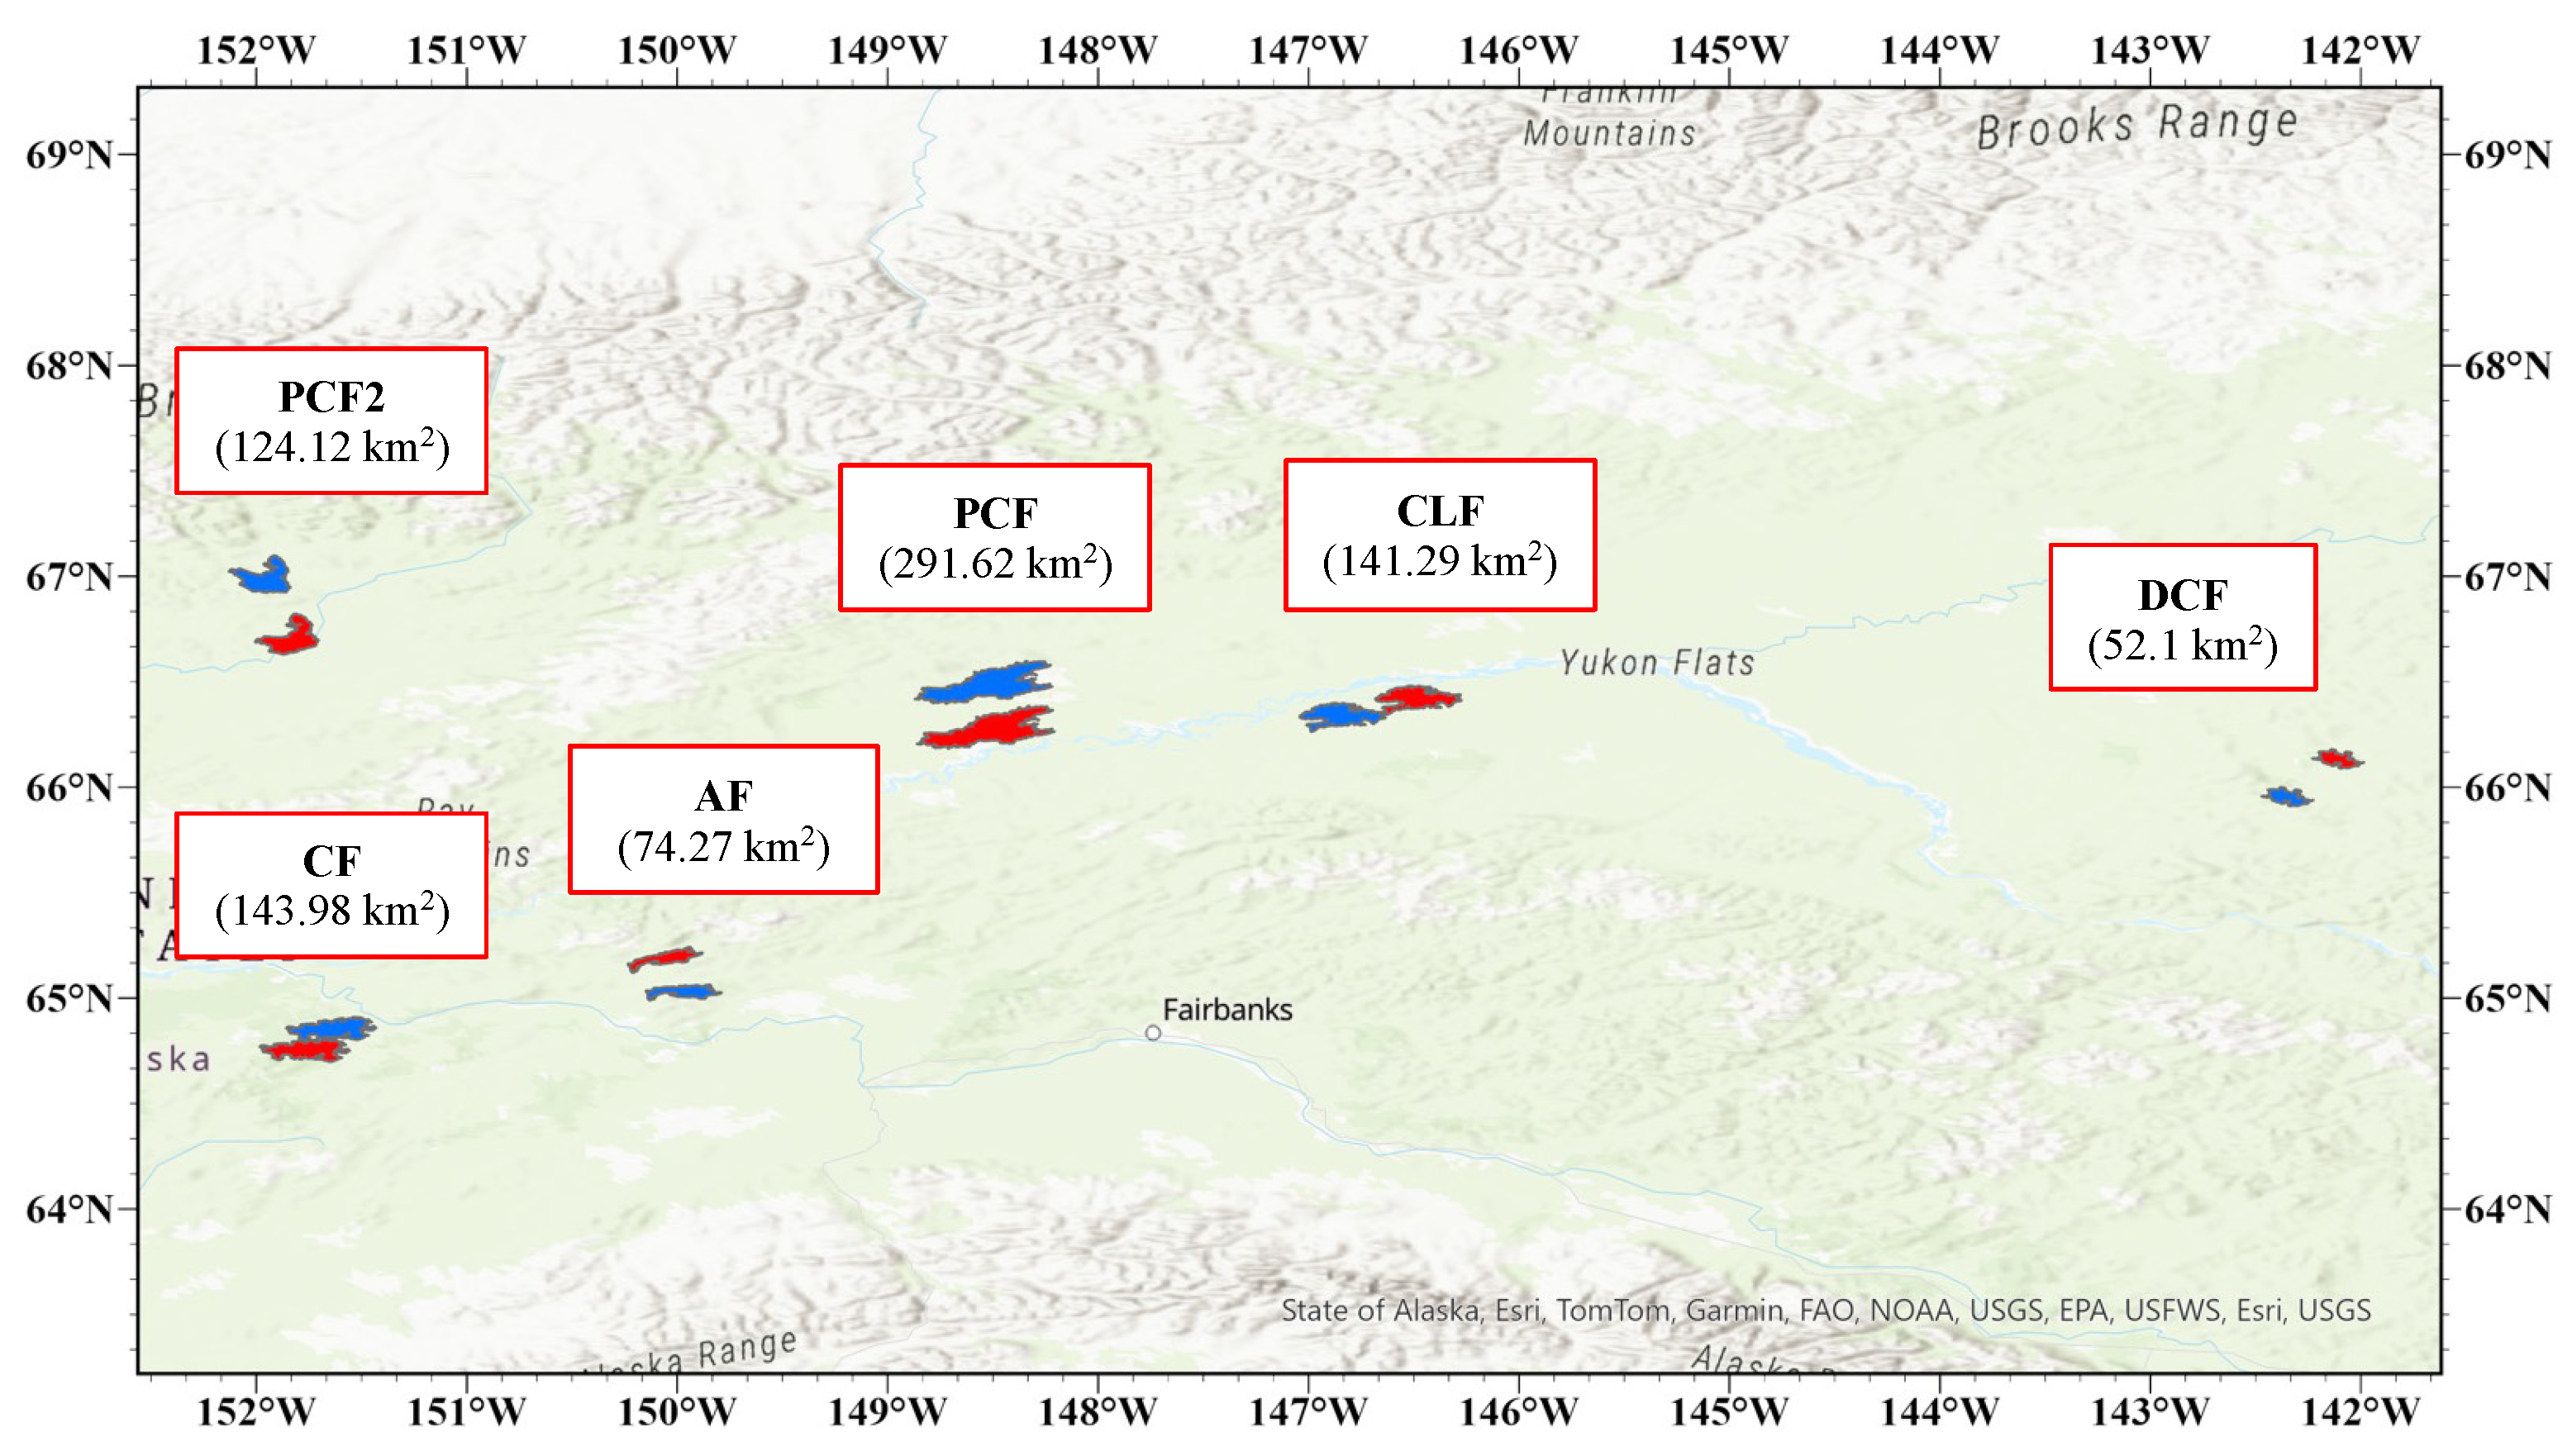
2.1. Study Area

Six burn sites in Alaska’s boreal forest’s interior region that experienced a fire in 2010 are analyzed in this study, ranging in size from 56.72  km 2  to 434.71  km 2  (Figure 1) and Appendix A. These burn sites were specifically chosen because they had no record of fires occurring before or after the 2010 event. The absence of previous or subsequent fires enables a clear comparison of the environmental conditions before and after the 2010 fire. The fire domains were obtained via the USGS and US Forest Service’s Monitoring Trends in the Burn Severity (MTBS) program. Land cover within the burn sites’ domain was assessed via the NLCD. The dominant prefire land cover type in the study sites was evergreen forest. Given the size of the burn sites, MODIS 500 m pixel size was utilized in this study. This region is mainly unaffected by anthropogenic disturbances due to its remoteness, and the land cover in Alaska is relatively stable. Therefore, we assumed that the prefire land cover for all six sites was consistent with the NLCD land cover in 2001. The snow season in the study area begins with snow accumulation in October and ends with the snow melt period between approximately April and May [37].
The selected sites in the study area experienced fires in 2010, providing a decade of prefire history and over ten years of postfire history for comparison. Six control sites were also selected to match the corresponding burn sites. The control sites were made to match the same shape and size as their corresponding burn sites using the fire domain. The fire polygons obtained from MTBS were used as the domain to generate the control sites via ArcGIS Pro. To ensure the reliability of our comparisons, we carefully selected control sites that matched closely with the burn sites based on land cover type and no known fire history. The selection process prioritized proximity, aiming to choose the nearest unburned area that satisfied our land cover and fire history criteria, thereby minimizing microclimatic differences between the control and burn site. The control sites were used to compare albedo, snowmelt timing, and surface radiation forcing between burned and unburned areas, enabling the identification of changes attributed to fires alone instead of other factors like interannual climate variability.

2.2. Datasets and Analysis

The impact of fires on drivers that cause changes to surface albedo and radiative forcing is one of the main focuses of our study. Namely, for the above-ground conditions, land cover and vegetation density, and for the on-ground conditions, snow cover and snowmelt dates were extracted from MODIS products. Google Earth Engine (GEE) was utilized to extract MODIS data instead of specific tiles from the NASA National Snow and Ice Data Center (NSIDC). Additionally, MODIS daily surface albedo and LAI values were extracted for the fire polygons from MTBS of the six wildfires (Figure 1). To obtain a representative daily value for the entire burned area, the spatial aggregation process calculated the daily mean value for all pixels within each fire polygon. After spatial aggregation, temporal aggregation was performed by averaging the daily means to compute monthly mean values for each fire site. However, collecting reliable MODIS data in high northern latitudes is challenging due to the high solar zenith angles exhibited during the winter [38]. Solar zenith angles above 70° are not reliable [5,39], resulting in missing or limited MODIS product observations between December and February. Months with limited or no values were excluded from the time series calculations.
An overview of the primary data processing and analysis is depicted in Figure 2. In the following, we describe (a) mapping burn severity and analysis of fire-caused land cover and vegetation density change, (b) detecting fire-induced snowmelt date changes, and (c) assessment of fire impact on surface albedo and surface shortwave radiative forcing.

2.2.1. Mapping Burn Severity and Analysis of Fire-Caused Land Cover and Vegetation Density Change

Burn severity maps for each burn site were generated using the national burn severity mosaic product from the MTBS project, as described by Eidenshink et al. [40]. These mosaics provide thematic raster images of MTBS burn severity classes, covering a broad geographical scope that includes the continental United States, Alaska, Hawaii, and Puerto Rico. The images classify burn severity into five levels: unburned to low, low, moderate, high, and increased greenness. This classification is based on the differenced Normalized Burn Ratio (dNBR) calculated using pre- and postfire Landsat images.
The Normalized Burn Ratio (NBR) uses the reflection properties of the near-infrared (NIR) spectrum (0.85–0.88 μm) and the shortwave-infrared (SWIR) spectrum (2.11–2.29 μm) to differentiate between burned areas and unburn. If an area is affected by fire or has bare soil, the SWIR band reflects more light than the NIR band. On the other hand, healthy vegetation reflects more light in the NIR spectrum and less in the SWIR spectrum. The formula for NBR is:
N B R = R N I R R S W I R R N I R + R S W I R  
Here, RNIR stands for reflectance in the near-infrared band, RSWIR for reflectance in the shortwave-infrared band.
d N B R = N B R p r e f i r e + N B R p o s t f i r e
dNBR represents the variation in NBR due to a fire, indicating changes in vegetation or soil characteristics caused by burning [29,40]. MTBS calculates the dNBR using satellite images from before the fire, usually the previous year, and after the fire, typically the next year. These images are part of multi-temporal mosaics, which are aggregations over time to ensure accuracy despite potential issues like clouds or smoke [40]. A non-processing area mask is generated in areas with clouds, snow, shadows, smoke, large bodies of water, and missing image data.
Notably, the burn severity data from MTBS has a resolution of 30 m, which was aggregated into 500 m GEE to match with the spatial resolution of MODIS albedo product. This aggregation was executed with a coarse 500 m resolution using a modal reduction method. This method identifies and assigns the most frequent (i.e., dominant) burn severity class within each 500 m pixel, enabling a more consistent comparison between the burn severity brought on by fires and the MODIS albedo data.
Pre- and postfire land cover for all sites was identified and mapped using the NLCD product generated by the Multi-Resolution Land Characteristics (MRLC) consortium. In this study, the pre-and postfire land cover classifications were made using the NLCD 2001 and 2016 Land Cover (ALASKA) products [41]. The impact of fires on vegetation density was analyzed via the LAI MODIS product (MCD15A3H V6) to characterize the vegetation density change due to fires. The LAI MODIS product is a 4-day data set with a 500 m pixel size, and the available dates for the LAI MODIS product used in this study are 2000–2020 [42].

2.2.2. Detecting Impact of Fires on Snowmelt Dates

Temporal variations in snowmelt timing are essential to understanding the seasonal variation of surface albedo change from pre- to postfire. This study examines how wildfires affect snow melting processes using snowmelt timing (SMT) data derived from MODIS standard 8-day composite snow-cover product MOD10A2 collection 6 for the period 1 January 2001 to 31 December 2018 [43] to determine changes in snowmelt after a fire. SMT (i.e., no-snow) was defined as a snow-free reading following two consecutive snow-present readings for a 500 m pixel [43].

2.2.3. Impact of Fires on Surface Albedo and Surface Shortwave Forcing

Surface albedo variations were analyzed at different burn sites with varying fire severities to examine the impact of fires on surface albedo and surface shortwave forcing (SSF). We used the MODIS shortwave bands (0.3–5.0 µm) daily black sky albedo product (MCD43A3 Version 6) at 500 m spatial resolution between February 2000–January 2024 [44] for all of the study sites, which are contained within the swath boundary of MODIS tile h11v02. SSF is often calculated as a product of incoming shortwave radiation (Rsw) and the prefire and postfire albedo difference [38,45,46]. This study mostly focuses on the high temporal variations of radiative forcing; hence, a slightly modified approach was implemented. Instead of using the pre- and postfire albedo difference, the postfire albedo difference (αf) against the corresponding control site albedo (αc) was calculated:
SSF = −Rswf − αc)
The control sites were carefully selected to have similar vegetation conditions (Figure 3). This method removes the impact of local climate on surface albedo change and SSF, eliminating noise in the data. It provides the opportunity to single out fire as the only factor contributing to the surface albedo change and radiative forcing. To omit the inherent effect instilled by the prefire albedo difference between the fire and the control site on SSF, an adjustment was applied to Equation (1):
SSF = −Rswf − (αc + (αfp − αcp)))
The prefire daily mean albedo for the fire sites (αfp) and for the control sites (αcp) were calculated based on MODIS albedo data from 2001–2010. Daily incoming shortwave radiation measurements were obtained from the FLUXNET-1F US-BZS Bonanza Creek Black Spruce site, located in central Alaska (latitude 64.6963, longitude −148.3235) [47]. The US-BZS site provided surface incoming shortwave radiation data from 2010–2021 across all study sites. All the albedo values were calculated using site-specific MODIS daily albedo values from 2010–2021 to match the incoming shortwave data’s temporal range.

3. Results

3.1. Impact of Fire on Vegetation Composition

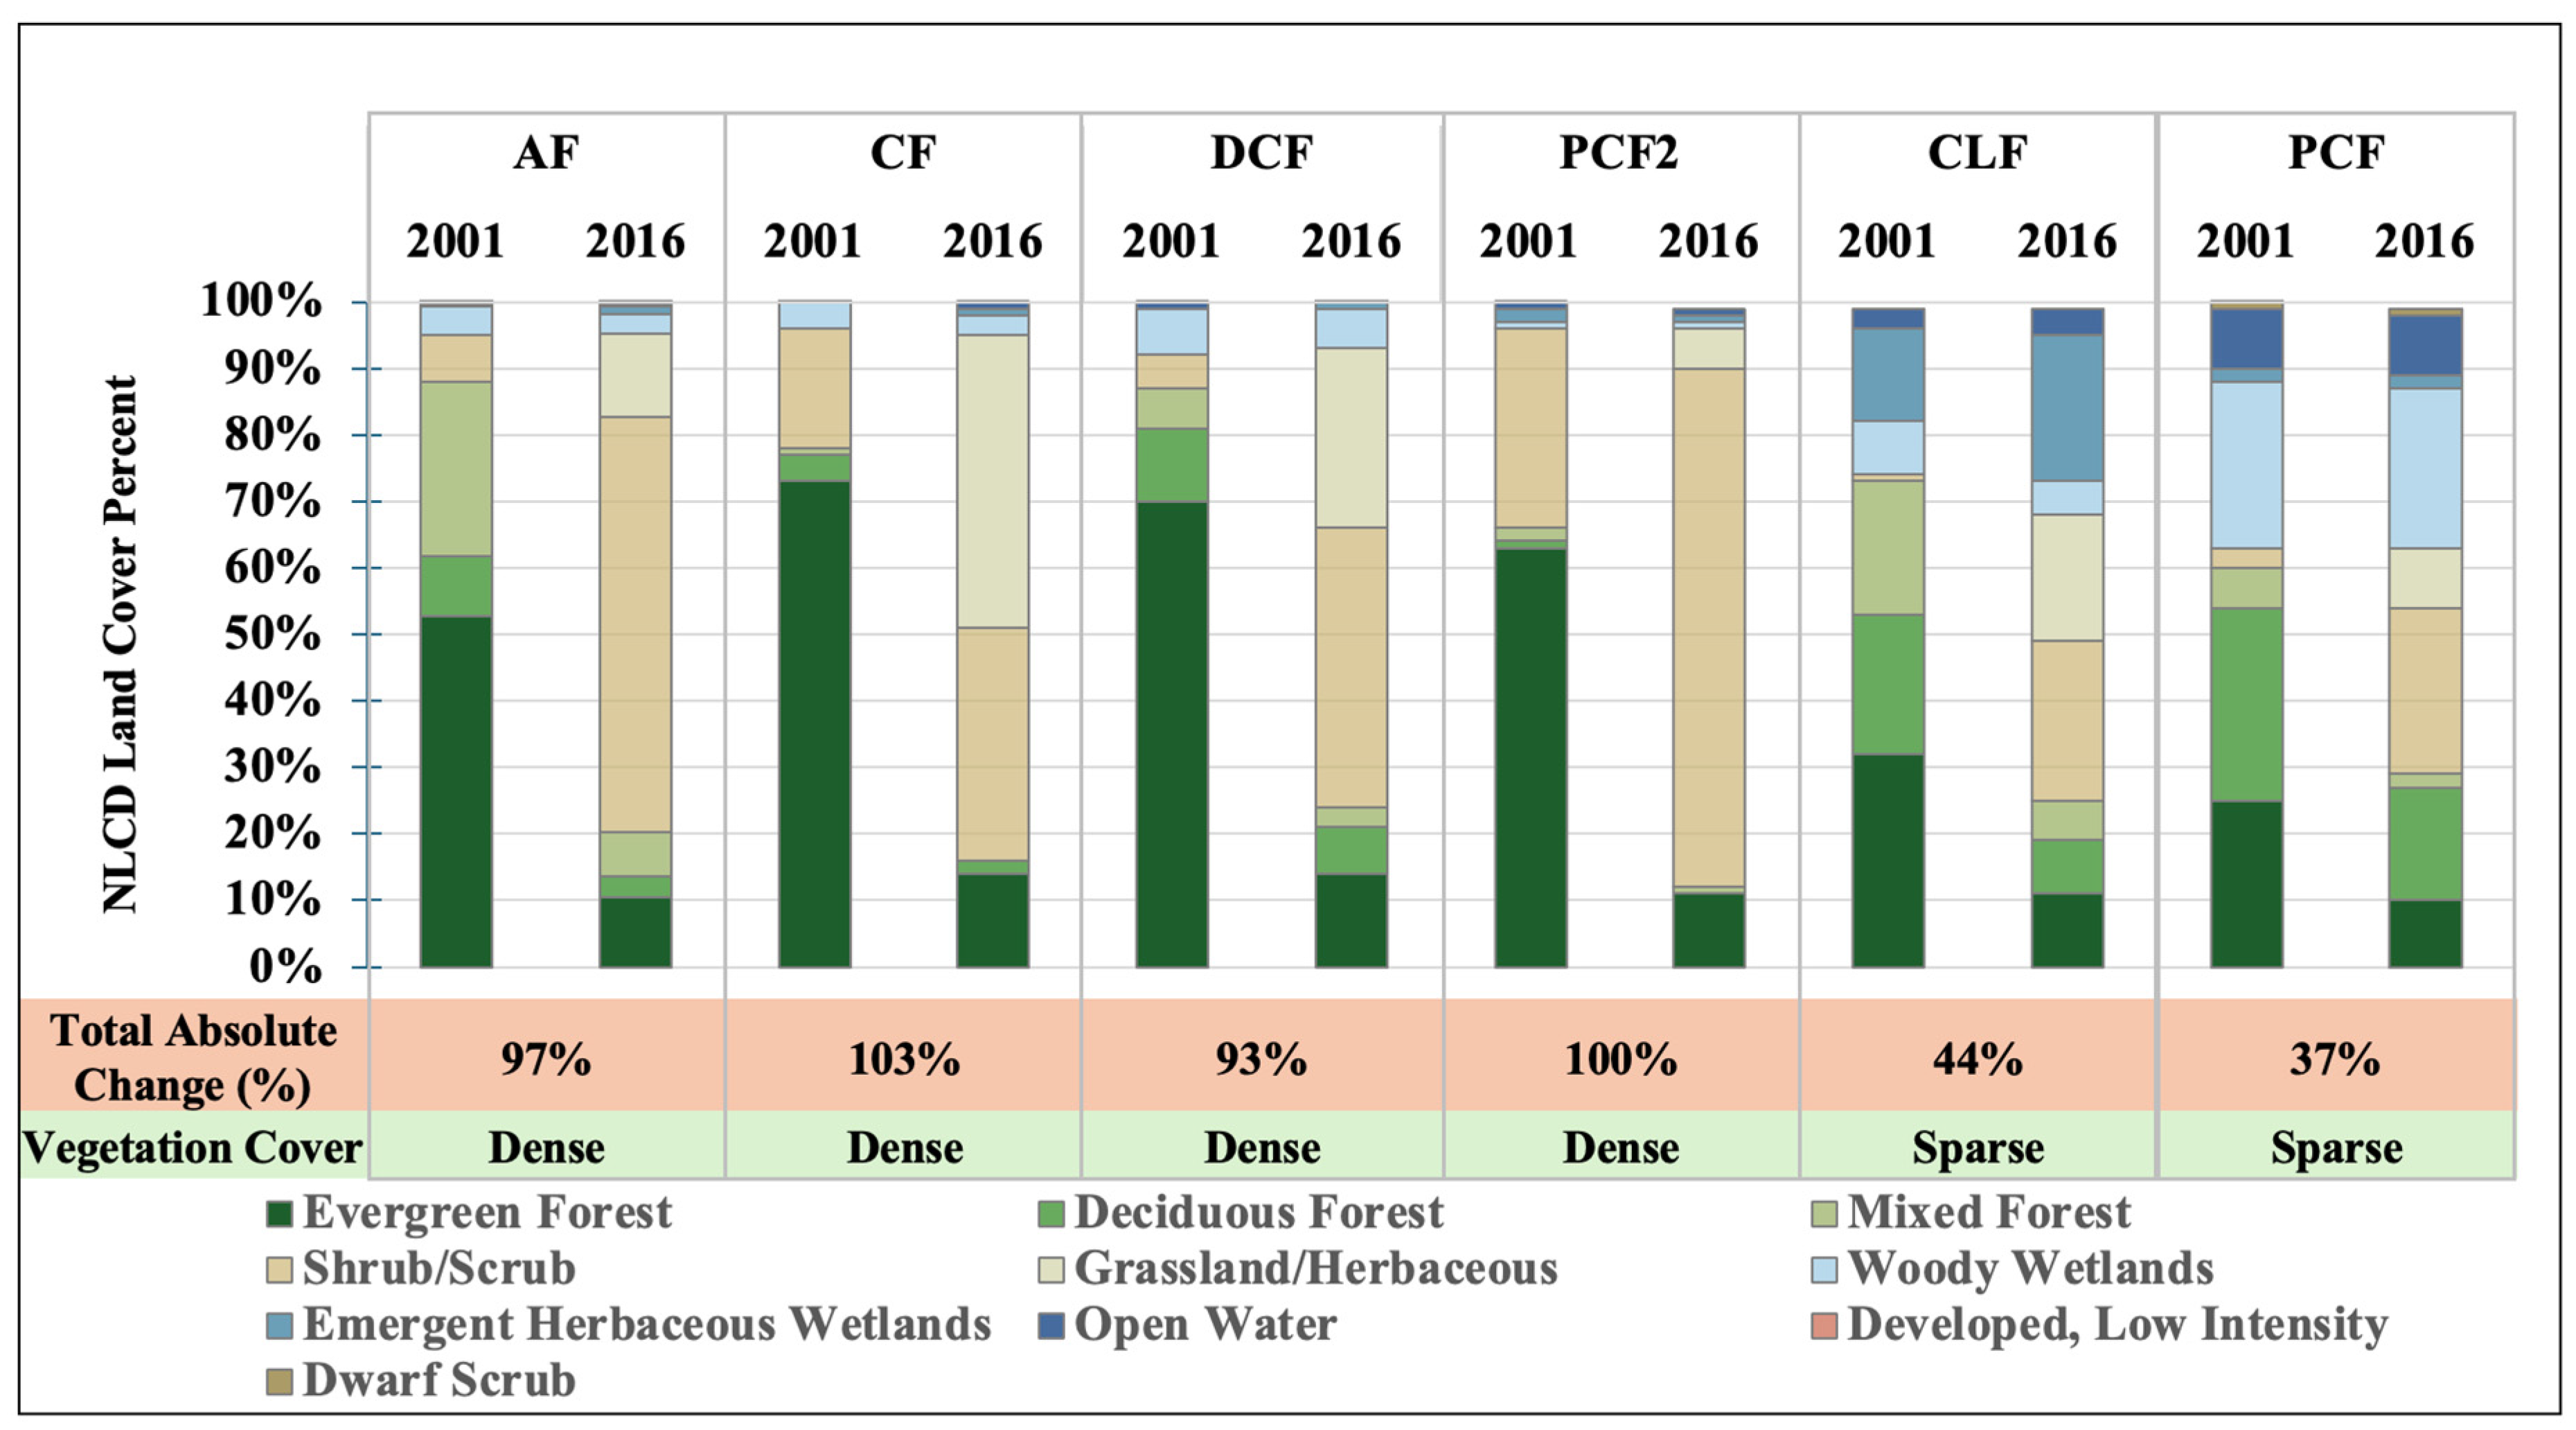
3.1.1. Land Cover Changes

Determining the effect of fires on land cover required comparing burn severity maps to assess the percent area of burn severity across all six sites (Figure 3). We used the burn severity classifications derived from the MTBS dataset for each site. These classifications are obtained within the first year after the fire events, ensuring an accurate representation of the land cover conditions immediately postfire before significant recovery or regrowth occurs. AF had the highest proportion of high-severity class burns, constituting 42% of the total area for this site. Similarly, for CF, the high-severity class comprised 38% of the site’s total area; hence, both exhibited a substantial portion of high-severity burns. In contrast, DCF, PCF2, and CLF predominantly featured moderate-severity burns, with percentages at 27%, 44%, and 23%, respectively. CLF and PCF had the lowest high-severity class burn percentages at 12% and 8%, respectively. CLF and PCF, along with PCF2, also showed some areas of increased greenness, suggesting potential for postfire vegetation recovery or resilience.
Aside from burn severity, the study sites were also categorized by their prefire vegetation density, revealing distinct patterns in vegetation cover (Figure 4). Most sites’ dominant prefire land cover type was evergreen, except for the PCF site, which was dominated by deciduous forest. AF, CF, DCF, and PCF2 were significantly dense, with evergreen accounting for more than 50% of the total land cover. PCF and CLF were of sparse composition, dominated by evergreen, deciduous, and wetlands. This study found that sites with denser vegetation cover and greater availability of fuel experienced more severe fires and significant changes in vegetation cover. We analyzed the land cover changes across all study sites from 2001 to 2016 and found a major shift from high-stature to low-stature vegetation postfire.
In Figure 4, we examined each site’s prefire and postfire land cover using the NLCD 2001 and NLCD 2016 datasets. The dominant postfire land cover type for all study sites was shrub/scrub, which increased from 7% to 62% in the AF site. The change that occurred in burn sites was an increase in low-stature vegetation, such as emergent herbaceous wetland, woody wetland, shrub/scrub, and grassland, and a decrease in high-stature vegetation, such as evergreen. The PCF site, which was sparsely vegetated and dominated by woody wetlands, showed minimal postfire change. Overall, the sites with dense vegetation cover and moderate- to high-severity fires experienced the most change in postfire land cover. The CF site, followed by PCF2 and AF, exhibited significant changes in land cover between 2001 and 2016. These changes may have an impact on regional albedo values, subsequently affecting climate patterns.

3.1.2. Vegetation Density Changes

Pre- and postfire periods were examined for the summer (June–July) and winter (January–March), by implementing average MODIS LAI time series (2003–2023) for all six burn sites to assess the LAI changes caused by fires (Figure 5). To evaluate the prefire vegetation differences between the burned sites and corresponding control sites, Figure 5 also includes LAI for the control sites. LAI is a good indicator of vegetation density, with higher values indicating denser vegetation. Summer LAI for all sites demonstrated a noticeable dip corresponding to the date of the fire, as illustrated in Figure 5. After a few years, summer LAI eventually returned to the prefire LAI level for all sites. It took only three years (2010–2013) for sparse sites (CLF and PCF) to return to prefire LAI levels. In the sparse areas, the LAI continued to increase even after the fires, surpassing the prefire LAI even ten years later. However, the lightly dense and moderately dense sites (AF, CF, and DCF) took approximately ten years to recover to prefire LAI values in summer.
Winter month LAI shows slightly different patterns. Winter LAI was significantly lower than summer LAI. The low-stature vegetation is likely covered by snow during the winter season, and it is important to note that MODIS can detect LAI for taller and visible vegetation more readily than snow-covered vegetation. Postfire LAI reached almost zero for three relatively dense and tall vegetation sites (AF, CF, and DCF) and remained zero a decade after the fire. This variation in summer and winter LAI postfire suggests a potential land cover shift from high-stature to low-stature vegetation. During the winter, snow often covers low-stature vegetation, or deciduous trees shed their leaves, causing winter LAI values to remain low even a decade postfire since the recovery time for evergreen forests is typically longer. For the sites with more sparse vegetation (PCF2, CLF, and PCF), their winter LAI levels were consistently low pre- and postfire, suggesting less prefire high-stature vegetation for these sites than the vegetatively denser sites. Overall, the control sites were relatively more stable and closer to prefire LAI values in burn sites, while there were dynamic changes in the burn sites postfire.

3.2. Fires’ Impact on Snow Melt Timing

The mean difference in snowmelt timing due to fires was calculated between each burn site and its corresponding control site spanning from 2001 to 2018 by utilizing snowmelt timing data derived from MODIS (Figure 6). For most burn sites during the prefire period, the snowmelt dates fluctuated at around zero, indicating that the burn sites and control sites shared comparable snow-melting dates. One exception is the PCF2 site, which shows a primarily negative difference prefire. PCF2 was a sparser site than its corresponding control site even before the fire. Thus, PCF2 experienced earlier snow melts than the control site before the fire.
During the postfire period, all sites exhibited negative slope trendlines in snowmelt date differences except for the AF site. The snowmelt timing at site AF increased after the fire. This suggests that site-specific factors may be influencing postfire snowmelt. The decrease in snowmelt timing in all other sites suggests that fires reduce vegetation cover, resulting in earlier snowmelt postfire; hence, the fire impacted snowmelt timing.

3.3. Impact of Fires on Surface Albedo and Surface Radiative Forcing

3.3.1. Impact of Burn Severity on Surface Albedo

Burn severity has a significant impact on surface albedo. Figure 7 displays daily MODIS surface albedo from 2007 to 2021 at all six sites across different burn severity classes: high, moderate, low, and unburned to low burn severity. A mask reflecting these severity classes was used to isolate and analyze pre- and postfire albedo values for each pixel within its respective severity classes to assess albedo changes. In most study sites, prefire albedo generally decreased with burn severity; the higher the severity class resulted in a lower albedo. The high severity class is likely associated with dense forests, which provide more fuel for the fire. Dense vegetation lowers surface albedo during the snow season. Postfire albedo exhibits an oppositive relationship with the severity class compared to prefire albedo: the higher the severity, the higher the postfire surface albedo. The high-severity class generally started with the lowest prefire albedo values and then reached the highest postfire albedo. Additionally, the high-severity class had the highest increases in albedo, likely due to the extensive clearing of dense forest. In particular, the postfire albedo for the high-severity class in the AF and CF sites shows a long-term increasing trend. The rising trend is likely due to the effect of black carbon on snow albedo with respect to time. Meanwhile, the unburned or low-severity class showed minimal increases in postfire albedo. When considering different types of vegetation, these results highlight the complexity of burn severity’s effect on post-fire albedo.

3.3.2. Impact of Fire on Surface Albedo Increases

To further assess the seasonality of fire-caused albedo changes, we compared the shortwave band (0.3–5.0 µm) monthly surface albedo differences between burn sites and control sites from 2000 to 2022 for the months of October to May (excluding November, December, and January due to limited MODIS data availability) (Figure 8). The prefire albedo differences between burn and control sites were near zero, which implies that the burn and control sites had similar surface conditions.
The postfire albedo differences exhibited a different behavior than prefire albedo differences, being that they were largely positive, suggesting albedo increases after the fire(s). Across all burn sites, a consistent increase in postfire albedo was observed compared to the control site for February, March, and April, illustrating that the postfire albedo increase follows distinct seasonal patterns. During the snow accumulation period (October), postfire albedo shows a slight increase compared to the control sites’ albedo. During the snowmelt period (March and April), postfire albedo shows a persistent increasing trend in the following 12 years after the fire. The increasing trend is especially significant in dense forest sites that experience high-severity fires. A potential cause for this rising trend might be the black carbon effect. In the first few years, right after the fires, the postfire snowpack surface is darkened by black carbon and burnt woody debris, lowering snow albedo [34]. The presence of black carbon is also a function of time since black carbon decomposes in the soil at a rate of 0.5% per year under optimal conditions [48]. The effect black carbon has on snow albedo becomes less significant as time passes, thus resulting in larger surface albedo values and albedo differences between the burn sites and control sites. During the snow-on-ground period (February), the increasing trend reached a plateau one or two years after the fire for all sites except for the two densest sites (AF,CF). Additionally, during the snowmelt period (March and April), for 12 years after the fire, the postfire albedo continued to increase for the relatively dense sites (AF, CF, DCF, and PCF2), suggesting a long-term effect of black carbon on snow surface albedo after the fire. At the end of the snow season (May), the burn site postfire albedo displayed a marginal difference from the control site, suggesting that fires cause little difference in surface albedo when averaged over the month and at the end of the snow season.

3.3.3. Impact of Fires on Surface Shortwave Forcing

The time series of the daily mean surface shortwave radiative forcing (SSF) from 2010 to 2017 across all burn severity classes was analyzed to assess the magnitude of the surface radiative forcing caused by different burn severity (Figure 9). Negative values indicate a higher albedo in burn sites (i.e., reflecting more and absorbing less shortwave radiation by the surface), translating to negative radiation forcing compared to the control sites. Larger albedo could result from more openness due to fires, causing larger surface albedo during the snow season. Positive values suggest lower albedo in the burn site than the control site, which means that the burn sites absorb more shortwave radiation and cause positive radiative forcing. When comparing differences among severity classes, postfire areas with high-severity class burns generally exhibit the most negative values. In contrast, unburned to low-severity areas display the lowest negative radiative forcing values.
During the prefire years, the sites with near zero radiation forcing suggest that the fire and control sites have similar vegetation composition and albedo. An adjustment was made to the control site to account for the albedo differences between the control and burn sites (Equation (2)). However, even with the adjustments, vegetation density for different burn severity classes can be different from control sites. For example, for the PCF2 site, the prefire SSF for the low severity class shows negative radiation forcings, suggesting that the low severity class is even sparser than the control site prefire. On the other hand, high, moderate, and unburned severity classes for the PCF2 site have positive SSF prefire, suggesting that these classes are vegetatively denser than the control site prefire.
Postfire analysis reveals that most burn sites experience negative radiative forcing during the winter and spring, primarily due to increased albedo and greater solar radiation reflection. This negative forcing increases from February to April due to increased incoming shortwave radiation. In the late snowmelt period, a shift to positive radiative forcing was characterized by lower albedo at the burn sites compared to the control sites. This is particularly notable in most sites after fires in the first few years. These positive radiative forcings during the melting period align with snowmelt timing data, which indicate earlier snowmelt at burn sites. Consequently, these sites exhibit lower albedo because of accelerated snowmelt compared to the control sites. Since earlier onset melting occurs right after a fire in the first few years, black carbon might also contribute to lowering surface albedo alongside earlier onset snowmelt. This melting period coincides with increased incoming radiation, giving more importance to the radiative forcing changes at burn sites. In contrast, negative SSF is not as high during the snow accumulation period, while there is also minimal incoming solar radiation, rendering this period less impactful on radiative forcing, especially when compared to the spring. A small amount of negative SSF also appears during the off-snow seasons, suggesting a higher surface albedo postfire compared to the control sites due to changes in vegetation composition (i.e., from evergreen forests to low-stature vegetation). The interplay between fire-induced changes in albedo and snowmelt timing is crucial in determining the radiative balance in the studied regions, with the impact varying across different sites and years, influenced by vegetation structure and burn severity.

4. Discussion

4.1. Burn Severity and Land Cover

A main focus of this study was to examine the relationship between burn severity and vegetation structure and how it subsequently influences snow dynamics, surface albedo, and radiative forcings. For a more comprehensive analysis, study sites with different land cover types (dense and sparse forests) and fire severities (low, moderate, and high severity fires) were chosen. Each site’s NLCD and burn severity maps were analyzed to understand how the land cover type changes after a fire and the impact of burn severity on postfire conditions, as depicted in Figure 3.
This study found that burn severity varies depending on vegetation type, dense vegetation sites experienced high-severity fires compared to sparse vegetation sites (Figure 3). Our results align with Radcliffe, et al. [49], who highlighted how fuel quantity and its arrangement impact fire intensity. Dense vegetation areas, susceptible to high-severity fires, illustrate the role of fuel build-up and connectivity in facilitating high-severity burns. Lower-severity fires are associated with the sites with the highest concentration of low-stature vegetation and deciduous forests (CLF and PCF). Epting and Verbyla [50], also found that the composition of prefire vegetation significantly influences burn severity, with certain vegetation types more vulnerable to high-severity fires. This is because dense vegetation can lead to a greater accumulation of fuel, which, when ignited, supports more intense fires [9,51,52]. Additionally, low-severity fires led to a moderate change in vegetation composition, which aligns with the findings of Johnstone, et al. [53], who observed that low-severity fires often result in the partial removal of the organic layer, thus allowing for quicker recovery of prefire vegetation types, particularly coniferous species that benefit from the residual organic matter. Whereas high-severity fires led to the most significant change in vegetation from dense conifer forests to low-stature grassland from 2001 to 2016 (Figure 4) [51]. Sites with low-severity fires generally recovered to prefire vegetation density levels within the study period. In contrast, high-severity fire burn sites did not recover to the same extent as depicted in Figure 5. The difference in recovery rates highlights the importance of understanding the relationship between vegetation type and burn severity in postfire recovery efforts.

4.2. Impact of Postfire Snow Melting

In boreal forests, changes in vegetation composition caused by fires significantly affect radiation reaching the snow surface, thus causing snowmelt. This study assessed this influence using MODIS snowmelt timing differences between the burn and control sites (Figure 6). Our analysis revealed consistent postfire earlier melt dates compared to the control sites across all six sites except the AF site, which was consistent with results from other studies [32,33,54,55]. Our analysis supports the findings of Uecker et al. [54] which utilized Snowpack Telemetry (SNOTEL) data, which showed that snowmelt occurred earlier. They attribute the early snow melt to increased black carbon deposition and alterations in snow albedo. Our research further confirms that this phenomenon is widespread in boreal forest fires. Fire reduces the duration of the snow season, possibly due to increased solar radiation reaching the snowpack. Hence, earlier onset snowmelt can warm the climatic system, as this phenomenon reduces the overall snow season duration, which lessens the cooling effect of the snow albedo feedback.

4.3. Postfire Albedo Variability

To assess the impact of burn severity classes on changes in albedo, we analyzed albedo differences for different severity classes within each burn site. Our analysis revealed that albedo increases were more pronounced in areas that had experienced high-severity fires. Our findings align with the results presented by Wang et al. [5]. However, Wang et al. [5] found that prefire forest type does not necessarily lead to a significant difference in postfire albedo; all study sites included by Wang et al. had similar land cover types. This study builds upon the aforementioned study by introducing various land cover types and vegetation densities into the selected burn sites. The land cover diversity included within the burn sites allowed for exploring additional layers of complexity regarding the relationship between burn severity and albedo.
We observed a continual increase in albedo throughout the study period, particularly during the snowmelt period in March and April. This continued increase was more pronounced in the high-burn severity sites. The albedo increases reached a plateau a few years after the fire in low-severity sites. However, the increases continued after 12 years of fires for high-severity sites. This long-term albedo increase might be due to the impact of black carbon on snow albedo, as well as the tendency for higher-severity fires to burn more completely, which consequently produces more black carbon [56,57]. Black carbon lowers snow albedo, but it is also important to note that black carbon also decomposes in the soil as a function of time. This makes the effect of black carbon on snow albedo less significant as time passes, thus resulting in larger surface albedo values. This long-term albedo increase in high-severity burn areas echoes the findings by Jin et al. [20], who found that the impact of burn severity on spring season albedo is gradual rather than immediate and intensifies further with age.
Aside from the transient effects of black carbon, The recovery of vegetation after a wildfire is important in determining the albedo trajectories [58]. The type of vegetation that regrows and the rate at which it does so can significantly affect the surface albedo. As the vegetation recovers, its density and type can change, leading to differences in albedo values as the landscape regenerates [4,26]. Additionally, the extent of vegetation recovery is a crucial factor in determining the albedo trajectories.
While conducting the current analysis, we did not utilize ground data. However, we acknowledge that incorporating such information in future studies is crucial to clarify the complicated relationship between burn severity, black carbon deposition, vegetation recovery, and their collective impact on albedo.
This study demonstrates compelling evidence that burn severity significantly influences postfire albedo levels, with higher-severity fires leading to a continual increase in albedo over time. These findings underscore the critical role that burn severity plays in determining albedo values and, consequently, radiative forcing, which is particularly significant in boreal forests with persistent snow cover.

4.4. Surface Shortwave Forcing

Understanding the impact of fires on radiative forcing is essential for assessing climate changes, particularly in high-latitude regions. Radiative forcing, a measure of the influence of factors like albedo on the Earth’s energy balance, is significantly affected by fire-induced changes. Our analysis shows that SSF has significant seasonality. In the snow accumulation months of October and November, our observations indicate that most sites have negative but negligible SSF, which suggests little difference in surface albedo between the burn and control sites. The burn sites feature high surface albedo, but the control sites also have high albedo during the snow accumulation period due to the interception of snow by vegetation. The similar high albedo in the burn and control sites results in negligible SSF during the snow accumulation months. Additionally, during these months, the incoming SW radiation is lower, suggesting that the changes in radiation forcing are not as pronounced as in spring, a period characterized by increased SW radiation. During the winter and spring (February to April), we noted that most burn sites exhibit increasing negative SSF. A notable increase in negative SSF during spring is linked to a rise in incoming shortwave radiation. In spring, Alaska receives more shortwave radiation, which enhances negative radiative forcing, resulting in the maximum SSF in April. We also found that all the burn sites go through periods of positive SSF during the late snowmelt season in May after the first few years postfire. However, these periods are significantly shorter than the longer negative SFF duration observed during winter and spring. This pattern suggests that the cooling effect caused by increased albedo following fires during the snow season may outweigh the warming effect of earlier snowmelt in the melting season. Our observations are consistent with results reported in other studies [8,12,30,31,59]. This study demonstrates the complex balance between fires’ warming and cooling effects. The transition from dense to sparse vegetation following fires seems to amplify the cooling effect during the snow season. Concurrently, the earlier snowmelt at burn sites indicates a warming effect, which could offset the cooling effect. Understanding this balance is vital for climate modeling.

4.5. Limitations

Due to their large spatial scale, MODIS products provide a multidecade-long, continuous, broad view of surface albedo and snow cover. MODIS’s multidecade availability makes it ideal for studying fires and fire impacts on albedo, snowmelt, and postfire recovery. There are some limitations. For example, 30 m spatial resolution burn severity class information was aggregated into 500 m MODIS spatial resolution, which could result in a loss of information and misclassification of severity and land cover classes. Additionally, in our analysis, measurements are averaged across the entire burn site; this approach could mask some finer details and result in information loss despite being beneficial for observing broad trends. In addition, due to the high solar zenith angle and inadequate solar illumination during the winter months in the sites covered in this study, some months (November, December, and January) of MODIS data were missing. All the limitations can impact the precision and accuracy of the studies’ conclusions when studying fires, their effects on albedo and snowmelt, and postfire recovery.

5. Conclusions

This study highlights the significant role of fire-induced vegetation change in modifying surface snow dynamics, surface albedo, and surface radiation feedback. The transformation from dense conifer forests to sparser vegetation increases openness, increasing surface albedo and resulting in negative radiative forcing in the spring. However, the reduced vegetation cover postfire also facilitates more light reaching the ground, accelerating snowmelt, reducing surface albedo, and causing positive radiative forcing during the snowmelt period. The positive and negative SSF varies with the seasons: during the snow accumulation season, there is slight negative forcing due to increased albedo; during the snow season, the forcing is strongly negative; and during the snowmelt season, it turns positive. Postfire, SSF is slightly positive in the snow off-season, mainly in the first few years, then tends to stabilize near zero. Cumulatively, the annual effect leans towards negative forcing and an overall cooling effect. However, understanding the different temporal scales of radiative forcing is crucial for accurately calculating the radiation budget.
In this study, we investigated the impact of fires on the climate system, concentrating on vegetation composition, surface albedo, and snow dynamics while exploring how these factors influence SSF feedback in the climate, particularly during seasonal variations. This multi-decadal analysis in Alaska’s boreal forest, which relied on utilizing MODIS data for albedo and potential snow dynamic changes postfire, reveals that fire impacts on the climate system depend on vegetation types, burn severity, and seasonality. While fires lead to increased surface albedo and a cooling effect during the winter, the reduced vegetation cover accelerates snowmelt during the melting season, potentially warming the climate. This study also grapples with which effect is more significant: the cooling from increased albedo or the warming from early onset snowmelt due to fires. Despite the larger surface albedo and cooling effect during the snow season, the relatively low incoming radiation in Alaska’s boreal forest suggests that the cooling effect may be more substantial than the warming effect of early onset snowmelt. Yet, the overall impact of these competing effects on the climate system depends on various factors, including burn severity and vegetation structure. The limitations of this study, including missing data for certain months and a focus solely on Alaska’s boreal forest, necessitate caution in generalizing these findings. Future research should consider these limitations and broaden the geographical and temporal scope to understand the more significant implications of this paper’s results.

Author Contributions

Conceptualization, M.L. and W.N.-M.; methodology, M.L. and W.N.-M.; formal analysis, M.L. and W.N.-M.; investigation, M.L. and W.N.-M.; data curation, M.L.; writing—original draft preparation, M.L. and W.N.-M.; writing—review and editing, M.L. and W.N.-M.; visualization, M.L.; supervision, W.N.-M.; project administration, W.N.-M.; funding acquisition, W.N.-M. All authors have read and agreed to the published version of the manuscript.

Funding

This research was funded by NASA, grant number 80NSSC20K1718.

Data Availability Statement

The original contributions presented in the study are included in the article, further inquiries can be directed to the corresponding author/s.

Conflicts of Interest

The authors declare no conflicts of interest.

Appendix A

Table A1. Burn sites information.
FireFire NameDateSize (km2)Fire TypeLatitudeLongitudeLand Type
AFApplegate26/05/201074.27Wildfire65.189−150.056Evergreen Forest, Deciduous Forest, Mixed Forest, Shrub/Scrub, Woody Wetland, Emergent Herbaceous Wetland
CFChitanatala26/05/2010143.98Wildfire64.752−151.77Evergreen Forest, Deciduous Forest, Mixed Forest, Shrub/Scrub, Woody Wetland, Open Water, Emergent Herbaceous Wetland, Moss, Grassland/Herbaceous,
DCFDempsey Creek04/06/201052.1Wildfire66.135−142.108Evergreen Forest, Deciduous Forest, Mixed Forest, Shrub/Scrub, Woody Wetland, Open Water
PCF2Peavey Creek01/07/2010124.12Wildfire66.726−151.855Evergreen Forest, Deciduous Forest, Mixed Forest, Shrub/Scrub, Woody Wetland, Open Water, Emergent Herbaceous Wetland, Barren Land, Dwarf Scrub, Sedge/Herbaceous, Grassland/Herbaceous
CLFCanvasback Lake12/07/2010141.29Wildfire66.421−146.489Evergreen Forest, Deciduous Forest, Mixed Forest, Shrub/Scrub, Woody Wetland, Open Water, Emergent Herbaceous Wetland, Barren Land, Dwarf Scrub, Sedge/Herbaceous
PCFPat Creek25/06/2010291.62Wildfire66.273−148.507Evergreen Forest, Deciduous Forest, Mixed Forest Shrub/Scrub, Woody Wetland, Emergent Herbaceous Wetland, Open Water, Dwarf Scrub

References

  1. Serreze, M.C.; Barry, R.G. Processes and impacts of Arctic amplification: A research synthesis. Glob. Planet. Chang. 2011, 77, 85–96. [Google Scholar] [CrossRef]
  2. Bekryaev, R.V.; Polyakov, I.V.; Alexeev, V.A. Role of Polar Amplification in Long-Term Surface Air Temperature Variations and Modern Arctic Warming. J. Clim. 2010, 23, 3888–3906. [Google Scholar] [CrossRef]
  3. Soja, A.J.; Tchebakova, N.M.; French, N.H.F.; Flannigan, M.D.; Shugart, H.H.; Stocks, B.J.; Sukhinin, A.I.; Parfenova, E.I.; Chapin, F.S.; Stackhouse, P.W. Climate-induced boreal forest change: Predictions versus current observations. Glob. Planet. Chang. 2007, 56, 274–296. [Google Scholar] [CrossRef]
  4. Beck, P.S.A.; Goetz, S.J.; Mack, M.C.; Alexander, H.D.; Jin, Y.; Randerson, J.T.; Loranty, M.M. The impacts and implications of an intensifying fire regime on Alaskan boreal forest composition and albedo. Glob. Chang. Biol. 2011, 17, 2853–2866. [Google Scholar] [CrossRef]
  5. Wang, Z.; Erb, A.M.; Schaaf, C.B.; Sun, Q.; Liu, Y.; Yang, Y.; Shuai, Y.; Casey, K.A.; Román, M.O. Early spring post-fire snow albedo dynamics in high latitude boreal forests using Landsat-8 OLI data. Remote Sens. Environ. 2016, 185, 71–83. [Google Scholar] [CrossRef] [PubMed]
  6. Balshi, M.S.; McGuire, A.D.; Duffy, P.; Flannigan, M.; Walsh, J.; Melillo, J. Assessing the response of area burned to changing climate in western boreal North America using a Multivariate Adaptive Regression Splines (MARS) approach. Glob. Chang. Biol. 2009, 15, 578–600. [Google Scholar] [CrossRef]
  7. Potter, S.; Solvik, K.; Erb, A.; Goetz, S.J.; Johnstone, J.F.; Mack, M.C.; Randerson, J.T.; Román, M.O.; Schaaf, C.L.; Turetsky, M.R.; et al. Climate change decreases the cooling effect from postfire albedo in boreal North America. Glob. Chang. Biol. 2020, 26, 1592–1607. [Google Scholar] [CrossRef]
  8. Rogers, B.M.; Randerson, J.T.; Bonan, G.B. High-latitude cooling associated with landscape changes from North American boreal forest fires. Biogeosciences 2013, 10, 699–718. [Google Scholar] [CrossRef]
  9. Johnstone, J.F.; Rupp, T.S.; Olson, M.; Verbyla, D. Modeling impacts of fire severity on successional trajectories and future fire behavior in Alaskan boreal forests. Landsc. Ecol. 2011, 26, 487–500. [Google Scholar] [CrossRef]
  10. Bodí, M.B.; Martin, D.A.; Balfour, V.N.; Santín, C.; Doerr, S.H.; Pereira, P.; Cerdà, A.; Mataix-Solera, J. Wildland fire ash: Production, composition and eco-hydro-geomorphic effects. Earth-Sci. Rev. 2014, 130, 103–127. [Google Scholar] [CrossRef]
  11. McGuire, A.D.; Anderson, L.G.; Christensen, T.R.; Dallimore, S.; Guo, L.; Hayes, D.J.; Heimann, M.; Lorenson, T.D.; Macdonald, R.W.; Roulet, N. Sensitivity of the Carbon Cycle in the Arctic to Climate Change. Ecol. Monogr. 2009, 79, 523–555. [Google Scholar] [CrossRef]
  12. Randerson, J.T.; Liu, H.; Flanner, M.G.; Chambers, S.D.; Jin, Y.; Hess, P.G.; Pfister, G.; Mack, M.C.; Treseder, K.K.; Welp, L.R.; et al. The Impact of Boreal Forest Fire on Climate Warming. Science 2006, 314, 1130–1132. [Google Scholar] [CrossRef] [PubMed]
  13. Massey, R.; Rogers, B.M.; Berner, L.T.; Cooperdock, S.; Mack, M.C.; Walker, X.J.; Goetz, S.J. Forest composition change and biophysical climate feedbacks across boreal North America. Nat. Clim. Chang. 2023, 13, 1368–1375. [Google Scholar] [CrossRef] [PubMed]
  14. Amiro, B.D.; Orchansky, A.L.; Barr, A.G.; Black, T.A.; Chambers, S.D.; Chapin Iii, F.S.; Goulden, M.L.; Litvak, M.; Liu, H.P.; McCaughey, J.H.; et al. The effect of post-fire stand age on the boreal forest energy balance. Agric. For. Meteorol. 2006, 140, 41–50. [Google Scholar] [CrossRef]
  15. Ni, W.; Li, X.; Woodcock, C.E.; Caetano, M.R.; Strahler, A.H. An analytical hybrid GORT model for bidirectional reflectance over discontinuous plant canopies. IEEE Trans. Geosci. Remote Sens. 1999, 37, 987–999. [Google Scholar] [CrossRef]
  16. Huang, C.; Feng, J.; Tang, F.; He, H.S.; Liang, Y.; Wu, M.M.; Xu, W.; Liu, B.; Shi, F.; Chen, F. Predicting the responses of boreal forests to climate-fire-vegetation interactions in Northeast China. Environ. Model. Softw. 2022, 153, 105410. [Google Scholar] [CrossRef]
  17. Dawe, D.A.; Parisien, M.-A.; Van Dongen, A.; Whitman, E. Initial succession after wildfire in dry boreal forests of northwestern North America. Plant Ecol. 2022, 223, 789–809. [Google Scholar] [CrossRef]
  18. Kasischke, E.S.; Turetsky, M.R. Recent changes in the fire regime across the North American boreal region—Spatial and temporal patterns of burning across Canada and Alaska. Geophys. Res. Lett. 2006, 33. [Google Scholar] [CrossRef]
  19. Mack, M.C.; Walker, X.J.; Johnstone, J.F.; Alexander, H.D.; Melvin, A.M.; Jean, M.; Miller, S.N. Carbon loss from boreal forest wildfires offset by increased dominance of deciduous trees. Science 2021, 372, 280–283. [Google Scholar] [CrossRef]
  20. Jin, Y.; Randerson, J.T.; Goetz, S.J.; Beck, P.S.A.; Loranty, M.M.; Goulden, M.L. The influence of burn severity on postfire vegetation recovery and albedo change during early succession in North American boreal forests. J. Geophys. Res. Biogeosci. 2012, 117. [Google Scholar] [CrossRef]
  21. Nath, B.; Ni-Meister, W. The Interplay between Canopy Structure and Topography and Its Impacts on Seasonal Variations in Surface Reflectance Patterns in the Boreal Region of Alaska—Implications for Surface Radiation Budget. Remote Sens. 2021, 13, 3108. [Google Scholar] [CrossRef]
  22. O’Halloran, T.L.; Acker, S.A.; Joerger, V.M.; Kertis, J.; Law, B.E. Postfire influences of snag attrition on albedo and radiative forcing. Geophys. Res. Lett. 2014, 41, 9135–9142. [Google Scholar] [CrossRef]
  23. Ni-Meister, W.; Yang, W.; Kiang, N.Y. A clumped-foliage canopy radiative transfer model for a global dynamic terrestrial ecosystem model. I: Theory. Agric. For. Meteorol. 2010, 150, 881–894. [Google Scholar] [CrossRef]
  24. Yang, W.; Ni-Meister, W.; Kiang, N.Y.; Moorcroft, P.R.; Strahler, A.H.; Oliphant, A. A clumped-foliage canopy radiative transfer model for a Global Dynamic Terrestrial Ecosystem Model II: Comparison to measurements. Agric. For. Meteorol. 2010, 150, 895–907. [Google Scholar] [CrossRef]
  25. Ni, W.; Li, X.; Woodcock, C.E.; Roujean, J.L.; Davis, R.E. Transmission of solar radiation in boreal conifer forests: Measurements and models. J. Geophys. Res. Atmos. 1997, 102, 29555–29566. [Google Scholar] [CrossRef]
  26. Lyons, E.A.; Jin, Y.; Randerson, J.T. Changes in surface albedo after fire in boreal forest ecosystems of interior Alaska assessed using MODIS satellite observations. J. Geophys. Res. Biogeosci. 2008, 113. [Google Scholar] [CrossRef]
  27. Ni, W.; Woodcock, C.E. Effect of canopy structure and the presence of snow on the albedo of boreal conifer forests. J. Geophys. Res. Atmos. 2000, 105, 11879–11888. [Google Scholar] [CrossRef]
  28. Hovi, A.; Lindberg, E.; Lang, M.; Arumäe, T.; Peuhkurinen, J.; Sirparanta, S.; Pyankov, S.; Rautiainen, M. Seasonal dynamics of albedo across European boreal forests: Analysis of MODIS albedo and structural metrics from airborne LiDAR. Remote Sens. Environ. 2019, 224, 365–381. [Google Scholar] [CrossRef]
  29. Koshkin, A.L.; Hatchett, B.J.; Nolin, A.W. Wildfire impacts on western United States snowpacks. Front. Water 2022, 4, 971271. [Google Scholar] [CrossRef]
  30. O’Halloran, T.L.; Law, B.E.; Goulden, M.L.; Wang, Z.; Barr, J.G.; Schaaf, C.; Brown, M.; Fuentes, J.D.; Göckede, M.; Black, A.; et al. Radiative forcing of natural forest disturbances. Glob. Chang. Biol. 2012, 18, 555–565. [Google Scholar] [CrossRef]
  31. Oris, F.; Asselin, H.; Ali, A.A.; Finsinger, W.; Bergeron, Y. Effect of increased fire activity on global warming in the boreal forest. Environ. Rev. 2014, 22, 206–219. [Google Scholar] [CrossRef]
  32. Gleason, K.E.; Nolin, A.W. Charred forests accelerate snow albedo decay: Parameterizing the post-fire radiative forcing on snow for three years following fire. Hydrol. Process. 2016, 30, 3855–3870. [Google Scholar] [CrossRef]
  33. Burles, K.; Boon, S. Snowmelt energy balance in a burned forest plot, Crowsnest Pass, Alberta, Canada. Hydrol. Process. 2011, 25, 3012–3029. [Google Scholar] [CrossRef]
  34. Gersh, M.; Gleason, K.E.; Surunis, A. Forest Fire Effects on Landscape Snow Albedo Recovery and Decay. Remote Sens. 2022, 14, 4079. [Google Scholar] [CrossRef]
  35. Giovando, J.; Niemann, J.D. Wildfire Impacts on Snowpack Phenology in a Changing Climate Within the Western U.S. Water Resour. Res. 2022, 58, e2021WR031569. [Google Scholar] [CrossRef]
  36. Douglas, T.A.; Zhang, C. Machine learning analyses of remote sensing measurements establish strong relationships between vegetation and snow depth in the boreal forest of Interior Alaska. Environ. Res. Lett. 2021, 16, 065014. [Google Scholar] [CrossRef]
  37. Lindsay, C.; Zhu, J.; Miller, A.; Kirchner, P.; Wilson, T. Deriving Snow Cover Metrics for Alaska from MODIS. Remote Sens. 2015, 7, 12961–12985. [Google Scholar] [CrossRef]
  38. French, N.H.F.; Whitley, M.A.; Jenkins, L.K. Fire disturbance effects on land surface albedo in Alaskan tundra. J. Geophys. Res. Biogeosci. 2016, 121, 841–854. [Google Scholar] [CrossRef]
  39. Hawotte, F.; Radoux, J.; Chomé, G.; Defourny, P. Assessment of Automated Snow Cover Detection at High Solar Zenith Angles with PROBA-V. Remote Sens. 2016, 8, 699. [Google Scholar] [CrossRef]
  40. Eidenshink, J.; Schwind, B.; Brewer, K.; Zhu, Z.-L.; Quayle, B.; Howard, S. A Project for Monitoring Trends in Burn Severity. Fire Ecol. 2007, 3, 3–21. [Google Scholar] [CrossRef]
  41. Homer, C.; Dewitz, J.; Fry, J.; Coan, M.; Hossain, N.; Larson, C.; Herold, N.; McKerrow, A.; Nick Vandriel, J.; Wickham, J. Completion of the 2001 national land cover database for the conterminous United States. Photogramm. Eng. Remote Sens. 2007, 73, 337–341. [Google Scholar]
  42. Kai, Y.; Taejin, P.; Guangjian, Y.; Chi, C.; Bin, Y.; Zhao, L.; Nemani, R.R.; Yuri, K.; Myneni, R.B. Evaluation of MODIS LAI/FPAR Product Collection 6. Part 1: Consistency and Improvements. Remote Sens. 2016, 8, 359. [Google Scholar] [CrossRef]
  43. O’Leary, D., III; Hall, D.K.; Medler, M.; Matthews, R.; Flower, A. Snowmelt Timing Maps Derived from MODIS for North America, Version 2, 2001–2018; ORNL Distributed Active Archive Center: Oak Ridge, TN, USA, 2019. [CrossRef]
  44. Schaaf, C.B.; Gao, F.; Strahler, A.H.; Lucht, W.; Li, X.; Tsang, T.; Strugnell, N.C.; Zhang, X.; Jin, Y.; Muller, J.-P.; et al. First operational BRDF, albedo nadir reflectance products from MODIS. Remote Sens. Environ. 2002, 83, 135–148. [Google Scholar] [CrossRef]
  45. Huang, S.; Dahal, D.; Liu, H.; Jin, S.; Young, C.; Li, S.; Liu, S. Spatiotemporal variation of surface shortwave forcing from fire-induced albedo change in interior Alaska. Can. J. For. Res. 2015, 45, 276–285. [Google Scholar] [CrossRef]
  46. Jin, Y.; Roy, D.P. Fire-induced albedo change and its radiative forcing at the surface in northern Australia. Geophys. Res. Lett. 2005, 32. [Google Scholar] [CrossRef]
  47. Euskirchen, E. AmeriFlux FLUXNET-1F US-BZS Bonanza Creek Black Spruce; Ver. 3–5, AmeriFlux AMP, (Dataset); University of Alaska Fairbanks: Fairbanks, Alaska, 2022. [Google Scholar] [CrossRef]
  48. Kuzyakov, Y.; Subbotina, I.; Chen, H.; Bogomolova, I.; Xu, X. Black carbon decomposition and incorporation into soil microbial biomass estimated by 14C labeling. Soil Biol. Biochem. 2009, 41, 210–219. [Google Scholar] [CrossRef]
  49. Radcliffe, D.C.; Bakker, J.D.; Churchill, D.J.; Alvarado, E.C.; Peterson, D.W.; Laughlin, M.M.; Harvey, B.J. How are long-term stand structure, fuel profiles, and potential fire behavior affected by fuel treatment type and intensity in Interior Pacific Northwest forests? For. Ecol. Manag. 2024, 553, 121594. [Google Scholar] [CrossRef]
  50. Epting, J.; Verbyla, D. Landscape-level interactions of prefire vegetation, burn severity, and postfire vegetation over a 16-year period in interior Alaska. Can. J. For. Res. 2005, 35, 1367–1377. [Google Scholar] [CrossRef]
  51. Coppoletta, M.; Merriam, K.E.; Collins, B.M. Post-fire vegetation and fuel development influences fire severity patterns in reburns. Ecol. Appl. 2016, 26, 686–699. [Google Scholar] [CrossRef]
  52. Whitman, E.; Parisien, M.A.; Thompson, D.K.; Hall, R.J.; Skakun, R.S.; Flannigan, M.D. Variability and drivers of burn severity in the northwestern Canadian boreal forest. Ecosphere 2018, 9, e02128. [Google Scholar] [CrossRef]
  53. Johnstone, J.F.; Hollingsworth, T.N.; Chapin, F.S.; Mack, M.C. Changes in fire regime break the legacy lock on successional trajectories in Alaskan boreal forest. Glob. Chang. Biol. 2010, 16, 1281–1295. [Google Scholar] [CrossRef]
  54. Uecker, T.M.; Kaspari, S.D.; Musselman, K.N.; McKenzie Skiles, S. The Post-Wildfire Impact of Burn Severity and Age on Black Carbon Snow Deposition and Implications for Snow Water Resources, Cascade Range, Washington. J. Hydrometeorol. 2020, 21, 1777–1792. [Google Scholar] [CrossRef]
  55. Kampf, S.K.; McGrath, D.; Sears, M.G.; Fassnacht, S.R.; Kiewiet, L.; Hammond, J.C. Increasing wildfire impacts on snowpack in the western U.S. Proc. Natl. Acad. Sci. USA 2022, 119, e2200333119. [Google Scholar] [CrossRef] [PubMed]
  56. Alexander, H.D.; Mack, M.C.; Goetz, S.; Beck, P.S.A.; Belshe, E.F. Implications of increased deciduous cover on stand structure and aboveground carbon pools of Alaskan boreal forests. Ecosphere 2012, 3, art45. [Google Scholar] [CrossRef]
  57. Hart, S.J.; Henkelman, J.; McLoughlin, P.D.; Nielsen, S.E.; Truchon-Savard, A.; Johnstone, J.F. Examining forest resilience to changing fire frequency in a fire-prone region of boreal forest. Glob. Chang. Biol. 2019, 25, 869–884. [Google Scholar] [CrossRef] [PubMed]
  58. Jin, Y.; Randerson, J.T.; Goulden, M.L.; Goetz, S.J. Post-fire changes in net shortwave radiation along a latitudinal gradient in boreal North America. Geophys. Res. Lett. 2012, 39. [Google Scholar] [CrossRef]
  59. Liu, Z.; Ballantyne, A.P.; Cooper, L.A. Biophysical feedback of global forest fires on surface temperature. Nat. Commun. 2019, 10, 214. [Google Scholar] [CrossRef]
Figure 1. The study sites are in the center of Alaska, covering six burn sites (red) and their corresponding control sites (blue).
Remotesensing 16 01461 g001
Figure 2. Flowchart of Data Processing and Analysis.
Remotesensing 16 01461 g002
Figure 3. Column one displays burn severity percent distributions for each site, indicating the extent of fire impact. Column two features corresponding burn severity maps visually representing the distribution of burn severity classes. Columns three and four contrast the NLCD 2001 prefire and NLCD 2016 postfire land cover maps, illustrating changes in vegetation over time. The fifth column provides the NLCD 2001 land cover maps for control sites.
Remotesensing 16 01461 g003
Figure 4. 2001 and 2016 NLCD Land Cover Percent for Burn Sites. The stacked bars show the percentage of different land cover types at each burn site location in 2001 and 2016, derived from the National Land Cover Database (NLCD). Land cover categories include evergreen forest, deciduous forest, shrub/scrub, emergent herbaceous wetlands, woody wetlands, grassland/herbaceous, open water, and developed/low-intensity areas. The total absolute change percentage and vegetation cover density classifications (dense vs. sparse) are provided for each burn site between the two time periods. This allows for visualizing the impact of fires on shifting land cover compositions and forest density at these locations over 15 years.
Remotesensing 16 01461 g004
Figure 5. The summer months (June, July, and August) and Winter Months (January, February, and March) LAI values for all study sites and control sites over two decades. The red dashed line represents the wildfires.
Remotesensing 16 01461 g005
Figure 6. The mean difference in snowmelt dates (black solid) between each site and its control site from 2001 to 2018. Trendlines, represented in blue, depicts the prefire trajectory of changes in snowmelt timing, while the red trendline indicates the general postfire trajectory of these changes. The slope of each trendline is provided in the legend for reference.
Remotesensing 16 01461 g006
Figure 7. Time series of albedo for different burn severity classes across all burn sites from 2007 to 2021. The black dotted line marks the fire.
Remotesensing 16 01461 g007
Figure 8. Monthly mean differences (black solid) in albedo between fire and control sites. Pre- (dotted blue line) and postfire (dotted red line) trendlines indicate the general trajectory of changes in albedo difference over the time series, with the slope of each trendline provided in the legend.
Remotesensing 16 01461 g008
Figure 9. Daily mean Surface Shortwave Forcing (SSF) across various burn severity classes spanning from 2010 to 2017.
Remotesensing 16 01461 g009
Disclaimer/Publisher’s Note: The statements, opinions and data contained in all publications are solely those of the individual author(s) and contributor(s) and not of MDPI and/or the editor(s). MDPI and/or the editor(s) disclaim responsibility for any injury to people or property resulting from any ideas, methods, instructions or products referred to in the content.

