1. Introduction
Super-resolution technology is a key technology in the field of digital image processing and computer vision [
1]. It is widely used in medical imaging [
2], digital photography [
3], video surveillance [
4], remote sensing images [
5], and other fields. At present, remote sensing imaging technology has been applied to many industries such as forestry, agriculture, meteorology, and environmental protection [
6]. High-resolution remote sensing images can enable us to obtain more accurate information in environmental monitoring and resource management, urban planning and land management, disaster and weather forecasting, crop-growth identification, and other fields. It is conducive to promote social progress and development. In the shooting process of remote sensing images, the quality of images may be limited by many reasons such as equipment quality, shooting conditions, and atmospheric environment, resulting in blurred images [
7]. The goal of super-resolution (SR) reconstruction technology for remote sensing images is to enhance the resolution of low-resolution (LR) images by reconstructing them into high-resolution (HR) images. Traditional super-resolution reconstruction algorithms for remote sensing images include nearest neighbor interpolation [
8], bicubic interpolation [
9], adaptive image interpolation [
10,
11,
12], sparse coding techniques [
13,
14,
15,
16], etc.
However, the super-resolution reconstruction of remote sensing images based on deep learning has become a research hotspot nowadays. Super-Resolution Convolutional Neural Network (SRCNN) is a neural network model proposed by Dong et al. [
17]. It directly learns the end-to-end mapping between low-resolution and high-resolution images, and uses local perception domain, nonlinear mapping, and minimizing mean square error methods to reconstruct the images. The model is fully feedforward, and does not need to solve any optimization problems regarding usage. It can quickly reconstruct high-resolution images with higher accuracy than traditional super-resolution methods. Very Deep super-resolution (VDSR), based on the deep residual network, is an improved method that Kim et al. [
18] introduced residual learning into Super Resolution reconstruction models. By using the idea of residuals, the model learns the residuals between image pairs and adds the residuals to the input image to obtain a high-resolution image. This method is a very deep convolutional neural network, which has higher accuracy and better image reconstruction effect than SRCNN. Enhanced Deep Super-Resolution (EDSR) is an enhanced single-image super-resolution algorithm proposed by Lim et al. [
19]. It is based on an improved ResNet architecture and residual-scaling techniques. The algorithm simplifies the network structure and uses multi-layer residual modules to learn high-level features of the image, thus achieving high-quality super-resolution reconstruction. It is an efficient deep residual network model which can effectively deal with super-resolution problems and improve reconstruction quality while reducing parameters and increasing speed. Super-Resolution Generative Adversarial Network (SRGAN) is an image super-resolution reconstruction algorithm proposed by Ledig et al. [
20]. It uses two convolutional neural network models to learn how to improve the resolution of images. The generator model is responsible for generating realistic target images from random noise, while the discriminator model is responsible for determining whether the images are real or fake images generated by the generator. This method can not only produce clear and natural high-resolution images, but also make the generated detailed textures more realistic.
Currently, there exist numerous super-resolution reconstruction algorithms, yet challenges persist within the image reconstruction procedure. For remote sensing images with rich textures and complex objects, it is often difficult to deal with complex scenes by interpolation and simple reconstruction methods [
21]. The convolutional neural network-based super resolution algorithm may make the reconstructed image appear too smooth, resulting that the original details in the image are lost. Deep recursive network has the problem of gradient disappearing or explosion, and overfitting may occur during training, resulting in poor generalization performance of test set. In the process of image fractals, some detail information may be lost, it can lead to the lack of realism and detail in the reconstructed image, and even lead to the change of image color. At the same time, we note some immune based machine learning algorithms have good reference value for image super-resolution reconstruction of remote sensing, such as Non-linear statistical image watermark detector [
22], Blurred Infrared Image Segmentation Using New Immune Algorithm with Minimum Mean Distance Immune Field [
23], Infrared image segmentation using growing immune field and clone threshold [
24], and Target extraction of banded blurred infrared images by immune dynamical algorithm with two-dimensional minimum distance immune field [
25]. The immune algorithms and image processing methods involved in these studies also provide some inspiration for our research on super-resolution reconstruction of remote sensing images. To solve the problems presenting in current reconstruction algorithms of super-resolution, this article proposes a new model based on generative adversarial networks, namely the SRGAN-MSAM-DRC model (SRGAN model with Multi-Scale Attention Mechanism and Dense Residual Connection). The experimental results show that images reconstructed by the SRGAN-MSAM-DRC model have enhancement in various evaluations compared to the basic SRGAN model. Here are the main contributions of this article:
- (1)
Introducing Pyramid Segmentation Attention (PSA) mechanism into the generator model of SRGAN, which makes the model effectively extract multi-scale spatial information at a finer level.
- (2)
Introducing dense residual connections in the generator model of SRGAN, which makes the model better capture the complex features of input remote sensing images and reconstruct images with more detailed features.
- (3)
Adding residual blocks to the discriminator model of SRGAN to deepen the network depth and make the network more focused on extracting the details of the image.
2. Related Search
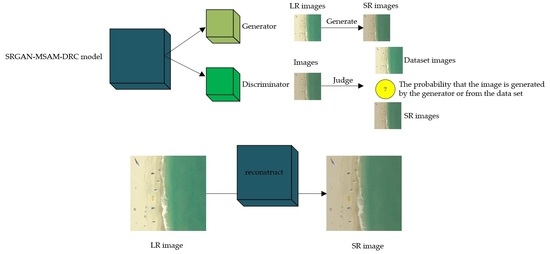
The researchers propose a new framework for generating models through adversarial training. One is generative model, which generates images from acquired data. The other is the discriminant model, which calculates the probability that the sample comes from data trained by the model rather than generated by the generator. The researchers named the network GAN [
26].
The convergence of GAN has been rigorously demonstrated by researchers. Under the condition that the generator and discriminator are large enough, in the iterative process, if the discriminator model can reach the optimal value at the given generator model, the generator model will be updated and the generator will converge. This proof has enabled GANs to receive more attention, improvement, and wider application than many other deep learning models [
27].
SRGAN uses an adversarial combination of deep neural networks and GAN to learn how to generate images. Its generator uses a combination of convolution layers, BN layers, pixel convolution layers and activation functions. It generates the image by downsampling and then upsampling. Similarly, its discriminator uses many convolutional layers, BN layers, LeakyReLU activation functions, and Sigmoid activation functions to determine whether the image is the original image or the image generated by the generator [
20].
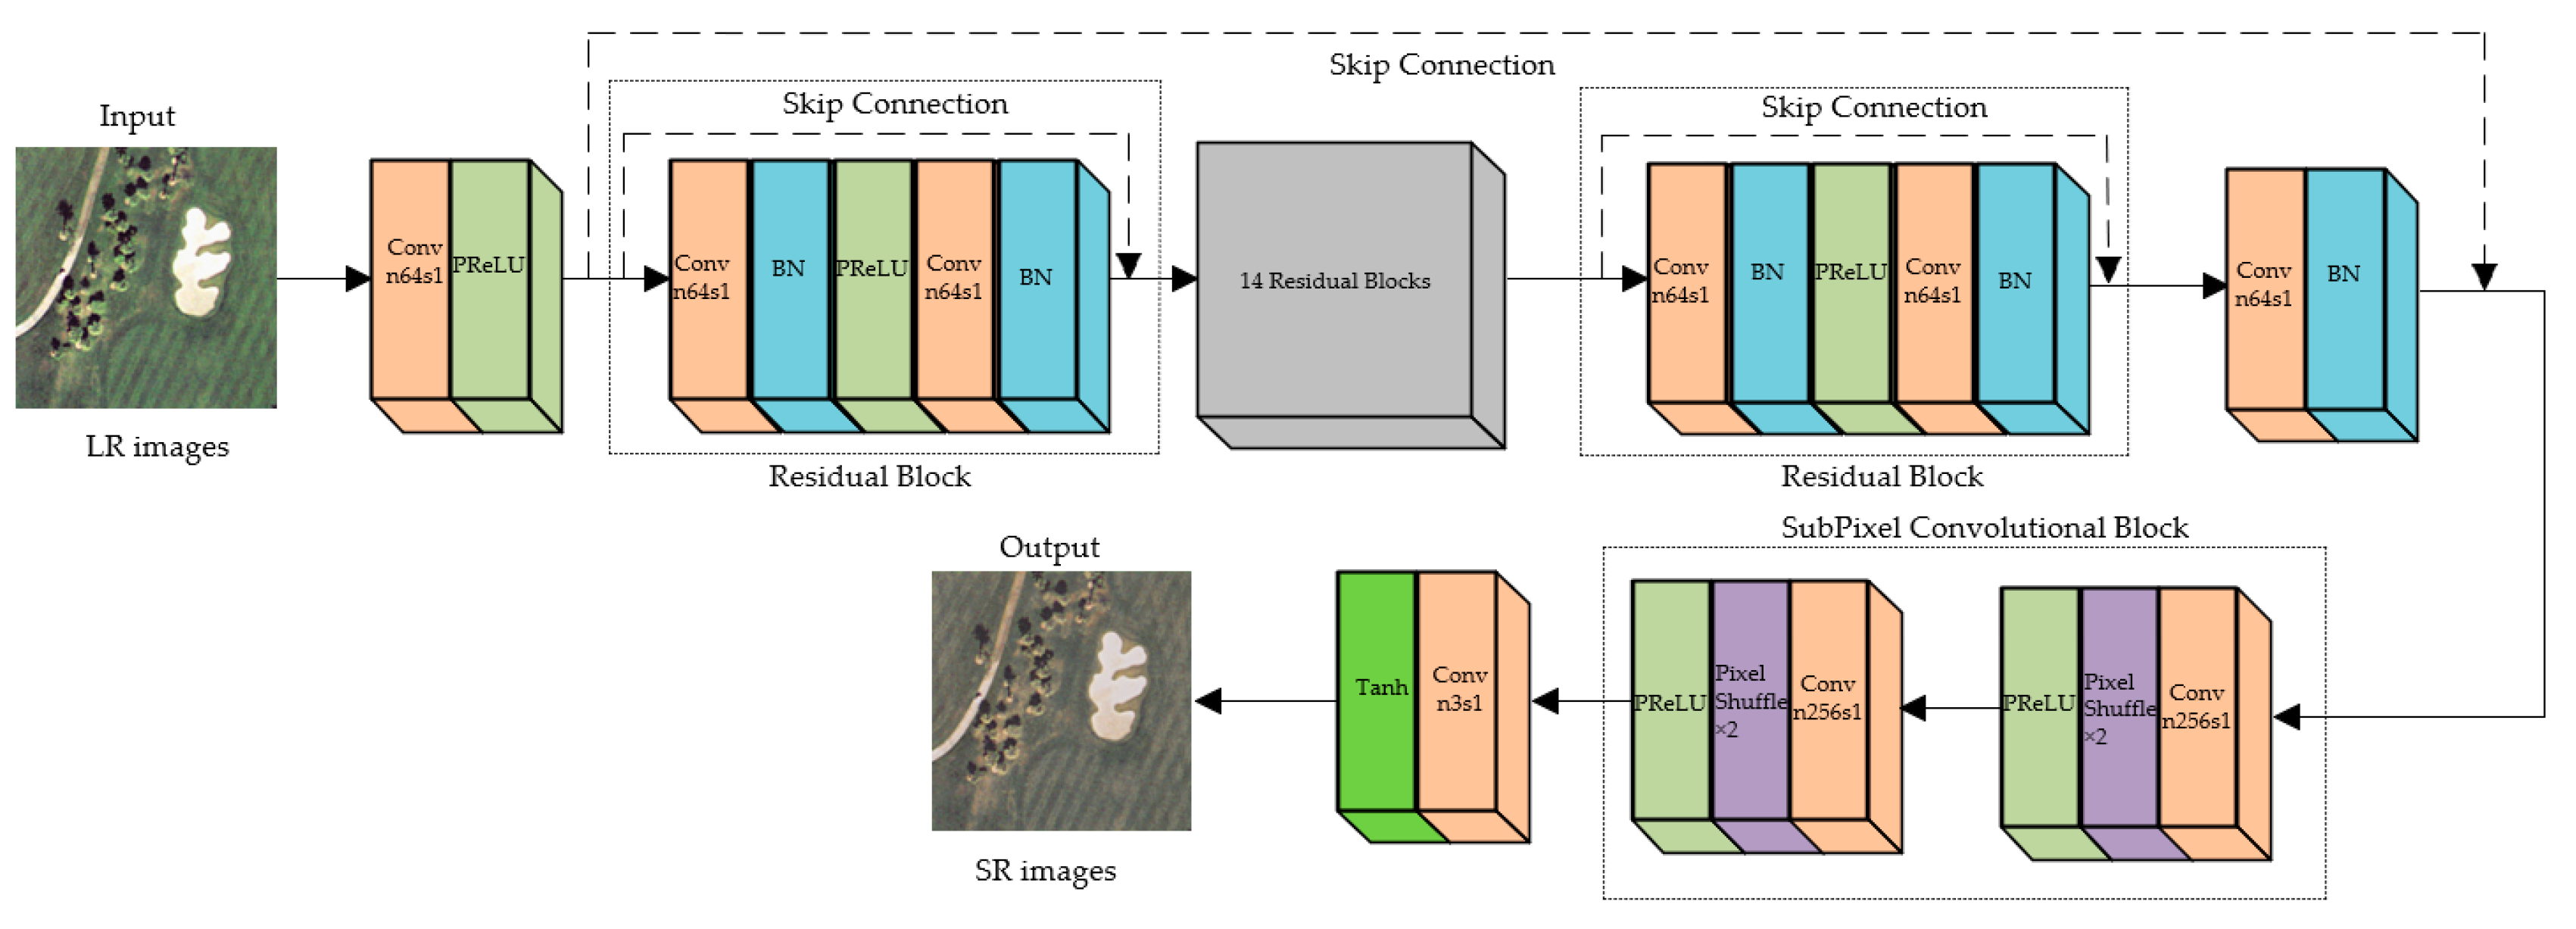
The SRGAN generator’s architecture is depicted in
Figure 1. The generator uses a residual structure, with two 3 × 3 convolution layers in each residual block. BN is used after the convolutional layer to normalize the operation. The activation function is PreLU. The input before residual block is then connected to the output after skip connection. Because the input image and the reconstructed image are basically similar, the network only focuses on learning the information difference between low-resolution image and high-resolution image, making the network more focused on generation of high-frequency details. Finally, two sub-pixel convolution layers are applied to increase image size, so that the generator does not need to enlarge the size and add a lot of channels first. After learning the details of high-resolution images, the sub-pixel convolution layer is applied to enlarge the size, which can save the computational resources.
The SRGAN discriminator’s structure is shown as
Figure 2, consisting of eight convolutional layers and utilizing BN layers for input normalization. Accompanied by an increase in the convolutional layers’ number, the network will deepen and the feature size will gradually decrease. LeakyReLU function can also calculate gradients for parts with input less than zero, instead of having a value of 0 like ReLU. As a result, the discriminator in SRGAN opts for LeakyReLU as its activation function. After two fully connected layers, it applies the Sigmoid activation function to compute the probability whether the input image is genuine.
The SRGAN generator is tasked with creating images that closely resemble real images, while the task of discriminator is to distinguish an image from a real image or a generated image. Two networks are in competition as they train the generator to produce increasingly lifelike images. SRGAN adopts a loss function called Perceptual Loss. The loss between the characteristic pattern extracted by the VGG-19 network at different levels is employed to replace the Mean Squared Error loss of two images, which improves the richness of detail textures in super-resolution images and enhances the visual effect of the human eye. Increasing the number and depth of layers in the GAN model can improve its representation and non-linear fitting capabilities, which can be achieved by adding more convolutional layers, batch normalization, and residual connections in the generator and discriminator.
3. Methods
SRGAN is a powerful super-resolution generation model that can draw more information from the images with low-resolution and generate images with high-quality. So, this section improves the basic SRGAN by introducing multi-scale attention mechanism and dense residual structure into the generator, and then adding residual structure into the discriminator to propose a new model: SRGAN model with Multi Scale Attention Mechanism and Dense Residual Connection (SRGAN-MSAM-DRC). And then we use public datasets to test the model performance. The softwares used in this paper are PyCharm 2023.3.2 and Anaconda3-2023.09. The hardware is RTX-4060 graphics card of ASUS brand in Taiwan Province of China.
3.1. Model Building
3.1.1. Generator
The SRGAN model with Multi Scale Attention Mechanism and Dense Residual Connection (SRGAN-MSAM-DRC model) removes the Batch Normalization layer from the basic SRGAN generator and introduces the Pyramid Segmentation Attention (PSA) mechanism and dense residual connection.
In the image generation task, the BN layer ignores the absolute differences between image pixels and only considers relative differences, which is actually unfavorable for super-resolution model training. Additionally, the BN layer utilizes equivalent memory capacity compared to the preceding convolutional layer. By eliminating this step, the model’s computational complexity can be decreased. The pyramid attention mechanism can focus on color information at different scales, so that the model can deal with the color changes of the reconstructed image more effectively. It can help the model suppress the noise in the image during the reconstruction process and improve the generator’s focusing ability and reconstruction ability. This can better maintain the global consistency of the reconstructed image, making the reconstructed image more visually natural and coherent. The quality of reconstructed remote sensing images can be improved by introducing the PSA module which contains the pyramid attention mechanism. The architecture of residual blocks in the basic SRGAN model and PSA modules are shown in
Figure 3.
Using dense residual connections in the generator of SRGAN-MSAM-DRC can enrich the information content of reconstructed images. Dense residual connection can effectively transmit information and alleviate the problem of gradient disappearance. This can better capture complex features in the image and improve the quality of the reconstructed image. Each level in the dense residual connection is directly connected to the previous level, and the network can better retain and transmit important details and structural information in the image, which can improve the fidelity and accuracy of the image reconstruction and reduce the color change of the image.
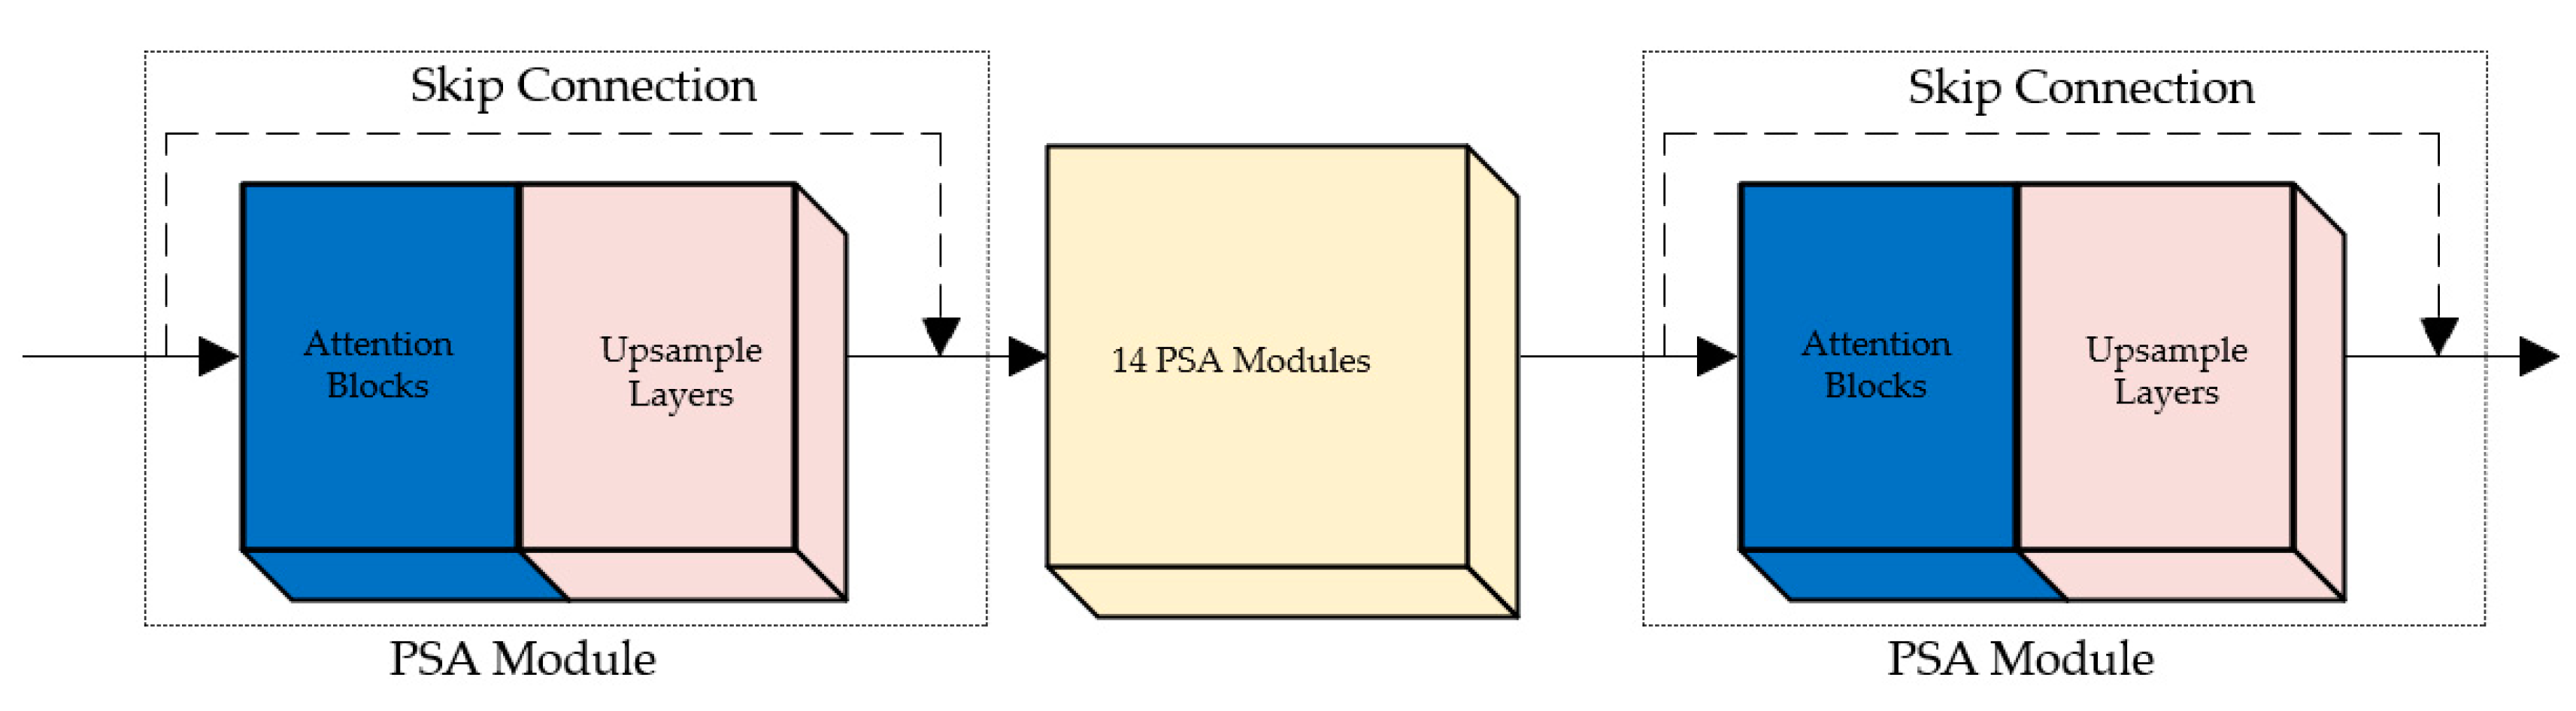
The connection of multiple PSA modules which use a dense residual connection is shown in
Figure 4. The attention dense residual connection is designed to extract the texture details that need to be recovered from the input low-resolution images, which play a key role in generating high-resolution images. The attention mechanism is used to select different feature maps of low-resolution images and then connect these images with different feature maps of high-resolution images by dense residual connection.
SRGAN is used for image generation, and the use of PReLU activation function has little impact on it. Moreover, the generator performs dimensionality enhancement on the image without considering the information loss part. The model’s performance can be enhanced, while its complexity is reduced by using ReLU. The SRGAN-MSAM-DRC generator uses ReLU activation function on the basic SRGAN, removes the last layer of Sigmoid function, introduces multi-scale attention mechanism, improves residual structure, and forms the network architecture of SRGAN-MSAM-DRC generator;
Figure 5 shows that.
3.1.2. Discriminator
In the SRGAN model, the discriminator plays an important role in extracting key features from images to effectively differentiate real images from generated images. Therefore, the discriminator acts as a classification network, and SRGAN-MSAM-DRC also adds residual thinking to the discriminator to improve its network performance. Adding residual blocks into the discriminator can help the discriminator better capture important features in the image. This can improve its ability to distinguish between the real image and the generated image and help to train a stable generative adversarial network. By enhancing the feature extraction capability of the discriminator, the discriminator can evaluate the truth degree of the generated image more accurately, which helps the generator learn a better generation strategy and generate higher quality and more realistic images. The SRGAN-MSAM-DRC discriminator’s residual block architecture is depicted in
Figure 6.
The SRGAN-MSAM-DRC discriminator adds two residual blocks to deepen the network depth. The output and input of each residual block were merged and became the input of the next residual block, which could enhance the network’s emphasis on extracting image details. LeakyReLU increases computational complexity and sacrifices the sparsity brought by ReLU, as most reconstruction applications of super-resolution about images of remote sensing are combined with other tasks, such as remote sensing image target recognition and classification, or geological hazard warning. Hence, it is essential to decrease the count of model calculation parameters. As a result, the ReLU function in the discriminator is replaced by the LeakyReLU function.
Figure 7 displays the SRGAN-MSAM-DRC discriminator’s architecture.
This improved model only involves adjustments to the structure, parameters, and other aspects of the model, without changing the basic tasks and output goals of the model. Therefore, the loss function of SRGAN-MSAM-DRC and SRGAN is perceptual loss. The formulas are as follows:
Beta is the product factor of adversarial loss. The perceptual loss function is composed of adversarial loss and content loss. The role of content loss is to ensure the generated super-resolution image retains the semantic information of the original image. Through comparing the feature representation between the original image and the generated image, content loss makes the generator network more inclined to generate images with super-resolution that are similar to the original image, which can improve the quality of the generated image. The role of adversarial loss is to train the generator network to produce more realistic high-resolution images. It encourages the image generated by the generator to be visually difficult to distinguish from the real high-resolution image, thus improving the realism of the generated image.
3.2. Description of Dataset
The datasets used in this article are sourced from the CCF BDCI Land Parcel Segmentation Challenge and the UC Merced Land Use Dataset (UCMLU dataset). UCMLU dataset is a 21 level remote sensing dataset; it is full of land-use imagery for study, all of them extracted from urban areas in various regions. Each of these images has a pixel size of 256 × 256, and there are 21 sorts with 100 images per sort. These 21 sorts are: airplanes, agriculture, buildings, beaches, baseball diamonds, shrubs, dense residences, highways, ports, intersections, forests, golf courses, medium-sized residences, overpasses, parking lots, mobile family parks, rivers, sparse residences, runways, chaparrals, and oil storage tanks. Some examples of these categories are shown in
Figure 8. The Chinese Computer Federation (CCF) provides the CCF BDCI dataset, consisting of 140,000 remote sensing images sized 256 × 256 pixels.
The UCMLU dataset has 2100 images and they were used to generate HR-LR image pairs by using BI degradation to train the super-resolution model. In total, 20% of the images were used as the test set and the 80% as the training set. The CCF BDCI Land Parcel Segmentation Challenge dataset is utilized for assessing the generalization ability of models in subsequent testing phases. The value of parameter scaling_factor is set to 4, that is, the spatial resolution of remote sensing image is increased by four times each time, the resolution of original image is 256 × 256, and the resolution of the reconstructed image is 1024 × 1024 after two increases.
3.3. Evaluation Metrics
We usually use SSIM (Structural similarity) and PSNR (Peak signal-to-Noise Ratio) to evaluate the quality of images. However, when these two metrics are used in the reconstruction of the super-resolution model, they can easily lead to excessively smooth details in the reconstructed image. So, increasing the image entropy index to further comprehensively evaluate the reconstructed images’ quality can reflect the performance of the reconstruction model about super-resolution better. In addition, we will also test the hyperspectral remote sensing data set. Therefore, for the quality evaluation of the reconstructed hyperspectral remote sensing images, we will add the Mean Spectral Angle (MSA) to detect whether the spectra of the hyperspectral remote sensing images have changed before and after reconstruction.
SSIM is a metric employed to describe the similarity of two images. It fully considers the human visual perception. Besides, it focuses on the subjective perception about the observer towards the image. It measures the quality of an image through three aspects: contrast, structure, and image brightness [
28]. The formulas are as follows:
A high SSIM value indicates good reconstruction quality of the image or video. While SSIM still cannot fully simulate the human eye’s perception of the image or video, especially when there is distortion in the image or video, SSIM is not a perfect indicator for image reconstruction about super-resolution.
The PSNR is the comparison of the mean square error both the peak signal in an image or video and that in the reconstructed image. The PSNR is smaller reconstructed image, and the original image will have a larger difference, and the reconstructed image’s quality is lower. The formula is as follows:
IE (image entropy) can be employed to measure the complexity or information content of an image. Meanwhile, the images’ quality can also be evaluated by using it [
29]. Its expression is as follows:
Pi represents the proportion of pixels in the image with a grayscale value of i (value range of 0 ≤ i ≤ 255), and it is also the probability of a certain grayscale appearing in the image block. The value of it is lager, the pixel value distribution of the image is more random or uncertain, and the information content or complexity of the image is higher. Instead, its value is smaller, the image’s pixel value distribution is more regular or deterministic, and the information content or complexity of the image is lower.
MSA is an index used to measure the mean Angle difference between two sets of spectral vectors. In remote sensing image processing, it is usually used to evaluate the spectral similarity between different images. By calculating the MSA, the spectral similarity between the reconstructed image and the original image can be evaluated to verify whether the spectral information is retained during the reconstruction process [
30]. A smaller MSA indicates that the spectrum between the reconstructed image and original image is more similar. The formulas are as follows:
3.4. Model Training
Train SRResNet first and use the saved training model weights for SRGAN training initialization.
Figure 9 illustrates the model training progress.
Set folder paths for the training sets and testing sets in the preprocessing section, and set the parameter min_size to check the resolution of every image in both training sets and testing sets. When the size of image is less than min_size, the image path is not written to the JSON file list. Each folder will form an image list file that will store the image paths of training and testing. Only when the dataset list file is accurately generated, can it be used for efficient parallel loading of images by subsequent Pytorch data loaders.
Before training the SRResNet model, we set batch size parameter to 128 and GPU number as 1. The rate of initial learning is defined as 1 × 10⁻⁴ with an upscaling factor of 4. As the training progresses, the MSE function gradually converges and reaches the convergence state at epoch 140. Save the trained SRResNet model and use the idea of transfer learning to directly initialize the generator using the previously trained SRResNet model when training the SRGAN model. In SRGAN training, the hyperparameter amplification ratio of the model is still 4 times, and the rate of initial learning is 1 × 10⁻⁴. When the model is halfway through training, the learning rate decreases. The SRGAN generator’s loss function is made up of two parts, they are weighted content loss and adversarial loss, known as perceptual loss. The loss function of discriminator, known as adversarial loss, is computed by binary cross entropy. Compared with SRResNet loss curve, SRGAN is very unstable, and as the discrimination loss decreases, the generation loss increases, indicating a fierce confrontation between discriminator and generator. At the beginning of training, the generator’s output is very unreal, so the fake images can be easily identified by the discriminator, resulting in a sharp decrease in the discriminator’s loss. However, the generator’s loss increases due to its unreal output, leading to a sharp decrease in adversarial loss to close to 0, and the generator’s content loss and generation loss increase to their maximum value. As the generator in the training process produces increasingly realistic images, the discrimination task becomes more challenging for the discriminator, leading to a rapid escalation in the adversary loss of the discriminator. Meanwhile, the loss of the generator will gradually decrease as its output becomes more realistic, and during this process, the model gradually converges. In late training, the epoch oscillates from 50 to 100, and the training is unstable because the performance of discriminator and generator is approaching saturation, making GAN training more difficult. In summary, the SRResnet model at epoch = 140 and the SRGAN model at epoch = 50 will be saved as the basic model for subsequent experimental testing.
4. Results
4.1. Results and Discussion of Ablation Experiments
Three different types of remote sensing images are selected from the UCMLU dataset as samples randomly. The original SRGAN model [
26], the SRGAN-MSAM model (SRGAN model with Multi Scale Attention Mechanism), and the SRGAN MSAM-DRC model are utilized for super-resolution reconstruction experiments. The reconstructed results of images are held up in
Figure 10,
Figure 11 and
Figure 12. The yellow boxes in the fourth section, “Results”, all indicate the position of the partial reconstructed effect in the complete reconstructed image.
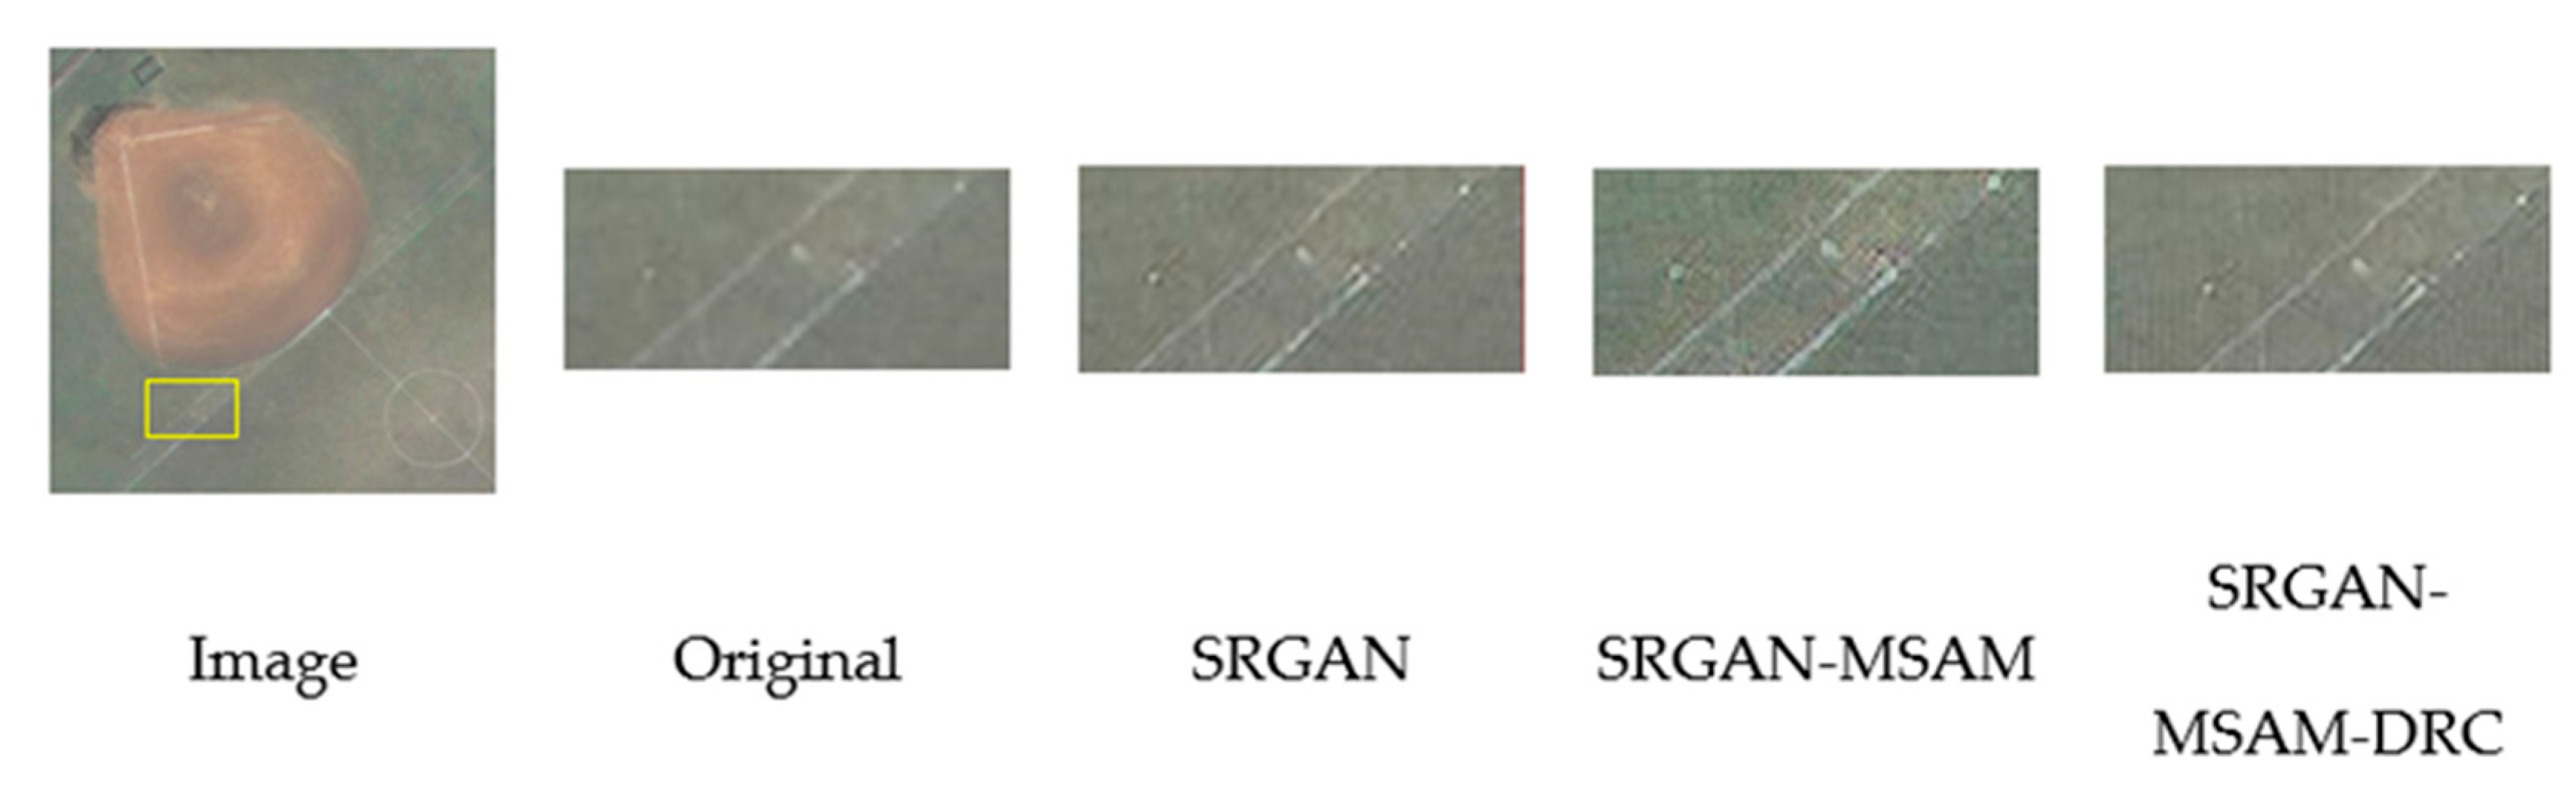
Figure 10,
Figure 11 and
Figure 12, respectively, show the comparison of partial reconstruction effects for tennis court, beach, and baseball diamond. In the enlarged image of the tennis court in
Figure 10, we can see that the texture of the trees is relatively smooth. After reconstruction using the basic SRGAN model, the texture sense of the trees begins to enhance, but the overall color of the image is biased. The texture details of the trees reconstructed using the SRGAN-MSAM model are clearer, and the color deviation is reduced compared with the image reconstructed using the SRGAN model. After the reconstruction of the SRGAN-MSAM-DRC model, the tree texture is more similar to the reality, and the color of the image basically does not change, resulting in the best effect. In the enlarged image of the beach in
Figure 11, the boat and the waves on the water are blurred in the original image. After SRGAN model reconstruction, the color of the water surface has changed significantly, but the red seat on the white assault boat is more obvious. Compared with the image reconstructed using the SRGAN model, the color of the image reconstructed using the SRGAN-MSAM model is improved, but the wave part of the water surface is still a little fuzzy. After the reconstruction of the SRGAN-MSAM-DRC model, the image is closer to the original image in terms of color, and the red seat in the yellow blade boat and the white blade boat are clearer and the texture of the wave part is clearer, and the overall reconstruction quality is the highest. In the enlarged image of the baseball diamond in
Figure 12, the two small paths and the potholes between them shown in the original image have a strong sense of blurriness. The smoothness of the image after reconstruction using the SRGAN model has been improved, but the degree of potholes between the small paths and paths is not as obvious as the images reconstructed using the SRGAN-MSAM model and the SRGAN-MSAM-DRC model. The reconstructed images of the SRGAN-MSAM-DRC model are more distinct and have higher clarity in the display of the potholes.
Compared to the SRGAN model, the images reconstructed using the SRGAN-MSAM model and the SRGAN-MSAM-DRC model both contain more texture information from the enlarged area of the effect comparison image. Compared with the SRGAN-MSAM model, the reconstructed images of the SRGAN-MSAM-DRC model have richer texture details and higher clarity, resulting in better reconstruction results for details. Remote sensing images display high intra-class diversity, high inter-class similarity, high information content, and small targets, necessitating greater detail than typical image reconstruction tasks about super-resolution. From the reconstructed images, we know that the SRGAN-MSAM-DRC model not only improves clarity, but also contains rich details. Therefore, we know that the SRGAN-MSAM-DRC model has a better performance than the basic SRGAN model in super-resolution reconstruction.
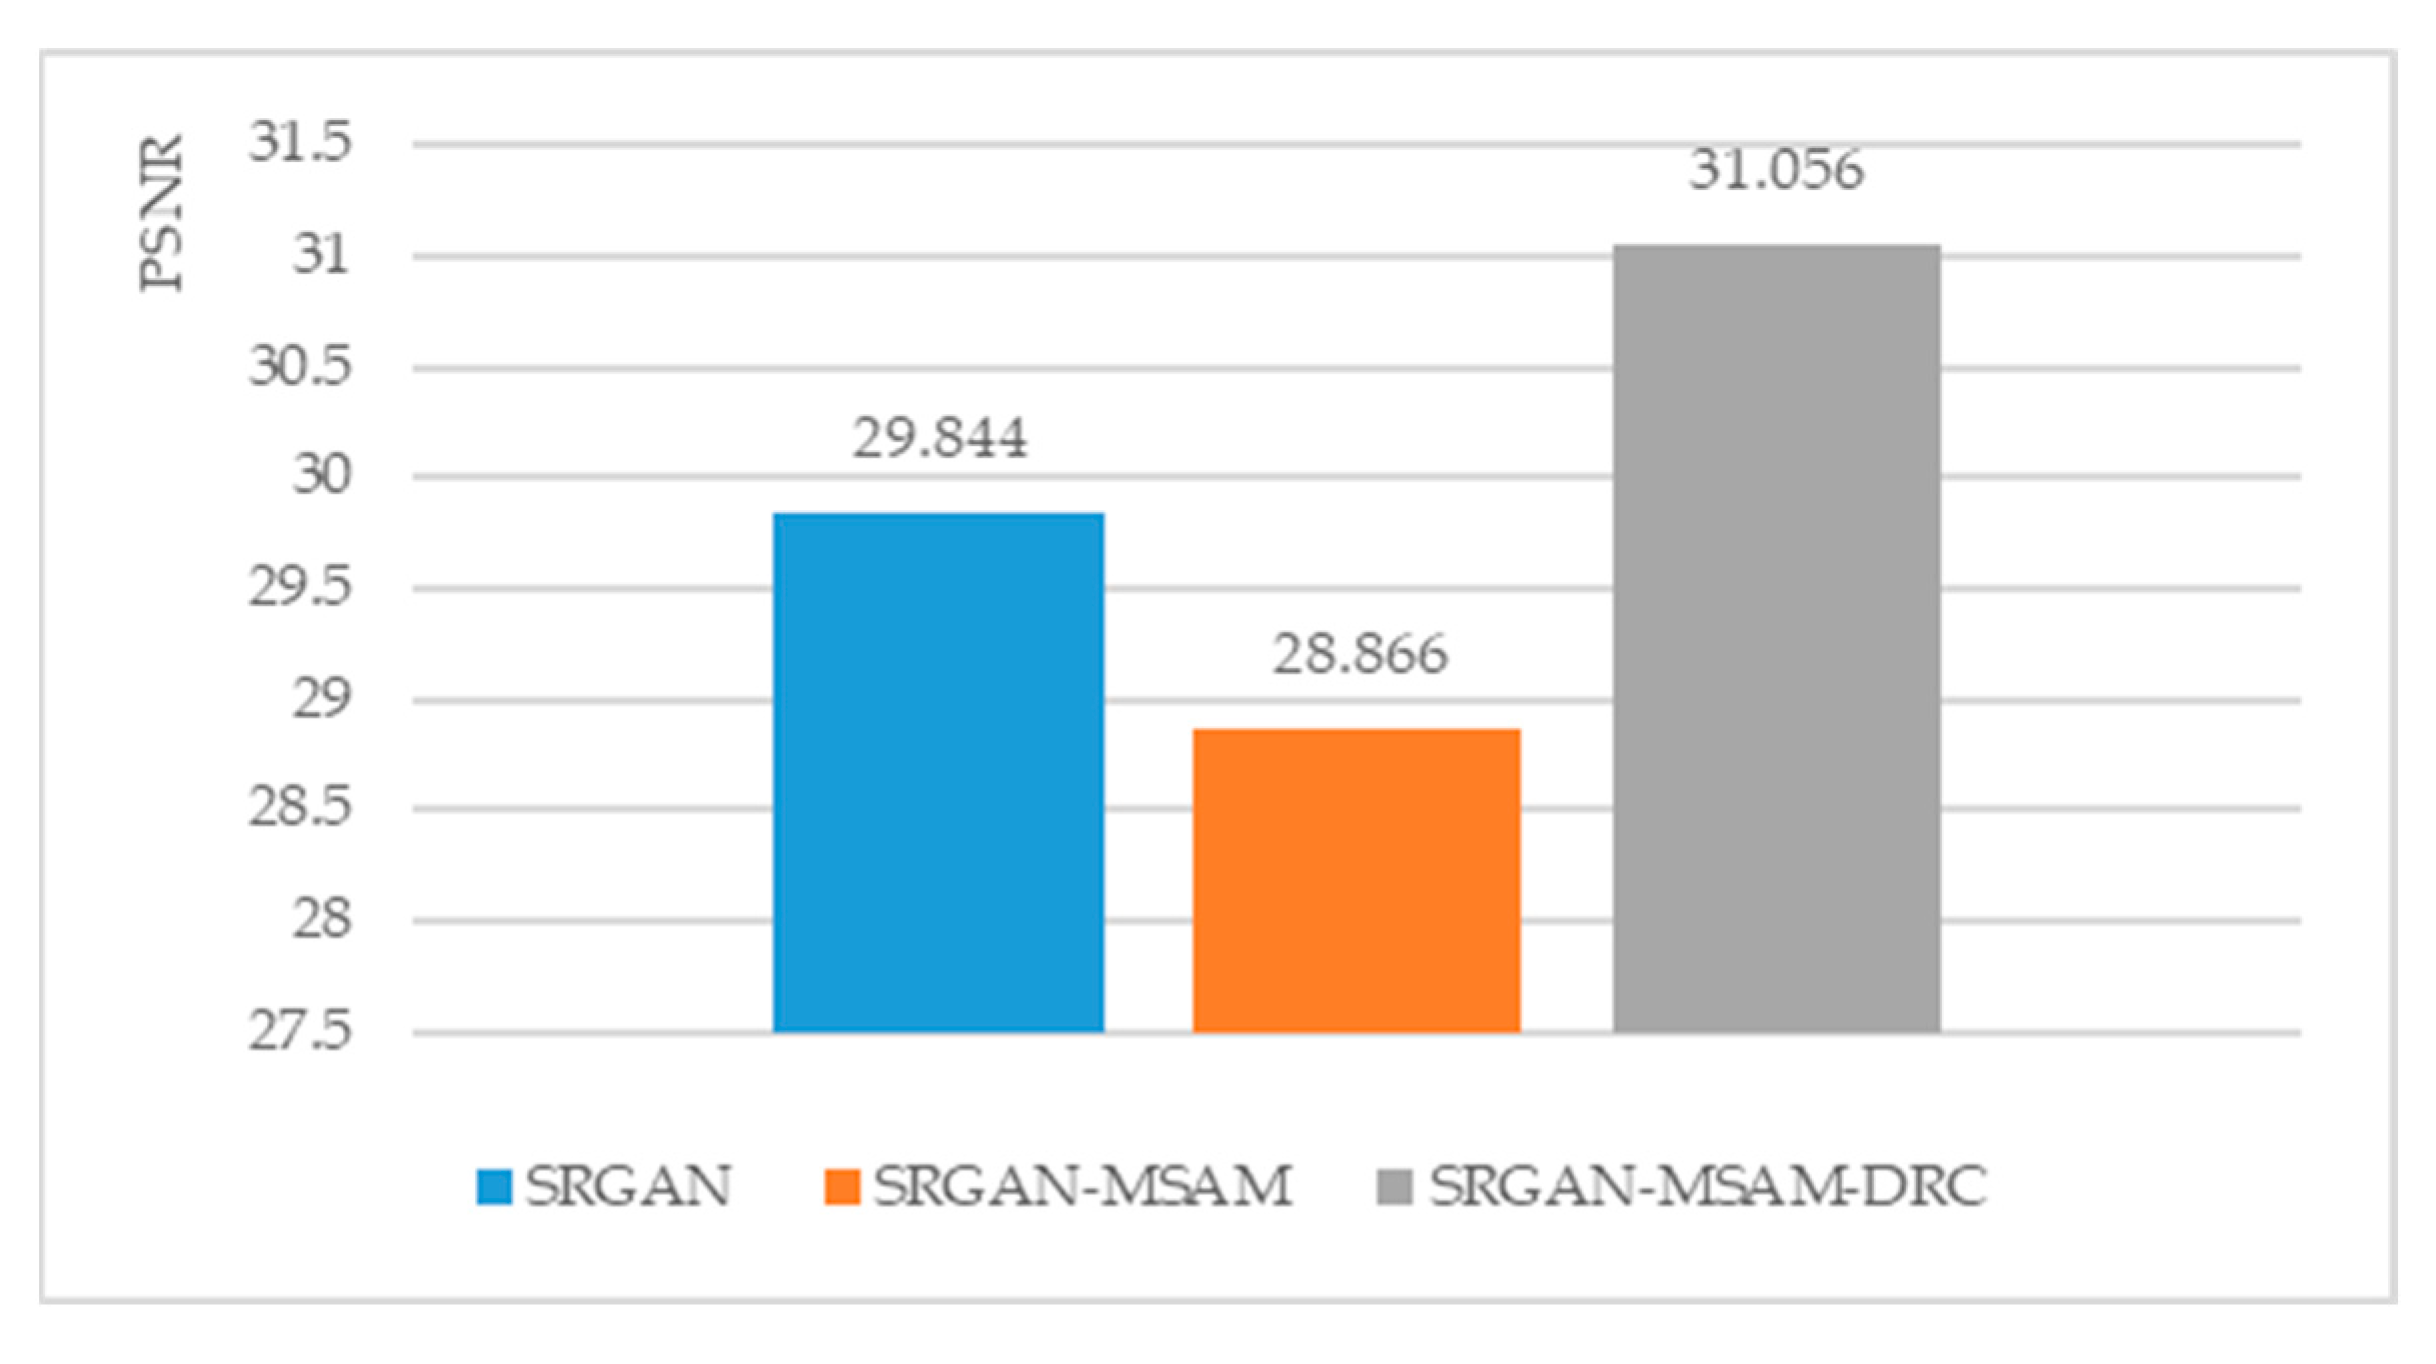
To provide additional evidence of the SRGAN-MSAM-DRC model’s effectiveness, three-evaluation metrics mentioned in
Section 3.3 of this article are employed to evaluate reconstructed renderings of different models.
Table 1 presented the evaluation criteria for analyzing image reconstruction effects from various models. The bold data in all tables in the fourth section, “Results”, indicates that the data is the best of all data for the indicator.
From
Figure 13,
Figure 14 and
Figure 15, we can see that compared with the basic SRGAN model, the SRGAN-MSAM-DRC model has increased PSNR, SSIM, and IE by 4.0%, 5.0% and 4.1%, respectively. According to the evaluation criteria for reconstructed image quality and effectiveness, the SRGAN-MSAM-DRC model outperforms the basic SRGAN model in improving the resolution about images of remote sensing. While improving the PNSR and SSIM indicators, the reconstructed images do not show significant distortion or deformation, and the reconstructed texture effect is good, with better performance.
4.2. Results and Discussion of Comparative Experiments
Above experimental results have verified that SRGAN-MSAM-DRC can reconstruct high-quality images of remote sensing. On purpose of validating the superior reconstruction performance of the SRGAN-MSAM-DRC model over other models, we designed the following comparative experiments.
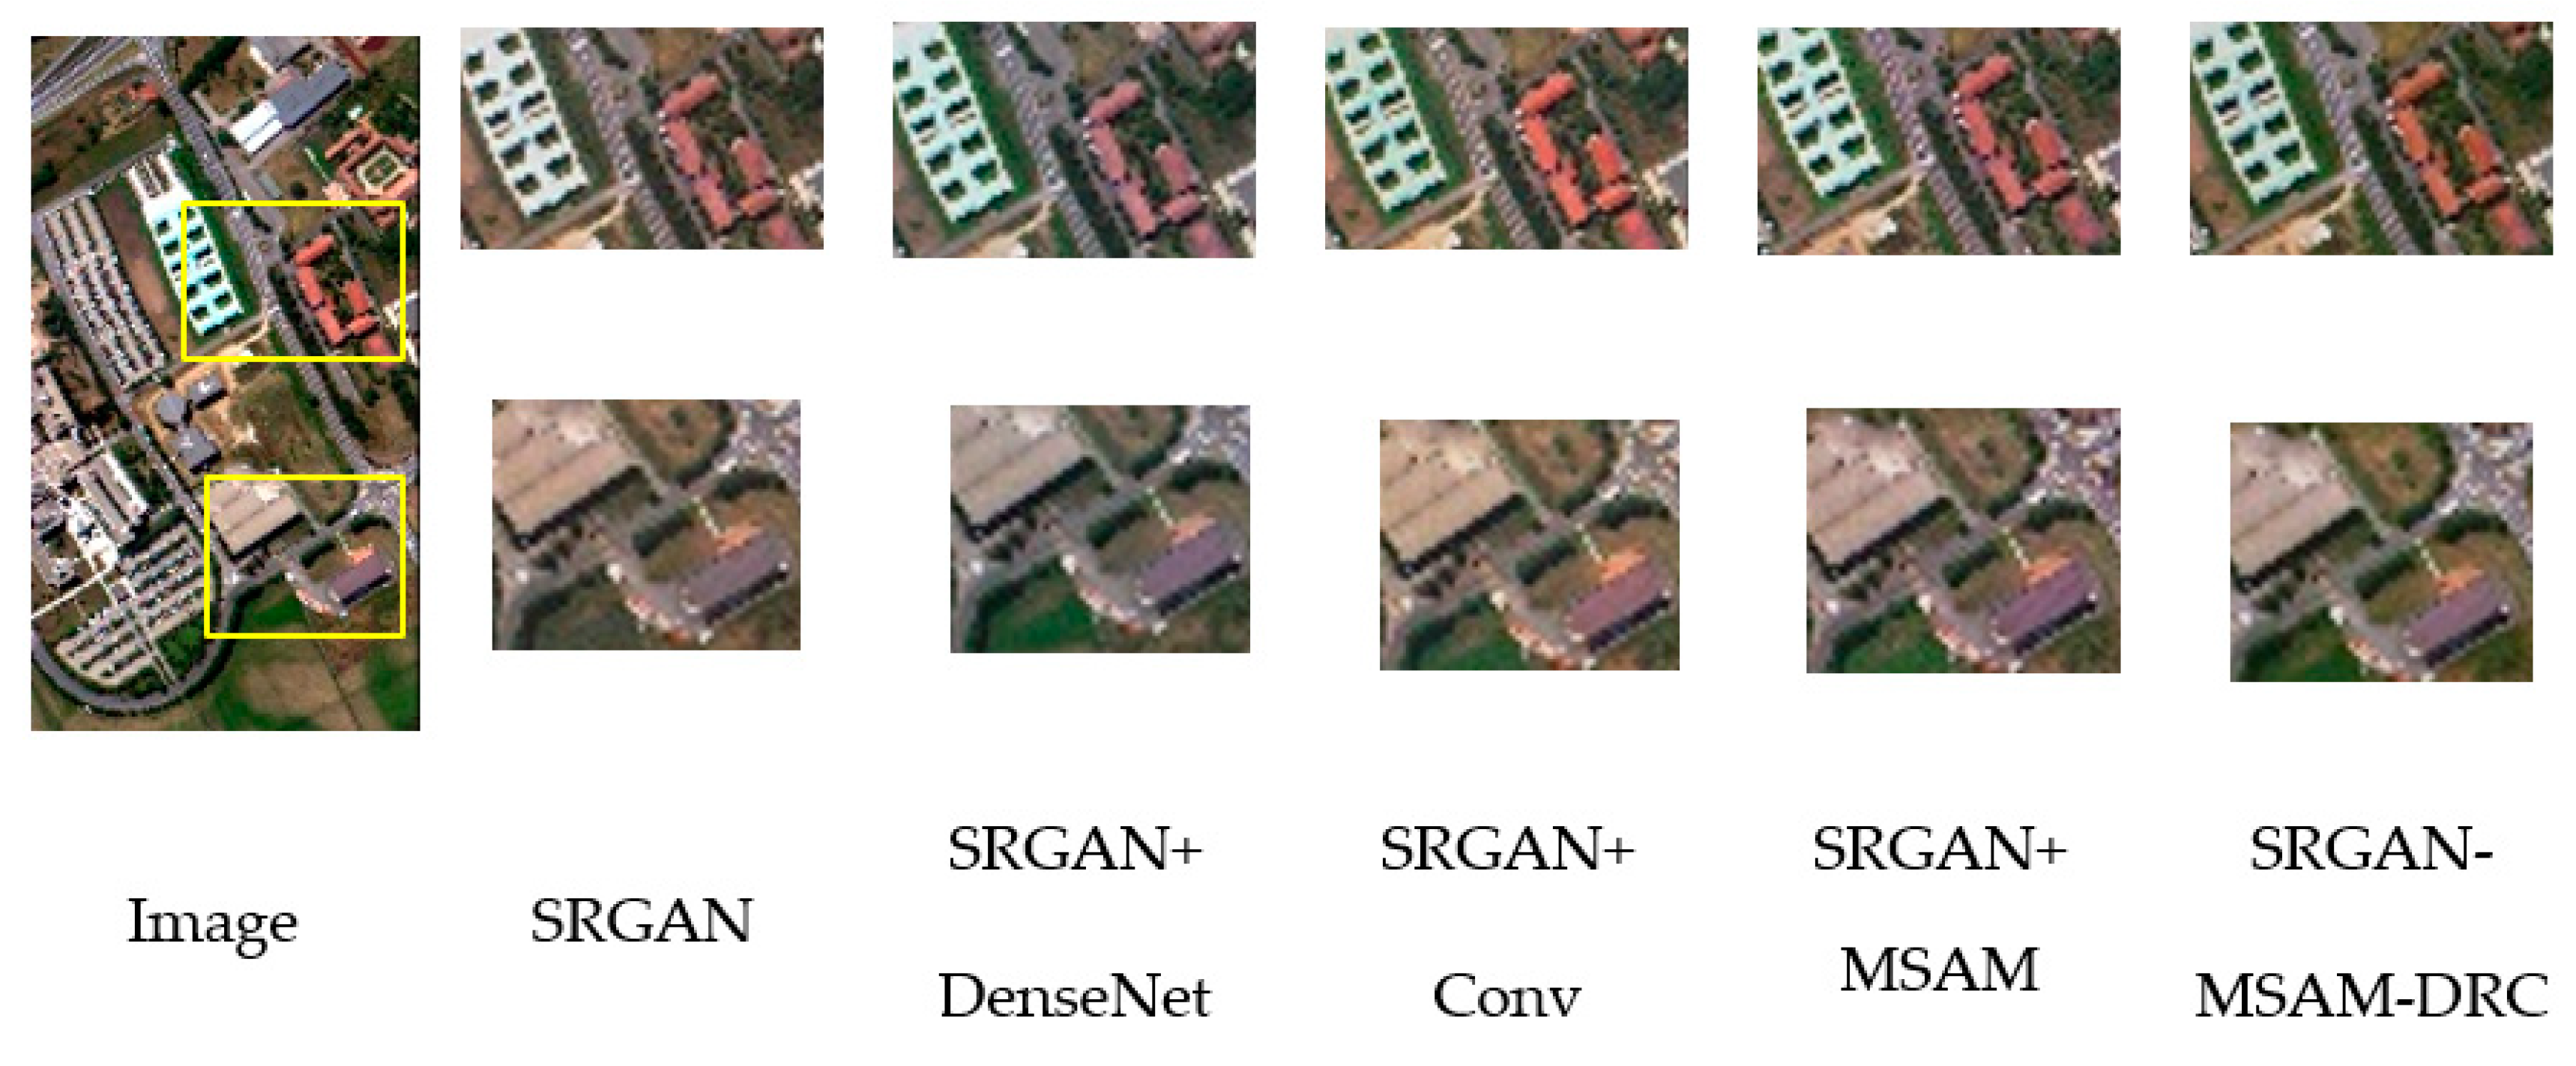
Figure 16,
Figure 17 and
Figure 18 show the reconstruction results based on the Bicubic model [
31], the SRGAN model whose discriminator uses DenseNet network [
32], the SRGAN model based on improved convolutional blocks [
33], and the SRGAN-MSAM-DRC model.
Figure 16,
Figure 17 and
Figure 18 show the comparison of partial reconstruction effects for airplane, intersection, and chaparral. In the enlarged image of the airplane in
Figure 16, we can see that the image reconstructed using the SRGAN-MSAM-DRC model has significantly higher clarity in the rectangular yellow road markings than the other three models, with higher brightness in the wing section and darker lawn color. In the enlarged image of the intersection in
Figure 17, we can see that the image reconstructed using the SRGAN-MSAM-DRC model has a more obvious reconstruction effect on the trellis. The various parts on the trellis are more distinct, and the grain details on the trees are more detailed, which is more realistic. In the enlarged Chaparral image in
Figure 18, we can see that the image reconstructed using the SRGAN-MSAM-DRC model is more realistic in restoring the colors of the shrubs compared to the other three models, and the overall smoothness is not high, but has a richer texture.
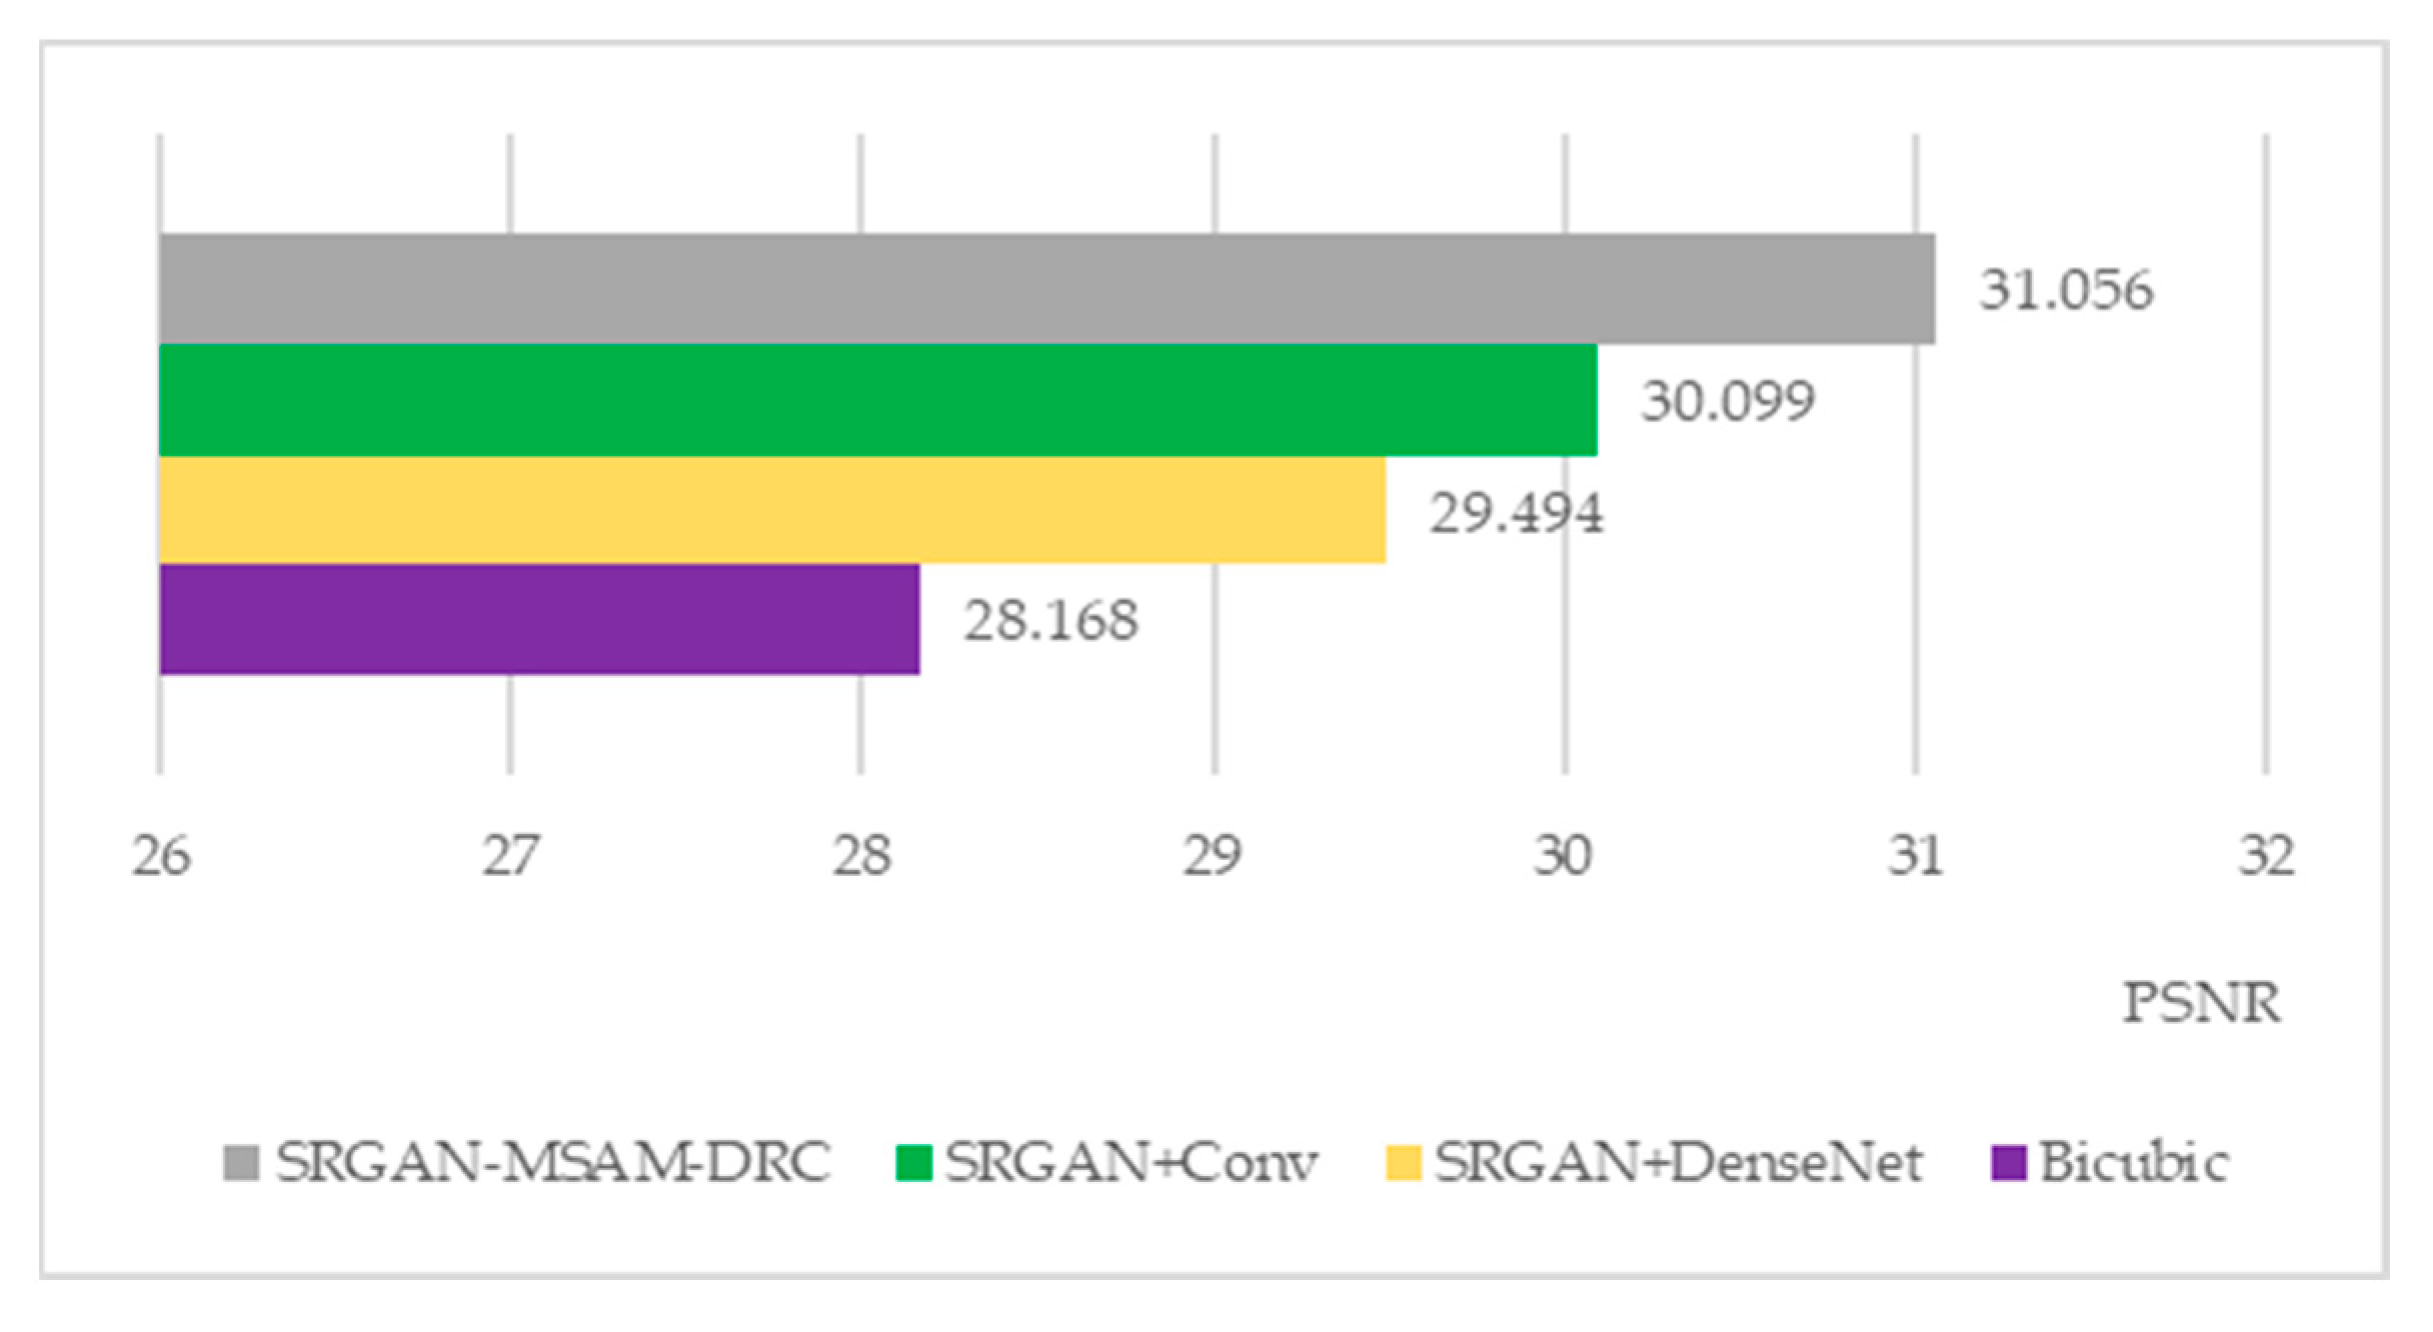
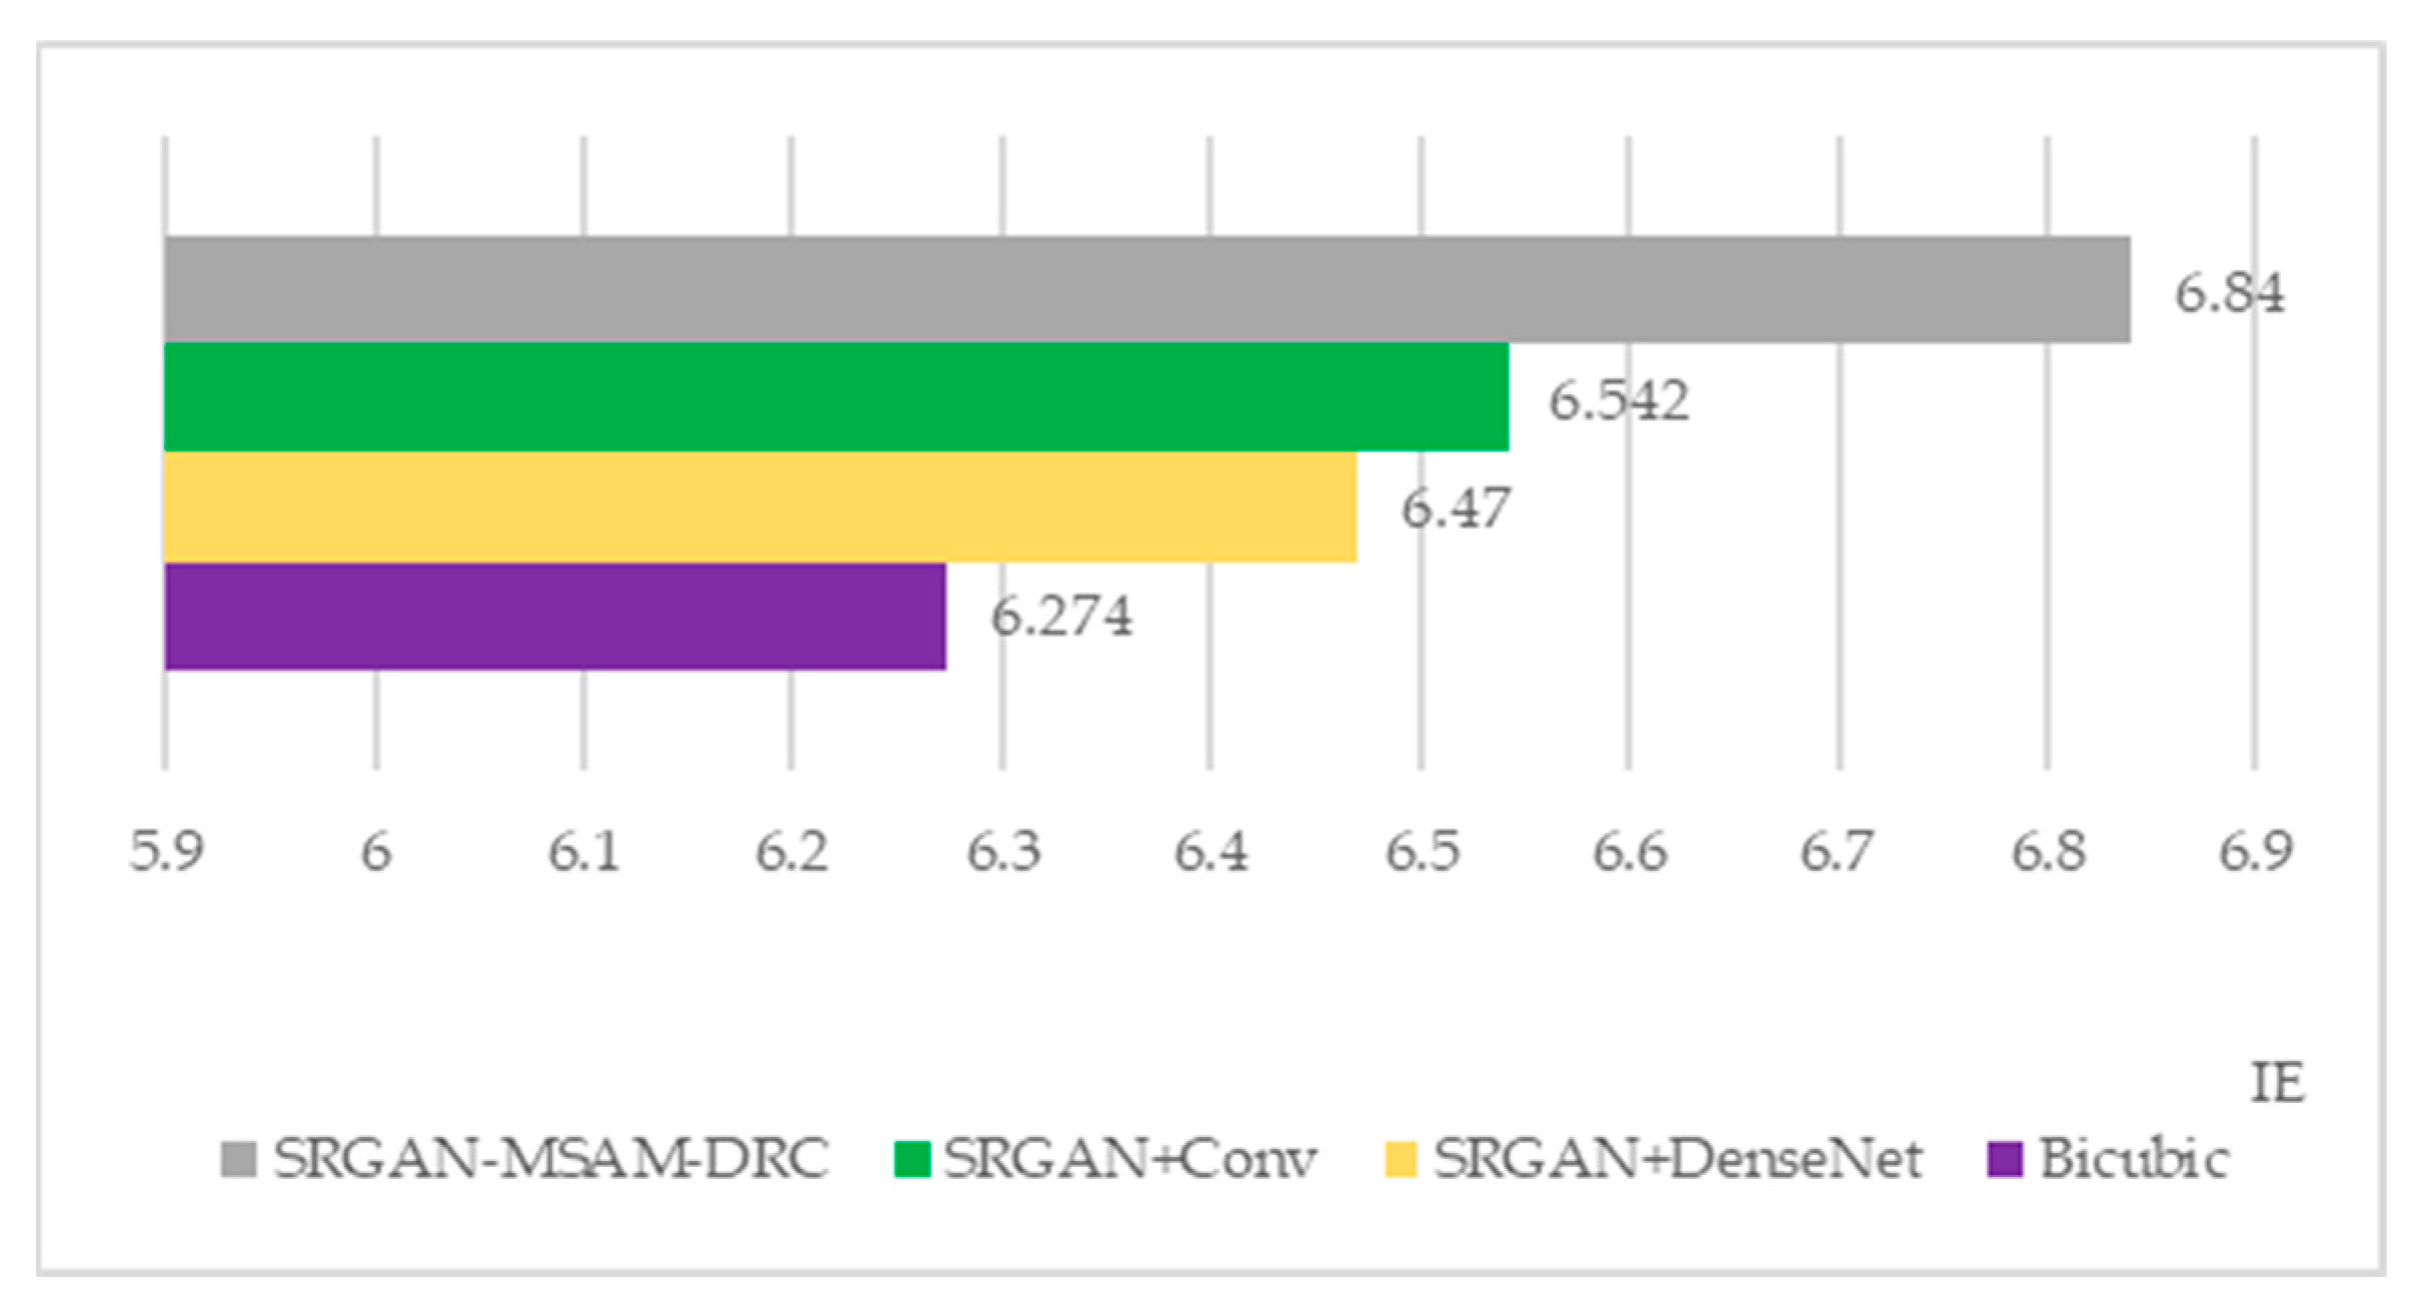
From the perspective of local magnification in the effect comparison image, the SRGAN-MSAM-DRC model’s reconstructed effect image is superior to the Bicubic model, SRGAN+DenseNet model, and SRGAN+Conv model in terms of clarity, color, and texture details. In order to further verify whether the SRGAN-MSAM-DRC model performs better, the performance of each model is compared by using the evaluation indicators of the three super-resolution reconstruction effect maps proposed in
Section 3.3 of this article.
Table 2 shows the detailed evaluation indicators for different model reconstruction renderings.
According
Figure 19,
Figure 20 and
Figure 21, the SRGAN-MSAM-DRC model demonstrates the highest reconstruction performance in all evaluation metrics, highlighting that the enhanced SRGAN method introduced in this study is capable of producing high-quality super-resolution remote sensing images.
4.3. Performance Evaluation
To further confirm the advantages of the SRGAN-MSAM-DRC model in reconstruction of remote sensing images using super-resolution, this chapter further validates the efficiency of reconstructing images of remote sensing and the generalization ability of different models. The experimental results are shown in
Table 3,
Figure 22, and
Table 4.
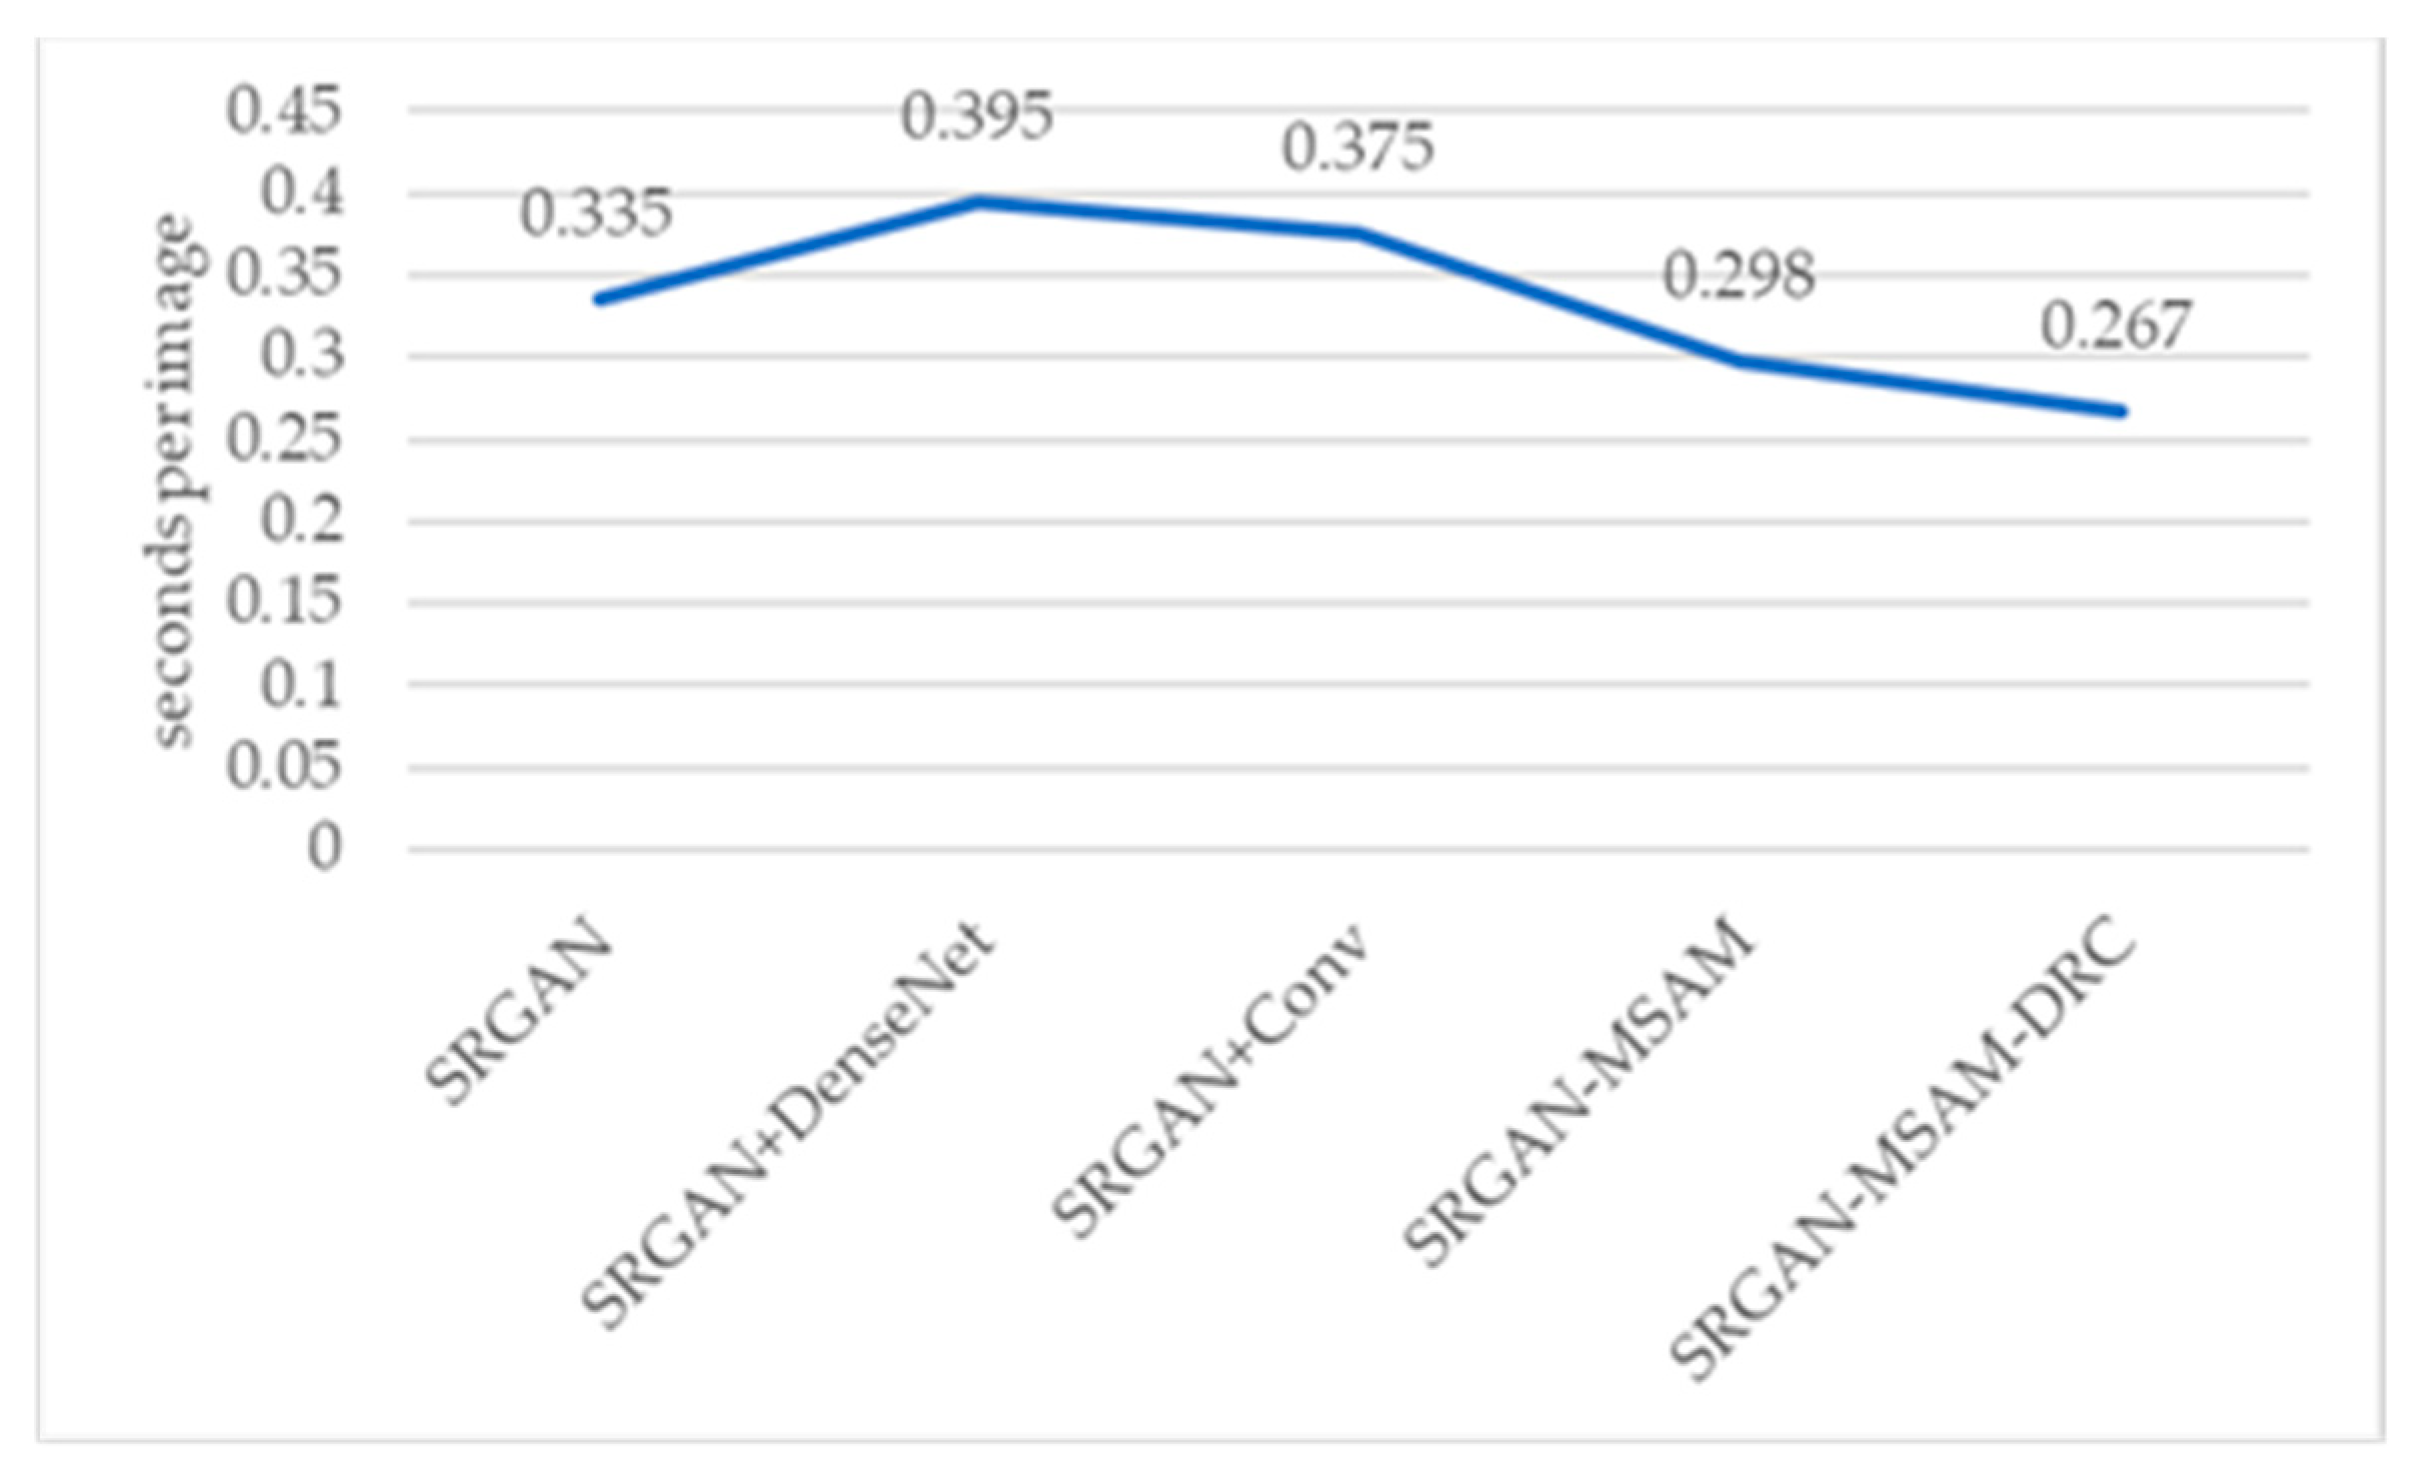
The efficiency comparison of different models in reconstructing remote sensing images is shown in
Figure 22.
Figure 22.
The time to reconstruct an image.
Figure 22.
The time to reconstruct an image.
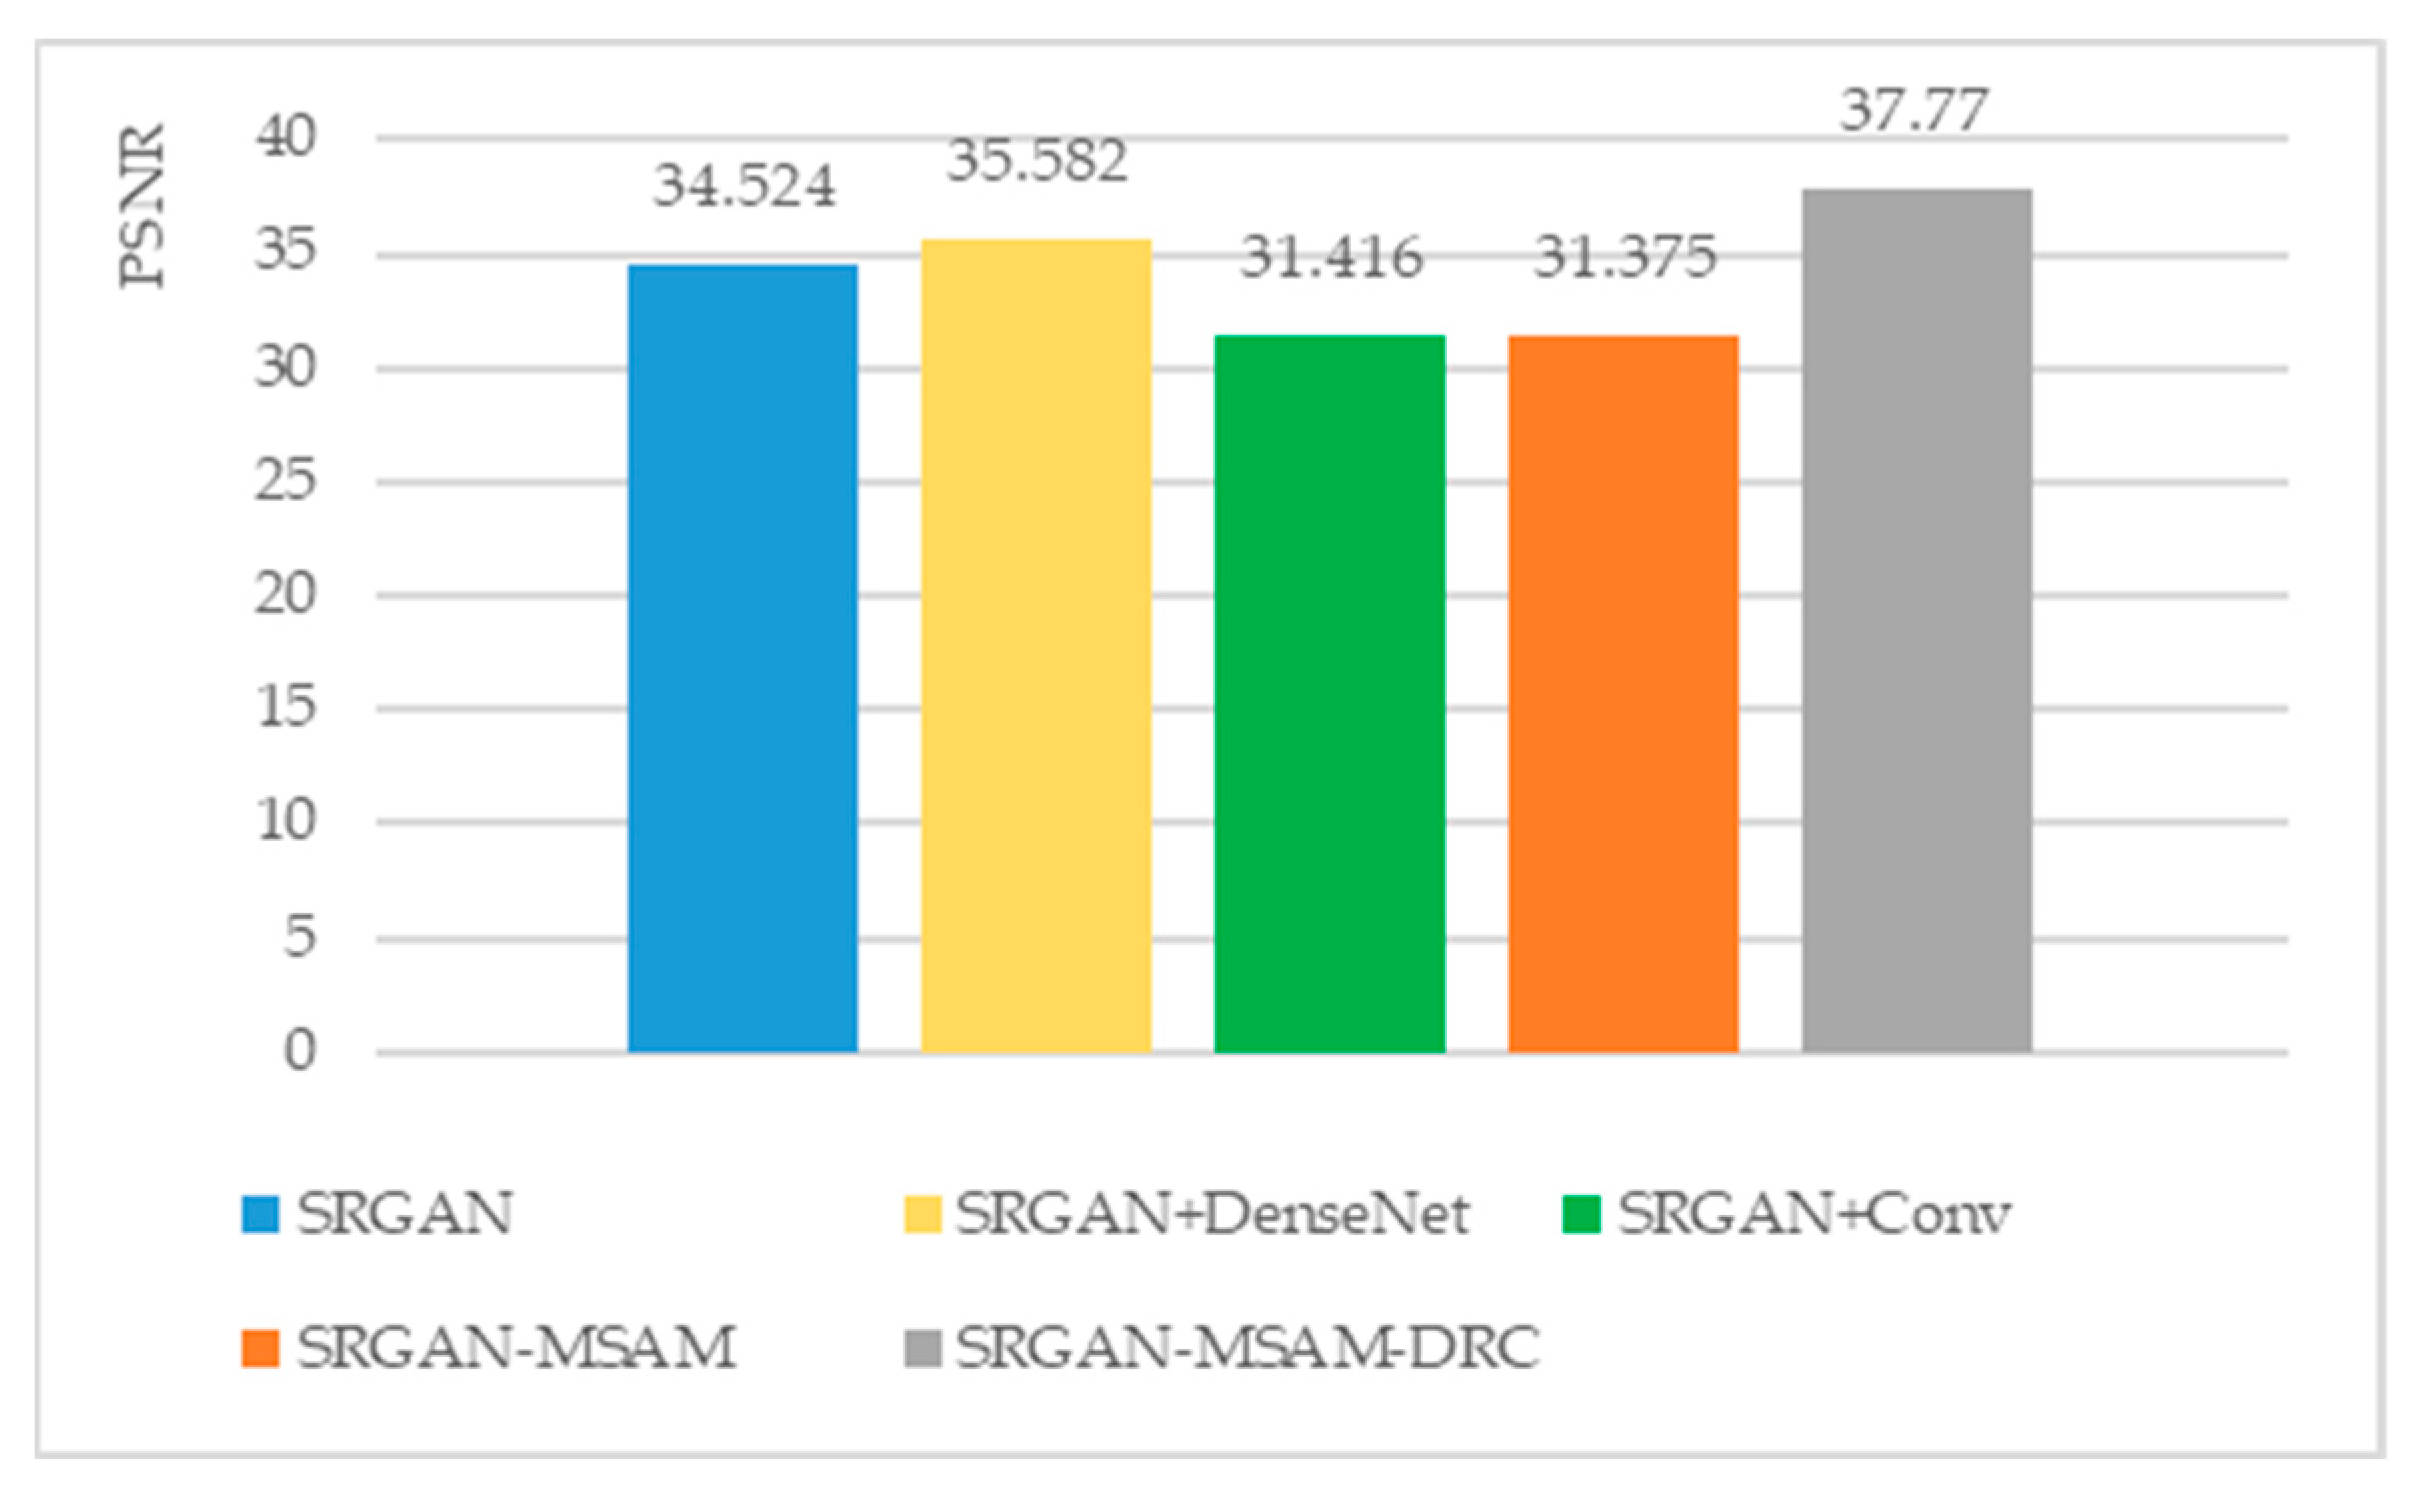
Table 4.
The performance of different models in terms of their generalization ability, and the test dataset is CCF BDCI Land Parcel Segmentation Challenge.
Table 4.
The performance of different models in terms of their generalization ability, and the test dataset is CCF BDCI Land Parcel Segmentation Challenge.
| Model | PSNR | SSIM | IE |
|---|
| SRGAN [20] | 34.524 | 0.906 | 5.144 |
| SRGAN+DenseNet [32] | 35.582 | 0.961 | 4.780 |
| SRGAN+Conv [33] | 31.416 | 0.894 | 5.116 |
| SRGAN+MSAM | 31.375 | 0.893 | 5.170 |
| SRGAN-MSAM-DRC | 37.770 | 0.968 | 5.141 |
From
Figure 22, we can see that the SRGAN-MSAM-DRC model has the highest efficiency in reconstructing images, indicating that the SRGAN-MSAM-DRC model is capable of performing inference operations faster. From
Figure 23,
Figure 24 and
Figure 25, we can see that the SRGAN-MSAM-DRC model still performs well on the new test set, with PSNR and SSIM values ranking first. The PSNR and SSIM are 6.1% and 0.7% higher than the second rank, respectively. Although the IE value ranks third, the difference from the highest value is only 0.5%, indicating that the SRGAN-MSAM-DRC model has stronger generalization ability.
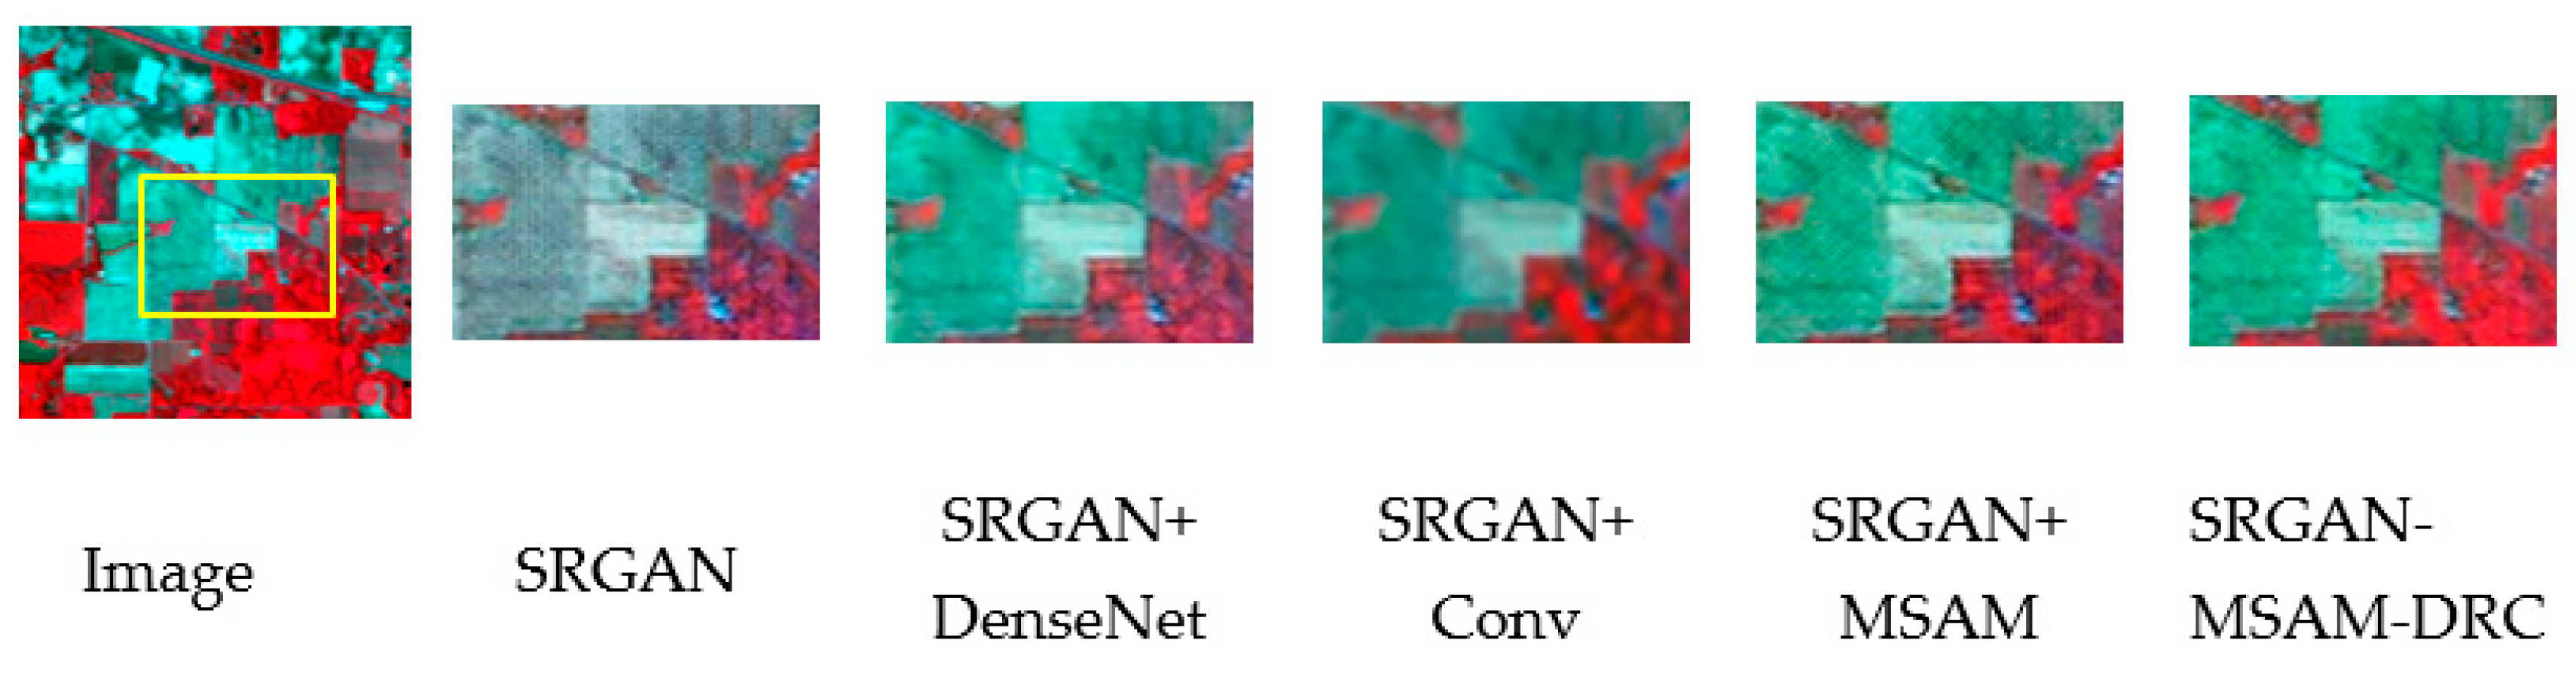
In order to verify whether the model proposed in the paper also has a good performance on the reconstruction of hyperspectral remote sensing images, we conducted supplementary experiments here.
In this experiment, images from two hyperspectral datasets, “Pavia University” and “Indian Pines”, were used for super-resolution reconstruction. To verify whether the spectra of the images before and after the reconstruction of the two hyperspectral datasets have changed, Mean Spectral Angle (MSA) was added to the three evaluation indexes mentioned in
Section 3.3 of this paper to evaluate the performance of the super-resolution model proposed in the paper. The results are as follows:
From
Figure 26 and
Figure 27, we can see that the hyperspectral remote sensing image reconstructed using the SRGAN model is obviously different from the original image in terms of color, and in the selected region, the image reconstructed using the SRGAN-MSAM-DRC model is superior to other models in terms of clarity and color, and is most similar to the original image. Therefore, SRGAN-MSAM-DRC still has a good performance in super-resolution reconstruction of hyperspectral remote sensing images.
In order to further verify the performance of the SRGAN-MSAM-DRC model, we used four evaluation indexes, PSNR, SSIM, IE and MSA, to evaluate the image quality after reconstruction of different models, and the results are shown in
Table 5.
Table 5 shows the specific results of evaluation indicators of different models in hyperspectral remote sensing image reconstruction. As can be seen from
Table 5, the PSNR and IE values of the SRGAN-MSAM-DRC model are the best among all models, and the SSIM value ranks second. In terms of MSA, the value of the SRGAN-MSAM-DRC model is only 1.203, which is also the best among all models. It is further shown that the SRGAN-MSAM-DRC model also has a good effect on reconstruction of hyperspectral remote sensing image by using the SRGAN-MSAM-DRC model. Compared with the original image, the reconstructed image has higher spectral similarity and little difference.
In general, the SRGAN-MSAM-DRC model proposed in this paper shows good performance both in traditional remote sensing image reconstruction and in hyperspectral remote sensing image reconstruction. Therefore, we believe that this model has certain advantages in the field of remote sensing image super-resolution reconstruction.
5. Conclusions
This study focuses on the applicability and performance of the improved SRGAN model in the reconstruction of remote sensing images using super-resolution. Through detailed experiments and analysis, the aim is to explore its effectiveness in practical applications. Firstly, we improved the SRGAN model by introducing multi-scale attention mechanisms and improving the model structure, aiming to enhance its performance. In the performance evaluation of the SRGAN-MSAM-DRC model, we used objective evaluation metrics such as PSNR, SSIM, and image entropy, and extensively tested them on the UCMLU dataset. From the results, we can conclude the performance of SRGAN-MSAM-DRC model is more outstanding than basic SRGAN model, proving that the proposed SRGAN-MSAM-DRC model can indeed reconstruct high-quality images of remote sensing. For the purpose of confirming the performance of the SRGAN-MSAM-DRC model, we also tested the Bicubic model, and the SRGAN model whose discriminator uses DenseNet network, and the SRGAN model with improved convolutional blocks, all under identical conditions. The results show the SRGAN-MSAM-DRC model performance is more outstanding than other models in various evaluation indicators. By comparing the reconstruction results and evaluation indicators of various models, we can conclude that the SRGAN-MSAM-DRC model exhibits good applicability and performance improvement in the reconstruction of remote sensing images using super-resolution.
Although the SRGAN-MSAM-DRC model has achieved certain results in super-resolution reconstruction algorithms, it can be improved. To begin with, there is a shortage of high-precision remote sensing image data, particularly the challenge of acquiring remote sensing images for specific areas. Therefore, future research can conduct more extensive training and testing on remote sensing images of different terrains to further optimize models and parameters. Secondly, reconstruction of remote sensing images using super-resolution mentioned in this article is trained on true color images, and is not involved in single band remote sensing data. Future work can further improve super-resolution reconstruction methods by preprocessing, training, and testing remote sensing images of different single band and band combinations. These improvements will help drive more significant research in this field.


