
Focusing Algorithm of Range Profile for Plasma-Sheath-Enveloped Target


College of Space Science and Technology, Xidian University, Xi’an 710126, China
*
Author to whom correspondence should be addressed.
Remote Sens. 2024, 16(8), 1475; https://doi.org/10.3390/rs16081475
Submission received: 29 February 2024
/
Revised: 29 March 2024
/
Accepted: 29 March 2024
/
Published: 22 April 2024
Abstract
:In this paper, a one-dimensional (1-D) range profile of the hypersonic target enveloped by a plasma sheath is investigated. Firstly, the non-uniform property of the plasma sheath is studied and its impact on the wideband electromagnetic (EM) wave is analyzed. A wideband radar echo model for the plasma-sheath-enveloped hypersonic target is constructed. Then, by exploiting the relationship among the incident depth, reflection intensity, and plasma velocity, it reveals that distinct scatter points in various areas of the target will suffer from varying reflection intensity and coupled velocity, leading to severe defocusing in the range profile. To tackle this issue, a novel focusing algorithm combing the Fractional Fourier Transform (FRFT) with the CLEAN technique is developed, which independently calculates the coupled plasma velocity and compensates for the phase error via a series of iterative procedures. Finally, the influence of the plasma sheath on the 1-D range profile and the effectiveness of the proposed focusing algorithm are validated through simulations.
1. Introduction
The radar detection of a hypersonic target in near space is an important research field and has attracted significant attention [1,2,3]. When the hypersonic target enters the atmosphere at a hypersonic speed, it causes friction with the atmosphere, generates a tremendous amount of heat, and ionizes the air around the spacecraft. Consequently, a plasma sheath around the spacecraft is created. The plasma sheath absorbs, attenuates, and reflects incident electromagnetic (EM) signals, significantly altering the EM characteristics [4,5,6,7]. On one hand, the plasma sheath will greatly reduce the intensity of EM signals. In severe cases, it can cause worse wave attenuation, leading to communication signal interruption, often known as an ionization blackout [6]. On the other hand, the plasma sheath would cause parasitic amplitude and phase modulation on EM signals, resulting in waveform distortion. Overall, the presence of a plasma sheath significantly affects the propagation and scattering characteristics of the incident radar signal, leading to radar detection and recognition failures of hypersonic targets.
In the 1960s, the National Aeronautics and Space Administration (NASA) conducted the Radio Attenuation Measurement-Computational (RAM-C) program flight experiments [4]. Thus, enormous amount of plasma data and numerical results were achieved. Based on this, the impact of the plasma sheath on the EM characteristics has been extensively studied. A large number of methods [8,9,10,11], such as the finite difference time domain method (FDTD) [8], transfer matrix method (TMM) [9], and transmission-line-matrix (TLM) [11], have been developed to study the reflection and transmission problems of the EM wave in plasma. So far, the transmission, reflection and polarization properties of the EM signals in the plasma have been comprehensively investigated in [12,13,14,15,16]. Moreover, by exploiting the time-varying properties of the plasma, several studies on amplitude and phase parasitic modulation over the EM signals have been reported in [17,18,19].
In recent years, radar detection of hypersonic targets enveloped by plasma sheath has been investigated. In [20,21], the spatial turbulence and temporal variation of the plasma electron density have been studied, and their effects on the transmitted and reflected electromagnetic signals have been numerically investigated. In [22], the impacts of the plasma sheath on the propagation, scattering, and radiation properties have been discussed. It shows that the backscattering radar cross section (RCS) can be significantly influenced by the plasma sheath, and this effect varies greatly depending on the altitude of the flying object. In [23,24], a time-varying plasma sheath model based on the Scattering Matrix Method (SMM) was established, where the amplitude attenuation and phase shift of the radar echo signal were examined. In addition, by integrating the velocity field distribution of the non-uniform plasma sheath, a plasma sheath inhomogeneous reflection model is constructed in [3,25,26,27,28]. It has been shown that the radar echo suffers from multitarget phenomenon on the 1-D range profile. Meanwhile, based on the parallel physical optics (PO) method, a hypersonic target EM scattering echo model is developed in [29,30], where a 1-D range profile and a multi-view ISAR imaging of an inhomogeneous plasma covered hypersonic vehicle are simulated. The aforementioned studies provide useful insight into the radar detection in the presence of plasma sheath. Nonetheless, due to the lack of real scenarios, there are still some deficiencies in these models, and the impact of the plasma sheath on the 1-D range profile or ISAR image has not yet been thoroughly investigated.
In this paper, the impact of the plasma sheath on the wideband 1-D range profile and ISAR image is investigated. Firstly, flow field properties of the plasma sheath are exploited and the reflection properties for the radar signal incident into the non-uniform plasma sheath is investigated. Based on it, a wideband radar echo model for a plasma-sheath-enveloped hypersonic target is constructed. Then, the de-chirp procedure is employed to investigate displacement/broadening phenomena of the 1-D range profile. The study results show that scatter points at different regions suffer from variable reflection intensities and varying intra-pulse coupled velocities, resulting in distinct phase errors, and defocused 1-D range profiles (ISAR images). To address this issue, by combining the Fractional Fourier Transform (FRFT) method with the CLEAN technique, an efficient FRFT-CLEAN-based focusing algorithm is developed. The proposed algorithm implements the coupled plasma velocity estimation and the associated phase error compensation iteratively to achieve an improved range profile and ISAR images.
The rest of this paper is organized as follows: Section 2 presents a brief review of the EM wave propagation characteristics in the plasma sheath. Section 3 derives the explicit wideband radar echo formulation of the plasma sheath enveloped target and analyzes the defocusing of the range profile. In Section 4, a focusing algorithm is developed. Section 5 uses numerical simulation results to validate the effectiveness of the proposed algorithm. Finally, conclusions are drawn in Section 6.
2. Analysis of EM Wave Reflection Property the Plasma Sheath
2.1. Calculation of the Plasma Reflection Coefficients
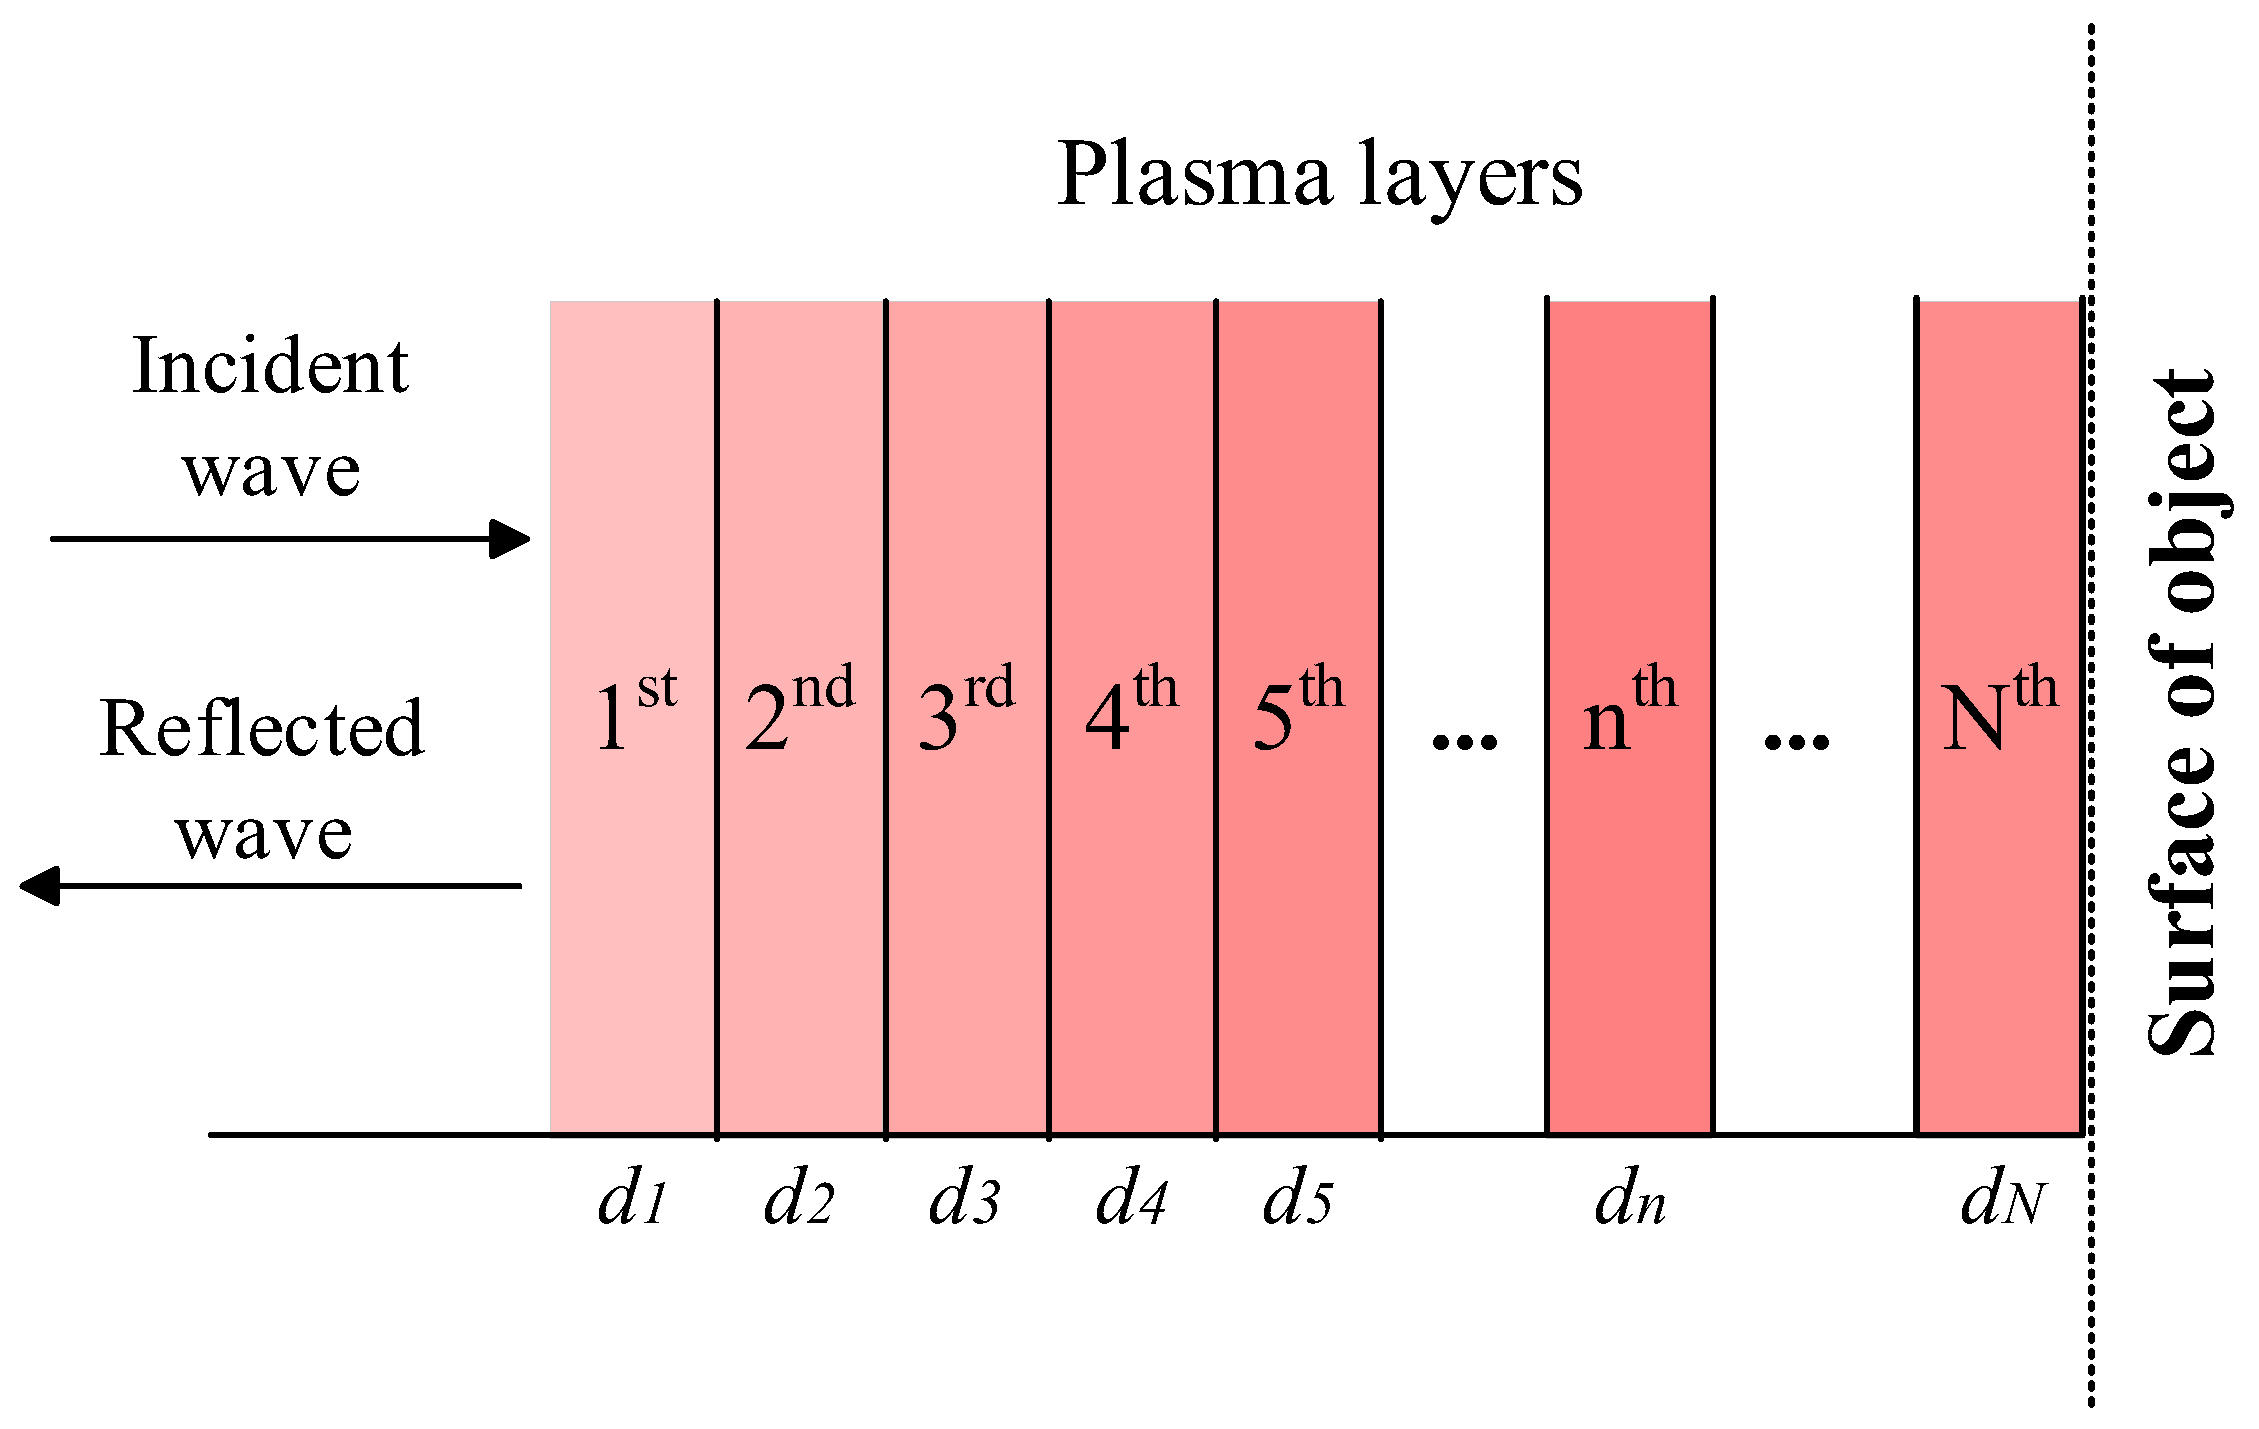
The plasma is a non-uniform and non-magnetized fluid that severely influences the incident EM wave. Generally, a non-uniform plasma is usually divided into multiple uniform plasma slab layers to investigate its impact on the incident EM wave. Figure 1 shows the geometric model of the layered plasma.
As shown in Figure 1, the non-uniform plasma is divided into N uniform plasma thin slabs, where denotes the thickness of the i-th slab. The electron density of the plasma usually resembles a bi-Gaussian distribution perpendicular to the aircraft surface. Suppose the electron density of the i-th slab is , then the plasma frequency of the i-th layer can be expressed as:
where is the unit charge, is the mass of electrons, and is the vacuum permittivity.
According to Maxwell’s equations and constitutive equations, the complex permittivity and the propagation coefficient of the i-th plasma layer can be achieved by:
where and denote the incident EM wave and the plasma collision frequency, respectively, while is the speed of light. As noted, the complex permittivity and propagation coefficient varied for each plasma layer.
The equivalent transmission line (ETL) [9] is a useful method for investigating the reflection properties of the EM wave within a non-uniform plasma. Specifically, the ETL technique employs a cascaded and recursive calculation of each thin layer of the plasma to determine the EM transmission characteristics in the non-uniform plasma. In this method, the total transmission matrix of the plasma can be obtained by multiplying the transmission matrices of each layer:
where
where represents the i-th layer intrinsic wave impedance, while , , and stand for the transmission matrix parameters. Then, the total reflection coefficient of the plasma can be calculated as follows:
where with and represent the amplitude and phase coefficients, respectively. and stand for the wave impedance of the incident medium and the (N + 1)-th reflection medium, respectively, In this study, it is assumed that the target is made of metal. Then, if the EM wave penetrates the plasma and is reflected from the target’s surface, the reflection coefficient is simplified as with .
2.2. EM Reflection Property in the Plasma Sheath
The plasma flow field is highly correlated with the hypersonic target’s aerodynamic shape, trajectory, velocity, altitude and local air condition. In this study, the classical RAM-C blunt cone model is adopted and its associated computational fluid dynamics (CFD) flow field simulation data are used. In particular, the ionization wake caused by the tail of the spacecraft is not considered in this paper.
Figure 2a shows the classical geometry model of the RAM-C blunt cone. Figure 2b,c illustrate the electron density distribution and velocity field distribution of the plasma sheath at a flight altitude of 30 km and a velocity of 15 Ma, respectively. It can be seen from Figure 2b that the electron density changes sharply from the stagnation point to the tail of the target. The peak electron density covers several orders of magnitude. The electron density is up to m−3 at the stagnation point and drops to m−3 in the tail. Perpendicular to the surface of the aircraft, the electron density exhibits a pronounced variation and obey a bi-Gaussian distribution. Similarly, the velocity field of the plasma possesses a non-uniform distribution. The plasma velocity is highest near the stagnation point area, which is close to the target’s speed, and rapidly declines from the stagnation point to the tail [22]. In the direction perpendicular to the aircraft’s surface, the velocity of each layer increases initially and then decreases from the outside to the inside.
The EM propagation characteristic in the plasma is highly correlated with the plasma frequency [3]. When the plasma frequency is greater than the incident EM frequency , the EM wave cannot penetrate the plasma, and the strongest reflection occurs inside of the plasma. Otherwise, the EM can penetrate the plasma, and the strongest reflection occurs on the target’s surface. Consequently, the calculated plasma frequency parallel to the target surface varies drastically, and the incident EM will suffer from varying incidence depth along the plasma-sheath-enveloped target. Figure 2d displays the partial reflection characteristics diagram where the dotted white line represents the reflection surface in the plasma sheath. For the high electron density area, the EM wave can be entirely reflected at a specified depth. For the low electron density area, EM waves pass through the plasma sheath and are reflected by the target’s surface. Furthermore, it also causes varying reflection intensity from the head to the tail. Based on the aforementioned, the incident EM wave at different regions will suffer from different incident depths, reflection intensities, and couple varied plasma velocities, leading to differentiated EM reflection properties.
3. Wideband Radar Echo Model of the Plasma-Sheath-Enveloped Target
Figure 3 shows the schematic diagram of the plasma-sheath-enveloped hypersonic target. The hypersonic target is assumed to be flying horizontally with the velocity of . A wideband radar signal is sent towards the target at an angle of , which is the angle between the fly direction of the target and the radar line of sight. Suppose that there are K dominant scatter points on the target, and the widely used linear frequency modulation (LFM) signal is transmitted. Then, the radar echo of the target can be expressed as:
where , , and represent the carrier frequency, the pulse width, the bandwidth and the chirp rate of the transmitted signal, respectively, and denote the fast distance time and slow azimuth time, respectively, is the full time and is the rectangular window. In particular, and denote the reflection intensity and phase coefficients of the k-th scatter points, respectively, indicates the instantaneous delay and represents the loss brought by the fixed link, which is closely depend on the transmitter power, distance between target and radar, signal-to-noise ratio, antenna gain and antenna diameter.
After applying down-converted and de-chirped processes, the output is expressed as follows:
where, indicates the distance between the k-th scatter point and the reference one with , and is the distance reference delay.
Since the plasma sheath is a non-uniform fluid, the hypersonic target’s structure has a significant impact on the plasma sheath’s shape and flow field distribution. From this point, the plasma-sheath-enveloped hypersonic target is a complicated fluid-enveloped target. Previous investigation indicates that there are two main differences between the echo in a plasma sheath and the traditional one:
- Due to the non-uniform property of the plasma, radar signals penetrate through different propagation courses at different sub-regions for the plasma-sheath-enveloped target, resulting in varying incident depths in the sheath. As a result, the signal amplitude and its phase are weakened and distorted significantly.
- When the speed of the vehicle is greater than 10 Ma, the “stop-and-go” assumption used for low-speed targets is no longer valid and the target motion in the intra-pulse must be considered. The high speed and high maneuvering of the target will result in intra-pulse mismatch and inter-pulse range migration. Therefore, the offset and defocus phenomenon caused by an intra-pulse mismatch should be addressed to achieve a precise 1-D range profile.
In reality, the radar echo inevitably suffers from the high-order phase error caused by the target maneuvers and phase jitter induced by time-varying characteristics of the plasma sheath. In this paper, we mainly focus on the influence of the steady plasma sheath over the radar signal. Thus, some assumptions are adopted to facilitate the analysis.
- (a)
- The hypersonic target flies at a steady state with a constant velocity, which means the acceleration of the target can be ignored.
- (b)
- Time-varying characteristics of the plasma sheath are not considered. Specifically, the plasma sheath causes a fixed amplitude attenuation and a fixed phase shift for each scatter point.
- (c)
- The angle between the motion trajectory and the radar line of sight stays constant during the observation period. In this paper we assume .
Based on the above analysis, the instantaneous slant distance from the k-th scatter point to the radar can be expressed as:
where is the initial distance of the target, while represents the velocity of the real target. The acceleration of the target is ignored here. is the intra-pulse plasma coupled velocity with . Obviously, is the distance variation caused by plasma sheath. Apparently, the distance variation for different scatter points varied from the stagnation point to the target’s tail.
By substituting Equation (9) into Equation (8), the wideband radar echo of the plasma-sheath-enveloped target can be formulated as:
where represents the scale factor, and . Additionally, the coupled velocity of the plasma sheath results in the compressed/spread of the echo pulse width. As shown in Equation (10), the phase term after mixing includes four items: the residual video phase term (RVP) , which is generated due to the demodulation process; the linear phase term resulting in the linear Doppler shift; the linear term , and the quadratic term . The coupled plasma velocity causes the offset in and broadens in .
Further, by performing Fourier transform with respect to the fast-time over Equation (10), the range profile of the plasma-sheath-enveloped wideband radar echo can be obtained:
where .
Considering that is small and negligible, Equation (11) can be simplified as:
where implies the real position of target scatter points at different distance units, represents the shift term caused by the target motion and characterizes the shift term caused by the coupled velocity during an intra-pulse. As Equation (12) shown, the presence of the plasma sheath brings to the displacement and broadening, significantly distorting the target’s 1-D range profile. Furthermore, the displacement and the broadening are closely related to the coupled velocity. Since different scatter points possess various coupled velocities, the 1-D range profile suffers from different displacements and broadening, thus yielding severe defocusing.
4. Focusing Algorithm for 1-D Range Profile in the Presence of Plasma Sheath
To achieve a high-resolution range profile, it is necessary to develop an effective compensation algorithm to eliminate the influence of the plasma sheath. To facilitate the analysis, Equation (10) is reformulated as follows:
where , noise indicates the additive complex Gaussian white noise. Equation (13) identifies the radar echo after the mixing process including the primary and secondary phase terms. It is the superposition of multiple LFM signals where the frequency and chirp rate are dependent on the coupled velocity. Apparently, the range profile’s displacement and broadening are caused by the primary and secondary phase terms, respectively. Therefore, the range profile defocus suppression brought on by the plasma sheath depends critically on the estimated coupled velocity. Considering that the amplitude of the radar echo in the presence of the plasma sheath will deteriorate significantly, the defocus compensation problem can be reformulated as a parameter estimation problem under the low signal-to-noise ratio (SNR) environment. Additionally, due to the non-uniform properties, the reflection intensity and the coupled velocity of the signal will vary in different regions. Thus multiple scatter points undergo various reflection intensities and different degrees of defocusing. Furthermore, the huge intensity difference among multiple scatter points will make weak scatter points submerged in strong scatter ones, leading to parameter estimation failure.
As Equation (13) shown, the signal after mixing procedure approximates a combination of multiple frequency modulated signals. From this point, the defocus suppression can be achieved by constructing the phase compensation function. The range profile focusing can be implemented by plasma velocity estimation and phase compensation function. As it observed, the coupled velocity can be calculated by estimating the carrier frequency and chirp rate of the LFM signal. Due to its superior capability of holding a high time-frequency energy concentration, FRFT is widely used in the detection and parameter estimation of multi-component LFM signals [26]. The FRFT of the signal with a rotation angle and a fractional order is defined as:
where is the kernel function, and it is given by:
where represents an integer. According to the property of the FRFT, signals exhibit various energy concentration characteristics in various fractional Fourier domains. When the angle is properly chosen, the time-frequency distributions become perpendicular to the axis, and these signals will be separated. Hence, the energy distribution of the signal will be concentrated in the plane by projecting it onto a rotated frequency axis. Then, signal detection and parameter estimation can be achieved by implementing the following peak search:
where and indicates the estimated chirp rate and initial frequency , respectively. Then the coupled velocity of the plasma sheath can be obtained:
Benefiting from this, the compensation function can be formulated as:
Multiplying the compensation function with the signal in the time domain eliminates the primary and secondary phase terms and thus, a focused range profile can be achieved. FRFT could deal with the parameter estimation of the multi-component LFM signals while the cross-term interference is avoided. Nevertheless, directly adopting the above method will still result in performance degradation. Due to the non-uniform distribution of the plasma, scatter points suffer from different reflection intensities. Assume an aircraft flying at a flight altitude of 50 km and a speed of 20 Ma. The plasma sheath might cause an amplitude attenuation of roughly −5 dB at the stagnation point, −9 dB at the intermediate position, and −11 dB at the tail. This uneven attenuation can inspire one scatter to be much more intense than another, and strong scatter points have the potential to seriously influence and submerge weaker scatter points. To overcome this problem, a signal separation technique, CLEAN, is engaged. Specifically, the strongest component is detected and estimated based on FRFT, and then, it is subtracted from the signal. The procedure will be repeated until all scatter points are detected and compensated.
Based on the above analysis, an effective FRFT-CLEAN-based focusing algorithm is developed by combining the FRFT and CLEAN techniques. The procedure of the proposed algorithm is described in Table 1.
5. Simulation and Analysis
Simulations are conducted to evaluate the influence of the plasma sheath over the range profile and verify the effectiveness of the proposed focusing algorithm for the plasma-sheath-enveloped target. To demonstrate the accuracy of the theoretical analysis, a typical RAM-C reentry target model and its CFDs flow filed simulation data are used. In addition, two indicators, Peak Sidelobe Ratio (PSLR) and Integrated Sidelobe Ratio (ISLR), are used to evaluate the focusing performance of the reconstructed range profile. PSLR is the ratio of the main lobe to the highest sidelobe in a range profile, while ISLR is the ratio of the main lobe to the energy of the rest of the range profile. In this study, is assumed to be 1 and the signal is injected into the plasma at the angle of .
5.1. Validation of the Proposed Algorithm over the Signal Scatter
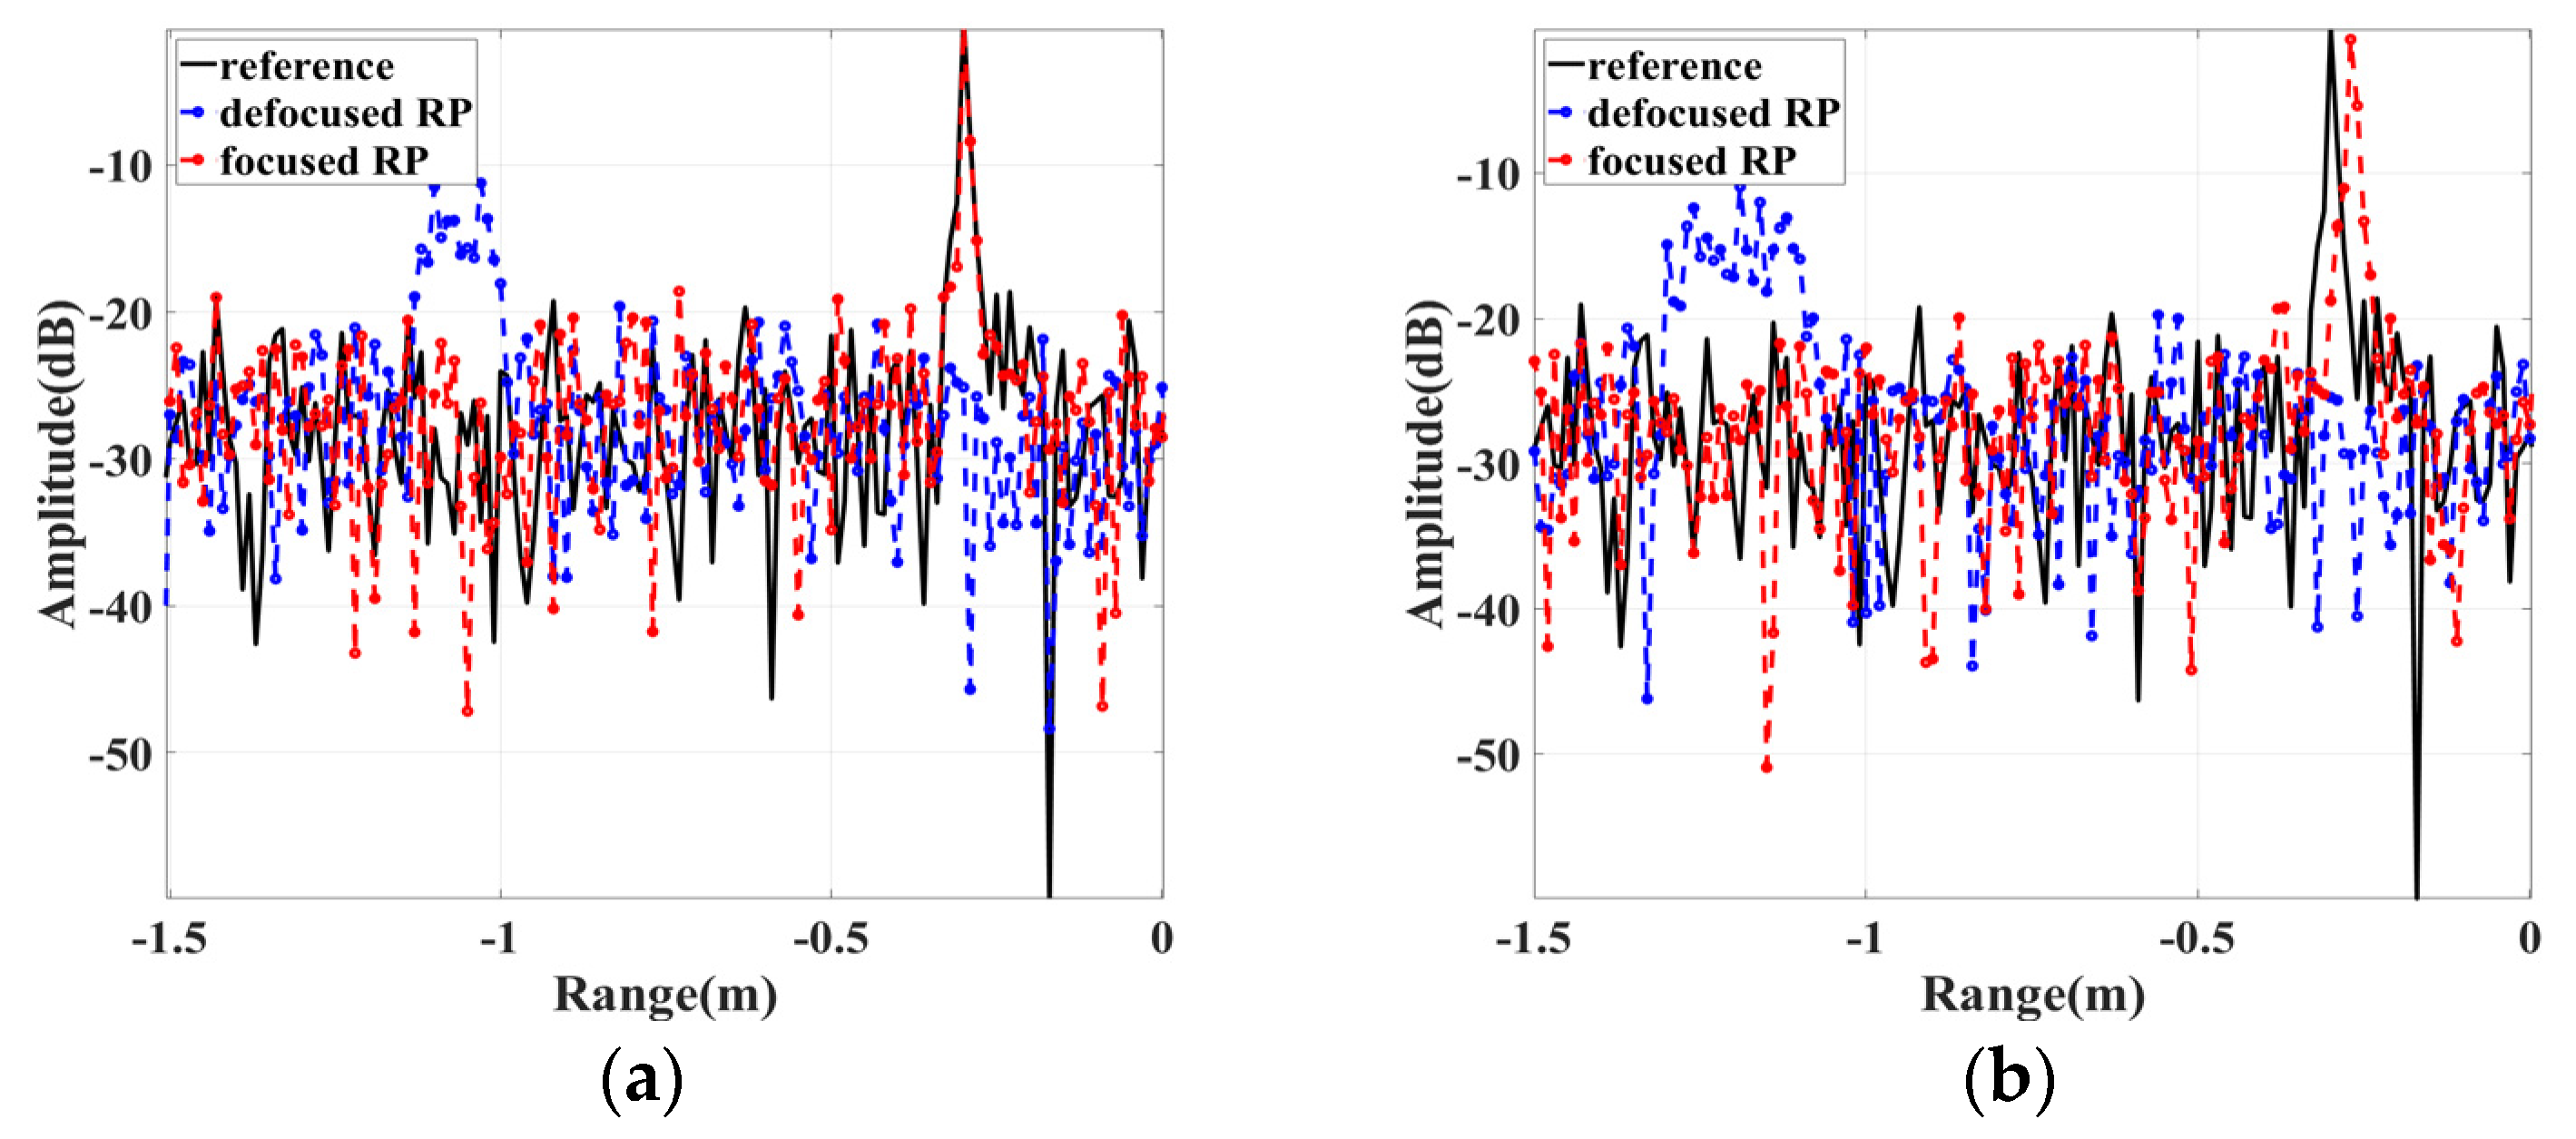
In this simulation, the influence of the intra-pulse velocity over the range profile of the wideband radar echo is investigated, and the performance of the proposed focusing algorithm over a signal scatter point is validated. The transmitted signal is the LFM signal with a carrier frequency of 10 GHz. The pulse duration is 100 μs, and the bandwidth is 1 GHz. The complex white Gaussian noise is added into the echo with SNR being 2 dB. The reflection intensity of the scatter points is equal to 1. Two intra-pulse velocities, and were selected for simulation. Figure 4 displays the range profiles of the signal scatter points with different coupled plasma velocities, where the reference represents the range profile without a plasma sheath. The blue and red lines represent the range profile with plasma sheath contaminated and compensated, respectively. Table 2 lists the estimated coupling velocities and the evaluated indicators PSLR and ISLR values.
The blue line in Figure 4 shows that the high coupled velocity results in the broadened main lobe and the reduced peak of the range profile. Compared with the reference one (without plasma sheath), the range profiles contaminated by intra-pulse velocity undergo obvious displacement and broadening, yielding degrees of defocusing. Furthermore, the higher the coupled velocity, the more severe the defocusing. This also implies that the conventional de-chirp pulse compression method is not suitable for the range focusing of a high-speed target. In contrast, the red line demonstrates that the range profile obtained with the proposed focusing algorithm almost overlaps with the reference one, where the displacement and burdening have been corrected significantly. Table 2 shows that the real coupled velocity is 5100 and the estimated velocity is 5183 with an estimation error of 1.63%. Furthermore, the PSLR value is decreased from −0.8419 dB to −8.8674 dB, while the ISLR value is decreased from 7.3152 dB to −4.4451 dB. The PSLR and ISLR demonstrate the superior performance of the proposed algorithm in velocity estimation and defocus compensation in the presence of a plasma sheath. Moreover, the result for the velocity = 6800 also exhibits a similar conclusion. In brief, the proposed algorithm effectively suppresses the defocusing phenomenon caused by coupled velocity.
5.2. Validation of the Proposed Algorithm over the RAM-C
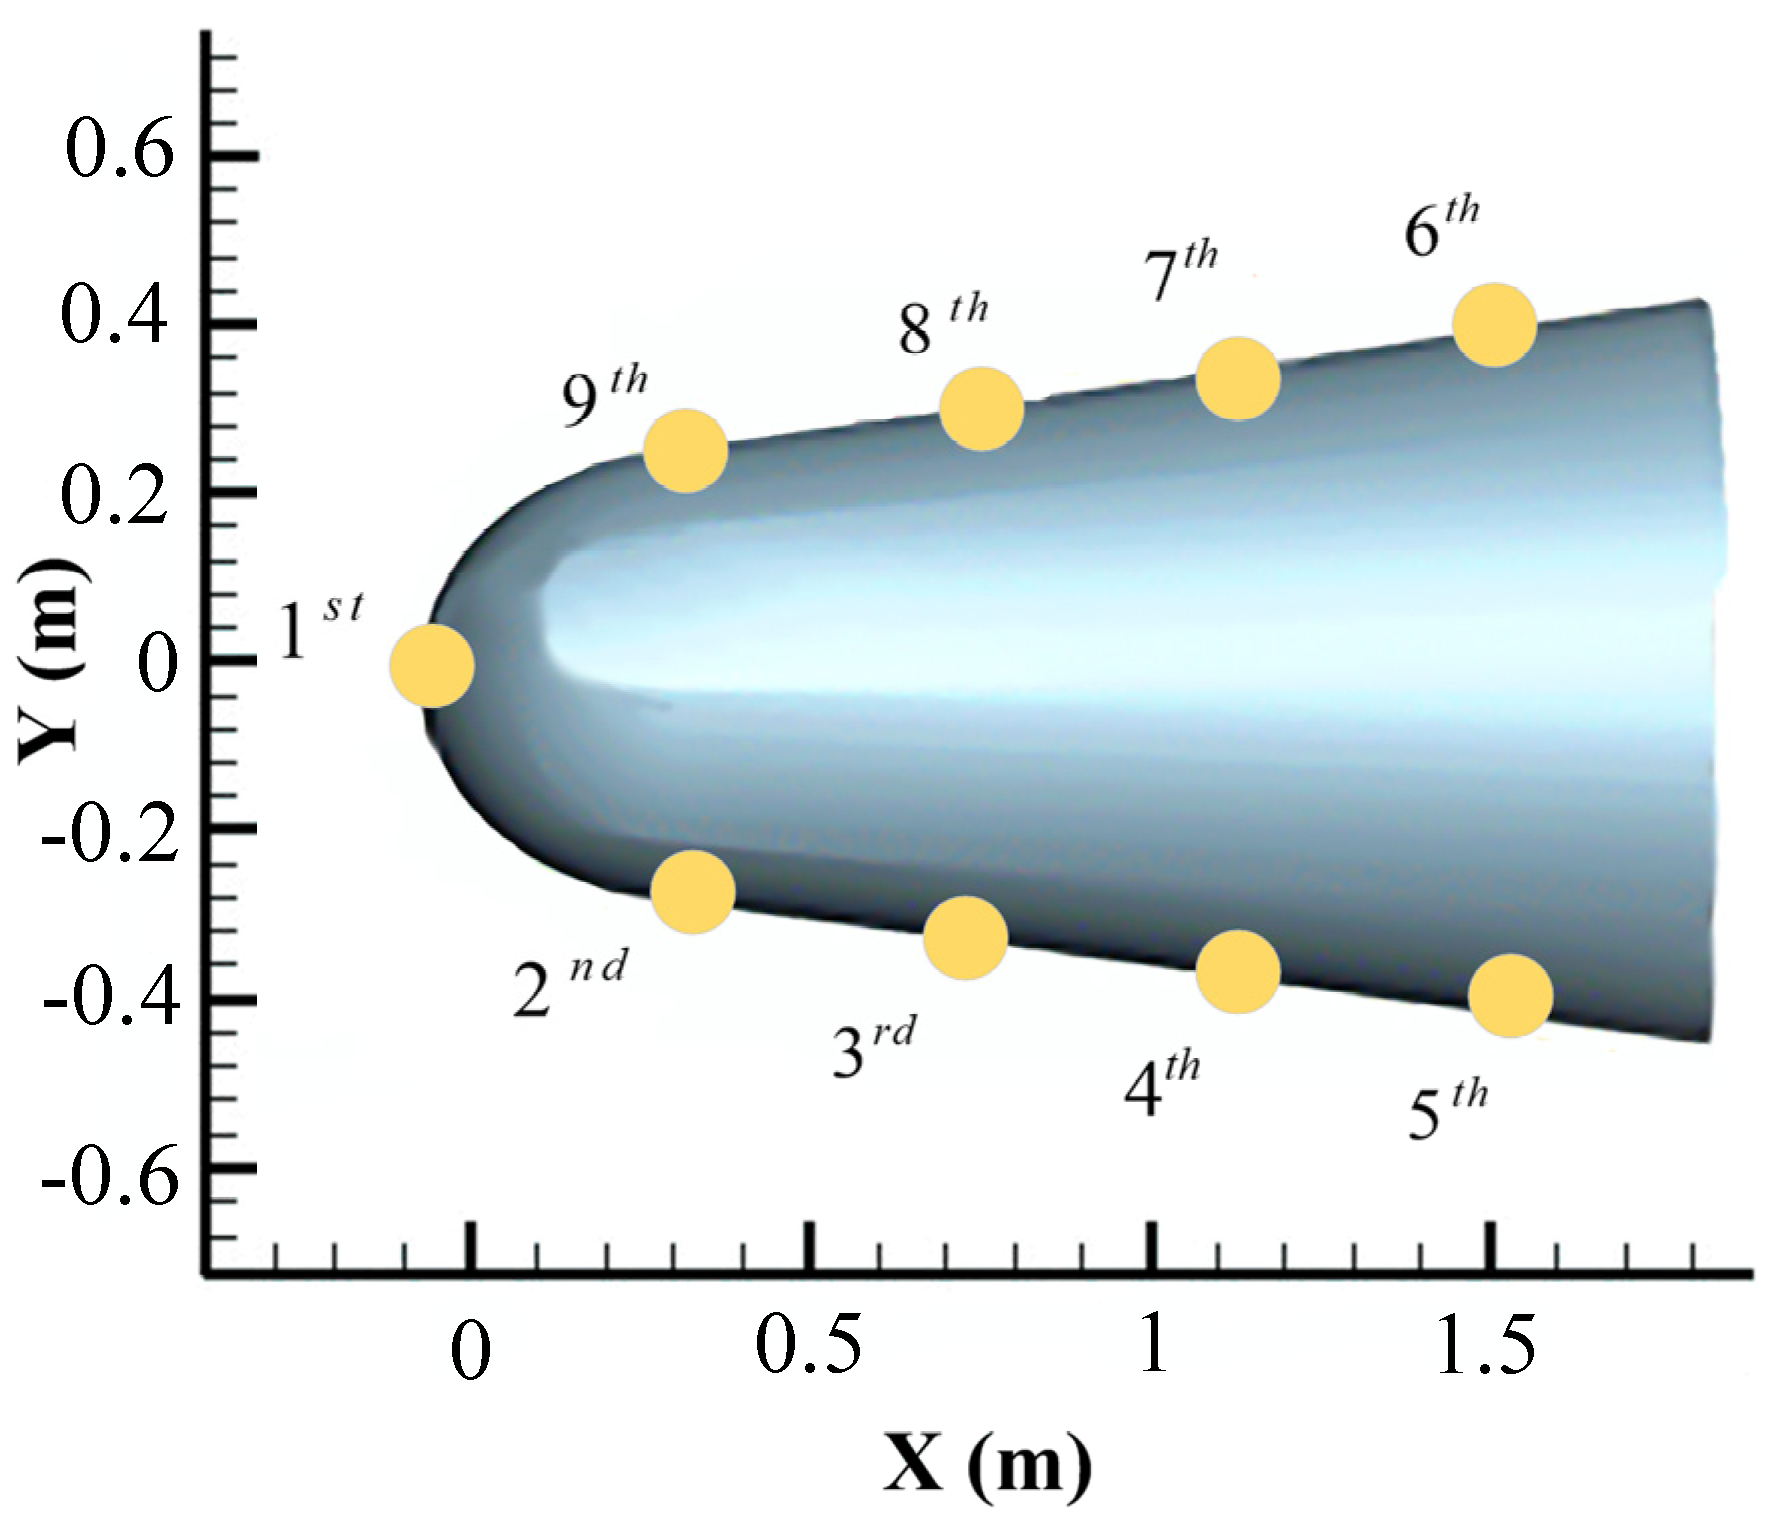
In this simulation, the typical RAM-C model and associated CFD flow filed simulation data are used to test the universality of the proposed algorithm. Figure 5 illustrates the geometric model of a typical RAM-C target, where nine scatter points along the stagnation point to the tail of the target are uniformly selected for the simulation. The yellow circles refer to the ninth scatter point on the target. All other signal parameters were identical to the previous simulation. Table 3 lists the plasma sheath parameters of the nine scatter points at a flight altitude of 50 km and a speed of 20 Ma. The reflection intensity and incident depth were calculated based on the TEL method and then the associated coupled velocity was determined. In addition, SNR was set to be 2 dB. In Table 3, , , and represent the peak electron density, the reflection amplitude and the reflection phase, respectively.
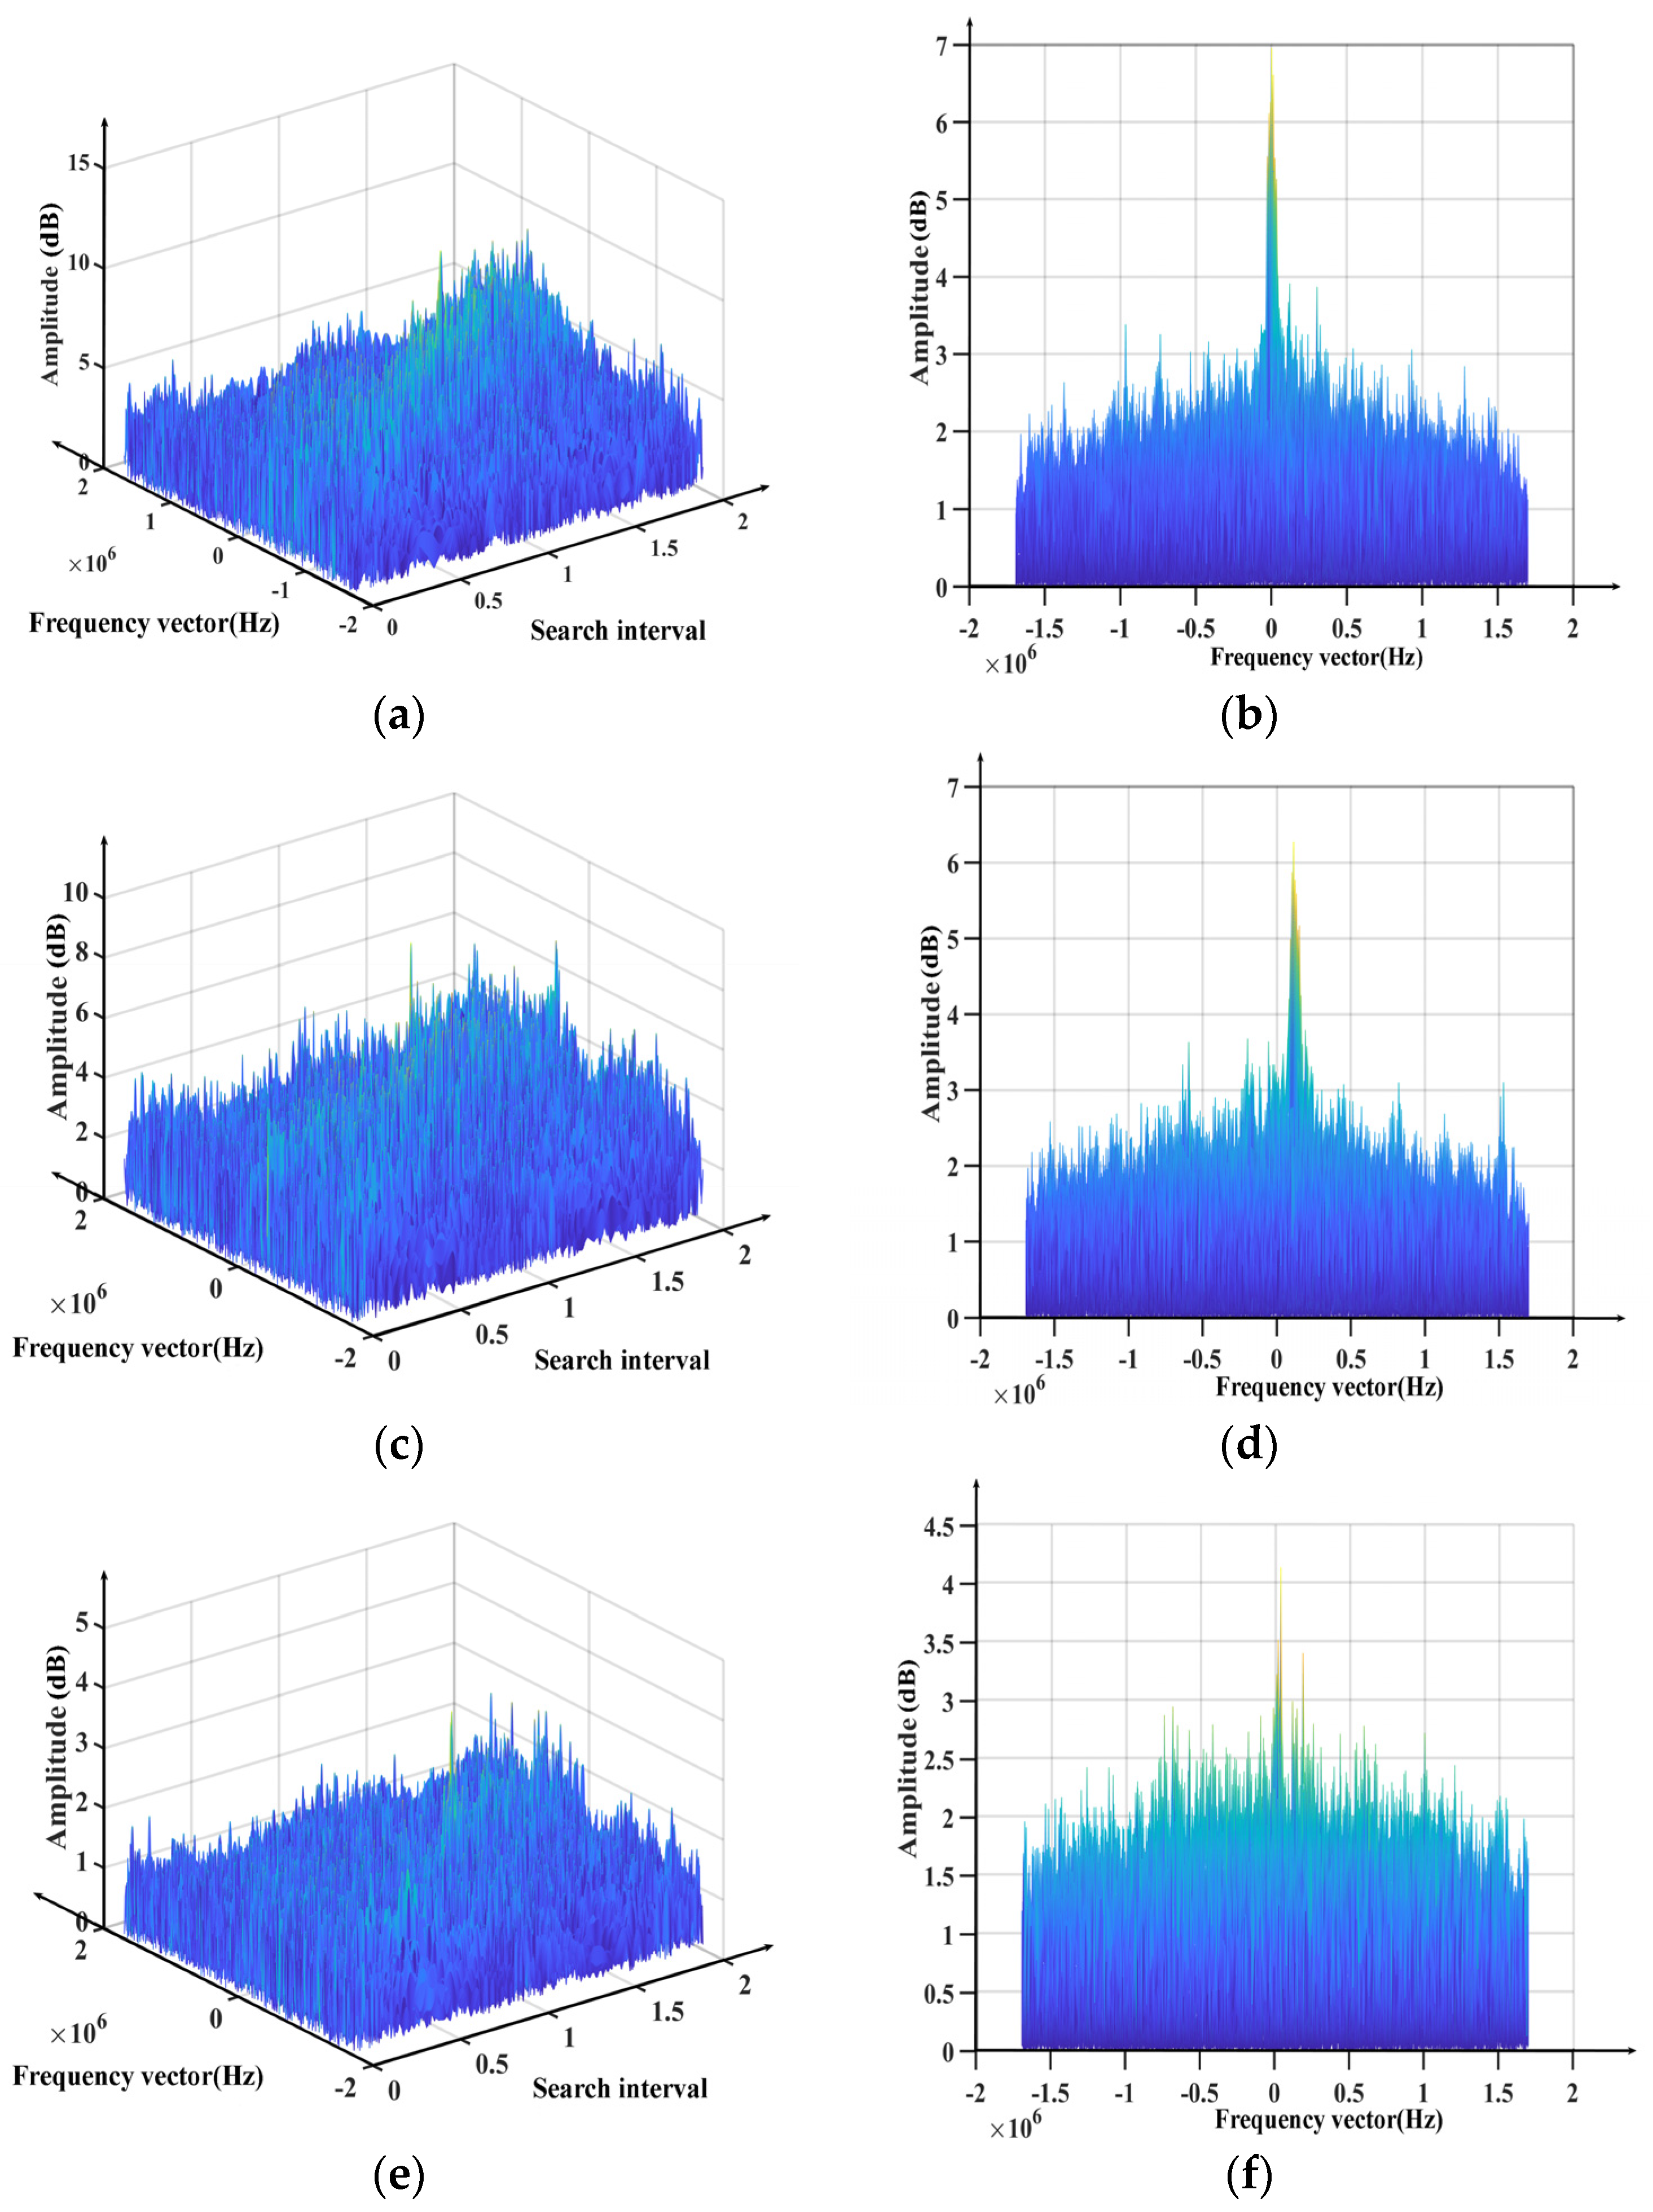
Figure 6a–f show the range profiles (without and with plasma sheath), original and defocused ISAR images of the plasma-sheath-enveloped target, FRFT energy distribution and profile view of the FRFT with fixed α, respectively.
It can be seen that in the presence of the plasma sheath, Figure 6b suffers from severe energy attenuation compared with the reference. Due to the non-uniform property of the plasma sheath, the wideband radar wave has variable incidence depths at different regions, which results in nine scatter points coupled with different velocities and reflection intensities. The range profiles of nine scatter points exhibit varied displacement and broadening, causing severe defocusing in the range profile. Similarly, compared with the original one, the ISAR image of the plasma-sheath-enveloped target suffers from severe defocusing, making it difficult to distinguish between the nine scatter points. Figure 6e,f show the corresponding FRFT energy distribution and its profile view with a fixed . It can be seen from the figure that reflection intensity varied significantly, where the weak intensity scatter points is submerged by the strong intensity scatter points, leading to the subsequent peak detection and parameter estimation failure.
Figure 7 displays the reconstructed range profile and the ISAR image by applying the proposed FRFT-CLEAN-based focusing algorithm. The proposed algorithm allows for individual estimation of the coupled velocities, effectively eliminating displacement and broadening. This results in a focused range profile, leading to a high-resolution ISAR image.
To further exhibit the superior capability of the proposed algorithm in detecting the weak components submerged by the stronger ones, parameter estimation of multicomponent LFM signal using the CLEAN strategy is conducted iteratively. Figure 8 individually displays the FRFT component of the first, fifth and ninth scatter points through different iterations. All the peaks related to the various scatter points are extracted using the CLEAN strategy, as shown in Figure 6d. In this case, the weak scatter point (such as the first scatter) submerged by other strong scatter points is extracted, and then the related coupled velocity is estimated separately.
Table 4 illustrates the estimated coupled velocities and the measured PSLR and ISLR. It can be seen from Table 4 that all the scatter points are identified and associated coupled velocities are accurately estimated, with an average velocity error of 3.20%. Moreover, both PSLR and ISLR are significantly improved. On average, PSLR increases by 7.50 dB and ISLR by 8.42 dB. This improvement is consistent with the visual result of the range profile in Figure 6.
5.3. ISAR Imaging
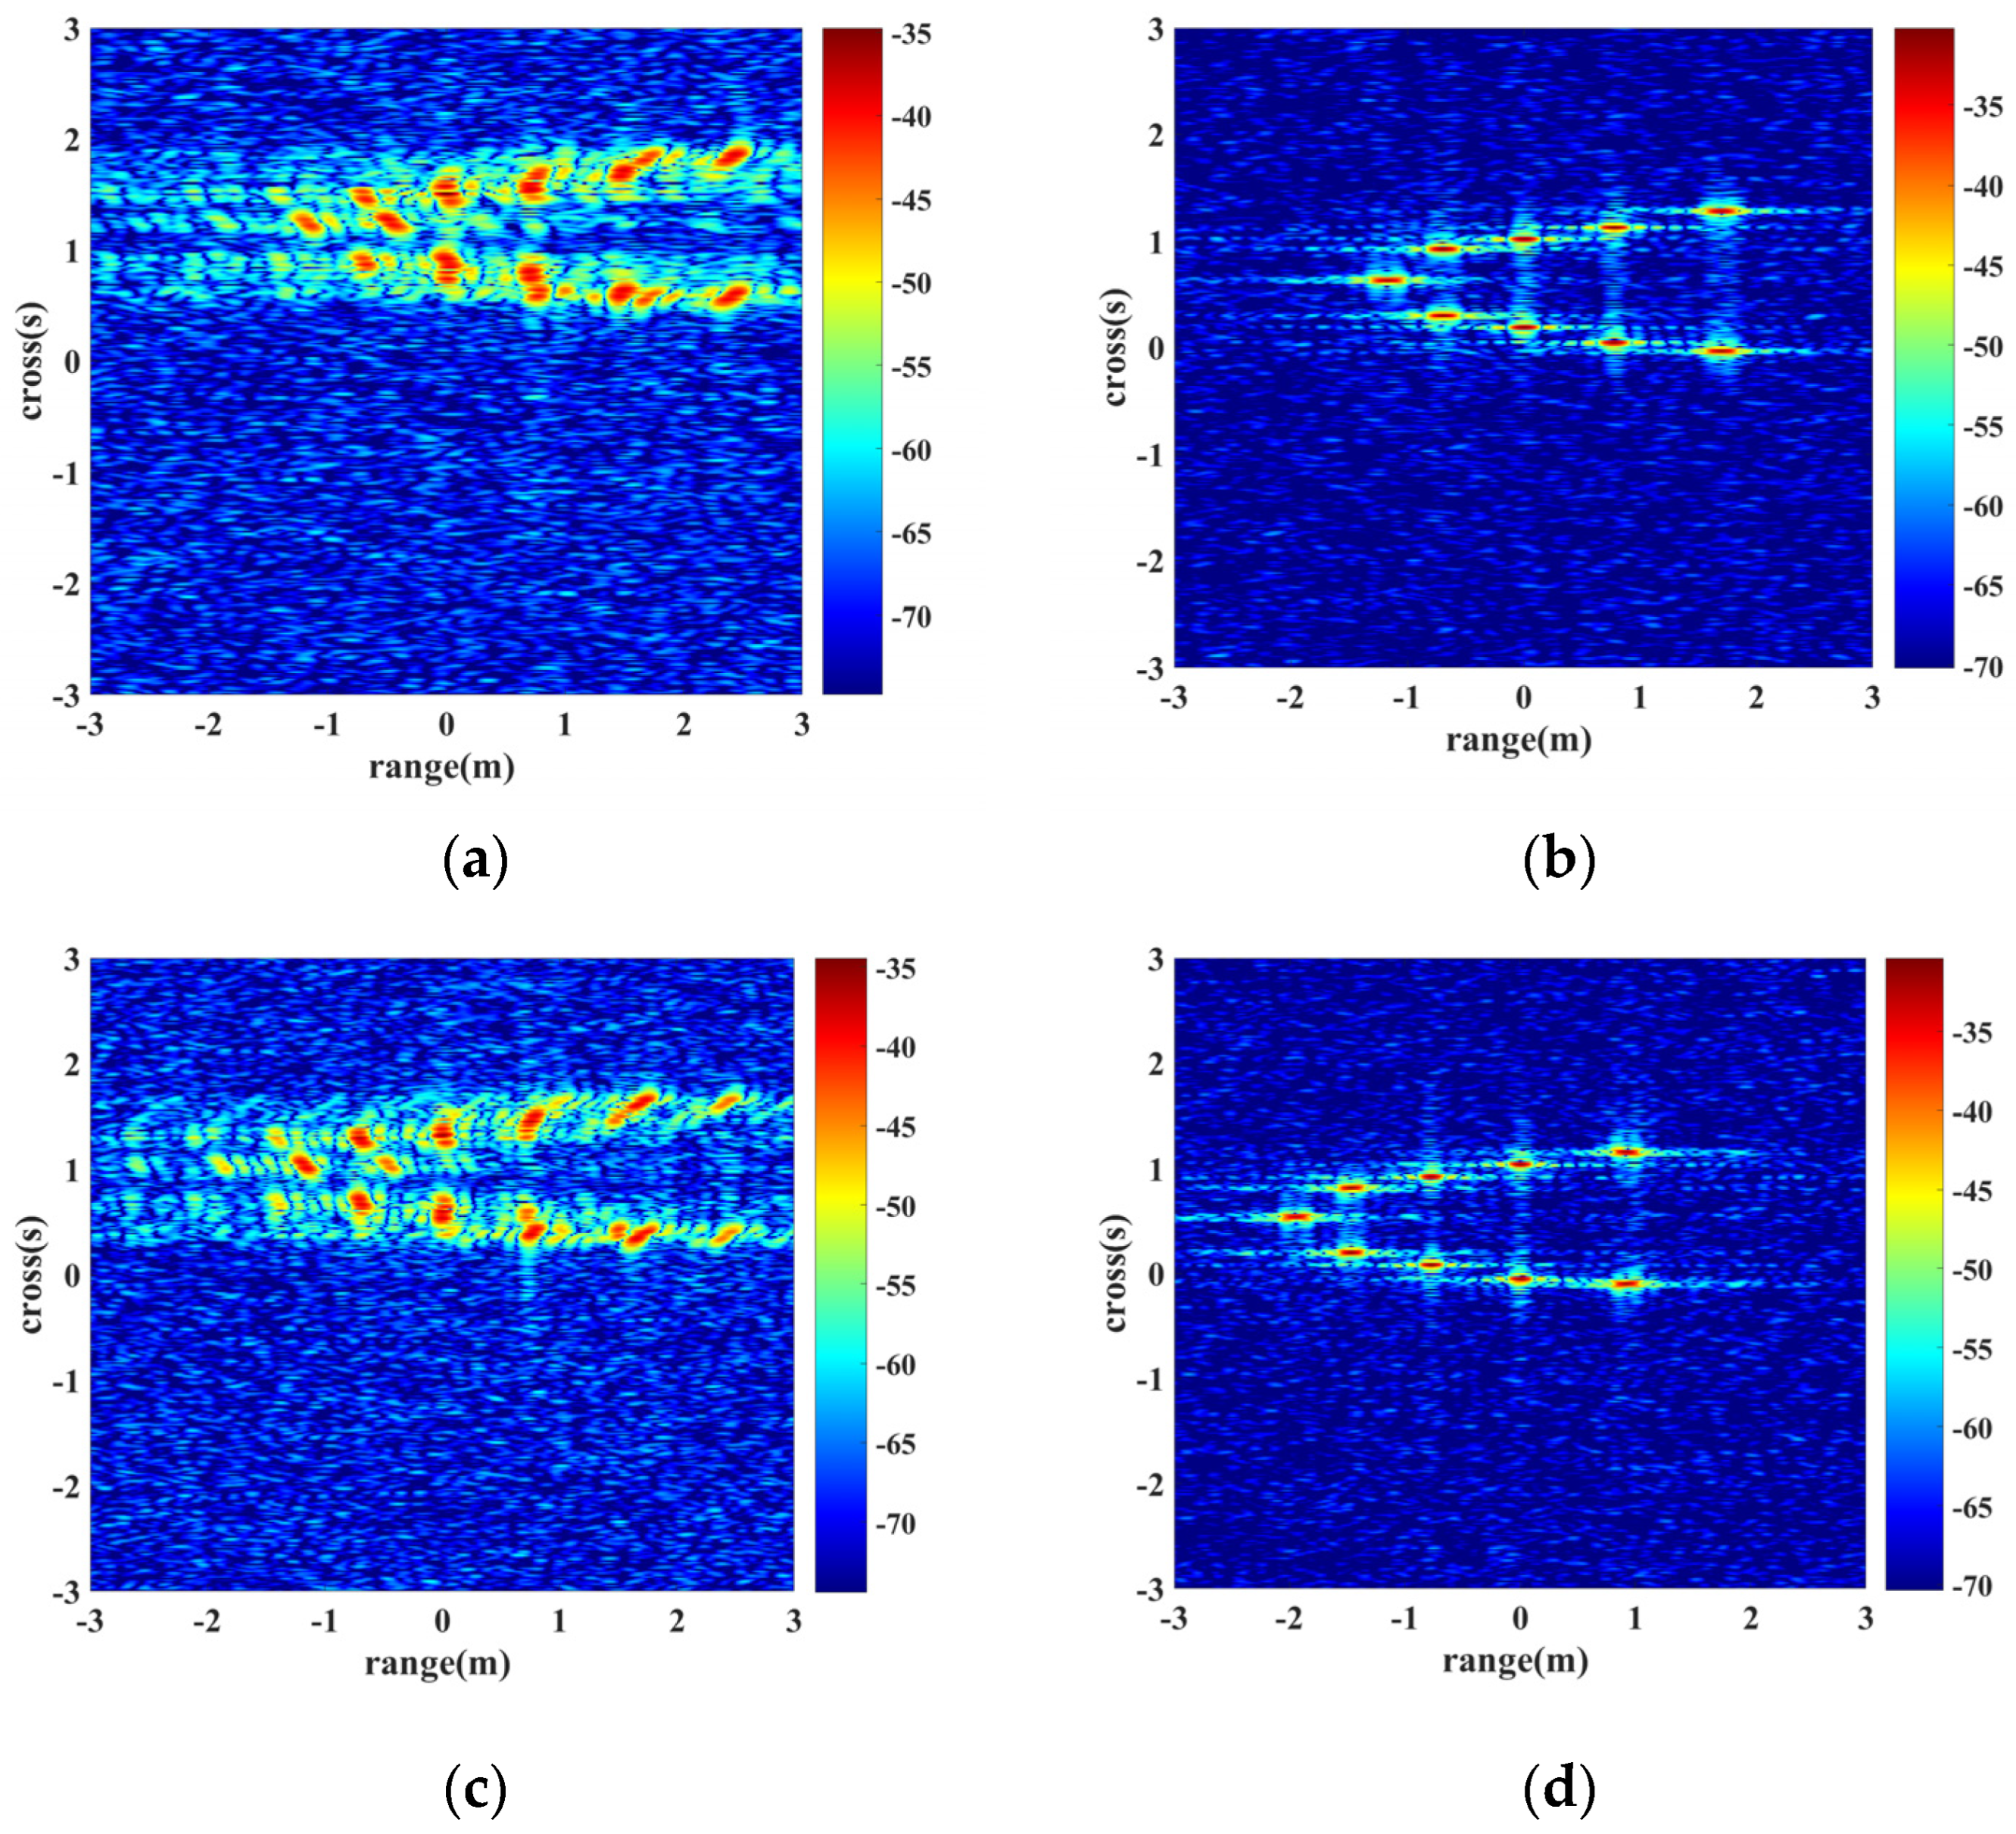
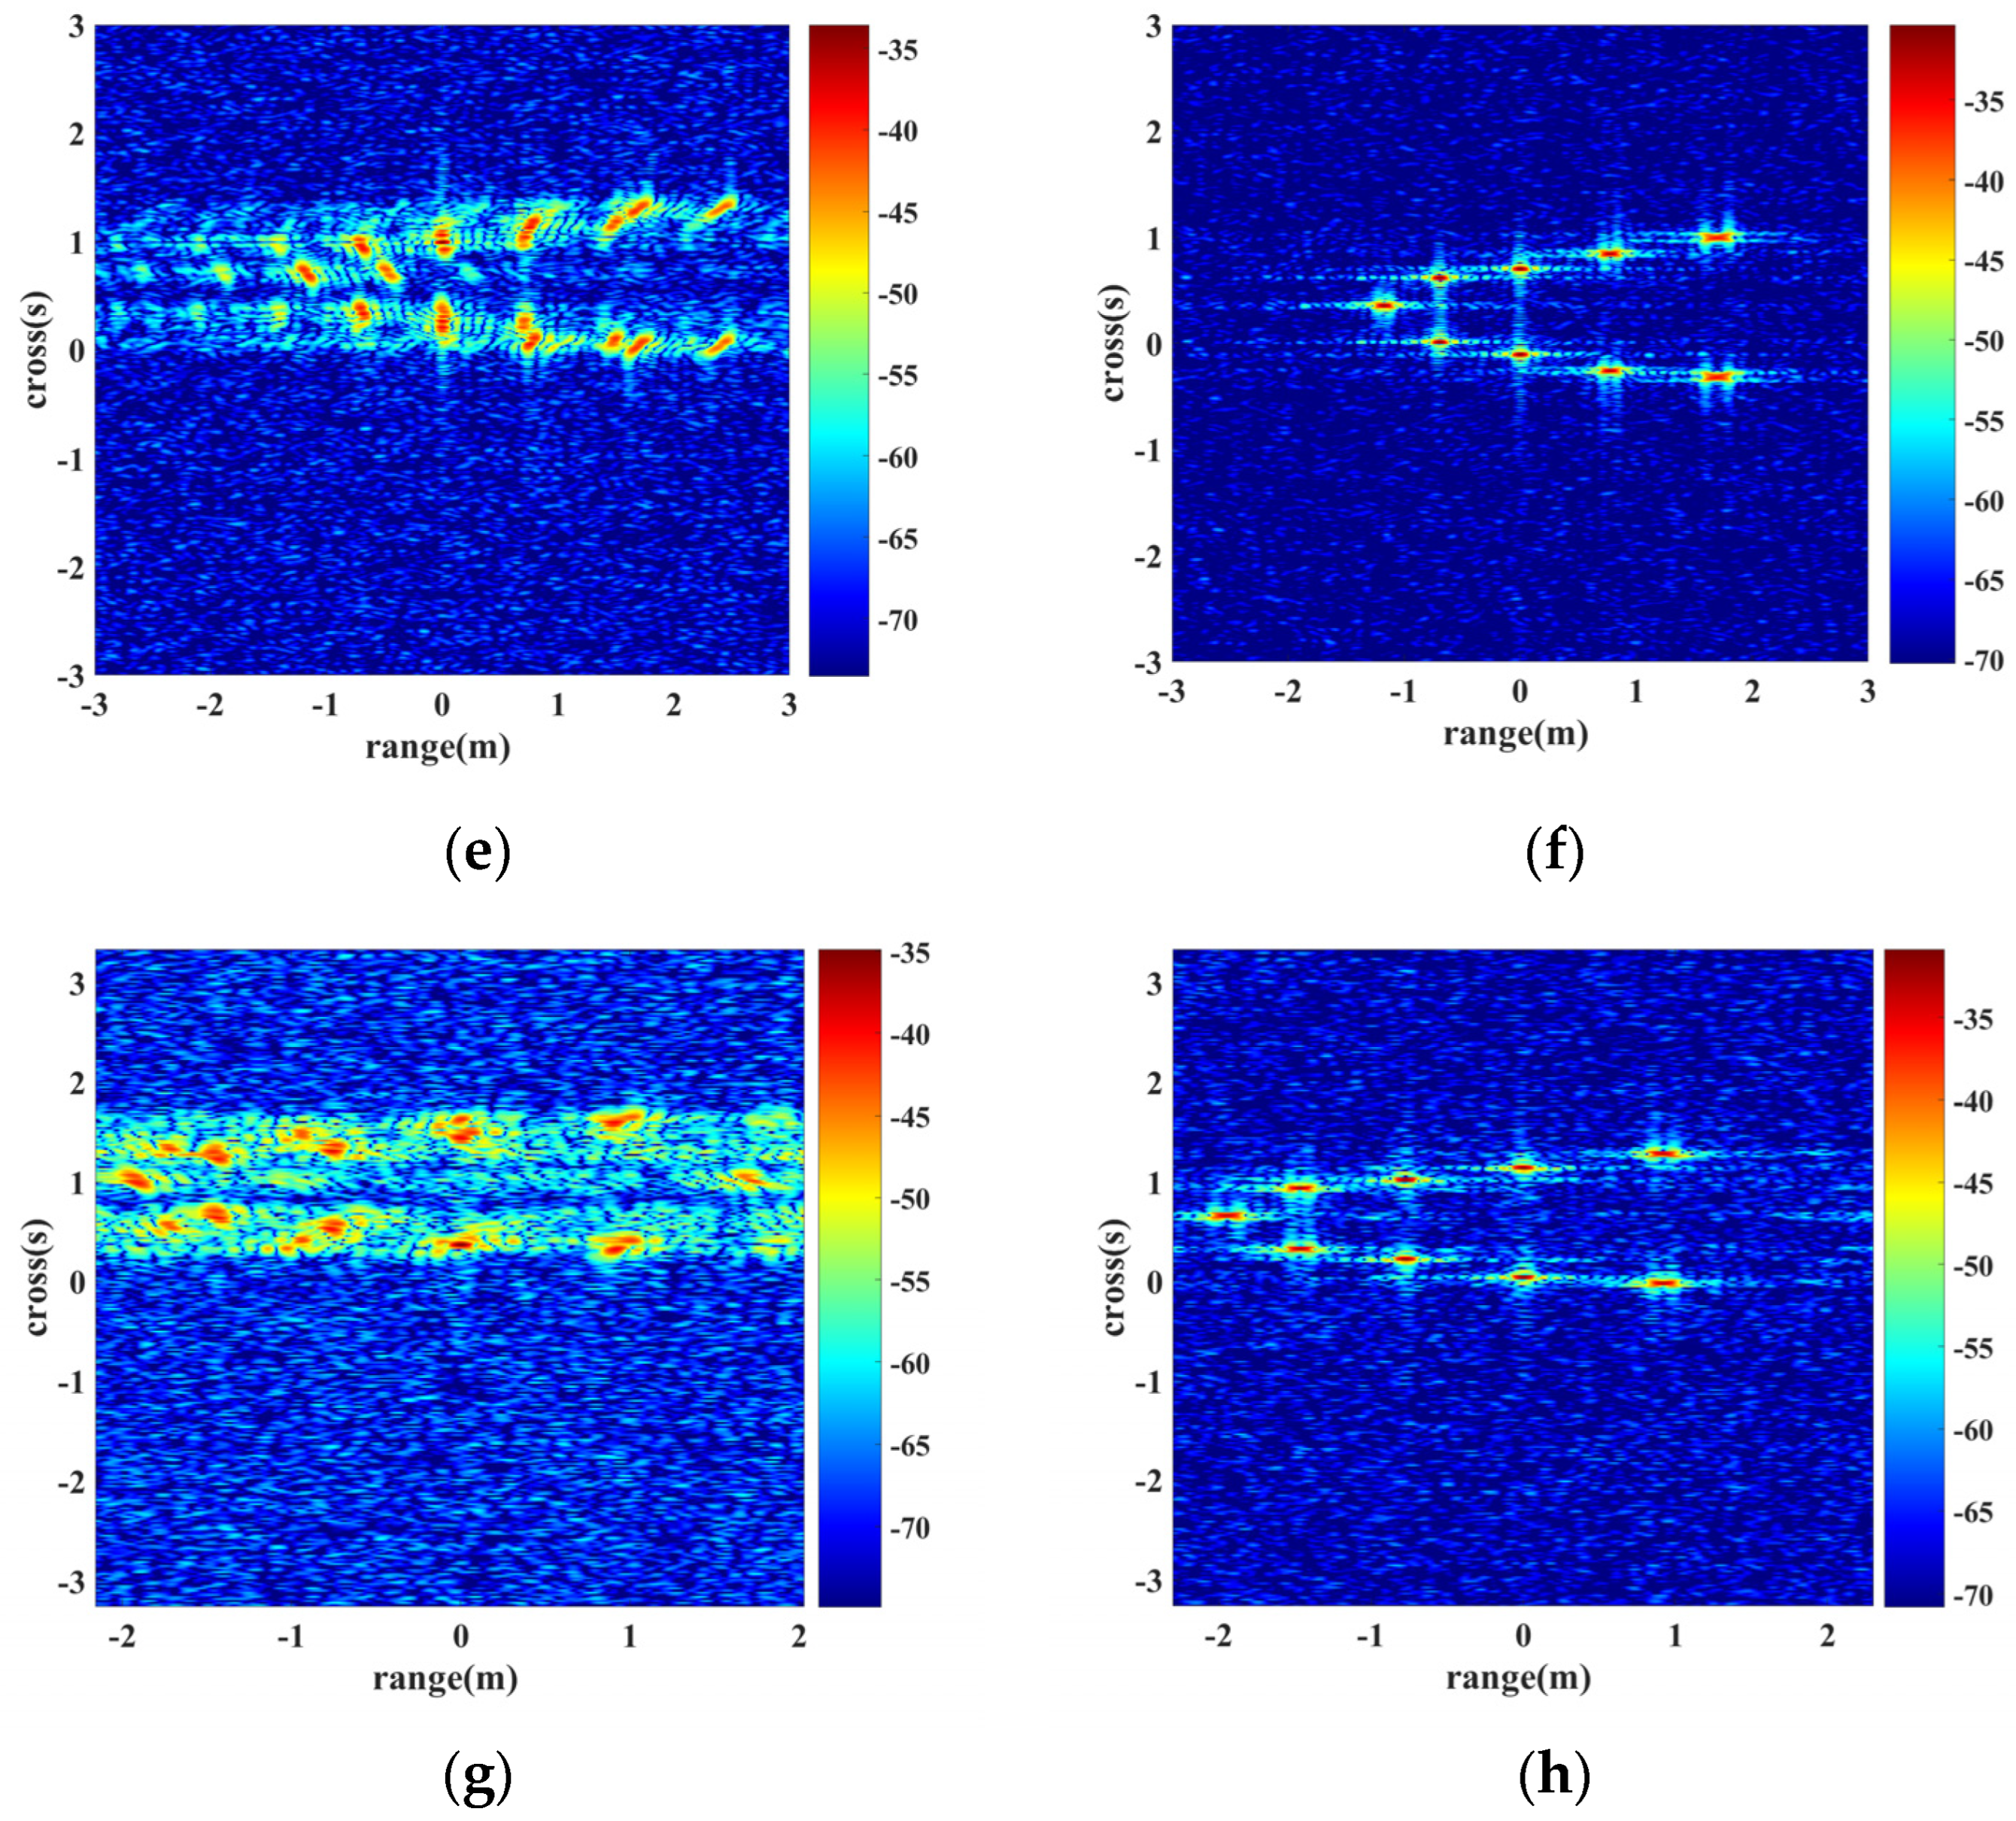
This section presents the simulation conducted over the ISAR imaging of the plasma-sheath-enveloped target. To validate the universality of the proposed algorithm, it was tested on several flight scenarios, including flight altitudes of 30, 40 and 50 km, all with a constant velocity of 15 Ma. Additionally, a scenario with a 30 km altitude and a velocity of 25 Ma was included. Peak signal-to-noise ratio (PSNR) and structural similarity (SSIM) were considered to assess the ISAR reconstruction performance. The parameters of the radar signal were set as follows: the frequency was 10 GHz, the pulse duration was 100 , the bandwidth was 1 GHz and the SNR was 0 dB. The enveloped plasma sheath has great distinction for different flight scenarios. For simplicity, flight scenarios are displayed to replace its extracted flow filed data. Figure 9 compares the reconstructed ISAR images of the conventional range-Doppler (RD) algorithm and the proposed algorithm in different flight scenarios. Suppose that the envelope alignment and phase compensation are implemented.
Figure 9 shows that the ISAR image reconstructed by the conventional RD algorithm suffers from severe defocusing. Moreover, the lower the flight altitude and the higher the flight velocity, the greater the effect of the plasma sheath and the more severe the defocusing. In contrast, the proposed algorithm utilizes the defocus compensation procedure and can achieve accurate ISAR images for any scenario. The calculated PSNR and SSIM also provide a consistent conclusion. As shown in Table 5, compared with the RD algorithm, the proposed algorithm achieved an average improvement of 4.7555 dB in PSNR and 0.2126 dB in SSIM. However, the average computation time just increased by 2.21 s.
6. Conclusions
This study developed a wideband radar echo model for the plasma-sheath-enveloped hypersonic target. The impact of the plasma sheath on the wideband 1-D range pro-file was then examined. it showed that the plasma velocities coupled within intra-pulse cause defocusing in the range profile. To eliminate the influence of the plasma sheath, plasma sheath parameter estimation was implemented and a FRFT-CLEAN-based focusing algorithm was developed. Finally, several simulations were conducted to validate it. According to the results, the following points may be concluded:
- (1)
- The wideband radar signal inserted into the non-uniform plasma sheath suffers from varied incident depths, reflection intensities and coupled plasma velocities. As a result, the scatter points in different regions of the plasma-sheath-enveloped target have varied reflection intensities and coupled velocities. It induces severe phase error for the wideband radar echo, and causes significantly displacement and broadening for the de-chirp signal, leading to severe 1-D range profile defocusing.
- (2)
- The plasma sheath coupled velocities bring on the primary and secondary phase terms for the de-chirp signal, resulting in the displacement and broadening of the range profile. In this study, the proposed algorithm implemented the range profile focusing procedure by plasma sheath velocity estimation and phase compensation. Further, the induced CLEAN strategy guaranteed that multicomponent LFM signal can be estimated and each scatter has been accurately compensated. Finally, the feasibility and superior performance of the proposed FRFT-CLEAN-based focusing algorithm is demonstrated via simulation results.
This study confirmed the findings that the flow field of the plasma sheath causes additional multitarget phenomenon. It also provided a deeper insight that the range profiles contaminated by intra-pulse velocity undergo significant displacement and broadening, resulting in degrees of defocusing. Nevertheless, there are still some deficiencies. The analysis of how the target’s motion posture affects the range profile is lacking. The angle in this simulation was fixed at 0, and the target’s motion characteristics during the inter-pulse were not considered. In actuality, the characteristics of the plasma sheath changed as the angle and motion of the target varied. Therefore, the relationship between the target motion posture, target motion velocity and flow field properties need further investigation in the future.
Author Contributions
Conceptualization, F.S.; methodology, F.S.; software, Z.Z.; validation, X.C.; formal analysis, B.B.; resources, Y.L.; data curation, X.L.; writing—original draft preparation, Z.Z.; writing—review and editing, F.S. All authors have read and agreed to the published version of the manuscript.
Funding
This work was supported in part by the National Science Foundation of China under No. 62171349, No. 92371205, and Grant 62371375, in part by the Innovation Capability Support Program of Shaanxi (Program No. 2022TD-37).
Data Availability Statement
The raw/processed data required to reproduce the above findings cannot be shared at this time as the data also form part of an ongoing study.
Acknowledgments
We are very grateful to everyone who helped in the revision process of this thesis writing.
Conflicts of Interest
The authors declare no conflicts of interest.
References
- Chen, X.; Li, K.; Liu, Y.; Zhou, Y.; Li, X.; Liu, Y. Study of the influence of time-varying plasma sheath on radar echo signal. IEEE Trans. Plasma Sci. 2017, 68, 3166–3176. [Google Scholar] [CrossRef]
- Li, J.; Gong, T.; Yang, S.; Guo, L.; Cheng, M. Influence of hypersonic turbulence in plasma sheath on synthetic aperture radar imaging. IET Microw. Antennas Propag. 2017, 11, 2223–2227. [Google Scholar]
- Zhang, X.; Liu, Y.; Bai, B.; Li, X.; Shen, F.; Chen, X.Y.; Zhao, L. Establishment of a Wideband Radar Scattering Center Model of a Plasma Sheath. IEEE Access 2019, 7, 140402–140410. [Google Scholar] [CrossRef]
- Swift, C.T.; Beck, F.B.; Thomson, J.; Castellow, S.L. Ram-III S-Band Diagnostic Experiment. ElectroMagn. Syst. 1970. [Google Scholar] [CrossRef]
- Wang, H.; Xu, L.; Li, B.; Descombes, S.; Lanteri, S. An Exponential-Based DGTD Method for Modeling 3-D Plasma-Surrounded Hypersonic Vehicles. IEEE Trans. Antennas Propag. 2020, 68, 3847–3858. [Google Scholar] [CrossRef]
- Hartunian, R.A.; Stewart, G.E.; Fergason, S.D.; Curtiss, T.J.; Seibold, R.W. Causes and Mitigation of Radio Frequency (RF) Blackout during Reentry of Reusable Launch Vehicles; Aerospace Corporation: El Segundo, CA, USA, 2007; pp. 1–103. [Google Scholar]
- Guo, Y.-G.L.L.-X.; Li, J.-T. Hypersonic Vehicle Plasma Sheath and Electromagnetic Characteristics Data. In Manual Beijing China: Science; Science Press: Beijing, China, 2019; pp. 33–60. [Google Scholar]
- Kashiwa, T.; Yoshida, N.; Fukai, I. Transient analysis of a magnetized plasma in three-dimensional space. IEEE Trans. Antennas Propag. 1988, 36, 1096–1105. [Google Scholar] [CrossRef]
- Yee, K.S. Numerical solution of initial boundary value problems involving Maxwell’s equations in isotropic media. IEEE Trans. Antennas Propag. 1966, 14, 302–307. [Google Scholar]
- Wei, H.; Liu, Y.; Shi, L.; Yao, B.; Li, X. A 3-D total-field/scattered field plane-wave source for the FDTD analysis of reentry plasma sheath. IEEE Trans. Antennas Propag. 2020, 68, 6214–6225. [Google Scholar] [CrossRef]
- Soliman, E.A.; Helaly, A.; Megahed, A.A. Propagation of electromagnetic waves in planar bounded plasma region. Prog. ElectroMagn. Res. 2007, 67, 25–37. [Google Scholar] [CrossRef]
- Bai, B.; Li, X.; Liu, Y.; Xu, J.; Shi, L.; Xie, K. Effects of reentry plasma sheath on the polarization properties of obliquely incident EM waves. IEEE Trans. Antennas Propag. 2014, 42, 3365–3372. [Google Scholar] [CrossRef]
- Kojima, T.; Higashi, T.; Itakura, K. Reflection and transmission of electromagnetic waves obliquely incident upon a moving compressible plasma slab. IEEE Trans. Antennas Propag. 1972, 20, 398–400. [Google Scholar] [CrossRef]
- Laroussi, M.; Roth, J.R. Numerical calculation of the reflection, absorption, and transmission of microwaves by a nonuniform plasma slab. IEEE Trans. Plasma Sci. 1993, 21, 366–372. [Google Scholar] [CrossRef]
- Yang, H.W.; Liu, Y. Numerical analysis of the reflection and absorption of electromagnetic wave in nonuniform magnetized plasma slab. Optik 2012, 123, 371–375. [Google Scholar] [CrossRef]
- Liu, Z.; Bao, W.; Li, X.; Liu, D.; Bai, B. Effects of pressure variation on polarization properties of obliquely incident RF waves in re-entry plasma sheath. IEEE Trans. Plasma Sci. 2015, 43, 3147–3154. [Google Scholar] [CrossRef]
- Lin, T.C.; Sproul, L.K. Influence of reentry turbulent plasma fluctuation on EM wave propagation. Comput. Fluids 2006, 35, 703–714. [Google Scholar] [CrossRef]
- Roberds, N.A.; Young, M.W.; Miller, N.E.; Logemann, C.; Statom, T.K.; Wagnild, R.M. Parasitic Modulation of Microwave Signals by a Hypersonic Plasma Layer. IEEE Trans. Plasma Sci. 2024, 1, 1–10. [Google Scholar] [CrossRef]
- Sotnikov, V.I.; Leboeuf, J.N.; Mudaliar, S. Scattering of electromagnetic waves in the presence of wave turbulence excited by a flow with velocity shear. IEEE Trans. Plasma Sci. 2010, 38, 2208–2218. [Google Scholar] [CrossRef]
- He, G.; Zhan, Y.; Zhang, J.; Ge, N. Characterization of the Dynamic Effects of the Reentry Plasma Sheath on Electromagnetic Wave Propagation. IEEE Trans. Plasma Sci. 2016, 44, 232–238. [Google Scholar] [CrossRef]
- He, G.; Zhan, Y.; Ge, N.; Pei, Y.; Wu, B. Measuring the Time-Varying Channel Characteristics of the Plasma Sheath from the Reflected Signal. IEEE Trans. Plasma Sci. 2014, 42, 3975–3981. [Google Scholar] [CrossRef]
- Sha, Y.; Zhang, H.; Guo, X. Analyses of Electromagnetic Properties of a Hypersonic Object With Plasma Sheath. IEEE Trans. Antennas Propag. 2019, 67, 2470–2481. [Google Scholar] [CrossRef]
- Chen, X.; Shen, F.; Liu, Y.; Ai, W.; Li, X.P. Improved Scattering-Matrix Method and its Application to Analysis of Electromagnetic Wave Reflected by Reentry Plasma Sheath. IEEE Trans. Plasma Sci. 2018, 46, 1755–1767. [Google Scholar] [CrossRef]
- Chen, X.; Shen, F.; Liu, Y.; Li, X.; Ai, W. Radar detection of plasma-covered reentry object based on crossed two-component LFM signa. Appl. Comput. Electromagn. Soc. J. 2018, 33, 665–674. [Google Scholar]
- Ding, Y.; Bai, B.; Gao, H.; Niu, G.; Shen, F.; Liu, Y.; Li, X. An Analysis of Radar Detection on a Plasma Sheath Covered Reentry Target. IEEE Trans. Aerosp. Electron. Syst. 2021, 57, 4255–4268. [Google Scholar] [CrossRef]
- Ding, Y.; Bai, B.; Gao, H.; Liu, Y.; Li, X.; Zhao, M. Method of Detecting a Target Enveloped by a Plasma Sheath Based on Doppler Frequency Compensation. IEEE Trans. Plasma Sci. 2020, 48, 4103–4111. [Google Scholar] [CrossRef]
- Xie, Y.; Li, X.; Shen, F.; Bai, B.; Liu, Y.; Chen, X.; Shi, L. Analysis of inverse synthetic aperture radar imaging in the presence of time-varying plasma sheath. Plasma Sci. Technol. 2022, 3, 19–32. [Google Scholar] [CrossRef]
- Xie, Y.; Li, X.; Shen, F.; Mao, Z.; Bai, B.; Chen, X. Influence of Plasma Sheath’s Velocity Field on ISAR Imaging of Hypersonic Target. Remote Sens. 2022, 14, 3799. [Google Scholar] [CrossRef]
- Zheng, B.; Jiangting, L.; Lixin, G.; Luo, X. Analyzing the Electromagnetic Scattering Characteristics of a Hypersonic Vehicle Based on the Inhomogeneity Zonal Medium Model. IEEE Trans. Antennas Propag. 2021, 69, 971–982. [Google Scholar]
- Zheng, B.; Jiangting, L.; Lixin, G. ISAR Imaging Analysis of a Hypersonic Vehicle Covered with Plasma Sheath. IEEE Trans. Geosci. Remote Sens. 2022, 60, 1–13. [Google Scholar] [CrossRef]
Figure 1.
Geometric model of the layered plasma.

Figure 2.
Geometry model of the RAM-C and its flow-field data (50 km, 20 Ma). (a) Geometry model of the blunt cone. (b) Electron density distribution. (c) Velocity field distribution. (d) Schematic diagram of reflection depth.
Figure 2.
Geometry model of the RAM-C and its flow-field data (50 km, 20 Ma). (a) Geometry model of the blunt cone. (b) Electron density distribution. (c) Velocity field distribution. (d) Schematic diagram of reflection depth.

Figure 3.
Schematic of the wideband radar echo model of the plasma-sheath-enveloped target.
Figure 4.
Comparison of the range profiles under different velocities. (a) = 5100 . (b) = 6800 .
Figure 5.
Geometric model of the RAM-C target.
Figure 6.
Range profile of the RAM-C target in the presence of plasma sheath (50 km, 20 Ma). (a) Range profile (no plasma sheath). (b) Range profile (plasma sheath). (c) Original RD ISAR. (d) ISAR defocused image. (e) FRFT energy distribution. (f) Profile view of the FRFT with fixed α.
Figure 6.
Range profile of the RAM-C target in the presence of plasma sheath (50 km, 20 Ma). (a) Range profile (no plasma sheath). (b) Range profile (plasma sheath). (c) Original RD ISAR. (d) ISAR defocused image. (e) FRFT energy distribution. (f) Profile view of the FRFT with fixed α.
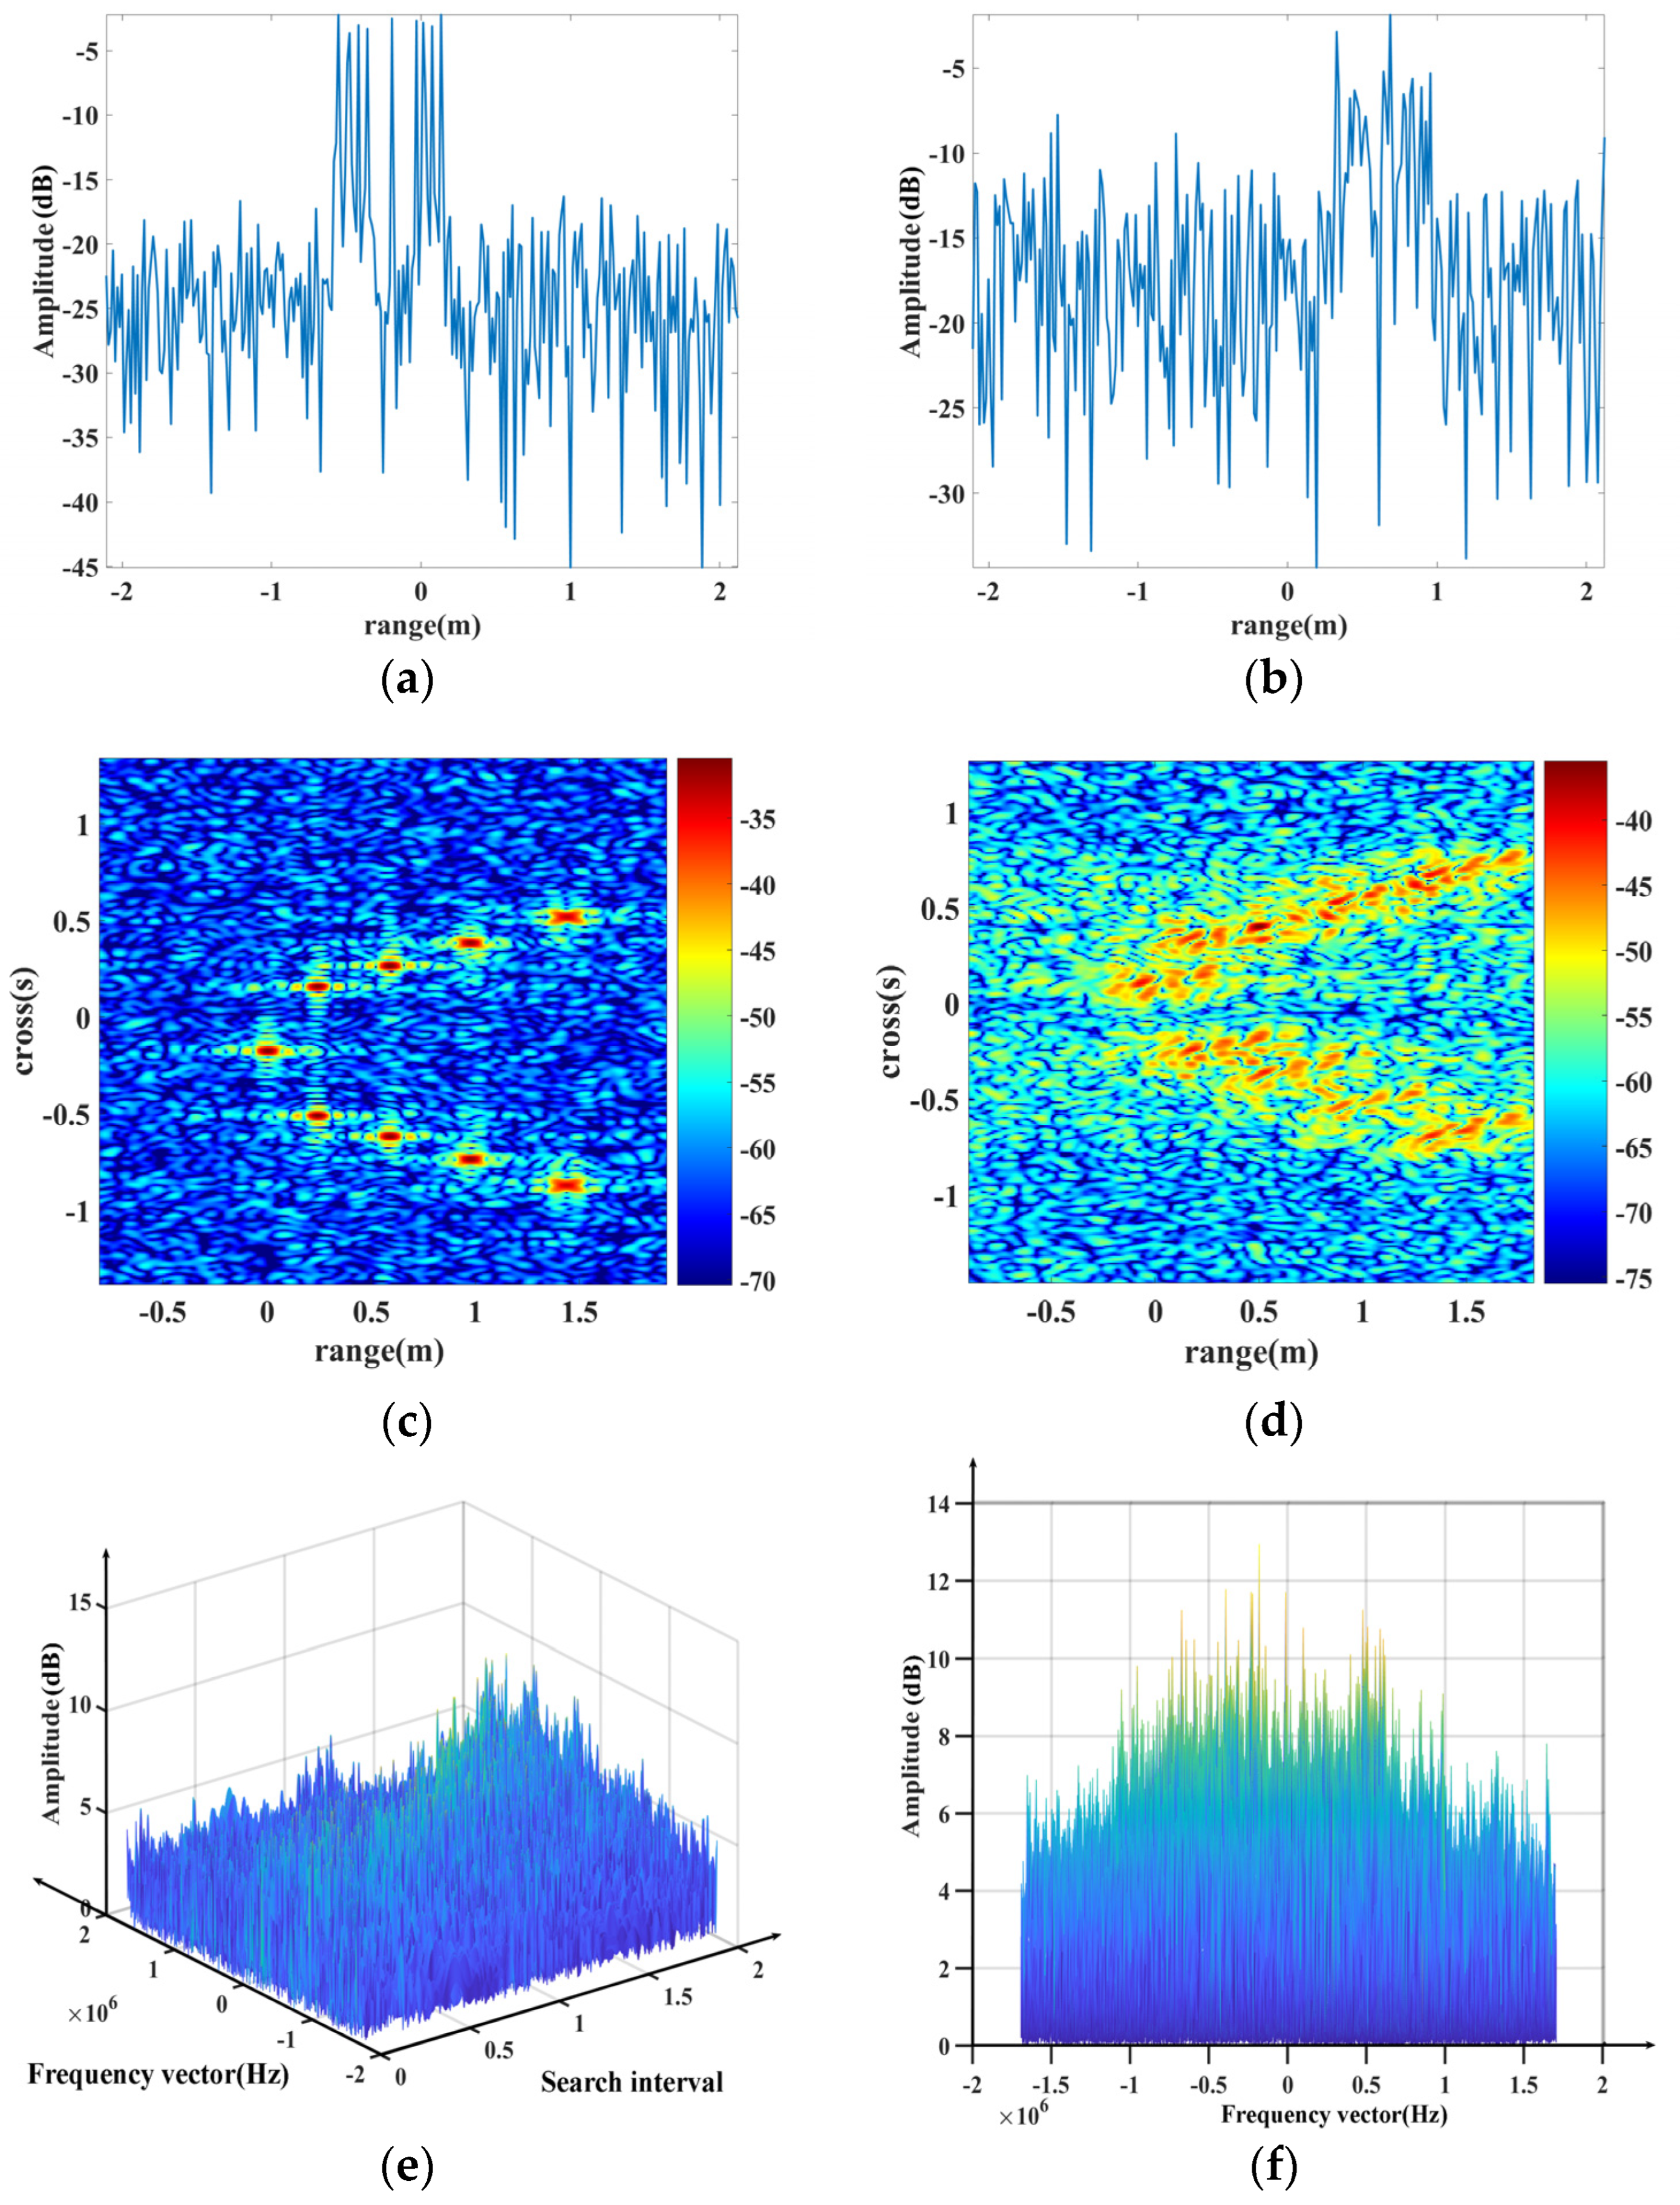
Figure 7.
Range profile and ISAR image of the plasma-sheath-enveloped target. (a) Range profile. (b) The reconstructed ISAR image.
Figure 7.
Range profile and ISAR image of the plasma-sheath-enveloped target. (a) Range profile. (b) The reconstructed ISAR image.

Figure 8.
Signal separation in fractional Fourier domain. (a) First signal distribution on the plane. (b) Profile view. (c) Fifth signal distribution on the plane. (d) Profile view. (e) Ninth signal distribution on the plane. (f) Profile view.
Figure 8.
Signal separation in fractional Fourier domain. (a) First signal distribution on the plane. (b) Profile view. (c) Fifth signal distribution on the plane. (d) Profile view. (e) Ninth signal distribution on the plane. (f) Profile view.

Figure 9.
Reconstructed ISAR images. (a) RD (50 km, 15 Ma). (b) Proposed algorithm (50 km, 15 Ma). (c) RD (40 km, 15 Ma). (d) Proposed algorithm (40 km, 15 Ma). (e)RD (30 km, 15 Ma). (f) Proposed algorithm (30 km, 15 Ma). (g) RD (30 km, 25 dB). (h) Proposed algorithm (30 km, 25 Ma).
Figure 9.
Reconstructed ISAR images. (a) RD (50 km, 15 Ma). (b) Proposed algorithm (50 km, 15 Ma). (c) RD (40 km, 15 Ma). (d) Proposed algorithm (40 km, 15 Ma). (e)RD (30 km, 15 Ma). (f) Proposed algorithm (30 km, 15 Ma). (g) RD (30 km, 25 dB). (h) Proposed algorithm (30 km, 25 Ma).

Table 1.
The procedure of the FRFT-CLEAN-based focusing algorithm.
| Initialization: , and are zero, is the signal of the measured data after mixing with the reference signal. |
| Step 1: Apply the FRFT transform to the signal and obtain energy distribution on the plane using Equation (14). Then estimate the chirp rate and initial frequency of the strongest components through peak search using Equations (16) and (17), respectively. |
| Step 2: Estimate the coupled velocity induced by the plasma using Equation (18), and then construct the compensation function using Equation (19). |
| Step 3: Implement the -th order () FRFT over the signal, and design a proper narrow band-stop filter with center frequency to filter out the strongest component of the signal. |
| Step 4: Conduct the -th order IFRFT over the filtered signal to transform it back to the time domain (called residual signal); |
| Step 5: Subtract residual signal from the signal to extract the strongest component, and then multiply it with the compensation function to achieve the defocus signal . Set and . |
| Step 6: Repeat the above steps until the residual signal energy is under a certain threshold, or else implement the FT over the to obtain a focused range profile. |
Table 2.
Velocity estimation, PSLR and ISLR comparison.
| Case | () | () | Error | Before | After | ||
|---|---|---|---|---|---|---|---|
| PSLR (dB) | ISLR (dB) | PSLR (dB) | ISLR (dB) | ||||
| 1 | 5100 | 5183 | 1.63% | −0.8419 | 7.3152 | −8.8674 | −4.4451 |
| 2 | 6800 | 6871 | 1.04% | −0.5857 | 5.2513 | −6.5754 | −4.1100 |
Table 3.
Parameters of plasma sheath of nine scatter points (50 km, 20 Ma).
| Scatter | (m−3) | Incident Depth (m) | (dB) | (rad) | (ms−1) |
|---|---|---|---|---|---|
| 1 | 1.74 × 10²⁰ | 0.017 | −5.5 | −1.35 | 6243 |
| 2 | 7.62 × 10¹⁸ | 0.053 | −8.7 | 1.04 | 4045 |
| 3 | 4.74 × 10¹⁸ | 0.063 | −10.4 | −0.18 | 2098 |
| 4 | 3.28 × 10¹⁸ | 0.074 | −11.1 | 0.96 | 1898 |
| 5 | 8.94 × 10¹⁷ | 0.093 | −11.5 | −1.24 | 6800 |
| 6 | 9.01 × 10¹⁷ | 0.093 | −11.6 | −1.24 | 6800 |
| 7 | 3.27 × 10¹⁸ | 0.074 | −11.3 | 0.96 | 1889 |
| 8 | 4.71 × 10¹⁸ | 0.063 | −10.5 | −0.19 | 2104 |
| 9 | 7.65 × 10¹⁸ | 0.053 | −8.6 | 1.04 | 4051 |
Table 4.
Coupled velocity estimation and evaluation results.
| Scatter | ) | ) | Error (%) | Before | After | ||
|---|---|---|---|---|---|---|---|
| PSLR (dB) | ISLR (dB) | PSLR (dB) | ISLR (dB) | ||||
| 1 | 6243 | 6460 | 3.47 | −0.2442 | 4.7684 | −7.8629 | −3.8451 |
| 2 | 4045 | 4080 | 0.87 | −0.7981 | 3.9968 | −8.2546 | −3.8649 |
| 3 | 2098 | 2175 | 3.67 | −0.3940 | 5.9896 | −6.9665 | −4.5842 |
| 4 | 1898 | 1807 | 4.79 | −0.2874 | 3.5545 | −6.8457 | −4.0987 |
| 5 | 6800 | 7129 | 4.84 | −0.2798 | 5.3415 | −7.9983 | −3.2251 |
| 6 | 6800 | 6493 | 4.51 | −0.3124 | 5.8736 | −8.5645 | −3.7401 |
| 7 | 1889 | 1812 | 4.08 | −0.2983 | 3.7425 | −8.0118 | −3.0644 |
| 8 | 2104 | 2141 | 1.76 | −0.6994 | 3.7624 | −7.9429 | −4.6866 |
| 9 | 4051 | 4082 | 0.77 | −0.6655 | 4.5120 | −8.9895 | −3.1445 |
| Average | 3.20 | −0.4421 | 4.6157 | −7.9374 | −3.8060 | ||
Table 5.
ISAR image performance evaluation in different scenarios.
| Scene | RD | Proposed | ||||
|---|---|---|---|---|---|---|
| PSNR (dB) | SSIM (dB) | Time (s) | PSNR (dB) | SSIM (dB) | Time (s) | |
| (50 km, 15 Ma) | 24.9126 | 0.1346 | 2.44 | 29.8316 | 0.3641 | 5.01 |
| (40 km, 15 Ma) | 24.8151 | 0.1291 | 2.76 | 29.9001 | 0.3552 | 4.86 |
| (30 km, 15 Ma) | 24.9552 | 0.1469 | 2.60 | 29.7269 | 0.3502 | 4.77 |
| (30 km, 25 Ma) | 25.0023 | 0.1226 | 2.92 | 29.2487 | 0.3142 | 4.92 |
| Average | 24.9213 | 0.1333 | 2.68 | 29.6768 | 0.3459 | 4.89 |
Disclaimer/Publisher’s Note: The statements, opinions and data contained in all publications are solely those of the individual author(s) and contributor(s) and not of MDPI and/or the editor(s). MDPI and/or the editor(s) disclaim responsibility for any injury to people or property resulting from any ideas, methods, instructions or products referred to in the content. |
© 2024 by the authors. Licensee MDPI, Basel, Switzerland. This article is an open access article distributed under the terms and conditions of the Creative Commons Attribution (CC BY) license (https://creativecommons.org/licenses/by/4.0/).
Share and Cite
MDPI and ACS Style
Shen, F.; Chen, X.; Bai, B.; Liu, Y.; Li, X.; Zhang, Z. Focusing Algorithm of Range Profile for Plasma-Sheath-Enveloped Target. Remote Sens. 2024, 16, 1475. https://doi.org/10.3390/rs16081475
AMA Style
Shen F, Chen X, Bai B, Liu Y, Li X, Zhang Z. Focusing Algorithm of Range Profile for Plasma-Sheath-Enveloped Target. Remote Sensing. 2024; 16(8):1475. https://doi.org/10.3390/rs16081475
Chicago/Turabian StyleShen, Fangfang, Xuyang Chen, Bowen Bai, Yanming Liu, Xiaoping Li, and Zherui Zhang. 2024. "Focusing Algorithm of Range Profile for Plasma-Sheath-Enveloped Target" Remote Sensing 16, no. 8: 1475. https://doi.org/10.3390/rs16081475
Note that from the first issue of 2016, this journal uses article numbers instead of page numbers. See further details here.