
A Long-Duration Glacier Change Analysis for the Urumqi River Valley, a Representative Region of Central Asia
by
 ,
,
Lin Wang
1,2,
Shujing Yang
1,2,3,*,
Kangning Chen
4,
Shuangshuang Liu
1,2,3,
Xiang Jin
1,2,3 and
Yida Xie
1,2,3 1
Northwest Institute of Eco-Environment and Resources, Chinese Academy of Sciences, Lanzhou 730000, China
2
Key Laboratory of Cryospheric Science and Frozen Soil Engineering, Northwest Institute of Eco-Environment and Resources, Chinese Academy of Sciences, Lanzhou 730000, China
3
University of Chinese Academy of Sciences, Beijing 100049, China
4
School of Geography, Nanjing Normal University, Nanjing 210023, China
*
Author to whom correspondence should be addressed.
Remote Sens. 2024, 16(9), 1489; https://doi.org/10.3390/rs16091489
Submission received: 12 March 2024
/
Revised: 18 April 2024
/
Accepted: 19 April 2024
/
Published: 23 April 2024
(This article belongs to the Special Issue Remote Sensing of Cryosphere and Related Processes)
Abstract
:The increasing global warming trend has resulted in the mass loss of most glaciers. The Urumqi Vally, located in the dry and cold zone of China, and its widely dispersed glaciers are significant to the regional ecological environment, oasis economic development, and industrial and agricultural production. This is representative of glaciers in Middle Asia and represents one of the world’s longest observed time series of glaciers, beginning in 1959. The Urumqi Headwater Glacier No. 1 (UHG-1) has a dominant presence in the World Glacier Monitoring Service (WGMS). This paper supplies a comprehensive analysis of past studies and future modeling of glacier changes in the Urumqi Valley. It has received insufficient attention in the past, and the mass balance of UHG-1 was used to verify that the geodetic results and the OGGM model simulation results are convincing. The main conclusions are: The area of 48.68 ± 4.59 km2 delineated by 150 glaciers in 1958 decreased to 21.61 ± 0.27 km2 delineated by 108 glaciers in 2022, with a reduction of 0.47 ± 0.04 km2·a−1 (0.96% a−1 in 1958–2022). The glacier mass balance by geodesy is −0.69 ± 0.11 m w.e.a−1 in 2000–2022, which is just deviating from the measured result (−0.66 m w.e.a−1), but the geodetic result in this paper can be enough to reflect the glacier changes (−0.65 ± 0.11 m w.e.a−1) of the URB in 2000–2022. The future loss rate of area and volume will undergo a rapid and then decelerating process, with the fastest and slowest inflection points occurring around 2035 and 2070, respectively. High temperatures and large precipitation in summer accelerate glacier loss, and the corresponding lag period of glacier change to climate is about 2–3 years.
1. Introduction
As the largest reservoirs of freshwater resources, glaciers are critical to the hydrological cycle and ecosystems because of their sensitive and synergistic relationship with the global climate [1,2]. Glaciers store solid water during cold temperatures and melt during the ablation period to supply water to rivers and downstream populations, especially in cold and dry regions. [3,4]. However, the global sea level has been rising at a rate of 0.2–0.4 mm per year during the 20th century due to the accelerated shrinkage of the cryosphere; this is as a result of man-made climate change [5,6]. A proposal to designate 2025 as the International Year of Glacier Protection, initiated by the Republic of Tajikistan, has been implemented, and a further plan to establish an international fund for glacier protection emphasizes the importance and urgency of glacier change [7].
There are two aspects to the study of systematic refinement of glacier change in a particular region: past systematic analyses and future change trends. The past period of glacier shrinkage is manifested in many aspects, such as reduction in number, area, and volume, while the mass balance is one of the most direct quantitative reflections of glacier accumulation and mass loss [8,9,10]. The traditional glaciological method of acquiring mass balance results using flower pole and snow pit observations is the most accurate method [11,12]. Moreover, a series of techniques, such as aerial photogrammetry, gravity satellite, SAR interferometry, and laser measurement, have been well used to study glacier elevation, area, and volume changes [13,14]. With the development of geodesy and the increase in DEM resolution, the results have become more accurate [15,16]. Currently, the most widely popular research method is a combination of geodetic and traditional glaciological methods, which ensures the credibility of research on glacial change, and is made more accessible by remote sensing technology [14,17]. Previous research has focused on trends in glacier change over an historical period, which is of much less reference value in the context of global warming trends [18,19]. There is a developed global scale, modular, open source numerical model called OGGM Model, which can simulate the dynamics of glaciers for both past and future change [16]. Glacial borders and DEM data are the underlying input data, and meteorological data provided by Coupled Model Intercomparison Project 6 (CMIP6) are used to drive the OGGM model [20]. Future glacier trends under different climate scenarios have been approximated by selecting glacier area changes, and the conclusions have been shown to be reliable and convincing [21,22].
The Urumqi Valley in Tianshan is an important region in the northwest dry region of China. There are many glaciers in Middle Asia and one glacier, UGH-1, has been observed for the past 60 years [23]. Most of the previous research has focused on the single glacier, UHG-1 [24,25,26]. The study shows that mass balance of UHG-1 is −0.46 ± 0.14 m w.e.a−1, with much more area reduction and a faster rate of loss than in Tianshan [27,28]. The average glacier flow rate is 0.07 m a−1, which may be related to glacier retreat and thinning [23]. The modeling of the mass balance in the basin is mostly focused on UHG-1 [29,30] and extends at most to a few surrounding glaciers [31]. Glaciers within such an important and typical basin have yet to be studied as a whole, let alone as part of future glacial changes in the basin.
This paper attempts to fill glacier information gaps in the Urumqi Valley and initial predictions of glacier ablation dynamics under different scenarios. Multi-source imagery, including topographic maps, high-resolution images, and multi-source DEM collections, were used to study a variety of indicators that can evaluate glacier changes, especially the mass balance by DEM variations. Moreover, the DEMs generated spatial resolution by stereo image pairs (Ziyuan No. 3) is up to 2.5 m, which significantly improves the accuracy of the study. In addition to discussing climate and past glacier change in detail, this paper uses the OGGM model to predict glacier change within the basin to provide a basic reference for domestic water and Industrial and agricultural development in Urumqi, a city of 3,505,800 people.
2. Study Region
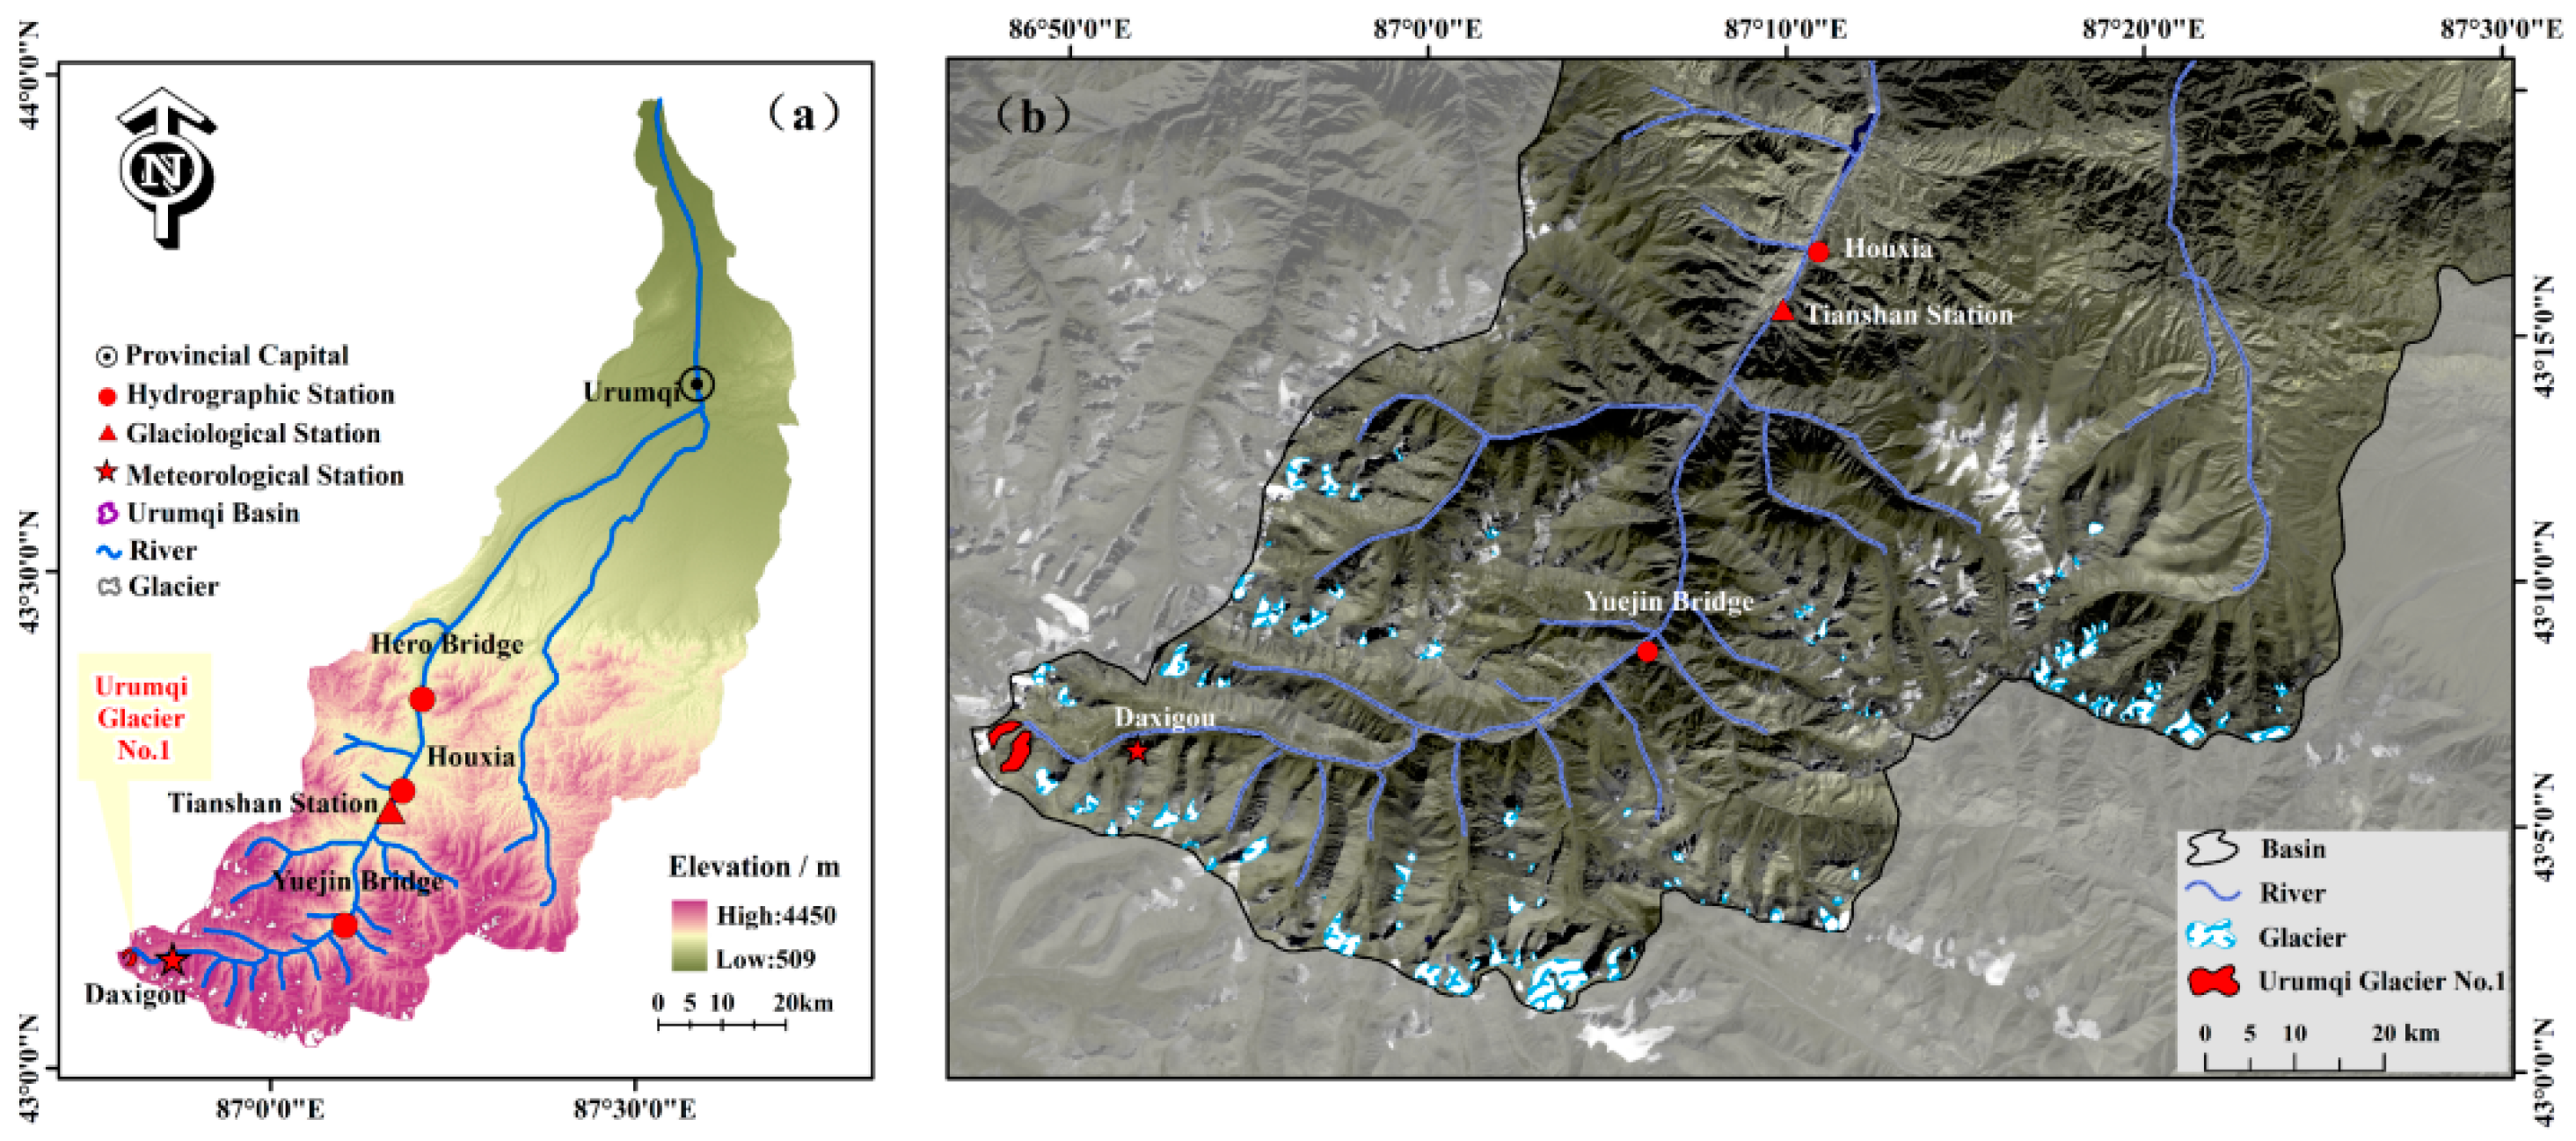
The Urumqi Valley is located on the north side of Tengger Peak in middle Tianshan, China. It consists of the Urumqi River on the west and the East Mountain River system on the east. The region (43°00′N~44°07′N, 86°45′ E~87°56′E) covers 4684 km2 area with a length of 214.30 km and the glacial region studied can be seen in Figure 1. According to the China Second Glacier Inventory, there are 129 glaciers with an area of 29.26 km2 [32]. UHG-1, located in this basin, is the most well-recorded glacier in China, and has been studied for the longest time; the earliest recorded information began in 1958. The climate of the region can be summarized as low temperature, low humidity, high evaporation, and monsoonal character [33]. Land usage consists mainly of alpine meadows and wastelands at altitude distribution from 3391 m to 4459 m a.s.l. According to meteorological data gathered at Daxigou station between 1959 and 2018, the average temperature is −4.9 °C, with 7–8 months below 0 °C. The temperature distribution ranges from 5 °C in July to −1.5 °C in January. The precipitation reaches 466 mm, and summer contributes the most precipitation.
3. Data and Method
3.1. Data and Pre-Processing
The earliest glacial boundary extraction was based on six topographic maps involving this basin that were scanned, aligned, spliced, and corrected based on ENVI 5.3 to ensure that the corrected mean-variance was less than one cell before delineation. All topographic maps have a scale of 1:50,000. Landsat imagery has been widely used to study glacial change [34]; given the difficulty of obtaining early high-resolution imagery, we chose Landsat TM imagery from 1989. The Landsat images were downloaded from the website abbreviated as USGS and have been pre-processed, including radiometric and control point correction. (https://glovis.usgs.gov/). This paper studies glacier changes based on higher-resolution multi-source remote sensing images, such as the Spot 5 in 2005 and Ziyuan No. 3 stereo pairs in 2022. These images had <10% clouds, occurred within the ablation period, and were used to generate glacial contours. The data used for past glacier changes in the Urumqi Valley are presented in Table 1. Data are available free of charge.
SRTM DEM is readily available as open-source data and, being within 1 month of 2000, has a unique advantage for studying glacier elevation change with the 30 m resolution (https://earthexplorer.usgs.gov/). The ALOS satellite from Japan is dedicated to earth observation. The PALSAR satellite has the advantage of round-the-clock, all-weather land observation, and was selected for the elevation difference analysis (https://search.asf.alaska.edu/). To measure glacier mass balance changes, this paper takes elevation changes since the 21st century at 10-year intervals. The China Daxigou Meteorological Station, at the source of the Urumqi River, provides meteorological data that can reveal synergistic changes in glaciers and climate. Data are available free of charge.
3.2. Method
3.2.1. Delineation of Glaciers and Uncertainty Assessment
Delineation of accurate glacial boundaries is important when glaciers are used to represent glacial changes in a region. Automated edge delineation is determined by many factors such as snow cover, clouds, shadows, and the resolution of images [35]. In this study, glacial margins in different periods were delineated to meet the recognized standards [36]. In addition to combining the experience of the experts in the field, Google Earth pro 2023 software also contributed [37]. Clustered glaciers are separated by ridgelines and referred to glacier cataloging to retain subsequent accuracy.
The error in delineating the glacier can be regarded as caused only by the resolution of the remotely sensed images after the glacial boundaries have been captured by the visual interpretation method, which is the most accurate method available. The uncertainty of delineation EA can be evaluated as follows:
where N is the number of pixels and λ is the resolution of different remote sensing images. The Urumqi glaciers uncertainties in 1964, 1989, 2005, and 2022 were ±4.59 km2, ±3.98 km2, ±0.96 km2, and ±0.27 km2, respectively, accounting for 9.43%, 9.81%, 3.38%, and 1.20% of total glacierized areas, respectively.
The uncertainty of changed area (EB) is expressed as follows [38]:
where E1 and E2 are uncertainties in glacier area at the beginning and ending years, respectively.
3.2.2. Ziyuan No.3 DEMs
Ziyuan No.3 was launched in January 2012 as a forerunner of China’s civilian high-resolution stereo mapping satellites, with three panchromatic cameras and a multispectral camera, which can acquire stereo image pairs of the same area from three different observation angles. The resolutions are 5.8 m multispectral, 2.1 m panchromatic, and 3.5 m front and rear view. Based on this feature, which can provide rich 3D geometric information, it can be used to generate DEMs, and Resource 3-02 has a higher front- and rear-view resolution of 2.5 m, which can meet the requirements of higher precision stereo mapping. Considering the seasonal snow and cloud cover, we chose four pairs of images from July and September 2022 to extract the DEM. The process of extracting the DEM using stereo image pairs was carried out in the DEM extraction model of the ENVI 5.3 software. After comparing the extraction results, we found that the use of frontal-view and rear-view image pairs to extract the DEM provided better results. The extraction process was carried out by selecting 20 ground control points and 100 correlation points in relatively stable non-glaciated areas, using Landsat 9 OLI images of the same period as reference positioning. All DEMs are georeferenced in the WGS84 coordinate system and stitched together with a spatial resolution of 2.5 m.
3.2.3. DEMs Co-Registration and Error Analyses
In the geodetic method, the elevation difference between DEMs is the value that characterizes the variation of glacier surface elevation; this is fundamental for our assessment of glacier mass balance in the Urumqi Valley. The ALOS DEM in the intermediate periods was selected as the reference DEM to assess the SRTM DEM and ZiyuanNo.3 DEM. The 1964 glacier margin was chosen to differentiate non-glacier topography, as the glacier area shrank the most in 2022. The rationale for the alignment is that the topography of the non-glaciated regions remains essentially unchanged, which can be used to test and iteratively adjust for errors in the multi-source DEMs. The relationship between vertical deviation and slope and aspect will tend to sine or cosine if the DEMs in non-glaciated areas are not perfectly aligned with each other [39]. The offset difference equation proposed by Nuth is as follows:
In order to display the results more intuitively and conveniently, we linearize Equation (3) and then solve Equation (4) to obtain the value of the offset in each direction, thus fulfilling the DEM alignment.
In Equations (3)–(7), dh represents the height difference between DEMs of different periods due to offset displacement: a is the magnitude of vertical movement, b is the direction of the movement vector, α is the slope of terrain, is the vertical direction of the terrain, and c represents the mean deviation between the different DEMs divided by the mean slope tangent, which can be calculated by /tan. After linearisation, x represents the offset in EW direction, y represents the offset in the NS direction, and z is the offset in the vertical direction. After aligning the multiphase DEM with the topographic information of the non-glacier area, if elevation residual error satisfies the normal distribution, then the elevation standard deviation residual in the non-glaciated stable area approves of the estimate of the accuracy of the surface elevation change in the glacier area [40].
3.2.4. Geodetic Mass Balance and Uncertainty Assessment
Density should be taken into account when volume changes are converted to glacier mass balance [15,41]. This paper applied 850 ± 60 kg·m−3 to provide a parameter for taking the snow and pure ice into account to assess the mass changes by water equivalent (w.e.) [42]:
where ρ is ice density transition; S is consequential glacier area; n is pixel numbers; Δhi is the single pixel height variation; and Si is single pixel area. The uncertainty was calculated as follows:
where Δh is the mean height variation of glacier areas; t is studied period; Δρ is the error of ice density, which value is taken as 60 kg·m−3; ρw is water density, which value is taken as 1000 kg·m−3; σ is the errors of height variation; and ρ1 is ice density transition, which value is taken as 850 kg·m−3.
3.2.5. Glacial Mass Balance and Uncertainty
In 1959, we began to measure the glacier mass balance during ablation (May~August) by using flower sticks to confirm the height variation and snow pits to assess the density [43,44]. As illustrated in Figure 2, the stake network spans the whole UHG-1 in order to provide the result of mass balance. For UHG-1, we manually interpolated the measured data between adjacent contours by manually drawing lines of equal mass balance [45].
where Si is the pixel area, Bi is the obtained mass balance of the corresponding pixel glacier, and S is the total area of UHG-1.
3.2.6. OGGM Model
Open Global Glacier Model gives full consideration to glacial geometry and consists of an explicit ice dynamics module and a calving parametrization. The modular OGGM supports being redefined, remixed, and repeated, with reliance on publicly available data for calibration and validation. In the model, glacial boundaries and DEM data are used as model base input data. It is driven by climate scenarios to forecast future area, volume changes, etc. The model is globally consistent in predicting ice thickness and glacier mass loss. To maintain the purity of the results, the observed glacier mass balance is the best choice for checking the accuracy of OGGM. Note that model accuracy is verified by predicting glacier mass balance using an extended temperature index model [21]
where characters with (h) qualify the elevation, M is monthly glacier mas balance, Pcf is precipitation correction factor, Psolid is monthly solid precipitation, and μ is updated calibration and correction factor, which represents the glacier sensitivity parameter and where a particular glacier can be set to agree with observations [20]. T is monthly temperature, Tmelt represents monthly mean air temperature, and ε is deviation correction.
3.2.7. Meteorological Data
In this study, three SSPs scenarios were selected to drive the OGGM model. In order to reduce the error of the results, for each SSPs pathway, the results of 13 climate models were selected, which were BBC, CAMS, CESM2-WACCM, CESM, EC-Earth3, EC-Earth3-Veg, FGOALS, GFDL, INM-CM4-8, INM-CM5-0, MPI-ESM1-2-HR, MPI-ESM2-0, and NorESM2-MM. The final results of glacial area and volume in the URB are obtained by averaging the standard errors of the 13 climate models; ensembles are taken as the errors of the area and volume simulations results [31]. Given the assumptions that climate change arises only over large areas and the associations of climate variables remain consistent in the base period, interpolating or inserting data where none exists with thin-plate spline eliminates errors.
4. Result
4.1. Delienation and Uncertainty of Glaciers
In 2022, 108 glaciers were mapped in the entire URB, a decrease of nearly one third compared to 150 in 1964. The number of glaciers throughout the basin has been trending downward over time. Moreover, the whole basin can be divided into four sub-basins, coded as 5Y730A, 5Y730B, 5Y730C, and 5Y730D. We discerned and statistically calculated the contours of the glacier in detail and combined the number of pixels occupied by the glacier and the image resolution to obtain the uncertainty in the delineated and vanished glacier area. Specific information is presented in Table 2 and Table 3. Because the region belongs to multiple field observations, the error of manual visual interpretation is ignored in this paper. Higher resolution images are the basis and direction for the development of glacier remote sensing for the future. The areas of glaciers delineated in different years of this paper and the errors are shown below:
4.2. Area Changes and Analysis in Glaciers
The glacier area in the basin decayed rapidly, from 48.68 ± 4.59 km2 in 1964 to 21.61 ± 0.26 km2, a shrinkage rate of 0.47 ± 0.04 km2·a−1 and an overall relative rate of change in glacier area of 55.6% (0.96%·a−1). Because the glacier scale in this region is inherently not very large, it is believed that the glacier will be completely ablated. In this paper, the rate of glacier area change is divided into three periods, and the ablation rate is −0.31 km2·a−1 (0.64%·a−1), −0.81 km2·a−1 (1.99%·a−1), and −0.40 km2·a−1 (1.41%·a−1) in the periods of 1964–1990, 1990–2005, and 2005–2022, respectively. The years from 1990–2005 had the fastest rate of glacial ablation, and the ablation rate for the latest period has remained above the average rate for the last 58 years. Moreover, four sub-basins, coded as 5Y730A, 5Y730B, 5Y730C, and 5Y730D, involved 67.75%, 54.96%, 55.32%, and 50.65% of the ablation area from 1964 to 2022, respectively. The detailed ablation shape is shown in Figure 3.
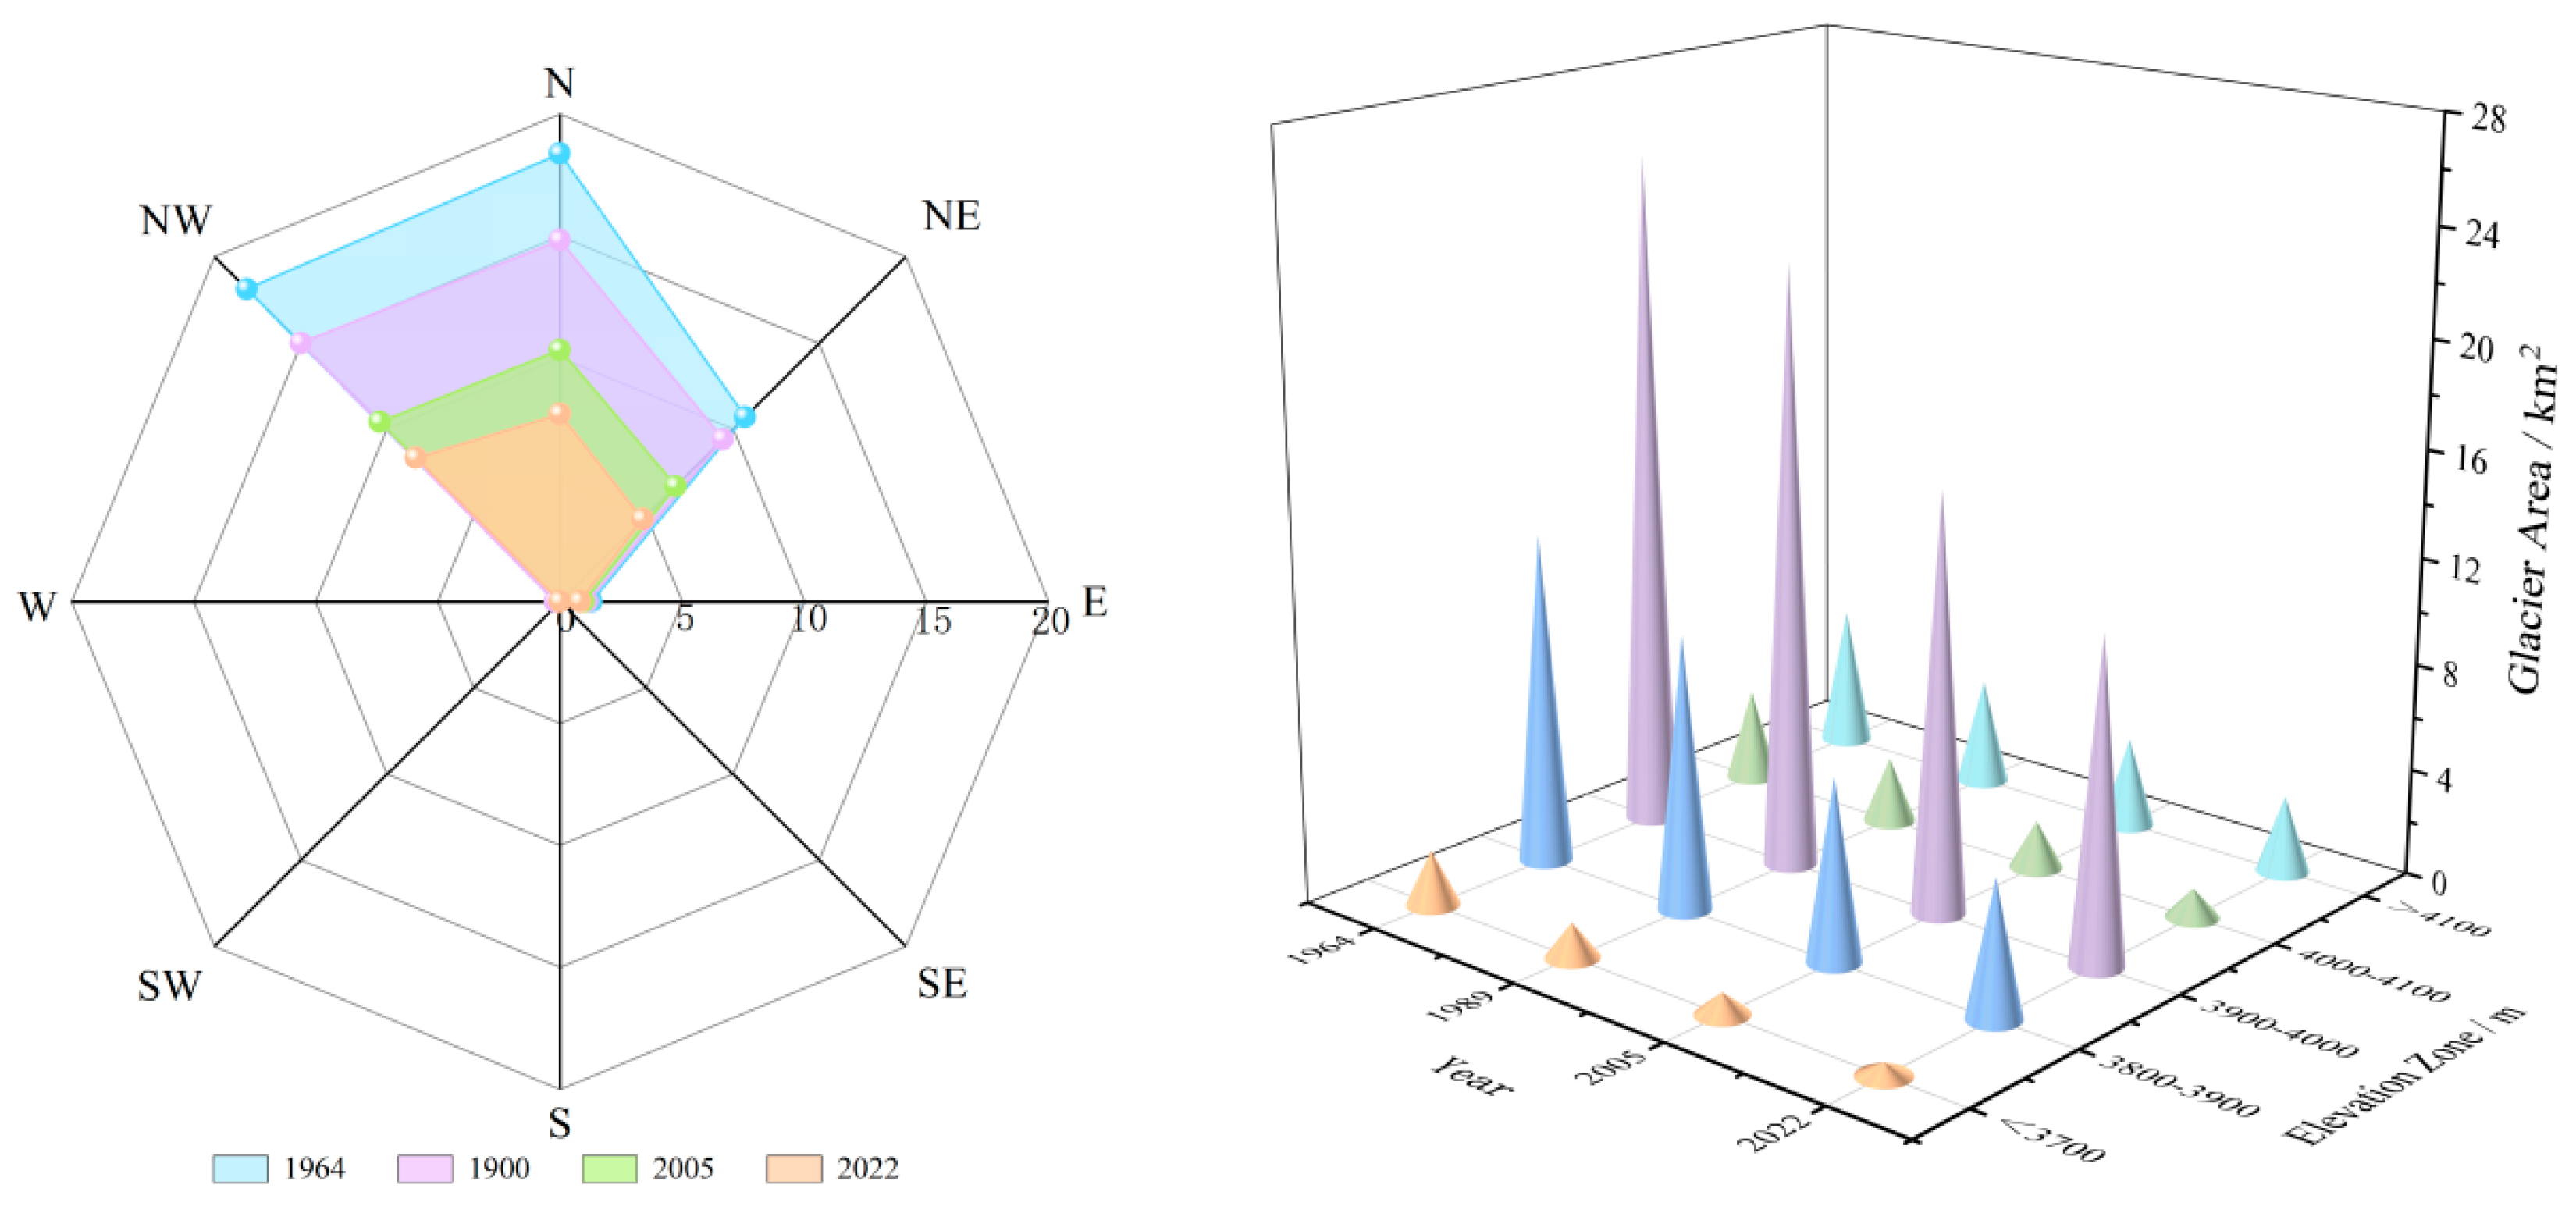
The Urumqi Valley is on northern Tianshan, so most glacier numbers (106) and glacier area (20.79 ± 0.24 km2) belong to the N, NE, and NW facings. The glacier area oriented towards N had the most ablation, accounting for 58% of the total. The NE and NW oriented glacier areas are about equally ablated, accounting for about 54%. The two glaciers in other orientations had an the area of only 0.81 ± 0.02 km2, and were much smaller in 2022. (Figure 4). The mean elevation for the glaciers inventoried ranged from 3667 to 4272 m, with the mean being 3948 m in 2000; they ranged from 3671 m to 4270 m with the mean 3926 m in 2022. About 80% of the glacier area was distributed within 3800–4000 m. Over 50% of the glacier area was between 3900–4000 m. The area of glaciers is roughly normally distributed at different elevation scales. The most serious ablation of glacier area is in the altitude zone below than 3700 m, accounting for 76.55%, followed by 4000–4100 m, accounting for 68.47%, while the smallest rate of ablation is in the most aggregated altitude zone of 3900–4000 m, accounting for 52.5%, which reflects the intense ablation of glacier area in the region.
4.3. Geodetic Uncertainty Analysis
After correcting the offset bias among SRTM, ALOS, and ZiyuanNo.3 DEM data with a trigonometric correction (Figure 5 and Figure 6), the elevation difference residuals in the non-glaciated areas can be used to evaluate the errors among the DEMs and to calculate the accuracy of the estimation results for the glacier volume change and the mass balance. Because the spatial resolution of the DEM data used is not uniform, the spatial autocorrelation distances were chosen to be 600 m, 250 m, and 50 m for the SRTM, ALOS, and ZiyuanNo.3 resolutions of 30 m, 12.5 m, and 2.5 m, respectively (Bolch T. et al., 2011). After error correction, Mean Elevation Difference (MED) tends to be close to 0; the relative error between the DEM data is significantly less than 1 m (Table 4).
4.4. Geodetic Glacier Mass Loss
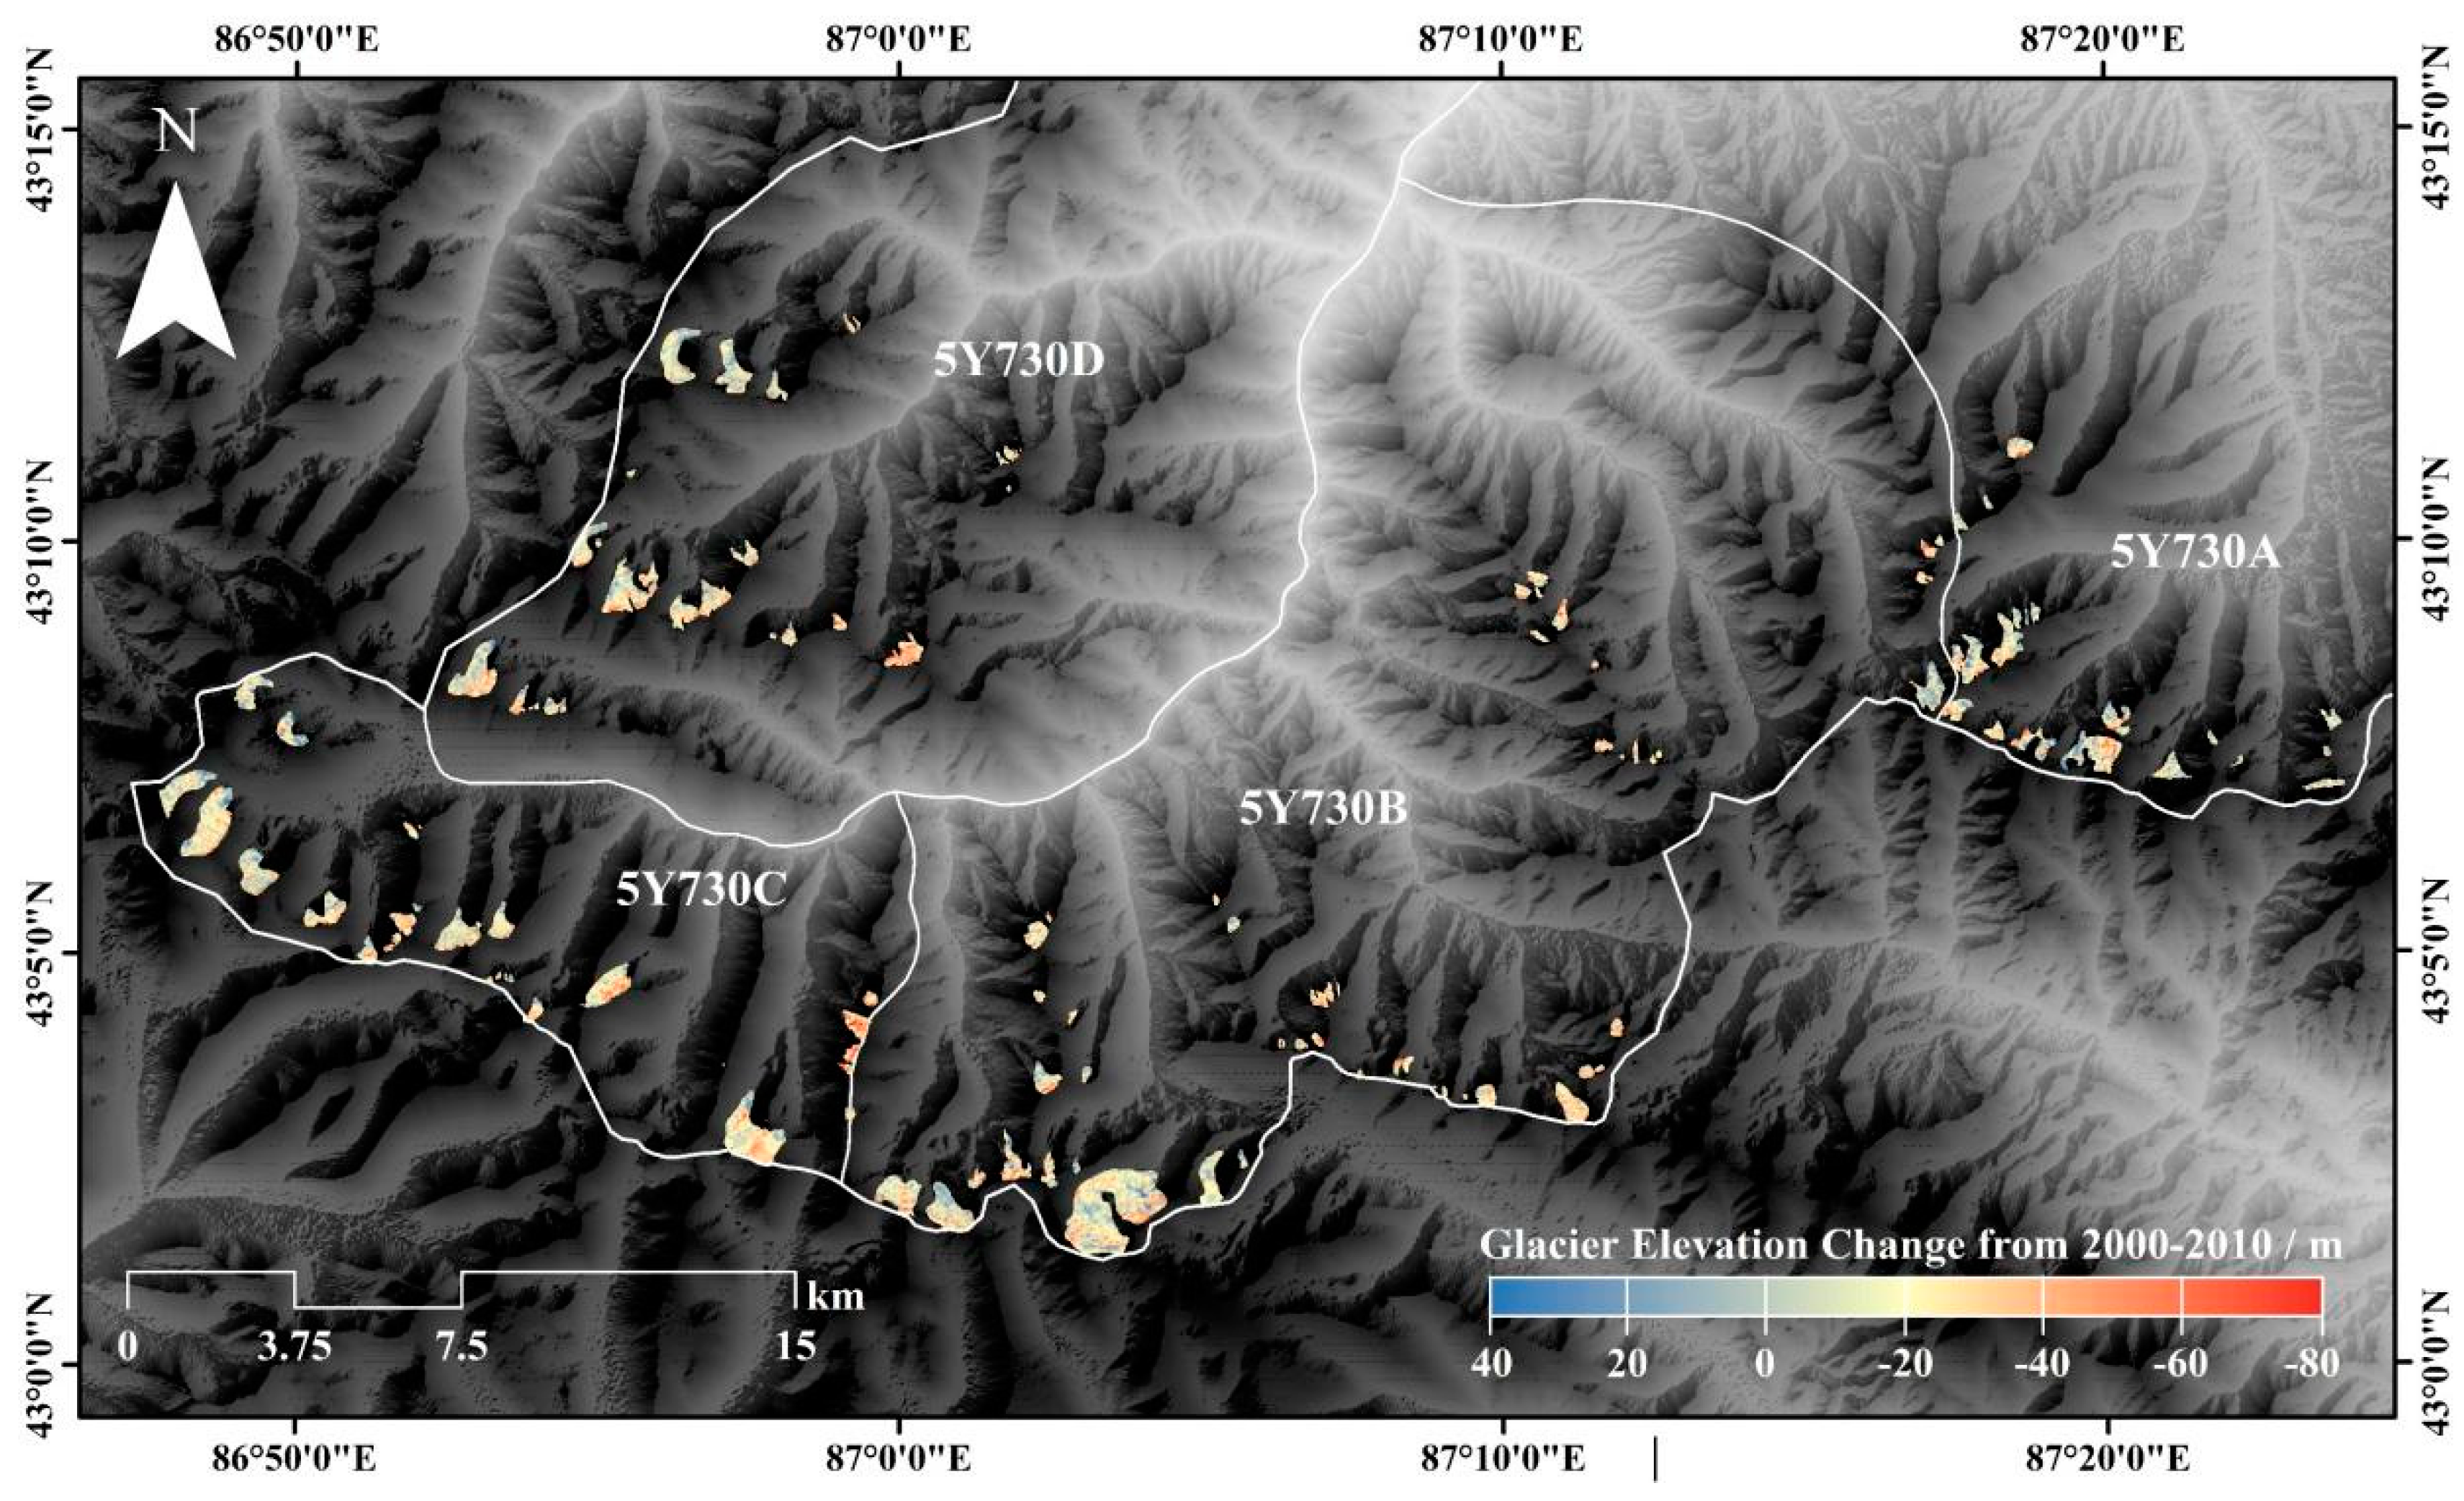
Theoretically, the difference embodied in each raster of the DEMs can respond to a single point of glacier mass balance. Given the corrected results, the glacier elevation in the URB declined significantly in various periods, with an accelerated trend of glacier retreat. The following figure is a visualization of the difference between the DEMs of the two periods processed by the Arcmap 10.3.
After discounting obviously erroneous extremes from the results of the subtraction of the DEM, most of the variables are tightly clustered around the average value, with only a few at the extremes (Figure 7). The glacier elevation in the URB declined by 44.64 ± 0.69 m during 2000–2022, of which the glacier elevation declined by 23.07 ± 0.53 m on average during 2000–2010, with an annual mean decrease of 2.31 ± 0.05 m·a−1, and by 21.57 ± 0.16 m during 2010–2022, with an annual mean decrease of 1.80 ± 0.01 m·a−1.
According to the results of the glacier height variations converted to glacier loss, the volume of glaciers in the Urumqi Valley has decreased by 0.24 km3 over the past 22 years, with an annual mean decrease of 0.01 km3·a−1. The annual glacier mass balance of Urumqi Valley was −0.65 ± 0.11 m w.e.a−1 during 2000–2022. Of this, the mean glacier mass balance was −0.67 ± 0.12 m w.e.a−1 before 2010 and was −0.63 ± 0.11 m w.e.a−1 after 2010. As a special mention, we also calculated the individual glacier mass balance separately for the key monitoring glacier (the UHG-1). The average annual glacier mass balance of the UHG-1 was −0.69 ± 0.12 m w.e.a−1 during 2000–2022. The average glacier mass balance was −0.71 ± 0.12 m w.e.a−1 in 2000–2010 and was −0.67 ± 0.12 m w.e.a−1 in 2010–2022.
4.5. Predicted Future Glacier Mass Loss in Urumqi River Basin
The simulation and analysis of glacier area and reserves in the Urumqi River basin under different climate scenarios of CMIP6, including SSP1-2.6, SSP2-4.5, and SSP5-8.5, found that the trends of glacier area and reserves changes under different emission scenarios coincide with each other. In 2020–2080, the glacier area and reserves in the Urumqi River Basin of the Tianshan Mountains still show an overall trend of retreat and decrease (Figure 8). Reserves as a whole still show a trend of retreat and decrease, and both basically disappear completely by the end of this century. Under the three climate scenarios, the initial and final values of SSP1-2.6, SSP2-4.5, and SSP5-8.5 are approximately the same, but the intermediate trends are very different. For glacier area, the SSP1-2.6 scenario has the slowest rate of glacier retreat, with an average annual decrease in change of 0.351 km2·a−1 and an average annual decrease in glacier volume/volume of 5.21 × 10⁶ m3·a−1. Next is the SSP2-4.5 scenario, with an average annual decrease in change of 0.352 km2·a−1 and an average annual decrease in glacier volume/volume of 5. 23 × 106 m3·a−1, and the SSP5-8.5 scenario, with a decrease in glacier area/volume of 0.352 km2 a−1 and an average annual decrease in glacier volume/volume of 5.23 × 10⁶ m3·a−1. SSP5-8.5 scenario had the largest glacier area and reserve melt. The glacier area change decreases by 0.353 km2·a−1 and the glacier reserve/volume decreases by 5.29 × 10⁶ m3 a−1.
Taking the mid-century (2050) as the cut-off point, the rate of glacier area decrease in the first half of this century (2020–2050) is higher than that in the second half of this century (2050–2080) under the emission scenarios of SSP1-2.6, SSP2-4.5, and SSP5-8.5 (0.482 km2·a−1, 0.485 km2·a−1, and 0.505 km2a−1, respectively); the rate of decrease in glacier area decrease is 0.353 km2·a−1 and the rate of decrease in glacier storage/volume decrease is 5.29 × 10⁶ m3·a−1. The rate of decrease of glacier reserves in the first half of this century (2020–2050) is higher than that in the second half of this century (2050–2080) by 0.226 km3·a−1, 0.224 km3·a−1, 0.232 km3·a−1, and the percentage of decrease is higher than that in the second half of this century (2050–2080) by 31%, 30%, and 31%, respectively. Comparing the glacier area and glacier reserve/volume, the percentage reduction of glacier area is about 10% higher than the percentage reduction of glacier reserve in the first part of this century (2020–2050), and the percentage reduction of glacier area is about 40% higher than the percentage reduction of glacier reserve in the second part of this century (2050–2080), indicating that the glaciers in the Urumqi River Basin are mainly characterized by glacier area retreat, followed by thickness reduction. This pattern is even greater in the middle- and late-century. The reason for this is that the glaciers in the Urumqi River Basin are inherently thinner than the glacier properties in other regions.
5. Discussion
5.1. Geodetic Glacier Mass Balance Validation
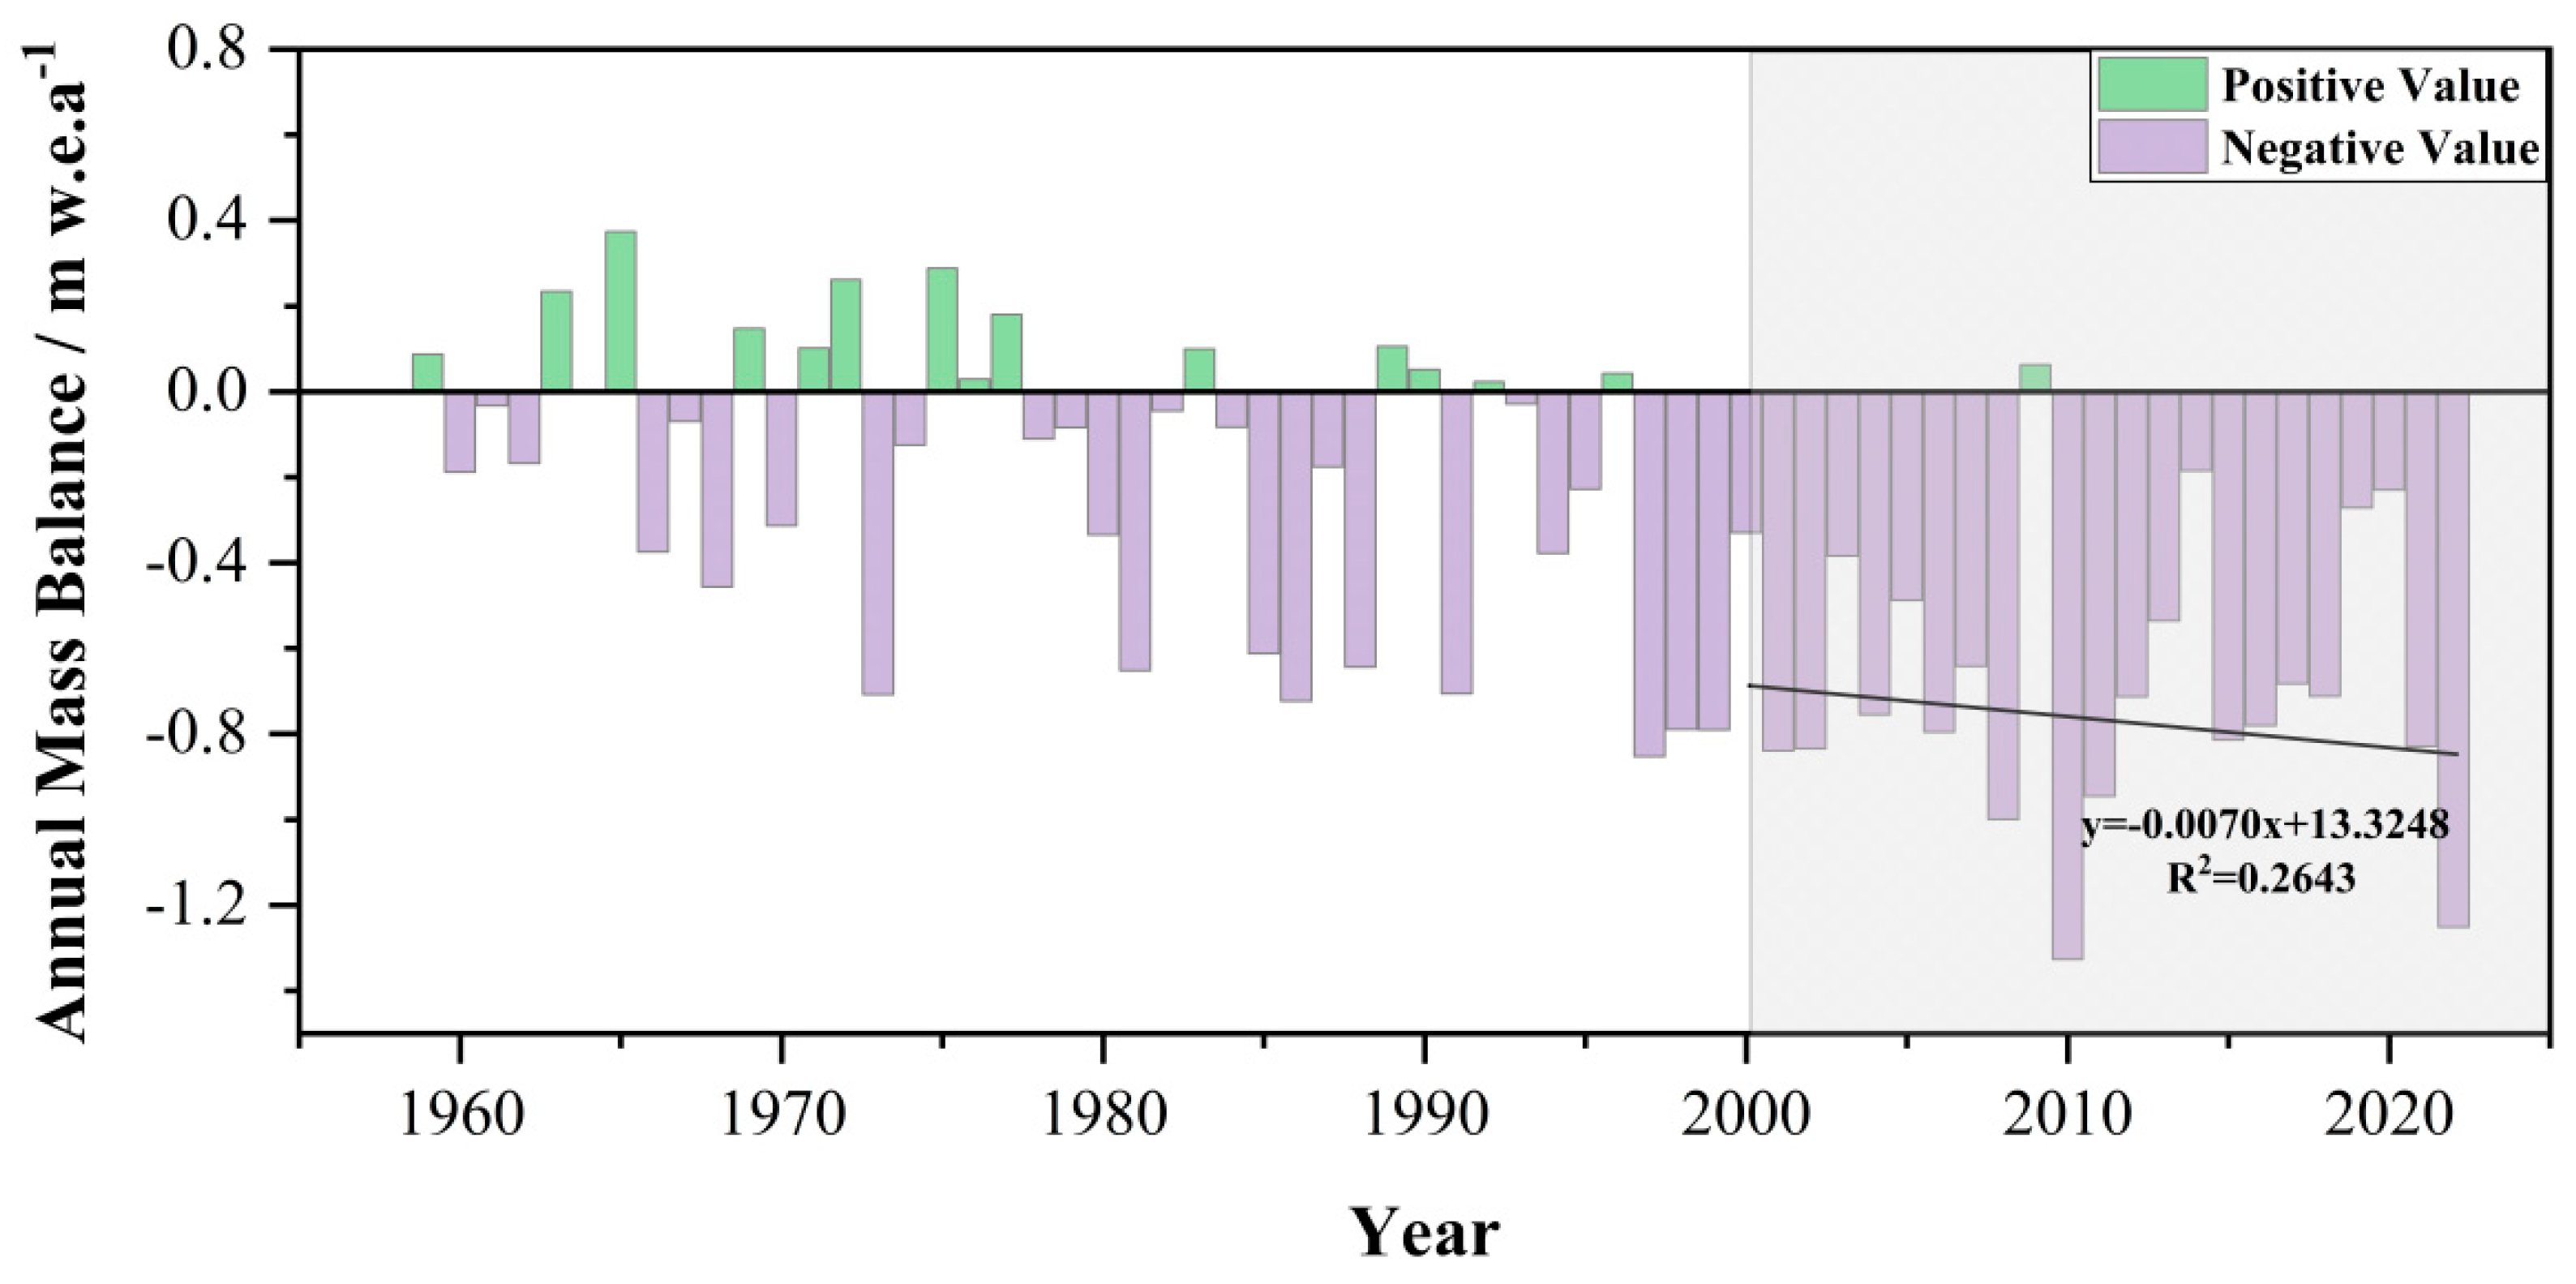
The mass balance obtained from the UHG-1 based on traditional glaciological measurements is shown in Figure 9. It is obvious that the period of maximum positive accumulation of mass balance is between 1960 and 1980. Since 2000, the positive values of glacier mass balance have almost disappeared and the negative accumulation trend of glacier mass balance has intensified, with the highest negative accumulation value in 2010.The annual average values of glacier mass balance of UG-1 for the periods of 2000–2010, 2010–2022, and 2000–2022 are 664 mm w.e.a−1, 666 mm w.e.a−1, and 662 mm w.e.a−1, respectively. Overall, the annual mean mass balance for the period 2000–2022 is stable and shows little fluctuation; it is still suitable as a reference for the same period of time for obtaining the mass balance based on remote sensing. Compared with the annual average mass balance of a single glacier obtained by geodetic methods during the same period of this study, the values are −0.67 m w.e.a−1, −0.71 m w.e.a−1, and −0.69 m w.e.a−1, respectively, and it can be concluded that the mass balances of geodetic and glaciological measurements are in agreement with each other. Taking the glaciological mass balance values as benchmarks, the relative differences between 2000–2010, 2010–2022, and 2000–2022 are only 1.5%, 7.5%, and 4.5%, respectively. Moreover, a linear fit to the mass balance trends obtained by traditional glaciological methods after 2000 showed a stronger negative accumulation trend. The interval of fitted values is from −0.83 m w.e.a−1 to −0.67 m w.e.a−1 and the results obtained in this study fall perfectly in that interval.
5.2. OGGM Model Validation and Forecasting
To prove the accuracy of the future changes in glacier area and volume, we used the OGGM model to acquire the glacier mass balance from 2000 to 2020, which is displayed in Figure 10. The OGGM model and the observed values show a near-identical trend, with a correlation coefficient of 0.87, which has a strong significance. In addition, the difference between the linear fit lines of OGGM simulated and the observed values have a tendency to widen; the error range of 52–124 mm w.e.a−1. is acceptable. After confirming that the results of glacier area and volume were credible, we calculated the glacier mass balance based on the formula and combined it with the snow-ice density transformation to get the future glacier mass balance value of the URB. The results show that the glacier mass balance is the most negative in the SSP5.8-5 pattern, followed by SSP2.4-5, and is the least negative in SSP1.2-6. The variability in glacier mass balance among the three models is present and in good agreement with future changes in area and volume, with an accelerated rate of change in 2035 and little fluctuation after 2075.
5.3. Glacier Loss Comparison in Typical Regions
For the entire Tianshan mountain range, the glacier mass deficit within the URB is relatively dramatic, with much higher values of negative mass balance than many typical basins, as well as the mass balance of the monitored glaciers. The factors influencing the ablation and mass balance of glaciers are sophisticated (Table 5). First, the degree and speed of glacier ablation are different when the size and type of glacier are different. The larger the size and the more concentrated the distribution of the glacier, the less intense the ablation. Large debris-covered glaciers are less prone to ablation, and such glaciers are most strongly developed in the Tomur region of the Tianshan Mountains. The Urumqi Valley belongs to the typical glacier in a small area and scattered distribution, where fast ablation is inevitable. Second, the combination of aspect and slope affects the development of glaciers mainly by changing the amount of solar radiation received. The mass balance is exacerbated by a negative balance in the N/N-direction, which is usually favored by small slopes for the accumulation of glaciers. The vast majority of glaciers in the Urumqi Valley are orientated N and have little topographic relief, and there are no high mountain systems around them that can block solar radiation. Third, the altitude zone in which the glacier is located is also a key factor affecting the ablation of glaciers, as glaciers are not widely developed at lower altitudes, and the ablation rate is generally faster in the region below 4500 m. The glacier studied in this paper belongs to this situation. Fourth, there is a change of water and heat because of the significant impact of westerly winds from the Atlantic Ocean. In this paper, the effects of temperature and precipitation are discussed in Section 5.4 as a separate section.
5.4. Contribution of Meteorological Conditions to Glacier Ablation
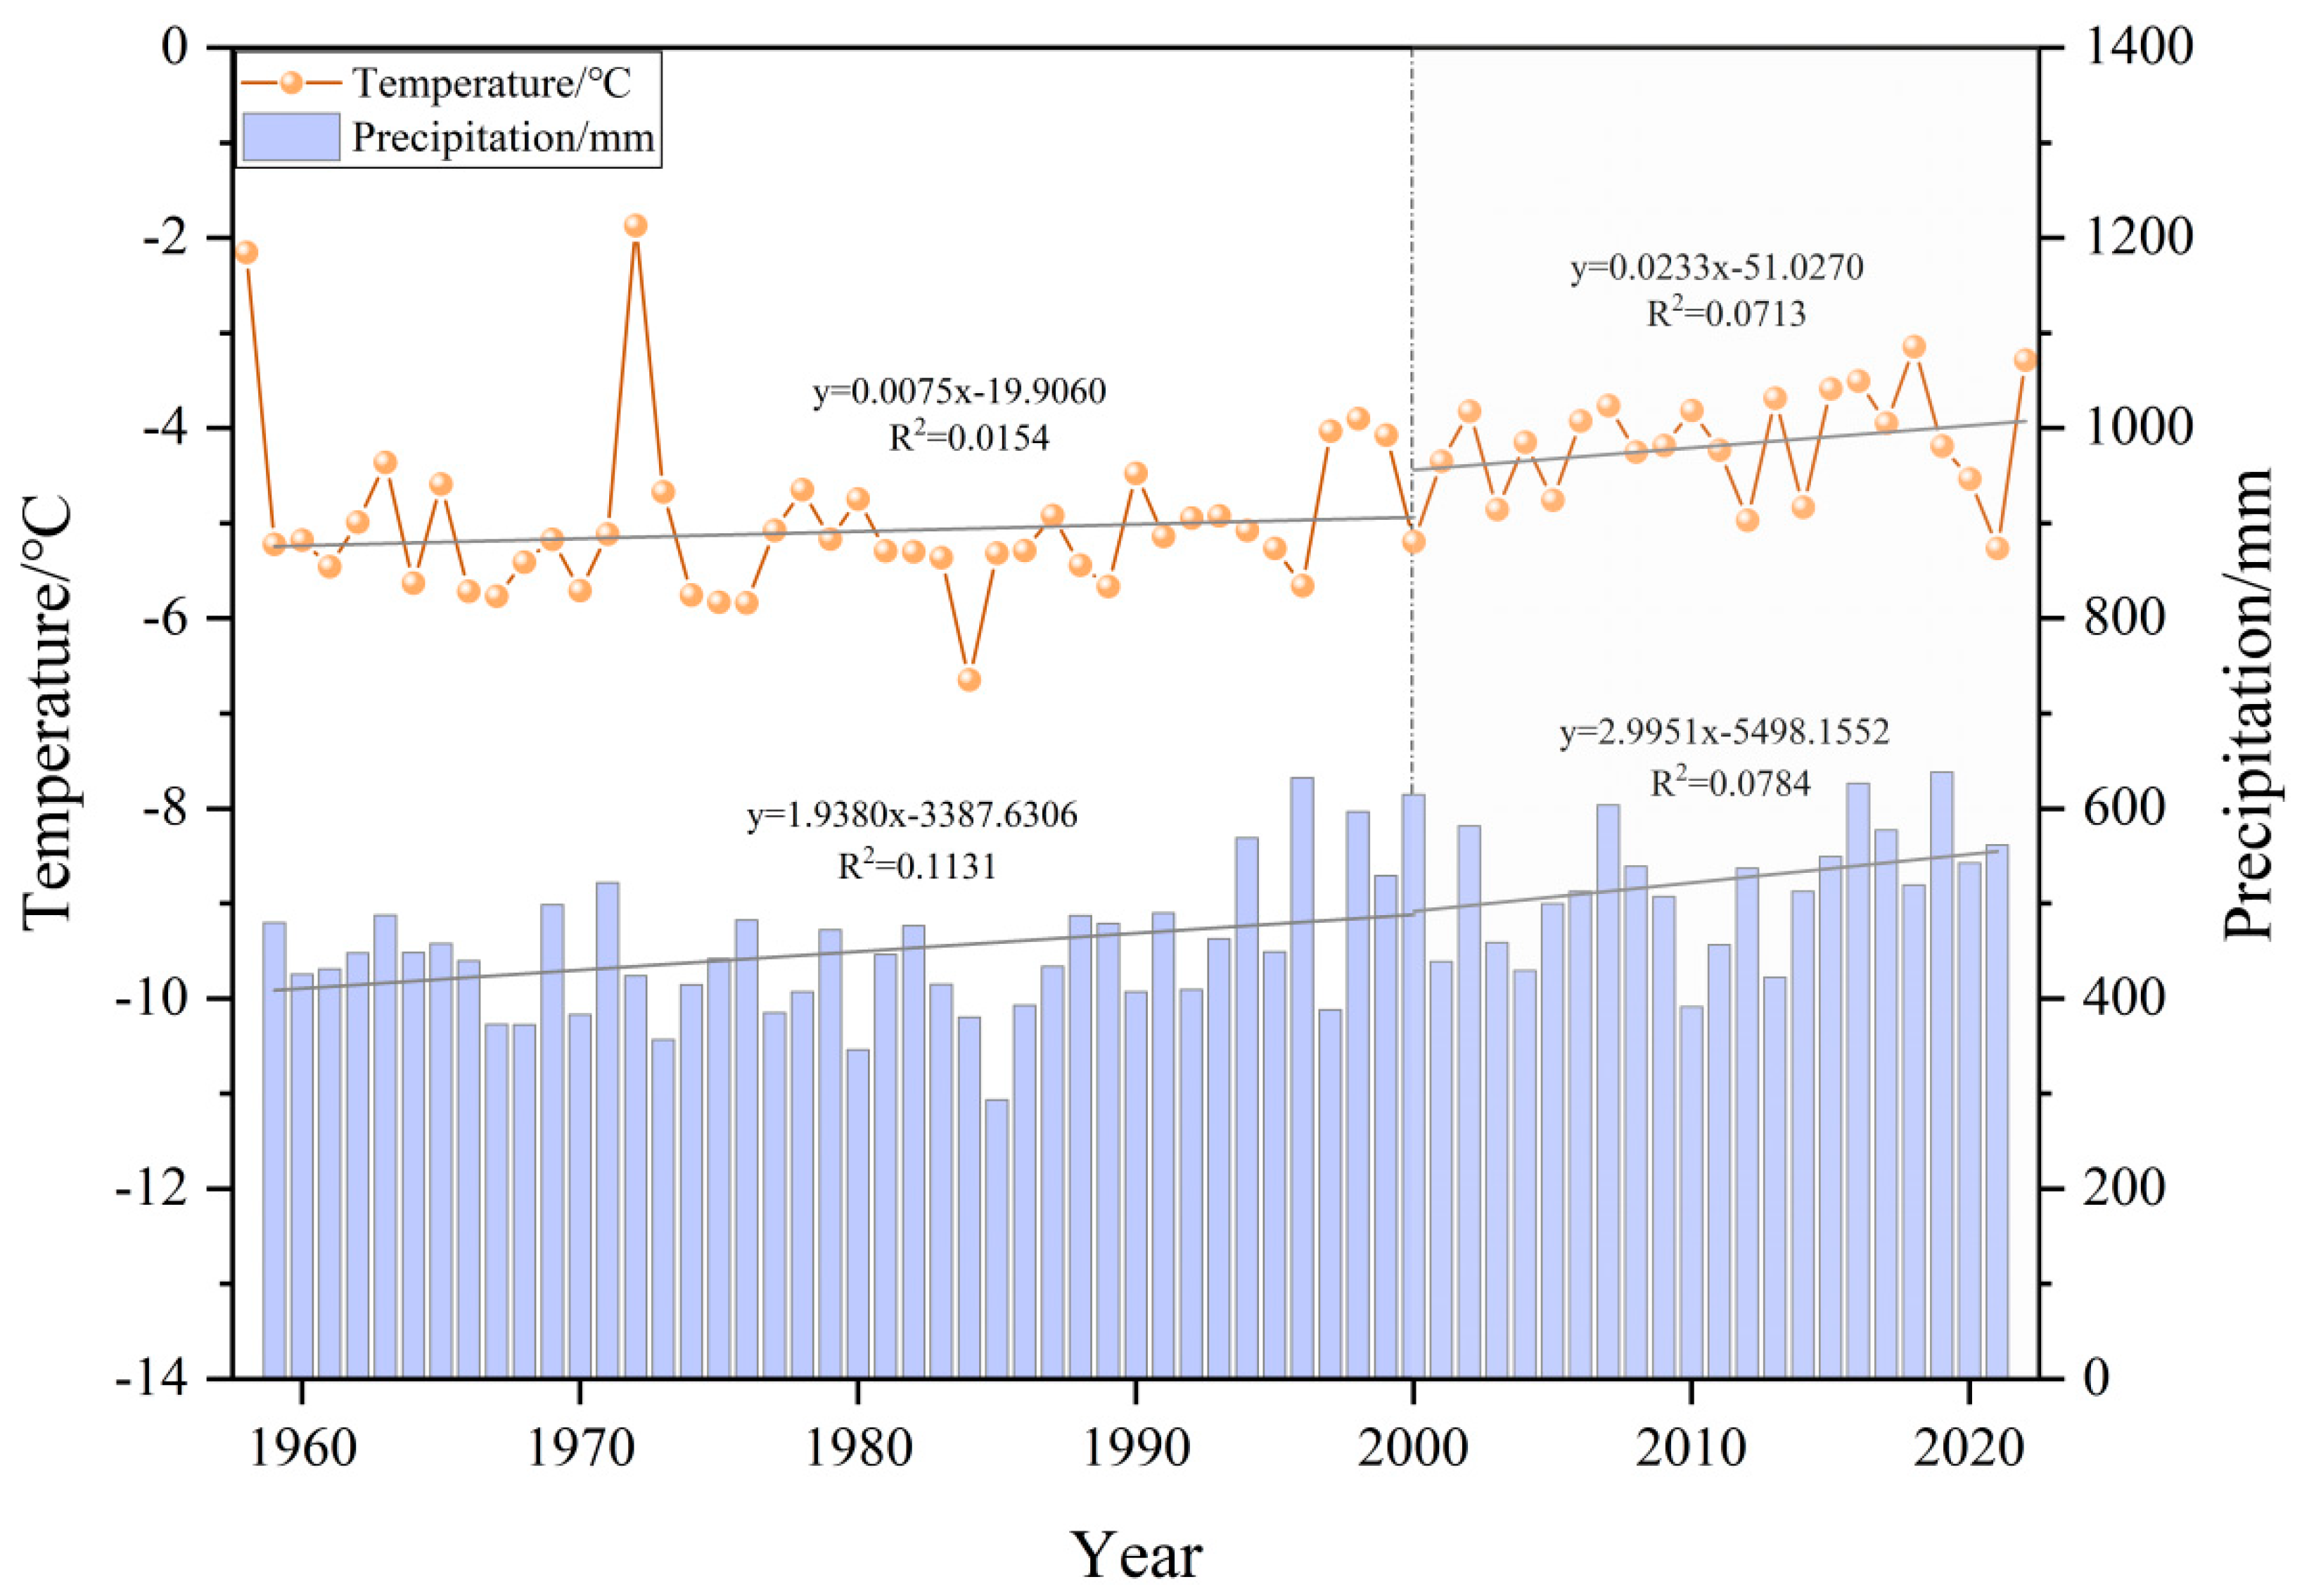
Climate is the basic factor in assessing glacier change. It is shown that temperature is the leading causes of the glacier change [54,55]. The amount of glacial melt needs to increase by 40~50% of precipitation to compensate for every 1 °C increase in the mean summer temperature [56]. Figure 11 illustrates the temperatures and precipitation obtained from the Daxigou meteorological station for the years 1958–2022, showing that the Urumqi Valley has experienced warming and wetting potential during the last half-century. The average temperature from 1959 to 2022 is −4.75 °C in this region. The average temperature in 1959–2000 and 2000–2022 is 5.02 °C and 4.23 °C, which is an increase of 0.20 °C/10a and 0.07 °C/10a, respectively. The average annual precipitation from 1960 to 2021 is 473.80 mm in this region. The average precipitation in 1959–2000 and 2000–2022 is 444.64 mm and 528.13 mm, which has a increasing rate of 19.38 mm/10a and 29.95 mm/10a, respectively.
In order to further explore the dominant factors and approximate time lag of temperature and precipitation on past glacier changes in the URB, we calculated the correlation coefficients between glacier mass balance delayed by 1–6 years and climate factors, respectively (Figure 12). The highest correlation between summer temperatures and the magnitude of glacier loss can be seen, which means that the higher the summer temperatures, the more glacier loss. In addition, because the annual precipitation accumulation in the region is mainly contributed by summer precipitation, the correlation coefficients obtained for annual and summer precipitation with glacier mass balance do not differ much. In terms of the delay period, there is the highest correlation coefficient between glacier mass balance with a three-year lag and summer temperature. The highest correlation coefficient between glacier mass balance and annual precipitation was found in the two-year lag, and the correlation coefficient between glacier mass balance and winter precipitation was negative at that time, which proved that winter precipitation not only did not cause the glacier loss, but contributed to the accumulation of the glacier, but only with a minor contribution. Therefore, the response of glaciers to climate in the URB has a lag of 2–3 years.
6. Conclusions
This study aimed to quantify the glacier changes in the Urumqi Valley in the Tianshan Mountains, and the area changes of glaciers were assessed by multi-source remote sensing imagery and analyzed in conjunction with topographic factors. In addition, the mass balance of the glaciers in the basin was estimated using geodetic methods and validated with the aid of traditional glaciological methods, and the following main conclusions were obtained:
(1) In 2022, 108 glaciers were mapped in the entire Urumqi Valley, a decrease of nearly one-third compared to 150 in 1964. The glacier area in the basin decayed rapidly from 48.68 ± 4.59 km2 in 1964 to 21.61 ± 0.26 km2 in 2022, with a shrinkage rate of 0.47 ± 0.04 km2·a−1 and an overall relative rate of change in glacier area of 55.6% (0.96%·a−1). Glacier area shrinkage has increased since 1990 and is higher than the average annual change rate (0.96%·a−1) over the past 58 years. The majority of the glaciers are orientated towards N (N\NE\NW) and are situated in the elevation zone between 3800–4000 m. The glacier area oriented N had the most ablation, accounting for 58% of the total area, and the largest percentage of glacier area (over 50%) was between 3900–4000 m. Different combinations of topographic factors are associated with differential glacier area changes
(2) The glacier elevation in the Urumqi Valley declined by 44.64 ± 0.69 m during 2000–2022, with an average annual decline of 2.31 ± 0.05 m·a−1 in 2000–2010 and 1.80 ± 0.01 m·a−1 in 2010–2022. The volume of glaciers in the Urumqi Valley has decreased by 0.24 km3 over the past 22 years. The average annual glacier mass balance of URB is −0.65 ± 0.11 m w.e.a−1 during 2000–2022. Of this, the average glacier mass balance was −0.67 ± 0.12 m w.e.a−1 before 2010 and was −0.63 ± 0.11 m w.e.a−1 after 2010. The average geodetic mass balance of the monitored UHG-1 (−0.69 ± 0.11 m w.e.a−1) somewhat deviates from the observed result (−0.65 m w.e.a−1), but the geodetic method result in this paper can be used to reflect the changes of glaciers in the region;
(3) Based on the OGGM model simulations, SSP5.8-5 model has the fastest glacier area and volume losses and the rate of glacier area and volume loss in 2020–2100 undergoes a fast and then slow process. The fastest rate of glacier area loss occurs between 2030 and 2035; the rate of glacier area loss slows between 2042 and 2050; and the lowest rate of glacier area loss occurs between 2070 and 2080, when glacier area will no longer be decreasing. The highest and lowest inflection points for glacier volume loss are in 2035 and 2070, respectively. The glacier mass balance based on the OGGM model can correspond well with the observed values, so it confirms that the results of this paper’s prediction of glacier changes in the Urumqi Valley are credible. Moreover, Different SSP scenarios show different changes in glacier mass balance, with the fastest negative mass balance in the SSP5.8-5 model, followed by SSP2.4-5, and the slowest negative mass balance in SSP1.2-6.
(4) Although the glacier area change and mass balance are spatially heterogeneous, glacier melting in the basin has shown an accelerated shrinkage trend in recent years compared to other regions. Higher temperatures are the dominant factor contributing to accelerated glacier loss, and increased (summer) precipitation can also make glacier mass balance values more negative. Winter precipitation will contribute almost no amount to glacier accumulation. There is a lag of roughly 2–3 years in the response of glaciers to climate in the Urumqi Valley.
Author Contributions
Conceptualization, L.W.; methodology, S.Y., S.L. and Y.X.; software, S.Y. and X.J.; validation, S.Y., X.J. and S.L.; formal analysis, S.Y. and X.J.; investigation, L.W. and S.Y.; resources, S.L.; data curation, L.W., S.Y., K.C., S.L. and X.J.; writing—original draft preparation, L.W., S.Y. and Y.X.; writing—review and editing, S.Y. and K.C.; visualization, K.C.; supervision, L.W., S.Y., K.C., S.L. and X.J.; project administration, L.W.; funding acquisition, L.W. All authors have read and agreed to the published version of the manuscript.
Funding
This research was funded by the Third Comprehensive Scientific Expedition of Xinjiang Uyghur Autonmous Region (2022xjkk0802), the Science and Technology program of Gansu Province (Grant No 23ZDFA017, 22ZD6FA005), the State Key Laboratory of Cryospheric Science (SKLCS-ZZ-2023).
Data Availability Statement
The original contributions presented in the study are included in the article, further inquiries can be directed to the corresponding author.
Acknowledgments
Thanks to NASA, USGS, and Copernicus Open Access Hub for providing the remote sensing images used in this study; thanks to the partners who went to the field together for field measurements.
Conflicts of Interest
The authors declare no conflicts of interest.
References
- Benn, D.I.; Bolch, T.; Hands, K.; Gulley, J.; Luckman, A.; Nicholson, L.I.; Quincey, D.; Thompson, S.; Toumi, R.; Wiseman, S. Response of Debris-Covered Glaciers in the Mount Everest Region to Recent Warming, and Implications for Outburst Flood Hazards. Earth-Sci. Rev. 2012, 114, 156–174. [Google Scholar] [CrossRef]
- Gardner, A.S.; Moholdt, G.; Cogley, J.G.; Wouters, B.; Arendt, A.A.; Wahr, J.; Berthier, E.; Hock, R.; Pfeffer, W.T.; Kaser, G.; et al. A Reconciled Estimate of Glacier Contributions to Sea Level Rise: 2003 to 2009. Science 2013, 340, 852–857. [Google Scholar] [CrossRef] [PubMed]
- Yao, T.; Wu, G.; Xu, B.; Wang, W.; Gao, J.; An, B. Asian Water Tower Change and its Impacts. Bull. Chin. Acad. Sci. 2019, 34, 1203–1209. [Google Scholar] [CrossRef]
- Hugonnet, R.; Mcnabb, R.; Berthier, E.; Menounos, B.; Nuth, C.; Girod, L.; Farinotti, D.; Huss, M.; Dussaillant, I.; Brun, F.; et al. Accelerated Global Glacier Mass Loss in the Early Twenty-First Century. Nature 2021, 592, 726–731. [Google Scholar] [CrossRef] [PubMed]
- IPCC. Working Group I Contribution to the IPCC Fifth Assessment Report Climate Change 2013: The Physical Science Basis Summary for Policymakers; Stocker, T.F., Qin, D., Plattner, G.-K., Tignor, M., Allen, S.K., Boschung, J., Nauels, A., Xia, Y., Bex, V., Midgley, P.M., Eds.; Cambridge University Press: Cambridge, UK; New York, NY, USA, 2013; p. 1535. [Google Scholar]
- IPCC. Summary for Policymakers. In Climate Change 2021: The Physical Science Basis. Contribution of Working Group I to the Sixth Assessment Report of the Intergovernmental Panel on Climate Change; Masson-Delmotte, V., Zhai, P., Pirani, A., Connors, S.L., Péan, C., Berger, S., Caud, N., Chen, Y., Goldfarb, L., Gomis, M.I., et al., Eds.; Cambridge University Press: Cambridge, UK, 2021. [Google Scholar]
- Bosson, J.B.; Huss, M.; Cauvy-Fraunié, S.; Clément, J.C.; Costes, G.; Fischer, M.; Poulenard, J.; Arthaud, F. Future emergence of new ecosystems caused by glacial retreat. Nature 2023, 620, 562–569. [Google Scholar] [CrossRef]
- Chen, Y.; Opała-Owczarek, M.; Chen, F.; Owczarek, P.; Zhang, H.; Wang, S.; Hu, M.; Satylkanov, R.; Ermenbaev, B.; Zulfiyor, B.; et al. Tree-ring perspective on the past and future mass balance of a glacier in Tien Shan (Central Asia): An example from the Tuyuksu glacier, Kyrgyzstan. Palaeogeogr. Palaeoclimatol. Palaeoecol. 2023, 625, 111696. [Google Scholar] [CrossRef]
- Wang, S.; Yao, T.; Pu, J.; Wang, J. Historical reconstruction and future projection of mass balance and ice volume of Qiyi Glacier, Northeast Tibetan Plateau. J. Hydrol. Reg. Stud. 2023, 47, 101403. [Google Scholar] [CrossRef]
- Gobbi, M.; Ambrosini, R.; Casarotto, C.; Diolaiuti, G.; Ficetola, G.F.; Lencioni, V.; Seppi, R.; Smiraglia, C.; Tampucci, D.; Valle, B.; et al. Vanishing permanent glaciers: Climate change is threatening a European Union habitat (code 8340) and its poorly known biodiversity. Biodivers. Conserv. 2023, 30, 2267–2276. [Google Scholar] [CrossRef]
- Yang, S.; Wang, F.; Xie, Y.; Zhao, W.; Bai, C.; Liu, J.; Xu, C. Delineation Evaluation and Variation of Debris-Covered Glaciers Based on the Multi-Source Remote Sensing Images, Take Glaciers in the Eastern Tomur Peak Region for Example. Remote Sens. 2023, 15, 2575. [Google Scholar] [CrossRef]
- Wang, P.; Li, Z.; Xu, C.; Xing, W.; Zhou, P.; Zhang, H. Multi-decadal variations in glacier flow velocity and the influencing factors of Urumqi Glacier No. 1 in Tianshan Mountains, Northwest China. J. Arid Land 2017, 9, 900–910. [Google Scholar] [CrossRef]
- Rankl, M.; Kienholz, C.; Braun, M. Glacier Changes in the Karakoram Region Mapped by Multimission Satellite Imagery. Cryosphere 2014, 8, 977–989. [Google Scholar] [CrossRef]
- Brun, F.; Berthier, E.; Wagnon, P.; Kääb, A.; Treichler, D. A Spatially Resolved Estimate of High Mountain Asia Glacier Mass Balances from 2000 to 2016. Nat. Geosci. 2017, 10, 668–673. [Google Scholar] [CrossRef] [PubMed]
- Kääb, A.; Berthier, E.; Nuth, C.; Gardelle, J.; Arnaud, Y. Contrasting patterns of early 21st century glacier mass change in the Himalaya. Nature 2012, 488, 495–498. [Google Scholar] [CrossRef] [PubMed]
- Rounce, D.R.; Hock, R.; Shean, D.E. Glacier Mass Change in High Mountain Asia Through 2100 Using the Open-Source Python Glacier Evolution Model (PyGEM). Front. Earth Sci. 2020, 7, 331. [Google Scholar] [CrossRef]
- Farinotti, D.; Huss, M.; Fürst, J.; Landmann, J.; Machguth, H.; Maussion, F.; Pandit, A. A consensus estimate for the ice thickness distribution of all glaciers on Earth. Nat. Geosci. 2019, 12, 168. [Google Scholar] [CrossRef]
- Shean, D.E.; Bhushan, S.; Montesano, P.; Rounce, D.R.; Arendt, A.; Osmanoglu, B. A Systematic, Regional Assessment of High Mountain Asia Glacier Mass Balance. Front. Earth Sci. 2020, 7, 475909. [Google Scholar] [CrossRef]
- Vijay, S.; Braun, M.H. Seasonal and interannual variability of Columbia Glacier, Alaska (2011–2016): Ice velocity, mass flux, surface elevation and front position. Remote Sens. 2017, 9, 635. [Google Scholar] [CrossRef]
- Maussion, F.; Butenko, A.; Champollion, N.; Dusch, M.; Eis, J.; Fourteau, K.; Gregor, P.; Jarosch, A.; Landmann, J.; Oesterle, F.; et al. The open global glacier model (OGGM) v1.1. Geosci. Model Dev. 2019, 12, 909–931. [Google Scholar] [CrossRef]
- Marzeion, B.; Jarosch, A.H.; Hofer, M. Past and future sea-level change from the surface mass balance of glaciers. Cryosphere 2012, 6, 1295–1322. [Google Scholar] [CrossRef]
- Zhao, W.; Li, Z.; Mu, J.; Li, H.; Yang, S.; Xu, C. Projection of glacier area and volume in the Sawir Mountains modeled by the OGGM. J. Glaciol. Geocryol. 2023, 45, 497–508. [Google Scholar] [CrossRef]
- Wang, P.; Li, Z.; Zhou, P.; Li, H.; Yu, G.; Xu, C.; Wang, L. Rapid decrease of observed mass balance in the Urumqi Glacier No. 1, Tianshan Mountains, central Asia. Quat. Int. 2017, 349, 135–141. [Google Scholar] [CrossRef]
- Han, T.D.; Ding, Y.J.; Ye, B.S.; Liu, S.Y.; Jiao, K.Q. Mass balance characteristics of Urumqi Glacier No. 1, Tien Shan, China. Ann. Glaciol. 2006, 43, 323–328. [Google Scholar] [CrossRef]
- Wu, L.H.; Li, H.L.; Wang, L. Application of a degree day model for determination of mass balance of Urumqi Glacier No. 1, Eastern Tianshan, China. J. Earth Sci. 2011, 22, 470–481. [Google Scholar] [CrossRef]
- Zhang, G.F.; Li, Z.Q.; Wang, W.D.; Wang, W.B. Comparative study on observed mass balance between east and west branch of Urumqi Glacier No. 1, Eastern Tianshan, China. Sci. Cold Arid Reg. 2013, 5, 316–323. [Google Scholar] [CrossRef]
- Xu, C.; Li, Z.; Wang, P.; Anjum, M.N.; Li, H.; Wang, F. Detailed comparison of glaciological and geodetic mass balances for Urumqi Glacier No. 1, eastern Tien Shan, China, from 1981 to 2015. Cold Reg. Sci. Technol. 2018, 155, 137–148. [Google Scholar] [CrossRef]
- Xu, C.; Li, Z.; Li, H.; Wang, F.; Zhou, P. Long-range terrestrial laser scanning measurements of annual and intra-annual mass balances for Urumqi Glacier No. 1, eastern Tien Shan, China. Cryosphere 2019, 13, 2361–2383. [Google Scholar] [CrossRef]
- Li, H.; Wang, P.; Li, Z.; Jin, S.; He, J. Summertime surface mass balance and energy balance of Urumqi Glacier No. 1, Chinese Tien Shan, modeled by linking COSIMA and in-situ measured meteorological records. Clim. Dyn. 2022, 61, 765–787. [Google Scholar] [CrossRef]
- Wang, P.; Li, H.; Li, Z.; Liu, Y.; Xu, C.; Mu, J.; Zhang, H. Seasonal Surface Change of Urumqi Glacier No. 1, Eastern Tien Shan, China, Revealed by Repeated High-Resolution UAV Photogrammetry. Remote Sens. 2021, 13, 3398. [Google Scholar] [CrossRef]
- Yang, M.; Li, Z.; Anjum, M.N.; Kayastha, R.; Kayastha, R.B.; Rai, M.; Zhang, X.; Xu, C. Projection of streamflow changes under CMIP6 scenarios in the Urumqi River head watershed, Tianshan Mountain, China. Front. Earth Sci. 2022, 10, 857854. [Google Scholar] [CrossRef]
- Liu, S.; Guo, W.; Xu, J. The Second Glacier Inventory Dataset of China (Version 1.0) (2006–2011). A Big Earth Data Platform for Three Poles. 2012. Available online: https://cstr.cn/18406.11.glacier.001.2013.db (accessed on 11 March 2024).
- Li, Z.Q.; Li, H.L.; Chen, Y.N. Mechanisms simulation of accelerated shrinkage of continental glaciers: A case study of Urumqi Glacier No 1 in Eastern Tianshan central Asia. J. Earth Sci. 2011, 22, 423–430. [Google Scholar] [CrossRef]
- Kaushik, S.; Dharpure, J.K.; Joshi, P.K.; Ramanathan, A.L.; Singh, T. Climate change drives glacier retreat in Bhaga basin located in Himachal Pradesh, India. Geocarto Int. 2019, 35, 1179–1198. [Google Scholar] [CrossRef]
- Bolch, T.; Menounos, B.; Wheate, R. Landsat-based Inventory of Glaciers in Western Canada, 1985–2005. Remote Sens. Environ. 2010, 114, 127–137. [Google Scholar] [CrossRef]
- Nuimura, T.; Sakai, A.; Taniguchi, K.; Nagai, H.; Lamsal, D.; Tsutaki, S.; Kozawa, A.; Hoshina, Y.; Takenaka, S.; Omiya, S.; et al. The GAMDAM Glacier Inventory: A quality controlled inventory of Asian glaciers. Cryosphere 2015, 9, 849–864. [Google Scholar] [CrossRef]
- Tielidze, L.G.; Bolch, T.; Wheate, R.D.; Kutuzov, S.S.; Lavrentiev, I.I.; Zemp, M. Supra-glacial debris cover changes in the Greater Caucasus from 1986 to 2014. Cryosphere 2020, 14, 585–598. [Google Scholar] [CrossRef]
- Zhang, Z.; Liu, S.; Zhang, Y.; Wei, J.; Jiang, Z.; Wu, K. Glacier Variations at Aru Co in Western Tibet from 1971 to 2016 Derived from Remote-Sensing Data. J. Glaciol. 2018, 64, 397–406. [Google Scholar] [CrossRef]
- Nuth, C.; Kääb, A. Co-registration and Bias Corrections of Satellite Elevation Data Sets for Quantifying Glacier Thickness Change. Cryosphere 2011, 5, 271–290. [Google Scholar] [CrossRef]
- Bolch, T.; Pieczonka, T.; Benn, D. Multi-decadal mass loss of glaciers in the Everest area (Nepal Himalaya) derived from stereo imagery. Cryosphere 2011, 5, 349–358. [Google Scholar] [CrossRef]
- Pieczonka, T.; Bolch, T.; Buchroithner, M. Generation and evaluation of multi-temporal digital elevation models from different optical sensors. Photogramm. Remote Sens. 2011, 66, 927–940. [Google Scholar] [CrossRef]
- Huss, M. Density Assumptions for Converting Geodetic Glacier Volume Change to Mass Change. Cryosphere 2013, 7, 877–887. [Google Scholar] [CrossRef]
- Han, T.; Liu, S.; Ding, Y.; Jiao, K. A characteristics mass balance of glacier No. 1 at the headwaters of the Urumqi River, Tianshan Mountains. Adv. Earth Sci. 2005, 20, 298. [Google Scholar] [CrossRef]
- Xie, Z.C.; Liu, C.H. Introduction to Glaciology; Shanghai Popular Science Press: Shanghai, China, 2010; pp. 1–490. [Google Scholar]
- Paterson, W.S.B. The Physics of Glaciers, 3rd ed.; Pergamon: New York, NY, USA, 1994. [Google Scholar]
- Che, Y.J.; Zhang, M.J.; Li, Z.Q.; Jin, S.; Wang, W.B.; Wang, S.J. Monitoring calculating of mass balance in Qingbingtan Glacier No 72. J. Glaciol. Geocryol. 2019, 41, 1–14. (In Chinese) [Google Scholar]
- Wang, P.; Li, Z.; Li, H.; Wang, W.; Zhou, P.; Wang, L. Characteristics of a partially debris-covered glacier and its response to atmospheric warming in Mt. Tomor, Tien Shan, China. Glob. Planet. Chang. 2017, 159, 11–24. [Google Scholar] [CrossRef]
- Wang, P.; Li, Z.; Li, H.; Wang, W.; Wu, L.; Zhang, H.; Huai, B.; Wang, L. Recent Evolution in Extent, Thickness, and Velocity of Haxilegen Glacier No. 51, Kuytun River Basin, Eastern Tianshan Mountains. Arct. Antarct. Alp. Res. 2016, 48, 241–252. [Google Scholar] [CrossRef]
- Zhang, H.; Li, Z.; Zhou, P.; Zhu, X.; Wang, L. Mass-balance observations and reconstruction for Haxilegen Glacier No. 51, eastern Tien Shan, from 1999 to 2015. J. Glaciol. 2018, 64, 689–699. [Google Scholar] [CrossRef]
- Zhang, R.; Wei, W.; Shang, H.; Yu, S.; Gou, X.; Qin, L.; Bolatov, K.; Mambetov, B.T. A tree ring-based record of annual mass balance changes for the TS.Tuyuksuyskiy Glacier and its linkages to climate change in the Tianshan Mountains. Quat. Sci. Rev. 2019, 205, 10–21. [Google Scholar] [CrossRef]
- Liu, L.; Tian, H.; Zhang, X.; Chen, H.; Zhang, Z.; Zhao, G.; Kang, Z.; Wang, T.; Gao, Y.; Yu, F. Analysis of Spatiotemporal Heterogeneity of Glacier Mass Balance on the Northern and Southern Slopes of the Central Tianshan Mountains, China. Water 2022, 14, 1601. [Google Scholar] [CrossRef]
- Zhao, G.; Zhang, Z.; Liu, L.; Xu, L.; Wang, P.; Li, L.; Ning, S. Changes of glacier mass balance in Manas river basin based on multi-source remote sensing data. Acta Geogr. Sin. 2020, 75, 98–112. [Google Scholar] [CrossRef]
- Yang, X.; Wang, N.; Liang, Q.; Chen, A. Glacier changes on the north slope of Tianshan Mountains in recent 60 years. Arid. Land Georg. 2023, 46, 1073–1083. [Google Scholar] [CrossRef]
- Bolch, T.; Kulkarni, A.; Kääb, A.; Huggel, C.; Paul, F.; Cogley, J.G.; Frey, H.; Kargel, J.S.; Fujita, K.; Scheel, M. The state and fate of Himalayan glaciers. Science 2012, 336, 310–314. [Google Scholar] [CrossRef]
- Che, Y.; Zhang, M.; Li, Z.; Wang, S.; Du, M.; Wang, P.; Wang, J.; Zhou, P. Quantitative evaluation of glacier change and its response to climate change in the Chinese Tien Shan. Cold Reg. Sci. Technol. 2018, 153, 144–155. [Google Scholar] [CrossRef]
- Kang, E. Calculation of energy balance characteristics and material balance changes in the high Asian cryosphere. J. Glaciol. Geocryol. 1996, S1, 12–22. [Google Scholar]
Figure 1.
Location of the Urumqi Valley and glacier distribution. (a) is a diagram of the entire Urumqi River basin; (b) is a diagram of all the glaciers involved in the study area.
Figure 1.
Location of the Urumqi Valley and glacier distribution. (a) is a diagram of the entire Urumqi River basin; (b) is a diagram of all the glaciers involved in the study area.

Figure 2.
Schematic diagram of flower pole deployment under traditional glaciological methods.

Figure 3.
Distribution and delineation of glaciers in different periods of the Urumqi River basin.

Figure 4.
Schematic illustration of the distribution and variation of glacier outlines over time. The left figure shows glacier orientation over time. The right figure shows the changes in glacier area at different altitudes.
Figure 4.
Schematic illustration of the distribution and variation of glacier outlines over time. The left figure shows glacier orientation over time. The right figure shows the changes in glacier area at different altitudes.

Figure 5.
Glacier height variations in Urumqi Valley, 2000–2010.

Figure 6.
Glacier height variations in Urumqi Valley, 2010–2022.

Figure 7.
Box plots of annual height variations for multi-period DEMs.

Figure 8.
The area and volume change of glaciers in the Urumqi River Basin from 2020 to 2100. Where (a,b) shows the area and volume trends of the 13 climate models under different climate models, respectively; (c,d) presents the mean values of the simulation results of the 13 climate models after processing under the scenarios of SSP1-2.6, SSP2-4.5, and SSP5-8.5. The 13 model patterns described in the legend and whose simulation standard errors are displayed as shaded areas in (c,d). I, II, III represent the different stages of the trend change.

Figure 9.
Annual mass balance of UHG-1 based on traditional glaciological measurements, 1958–2022.

Figure 10.
Validation and prediction of glacier mass balance for the OGGM model. (1) Comparison of OGGM-based and observed glacier mass balance for 2000–2020. (2) Future glacier mass balance values based on glacier area and volume from the OGGM model.
Figure 10.
Validation and prediction of glacier mass balance for the OGGM model. (1) Comparison of OGGM-based and observed glacier mass balance for 2000–2020. (2) Future glacier mass balance values based on glacier area and volume from the OGGM model.

Figure 11.
Variations in annual mean temperature and precipitation observed at the Daxigou Meteorological Station from 1959 to 2022.
Figure 11.
Variations in annual mean temperature and precipitation observed at the Daxigou Meteorological Station from 1959 to 2022.

Figure 12.
Correlation analysis of different lags of glacial mass balance with air temperature and precipitation.
Figure 12.
Correlation analysis of different lags of glacial mass balance with air temperature and precipitation.


Table 1.
Attributes and applications of the data used in the past glacier change.
| Data | Image ID/Attribution | Date | Resolution | Application |
|---|---|---|---|---|
| Topographical maps | —— | August 1964 | 1:50,000 | Boundary Extraction |
| Landsat4 TM | LT41430301989230XXX01 | 18 August 1989 | 30 m | Boundary Extraction |
| Spot 5 | 5217-262/805/09/0704:57:242A | 7 September 2005 | 10 m/5 m | Boundary Extraction |
| ZY3 02 TMS | _L1A0001048489 | 14 September 2022 | 2.5 m | Boundary Extraction and Generating DEMs from Stereo Images |
| _L1A0001048441 | 14 September 2022 | 2.5 m | ||
| _L1A0001130875 | 22 July 2022 | 2.5 m | ||
| _L1A0001130874 | 22 July 2022 | 2.5 m | ||
| landsat9 OLI_TIRS | LC91430302022257LGN01 | 14 September 2022 | 30 m/15 m | Calibration Control Points |
| SRTM DEM | —— | February 2000 | 30 m | Glacial Elevation Changes |
| ALOS PALSAR DEM | ALPSRP253320850 | 26 October 2010 | 12.5 m | Glacial Elevation Changes |
| ASTER GDEM V3 | —— | 5 August 2019 | 30 m | Basin Extraction and Comparison Aids |
| ZY3-DEM | —— | July–September 2022 | 2.5 m | Glacial Elevation Changes |
| The Second Glacier Inventory of China | 2006–2011 | 30 m/15 m | Reference to Basic Glacier Properties | |
Table 2.
Glacier delineation and uncertainty in each sub-basin of the Urumqi River.
| District | 1964 Area | 1989 Area | 2005 Area | 2022 Area | Area Change Rate (1964–2022) |
|---|---|---|---|---|---|
| 5Y730A | 6.16 ± 0.58 km2 | 4.52 ± 0.44 km2 | 3.19 ± 0.11 km2 | 1.99 ± 0.04 km2 | 32.31%·a−1 |
| 5Y730B | 21.62 ± 2.04 km2 | 18.41 ± 1.81 km2 | 12.81 ± 0.43 km2 | 9.73 ± 0.12 km2 | 45.00%·a−1 |
| 5Y730C | 9.17 ± 0.86 km2 | 8.32 ± 0.82 km2 | 5.13 ± 0.17 km2 | 4.10 ± 0.04 km2 | 44.71%·a−1 |
| 5Y730D | 11.73 ± 1.11 km2 | 9.32 ± 0.91 km2 | 7.31 ± 0.25 km2 | 5.79 ± 0.07 km2 | 49.36%·a−1 |
| Total | 48.68 ± 4.59 km2 | 40.57 ± 3.98 km2 | 28.44 ± 0.96 km2 | 21.61 ± 0.27 km2 | 44.39%·a−1 |
Table 3.
Metrics of glacier change and uncertainty in different periods.
| Period | Overall Losses km2 | Overall Error of Variation | Annual Area Change | Area Change Rate |
|---|---|---|---|---|
| 1964–1989 | 8.11 km2 | 1.10 km2 | 0.32 ± 0.04 km2·a−1 | 0.67%·a−1 |
| 1989–2005 | 12.14 km2 | 1.26 km2 | 0.76 ± 0.08 km2·a−1 | 1.87%·a−1 |
| 2005–2022 | 6.82 km2 | 0.24 km2 | 0.40 ± 0.01 km2·a−1 | 1.41%·a−1 |
| 1964–2020 | 27.07 km2 | 2.57 km2 | 0.47 ± 0.04 km2·a−1 | 0.96%·a−1 |
Table 4.
Original and adjusted errors between muti-DEMs.
| Period | Item | Original (m) | Adjusted (m) | N | SE (m) | σ (m) | ||
|---|---|---|---|---|---|---|---|---|
| MED | STDV | MED | STDV | |||||
| 2000–2010 | SRTM_ALOS | 17.84 | 29.47 | 0.14 | 32.85 | 3872 | 0.53 | 0.53 |
| 2010–2022 | ALOS_ZiyuanNo.3 | 2.00 | 12.59 | −0.13 | 9.74 | 10,363 | 0.10 | 0.16 |
Table 5.
Comparison of glacier mass balance of monitored glaciers and typical basins in western China.
Table 5.
Comparison of glacier mass balance of monitored glaciers and typical basins in western China.
| Region | Typical Glacier | Period | Basin Mass Balance/m w.e.a−1 | Period | Single Mass Balance/m w.e.a−1 | Source |
|---|---|---|---|---|---|---|
| Urumqi Valley | UHG | 2000–2022 2000–2010 2010–2022 | −0.65 ± 0.11 −0.67 ± 0.12 −0.63 ± 0.11 | 2000–2022 2000–2010 2010–2022 | −0.69 ± 0.12 −0.71 ± 0.12 −0.67 ± 0.12 | This study |
| Mt.Tomor | Qingbingtan No.72 | 1964–2008 2008–2014 | −0.20 −0.38 | [46,47] | ||
| Keqikaer | 1999–2003 2004–2006 | −0.22 −0.44 | [48] | |||
| Kuitun River Basin | Haxilegen No.51 | 2004–2006 2010–2011 | −0.38 −0.68 | [49] | ||
| Yili River Basin | Ts.Tuyuksuyskiy | 2003–2018 | −0.42 ± 0.16 | 2003–2018 | −0.50 | [50] |
| Kaidu River Basin | —— | 2001–2016 | −0.48 | —— | —— | [51] |
| Manas River Basin | —— | 2000–2016 | −0.58 | —— | —— | [52] |
| Northern Tin Shan | —— | 2000–2020 | −0.39 ± 0.04 | —— | —— | [53] |
Disclaimer/Publisher’s Note: The statements, opinions and data contained in all publications are solely those of the individual author(s) and contributor(s) and not of MDPI and/or the editor(s). MDPI and/or the editor(s) disclaim responsibility for any injury to people or property resulting from any ideas, methods, instructions or products referred to in the content. |
© 2024 by the authors. Licensee MDPI, Basel, Switzerland. This article is an open access article distributed under the terms and conditions of the Creative Commons Attribution (CC BY) license (https://creativecommons.org/licenses/by/4.0/).
Share and Cite
MDPI and ACS Style
Wang, L.; Yang, S.; Chen, K.; Liu, S.; Jin, X.; Xie, Y. A Long-Duration Glacier Change Analysis for the Urumqi River Valley, a Representative Region of Central Asia. Remote Sens. 2024, 16, 1489. https://doi.org/10.3390/rs16091489
AMA Style
Wang L, Yang S, Chen K, Liu S, Jin X, Xie Y. A Long-Duration Glacier Change Analysis for the Urumqi River Valley, a Representative Region of Central Asia. Remote Sensing. 2024; 16(9):1489. https://doi.org/10.3390/rs16091489
Chicago/Turabian StyleWang, Lin, Shujing Yang, Kangning Chen, Shuangshuang Liu, Xiang Jin, and Yida Xie. 2024. "A Long-Duration Glacier Change Analysis for the Urumqi River Valley, a Representative Region of Central Asia" Remote Sensing 16, no. 9: 1489. https://doi.org/10.3390/rs16091489
Note that from the first issue of 2016, this journal uses article numbers instead of page numbers. See further details here.