
Monitoring Total Phosphorus Concentration in the Middle Reaches of the Yangtze River Using Sentinel-2 Satellites


1
Key Laboratory for Environment and Disaster Monitoring and Evaluation of Hubei, Innovation Academy for Precision Measurement Science and Technology, Chinese Academy of Sciences, Wuhan 430077, China
2
University of Chinese Academy of Sciences, Beijing 100049, China
3
Geospatial Sciences Center of Excellence, South Dakota State University, Brookings, SD 57007, USA
*
Author to whom correspondence should be addressed.
Remote Sens. 2024, 16(9), 1491; https://doi.org/10.3390/rs16091491
Submission received: 28 February 2024
/
Revised: 10 April 2024
/
Accepted: 19 April 2024
/
Published: 23 April 2024
(This article belongs to the Special Issue Remote Sensing in Natural Resource and Water Environment II)
Abstract
:Total phosphorus (TP, a non-optical sensitivity parameter) has become the primary pollutant in the Yangtze River, the third largest river in the world. It is strongly correlated with turbidity (an optical sensitivity parameter) in rivers. In this study, we constructed a turbidity-mediated TP retrieval model using Sentinel-2 observations and field-measured daily-scale water quality. The model was successfully applied to estimate the temporal and spatial variations of TP concentration in the middle reaches of the Yangtze River (MYR) from 2020 to 2023. Our results show: (1) the model accuracy of TP concentration retrieval with turbidity is significantly higher (R2 = 0.71, MAPE = 15.78%) than that for the model without turbidity (R2 = 0.62, MAPE = 16.38%); (2) the turbidity and TP concentration in the MYR is higher in summer and autumn than in winter and spring; and (3) the turbidity and total phosphorus (TP) concentration of the Yangtze River showed a significant increase after passing through Dongting Lake (p < 0.05).
1. Introduction
In recent decades, significant amounts of nutrients, such as nitrogen (N) and phosphorus (P), have been entering aquatic environments. This influx has accelerated the eutrophication process, resulting in a notable decrease in water quality [1,2]. The eutrophication of water bodies often leads to an increase in harmful algal blooms, which can adversely affect other aquatic organisms and alter the color and function of the water. The eutrophication of water bodies has already had a significant impact on public health and ecosystem services globally [3]. Phosphorus is recognized as the main nutrient that restricts eutrophication in aquatic environments [4], and it is also a major contributor to 80% of water eutrophication [5]. It is essential to conduct the long-term and effective monitoring of total phosphorus (TP) to provide early warnings of eutrophication in water bodies and to manage and protect water ecosystems.
Rivers play a crucial role as phosphorus land-sea transport corridors [6]. Alterations to phosphorus concentration within rivers can lead to significant ecological impacts on reservoirs, nearby lakes and coastal areas [7,8]. The TP concentration in rivers is generally spatially and temporally diverse [9,10]. Traditional methods for sampling and monitoring water quality are costly, time-consuming, and only offer limited information about localized water quality. This does not accurately represent the overall water quality status and changes across large areas. Most of the current studies on remote sensing of water quality have focused on optically active compounds such as chlorophyll-a [11], suspended sediment concentration [12], turbidity [13] and suspended particulate matter [14]. Few studies have focused on non-optical compounds in water. Because TP has no direct optical properties [15], it is difficult to estimate its content using a remote-sensing analytical model [16]. However, previous studies have shown that TP concentrations correlate well with chlorophyll-a concentrations, colorimetric dissolved organic matter (CDOM), and turbidity values in some water bodies [17,18,19]. Therefore, it can be estimated from these optically active compounds. In recent decades, satellite remote-sensing data such as Landsat, and Sentinel data have been extensively used to estimate TP concentration in various rivers around the world [20,21].
The Yangtze River is the largest river in China, spanning as many as 11 provinces, municipalities, and autonomous regions of the country. In the past few decades, the eutrophication of water bodies in the MYR has become increasingly prominent, mainly originating from factors such as agricultural non-point source pollution, dam construction, and climatic change [22,23,24]. With the aggravation of eutrophication, the rapid increase in TP concentration in water bodies has become a focus of attention [1]. According to the working report of the Ministry of Ecology and Environment of the People’s Republic of China, total phosphorus is the most serious water quality parameter exceeding the standard at 51.5% of the monitoring points in 2017–2019. It was reported that TP has become the primary pollution that restricts the improvement of water quality in the Yangtze River basin [25]. Therefore, it is of great significance to conduct remote-sensing research on TP concentration in the MYR to comprehensively understand the eutrophication status of water bodies in the region, provide a scientific basis and guide the management of water environments.
In this paper, we used Sentinel-2 MSI (multispectral imager) data from 2020–2023 to study the spatial and temporal distribution characteristics of TP concentration in the MYR. The main objectives were: (1) to establish a remote-sensing retrieval model for TP concentration in the MYR, map the spatial and temporal distribution of TP from 2020–2023 and provide effective technical methods for large-scale and rapid TP concentration monitoring; and (2) to analyze the spatial and temporal variations of TP concentration in the MYR.
2. Study Area
The Yangtze River can be divided into upper, middle and lower reaches. The middle reaches of the Yangtze River (MYR) are from the Three Gorges Dam to Poyang Lake, located between longitudes 110°~115°E and latitudes 28°~33°N, with a total length of about 955 km and a basin area of 680,000 km2 (Figure 1).
The MYR has complex landforms and dense river networks. The climate in the MYR is dominated by a subtropical monsoon climate, with marked seasonal variation [26]. Due to the rapid economic development and the increasing industrial and agricultural activities in the middle reaches of the Yangtze River, the concentrations of total phosphorus and other nutrients in water bodies have increased significantly [25]. Total phosphorus has become the primary pollutant that limits the improvement of water quality in the Yangtze River basin.
3. Materials and Methods
3.1. Measured Data
The Ministry of Ecology and Environment of the People’s Republic of China provided daily water quality data for 13 water quality monitoring points in the MYR (Figure 1) from January 2021 to May 2023. Water quality monitoring was conducted daily at 12:00 noon, which is close to the Sentinel-2 image time (~11:00 a.m.). Nine water quality parameters were measured including total phosphorus (TP), total nitrogen (TN), water temperature (WT), pH, dissolved oxygen (DO), electrical conductivity (EC), turbidity, chemical oxygen demand (COD) and ammonia nitrogen (NH3-N). Statistics for different water quality parameters for the samples are shown in Table 1.
We filtered out the outliers in the measured water quality data, matched the measured water quality data with the reflectance values of Sentinel-2 images at the same point at the same time to obtain samples, and used sample expansion to enhance the stability of the samples [27], obtaining a total of 1764 samples.
3.2. Sentinel-2 Data and Processing
In this study, a total of 126 available Sentinel-2 Level-2A images on the MYR for the period January 2020–May 2023 were downloaded from the Copernicus Open Access Hub (https://browser.dataspace.copernicus.eu, accessed on 18 April 2024). The L2A image is a bottom-of-atmosphere corrected reflectance product, obtained using the Sen2cor method [28]. The study area can be obtained using a mosaic of nine Sentinel-2 images. All bands were resampled at a resolution of 10 m. We processed all bands of Sentinel-2 with median and mean filtering (3 × 3) and then calculated the normalized difference water index (NDWI) [29]. Image filtering is a remote-sensing image-enhancement method, which redistributes the mathematical calculations of surrounding pixels to the central pixel. Filtering before extracting water can eliminate non-water pixels, such as boats and bridges on the water surface [30]. The NDWI, which typically ranges from −1 to 1, is an important metric for identifying water features in an image. Typically, a value greater than 0 indicates the presence of a water body, while a value less than 0 indicates a non-water body [29]. For the specific case of the Yangtze River, a threshold of NDWI values exceeding 0.1 is chosen for accurate delineation and extraction of its water body. The expression for NDWI is as follows:
where B3 and B8 are the green and near-infrared (NIR) bands of the Sentinel-2 image, respectively.
At present, remote-sensing retrieval of river water quality data has been applied in different areas of the world (Table 2). Relevant research has been used to retrieve water quality parameters such as TP, turbidity, total suspended solid (TSS), etc., using different satellite sensors, and most of the bands used were in the visible and NIR regions, confirming that water information is mainly concentrated in the visible and NIR bands [31]. In this study, we calculate all single-band and two-band ratios and the differences in Sentinel-2 images, as well as other band combinations used in relevant research, and make a correlation analysis between them and the water quality parameters in the samples to select the input bands for TP retrieval.
3.3. Retrieval Model of TP
TP is widely acknowledged as a non-optically active parameter in water bodies and does not directly influence the optical properties or spectral characteristics of water bodies [15]. TP in water bodies has complex physical and chemical connections with many other water quality parameters, rather than being completely independent [35]. Previous studies have shown that there is a high correlation between total phosphorus (TP) and turbidity, transparency and colored dissolved organic matter (CDOM) in water bodies [35,36,37], and this correlation can be used to determine the sensitive spectral variables for the remote-sensing estimation of TP, which also provides a theoretical basis for the retrieval of TP by remote-sensing satellites. In this study, we calculated the correlation coefficients for measured TP with other water quality parameters in the study area, and the results showed that TP has the best correlation with turbidity (r = 0.56, p < 0.05, Figure 2). Turbidity is an optically active parameter [13], so we chose turbidity as an intermediate variable for the remote-sensing retrieval of TP concentration. In Figure 2, the three band combinations that have the best correlation with TP are (B4 + B5)/B3, (B3 − B4)/(B3 + B4) and B5 − B9, with correlation coefficients of 0.59, −0.59 and 0.59, respectively. Similarly, the three band combinations with the best correlation with turbidity are (B4 + B5)/B3, (B3 − B4)/(B3 + B4) and B5 − B11, with correlation coefficients of 0.85, −0.86 and 0.84, respectively.
Because the optical characteristics of most inland water bodies are complex, the relationship between reflectance and water quality parameters cannot be established by simple linear regression [14]. Machine learning can establish statistical relationships between reflectance and measured water quality parameters, simplifying the water quality remote-sensing retrieval process and yielding high accuracy. This makes it suitable for modeling the intricate relationship between remote-sensing images and water quality parameters. Therefore, various machine learning algorithms have been developed to estimate TP concentrations in inland waters [4,5,35]. The radial basis function neural network (RBFNN) is a machine learning algorithm with a strong nonlinear fitting ability and better performance for fitting localized data. Previous studies have shown that RBFNN is suitable for remote-sensing water-quality data retrieval [27,30,38].
In this study, we used MATLAB R2019a to build the RBFNN model:
- (1)
- The input and output data were normalized to a range of −1 to 1. We divided the data into two parts, training and validation at a ratio of 3:1, and ensured that the input and output of each sample were spatially and temporally consistent.
- (2)
- We used the newrb() function to construct the RBFNN.
- (3)
- The three-band combination with the best correlation with turbidity or TP concentration is used as the input to the RBFNN (Figure 2), and the measured turbidity or TP concentration is used as the output for training the samples to the required accuracy.
- (4)
- The SIM function was used for simulation according to the model, and the turbidity of the MYR was obtained through inverse normalization.
- (5)
- Steps 1–4 were repeated to evaluate the TP concentrations, but the input parameters for the TP retrieval model were reflectance and turbidity. We divided the data between Model A and B based on the difference in input parameters (Figure 3); model A has only reflectance as an input parameter and model B has reflectance and turbidity as input parameters.
3.4. Statistical Metrics
The coefficient of determination (R2) (Equation (2)), root mean square error (RMSE) (Equation (3)), mean absolute error (MAE) (Equation (4)) and mean absolute percentage error (MAPE) (Equation (5)) were statistically analyzed.
where n is the number of data pairs, the subscript i denotes individual data points, x represents the measured water quality parameters, and y represents the water quality parameters estimated by the remote-sensing retrieval model.
4. Results
4.1. Model Performance
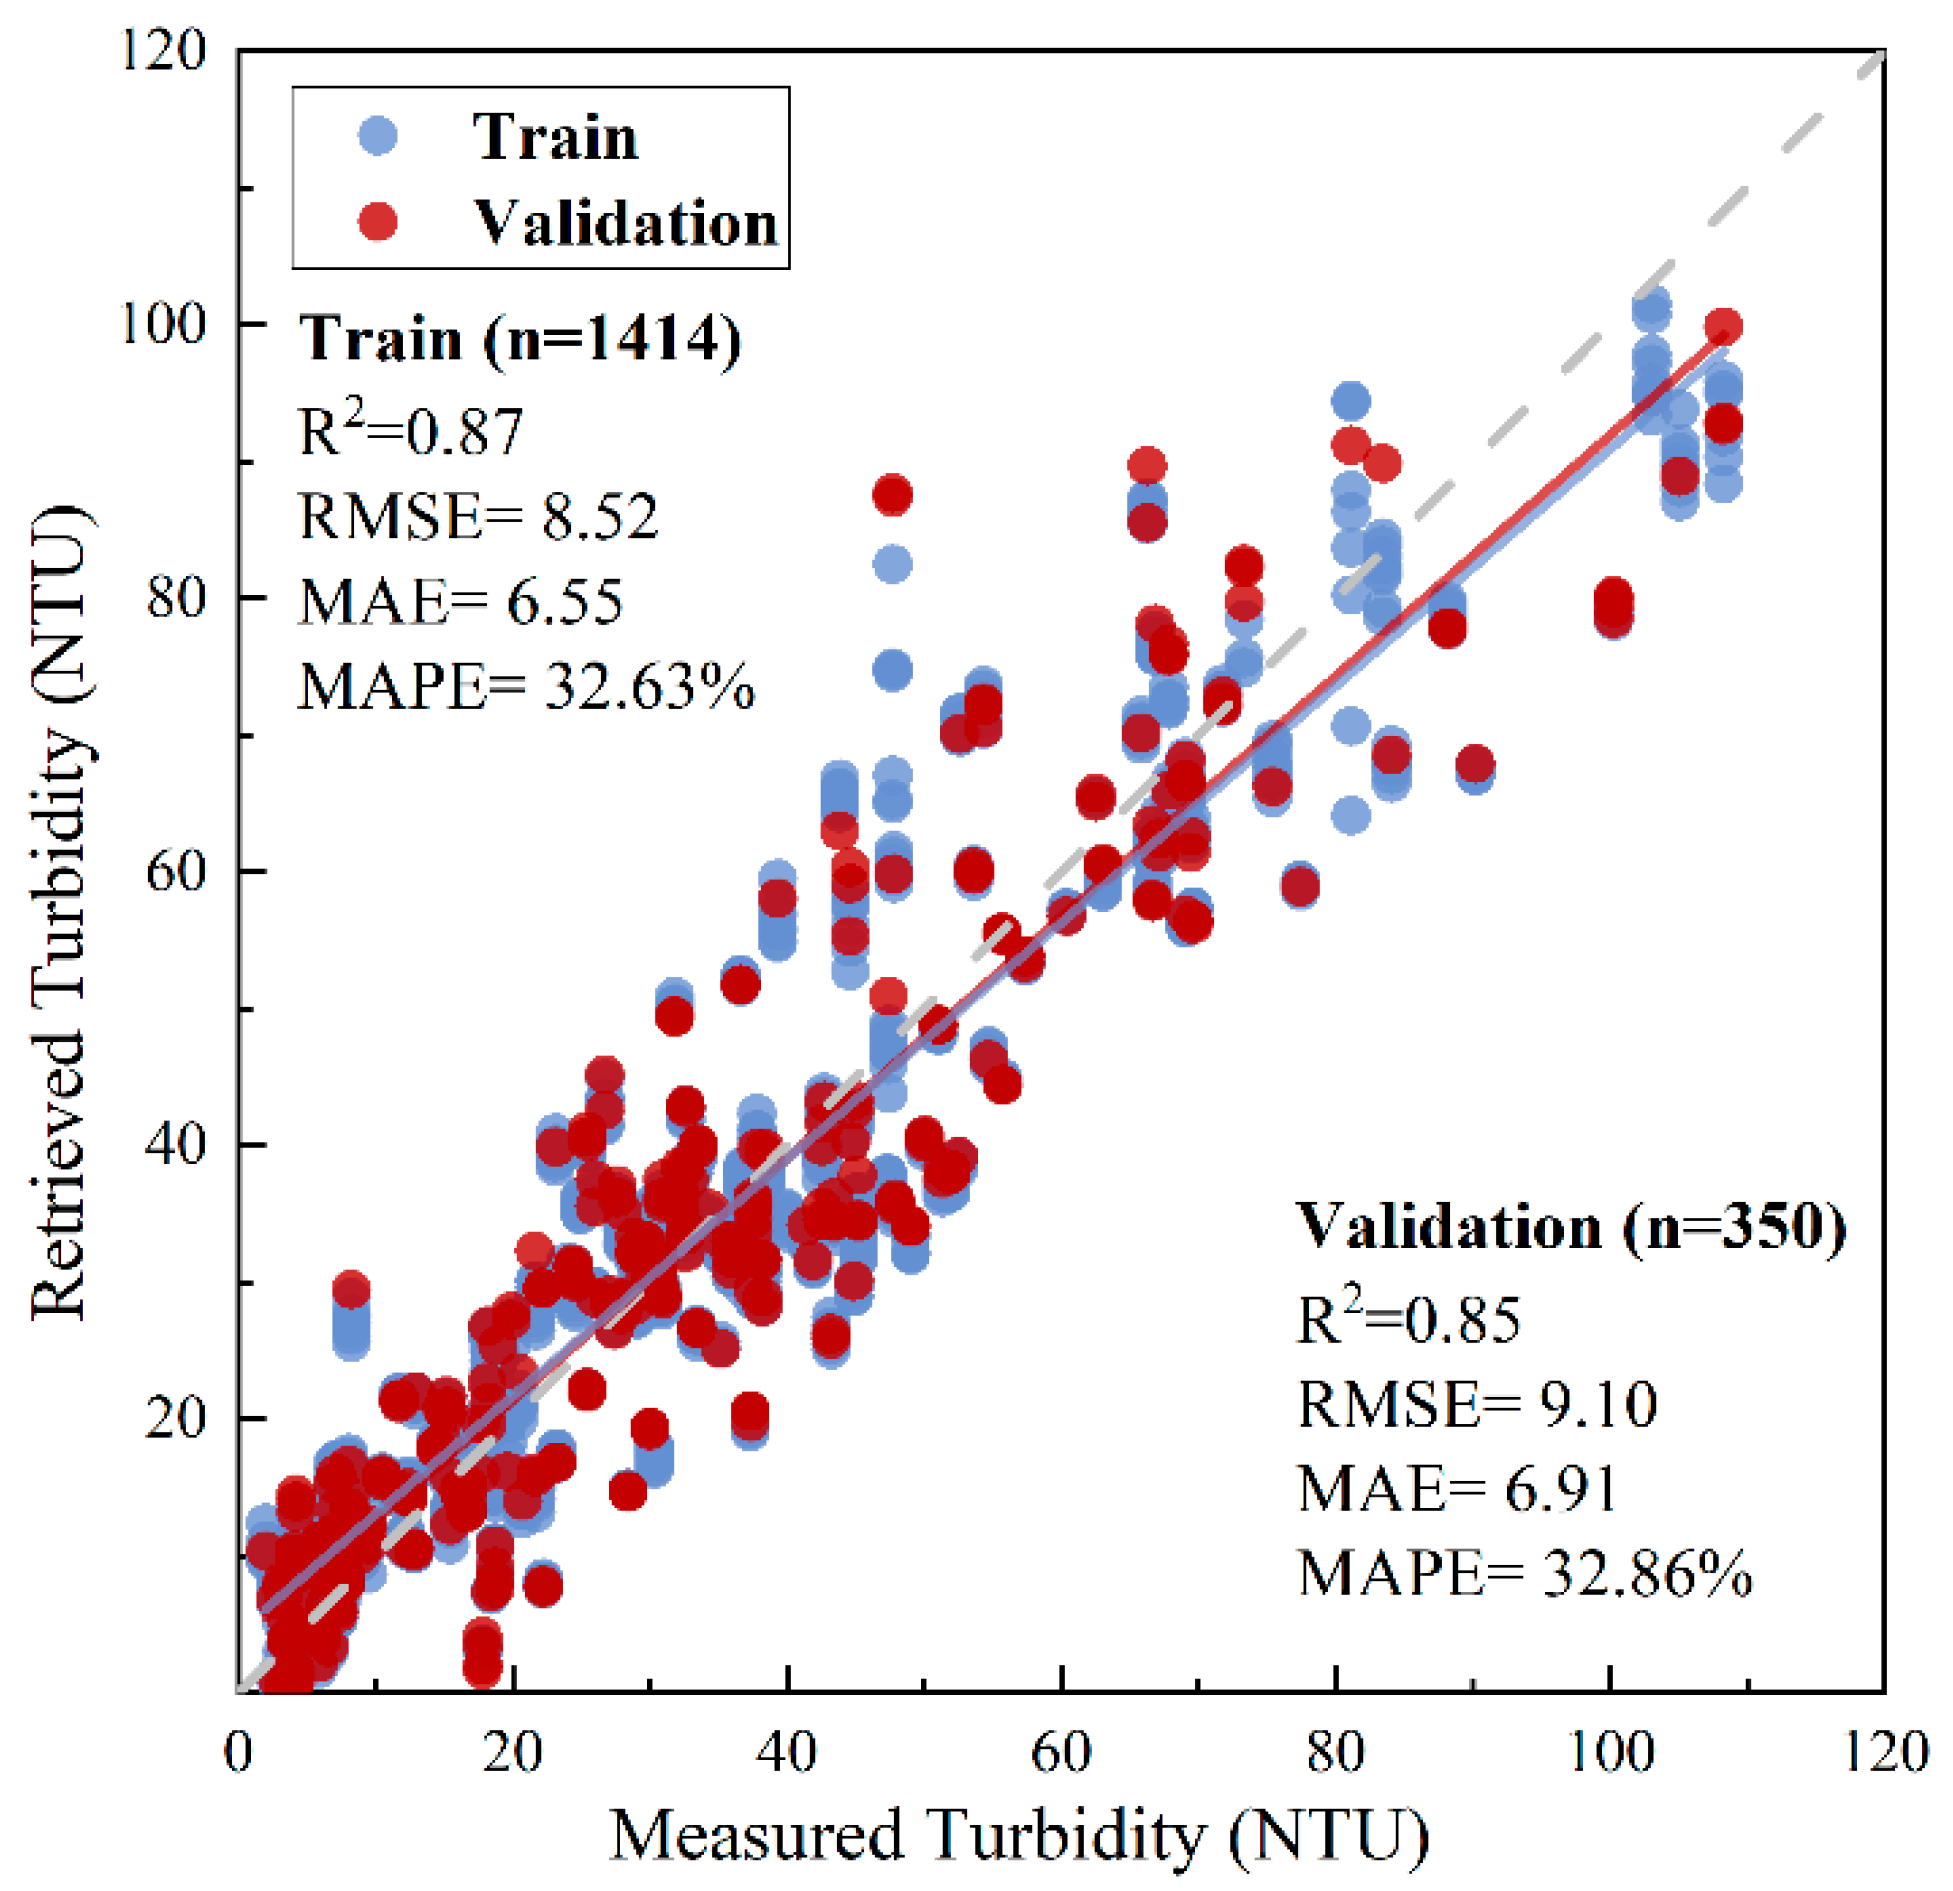
The accuracy of the turbidity retrieval model is expected (Figure 4, R2 = 0.85, RMSE = 9.1, MAE = 6.91, MAPE = 32.86%). Although most of the turbidity in the sample was concentrated between 0 and 60, the validation points are not too scattered in the part with turbidity greater than 60. Overall, the turbidity retrieval results are close to 1:1, which is reliable.
Compared to the TP retrieval model without the inclusion of turbidity (Figure 5A, R2 = 0.62, RMSE = 0.01, MAE = 0.01 and MAPE = 16.38%), the accuracy of the model including turbidity was significantly improved (Figure 5B, R2 = 0.71, RMSE = 0.01, MAE = 0.01 and MAPE = 15.78%). After adding the turbidity parameter, the retrieved TP values are closer to the measured TP values. Importantly, the fitting effect of the model is significantly improved when the TP value is less than 0.04 or greater than 0.1, indicating that the input of turbidity can enhance the stability and robustness of the TP retrieval model, and improve the TP retrieval accuracy.
4.2. Variability of Turbidity and TP Concentration in the MYR
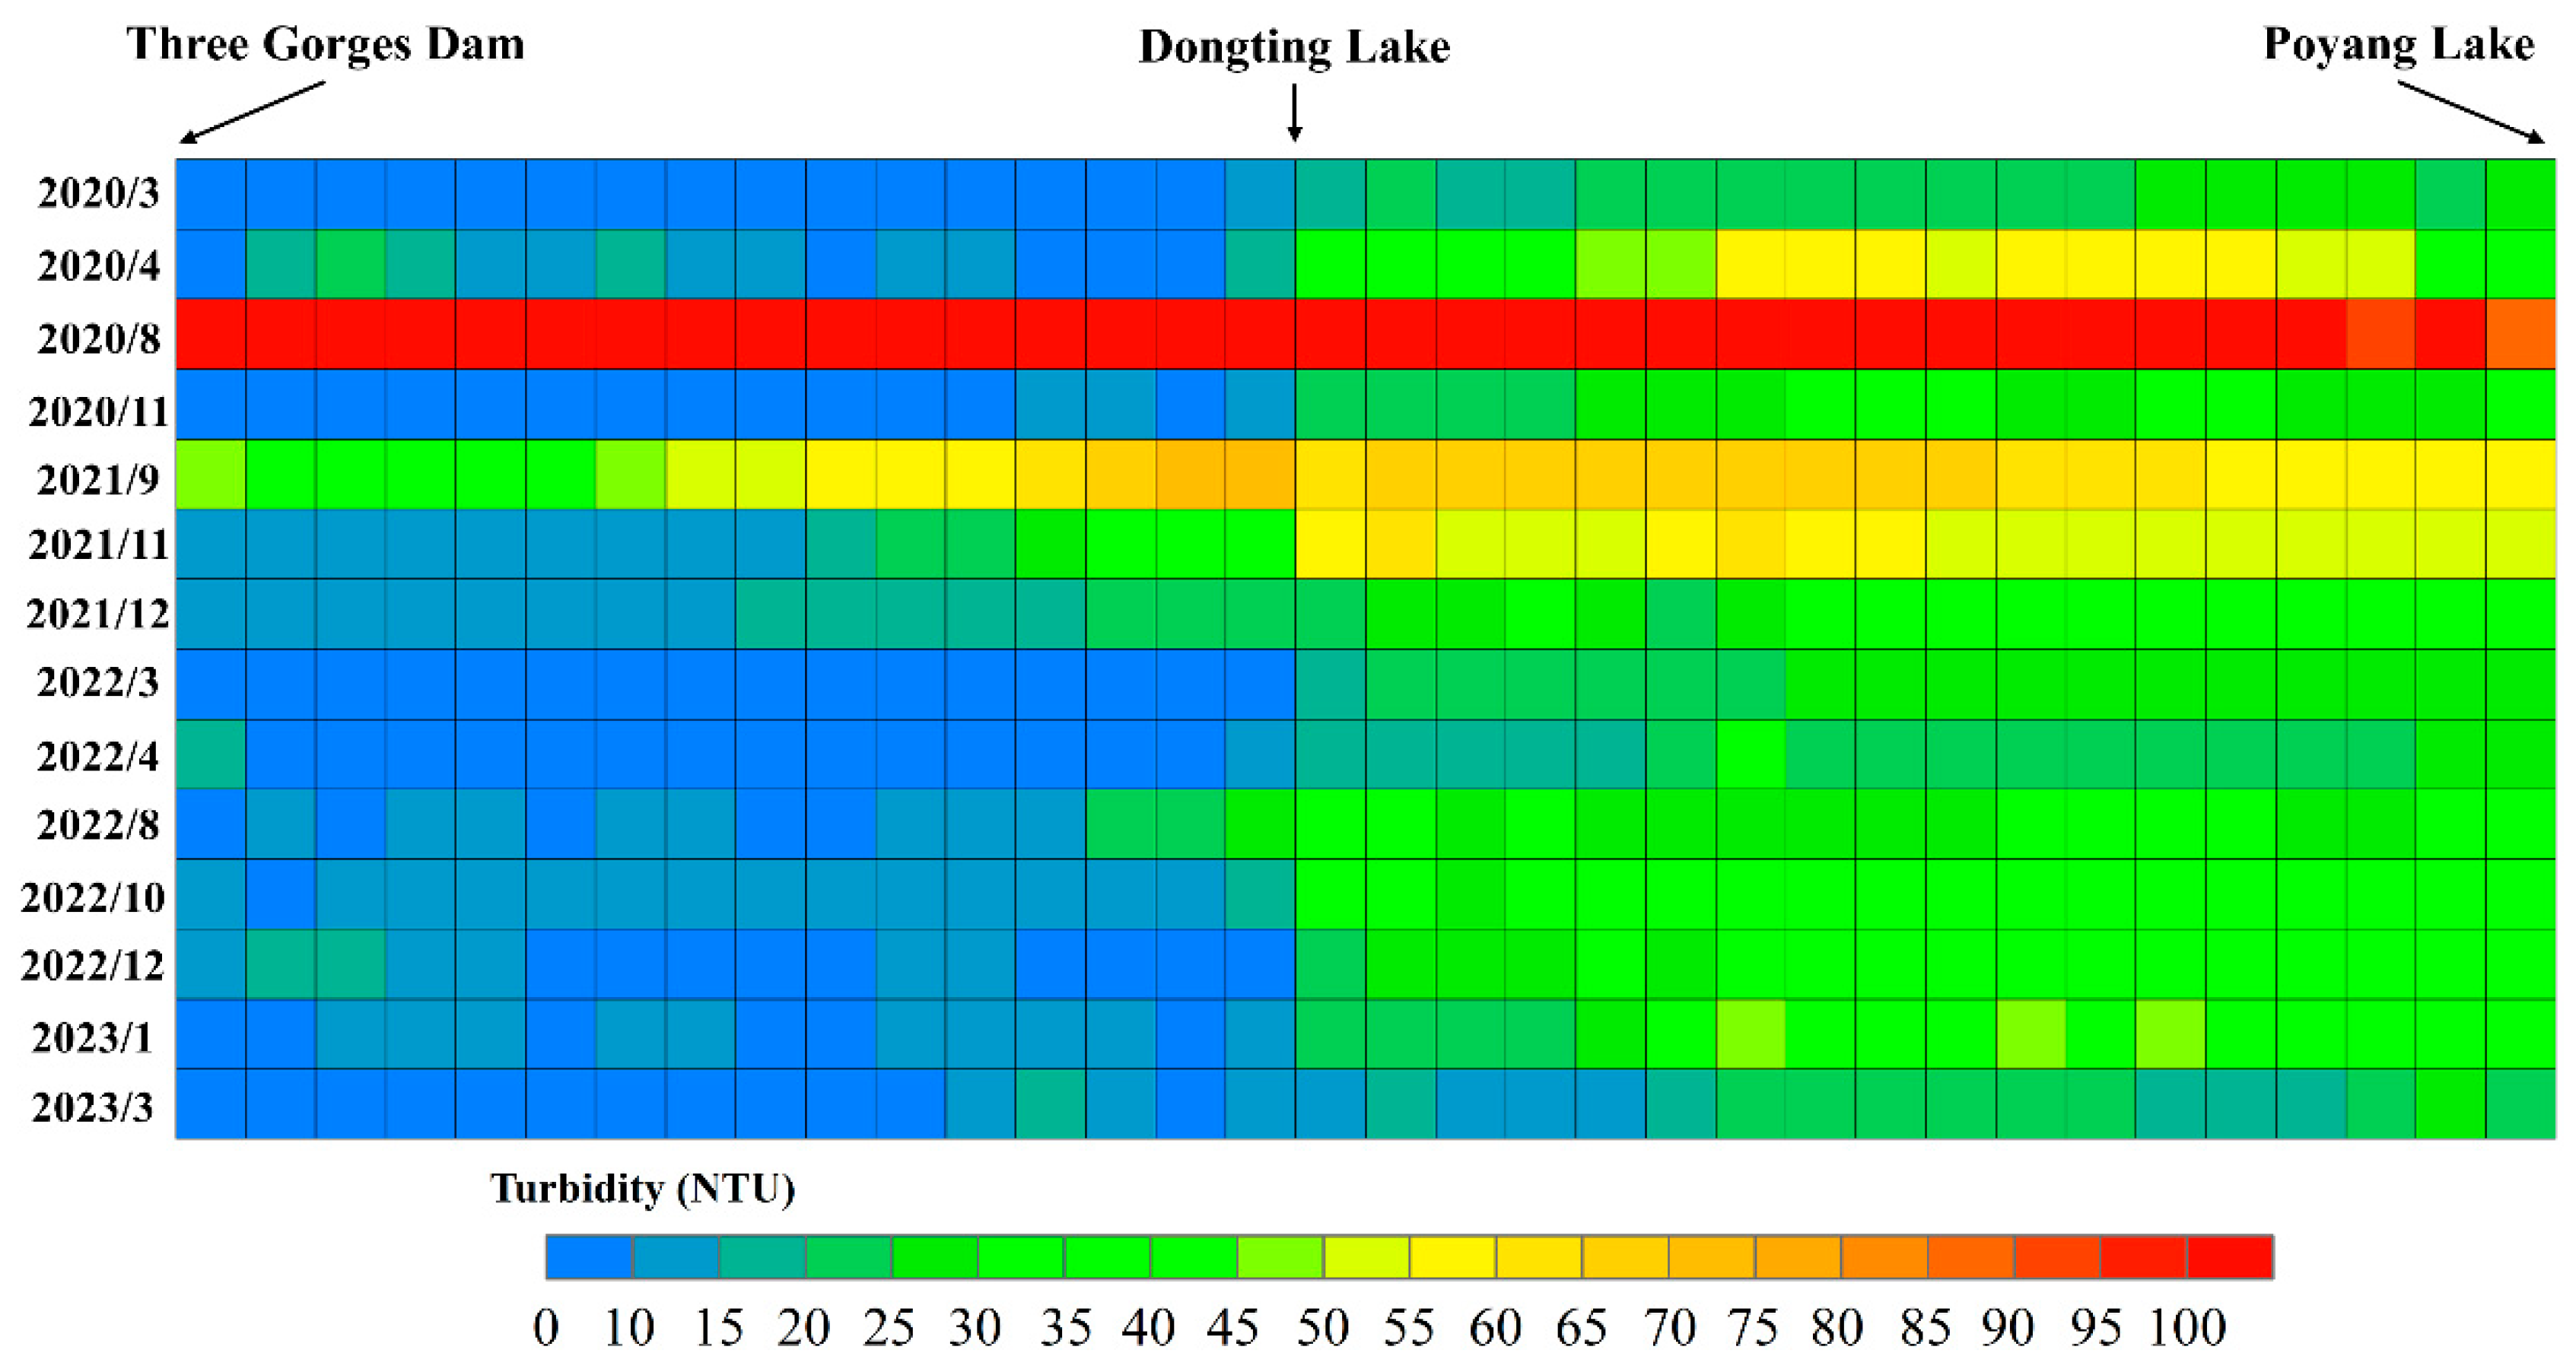
Based on the trained model (Figure 5B), we used the Sentinel-2 images of the MYR as inputs, and obtained the retrieval results for turbidity and TP concentration in the MYR from 2020 to 2023 (Figure 6 and Figure 7). The results showed that the average turbidity in the MYR was 42.8 NTN and the average TP concentration was 0.072 mg/L from 2020 to 2023.
The variability of turbidity in the MYR is significant. In August 2020, turbidity in the MYR increased significantly as a result of flooding [39]. According to the search results (Figure 6), the average value of turbidity in the middle reaches of the Yangtze River was more than 100 NTU. In September 2021, a large amount of suspended sediment entered the MYR under the influence of increased precipitation in the upper reaches of the Yangtze River and the Three Gorges Reservoir flood discharge and storage [40], the turbidity in the MYR increased as well, with a mean value of 59 NTU. Turbidity in other periods was relatively low, with mean values between 10 and 30 NTU. The variation of TP in the MYR is similar to turbidity. In August 2020, the TP concentration in the MYR also increased significantly, with a mean value of 0.114 mg/L, and the mean TP concentration in September 2021 was 0.072 mg/L. Mean TP concentration in other periods ranged from 0.04 to 0.06 mg/L.
We matrixed the results for turbidity and TP concentration (Figure 8 and Figure 9). In terms of temporal distribution, the turbidity and TP concentrations during the flood period (August 2020) were 150 NTU and 0.06 mg/L higher than during the other periods, and were relatively stable during the other periods, with a slightly higher turbidity and TP concentration in the summer and fall than in the winter and spring. In terms of spatial variation, since the Three Gorges Dam can intercept 76% of the sediment transport from the upper Yangtze River basin [41], the turbidity in the lower and middle Yangtze River regions is relatively low. With the continuous flow of the Yangtze River, the input of sediment from the basin, and the riverbed scouring, the turbidity of the Yangtze River will slowly increase from the upper reaches to the lower reaches [42]. According to the Yangtze River Protection Action Plan of the Ministry of Ecology and Environment of the People’s Republic of China, the water quality target of the Yangtze River is Class II (TP < 0.1 mg/L). At present, the TP concentration in most areas of the MYR reaches the standard, but there are still a few areas where the TP concentration does not reach the standard. Our results also indicate that some reaches of the MYR are not meeting Class II water quality standards (TP < 0.1 mg/L) during the summer and fall (Figure 9).
5. Discussions
5.1. The Limitations and Uncertainty of the Model
In this study, the limitations and uncertainties of the TP retrieval model mainly manifest in two ways: the lack of physical mechanisms and choice of intermediate variables.
The remote-sensing TP retrieval models in this study are data-driven and essentially an empirical model, and model performance is highly dependent on the representativeness of the sample and the range of values. Our sample time range is from January 2021 to May 2023, with more samples in the spring and winter than in the summer and fall, which may introduce uncertainty to the results. The range of values of the samples is also an important factor affecting the accuracy of TP retrieval. In our samples, the range of values of measured turbidity is 2–135.93 NTU, and the range of values of TP concentration is 0.01–0.162 mg/L (Table 1). Therefore, if the turbidity/TP concentration in the Yangtze River is higher than this range, our model is not applicable.
In water quality remote sensing, it is not uncommon to use other environmental parameters or other water quality parameters to retrieve the target water quality. The growth of algae in lakes is affected by light, temperature, precipitation and other factors with certain regularity [43,44]. For example, Liu et al. [38] added the environmental parameter K (The K value depends on the average chlorophyll concentration of Wuhan lakes in different months: January–April, K = 1; May, June, December, K = 2; July–November, K = 3) to the input parameters when retrieving the Trophic Level Index of Wuhan lakes, and the accuracy of the model was significantly improved. Because the growth of algae and the concentration of pollutants in lakes are affected by seasonal changes in temperature and water level [45,46,47], Yang et al. [27] added temperature and water level to the TLI retrieval model of Honghu Lake to improve the stability and applicability of the model. In this study, we added turbidity to the TP retrieval model, the stability and accuracy of the model were improved (Figure 5), this model is an empirical algorithm and indirect estimation, which relies on a large amount of measured data and has no strict theoretical basis, so it is only applicable to TP retrieval in the MYR, and is not applicable in other regions.
5.2. The Influence of Dongting Lake on the Water Quality in the MYR
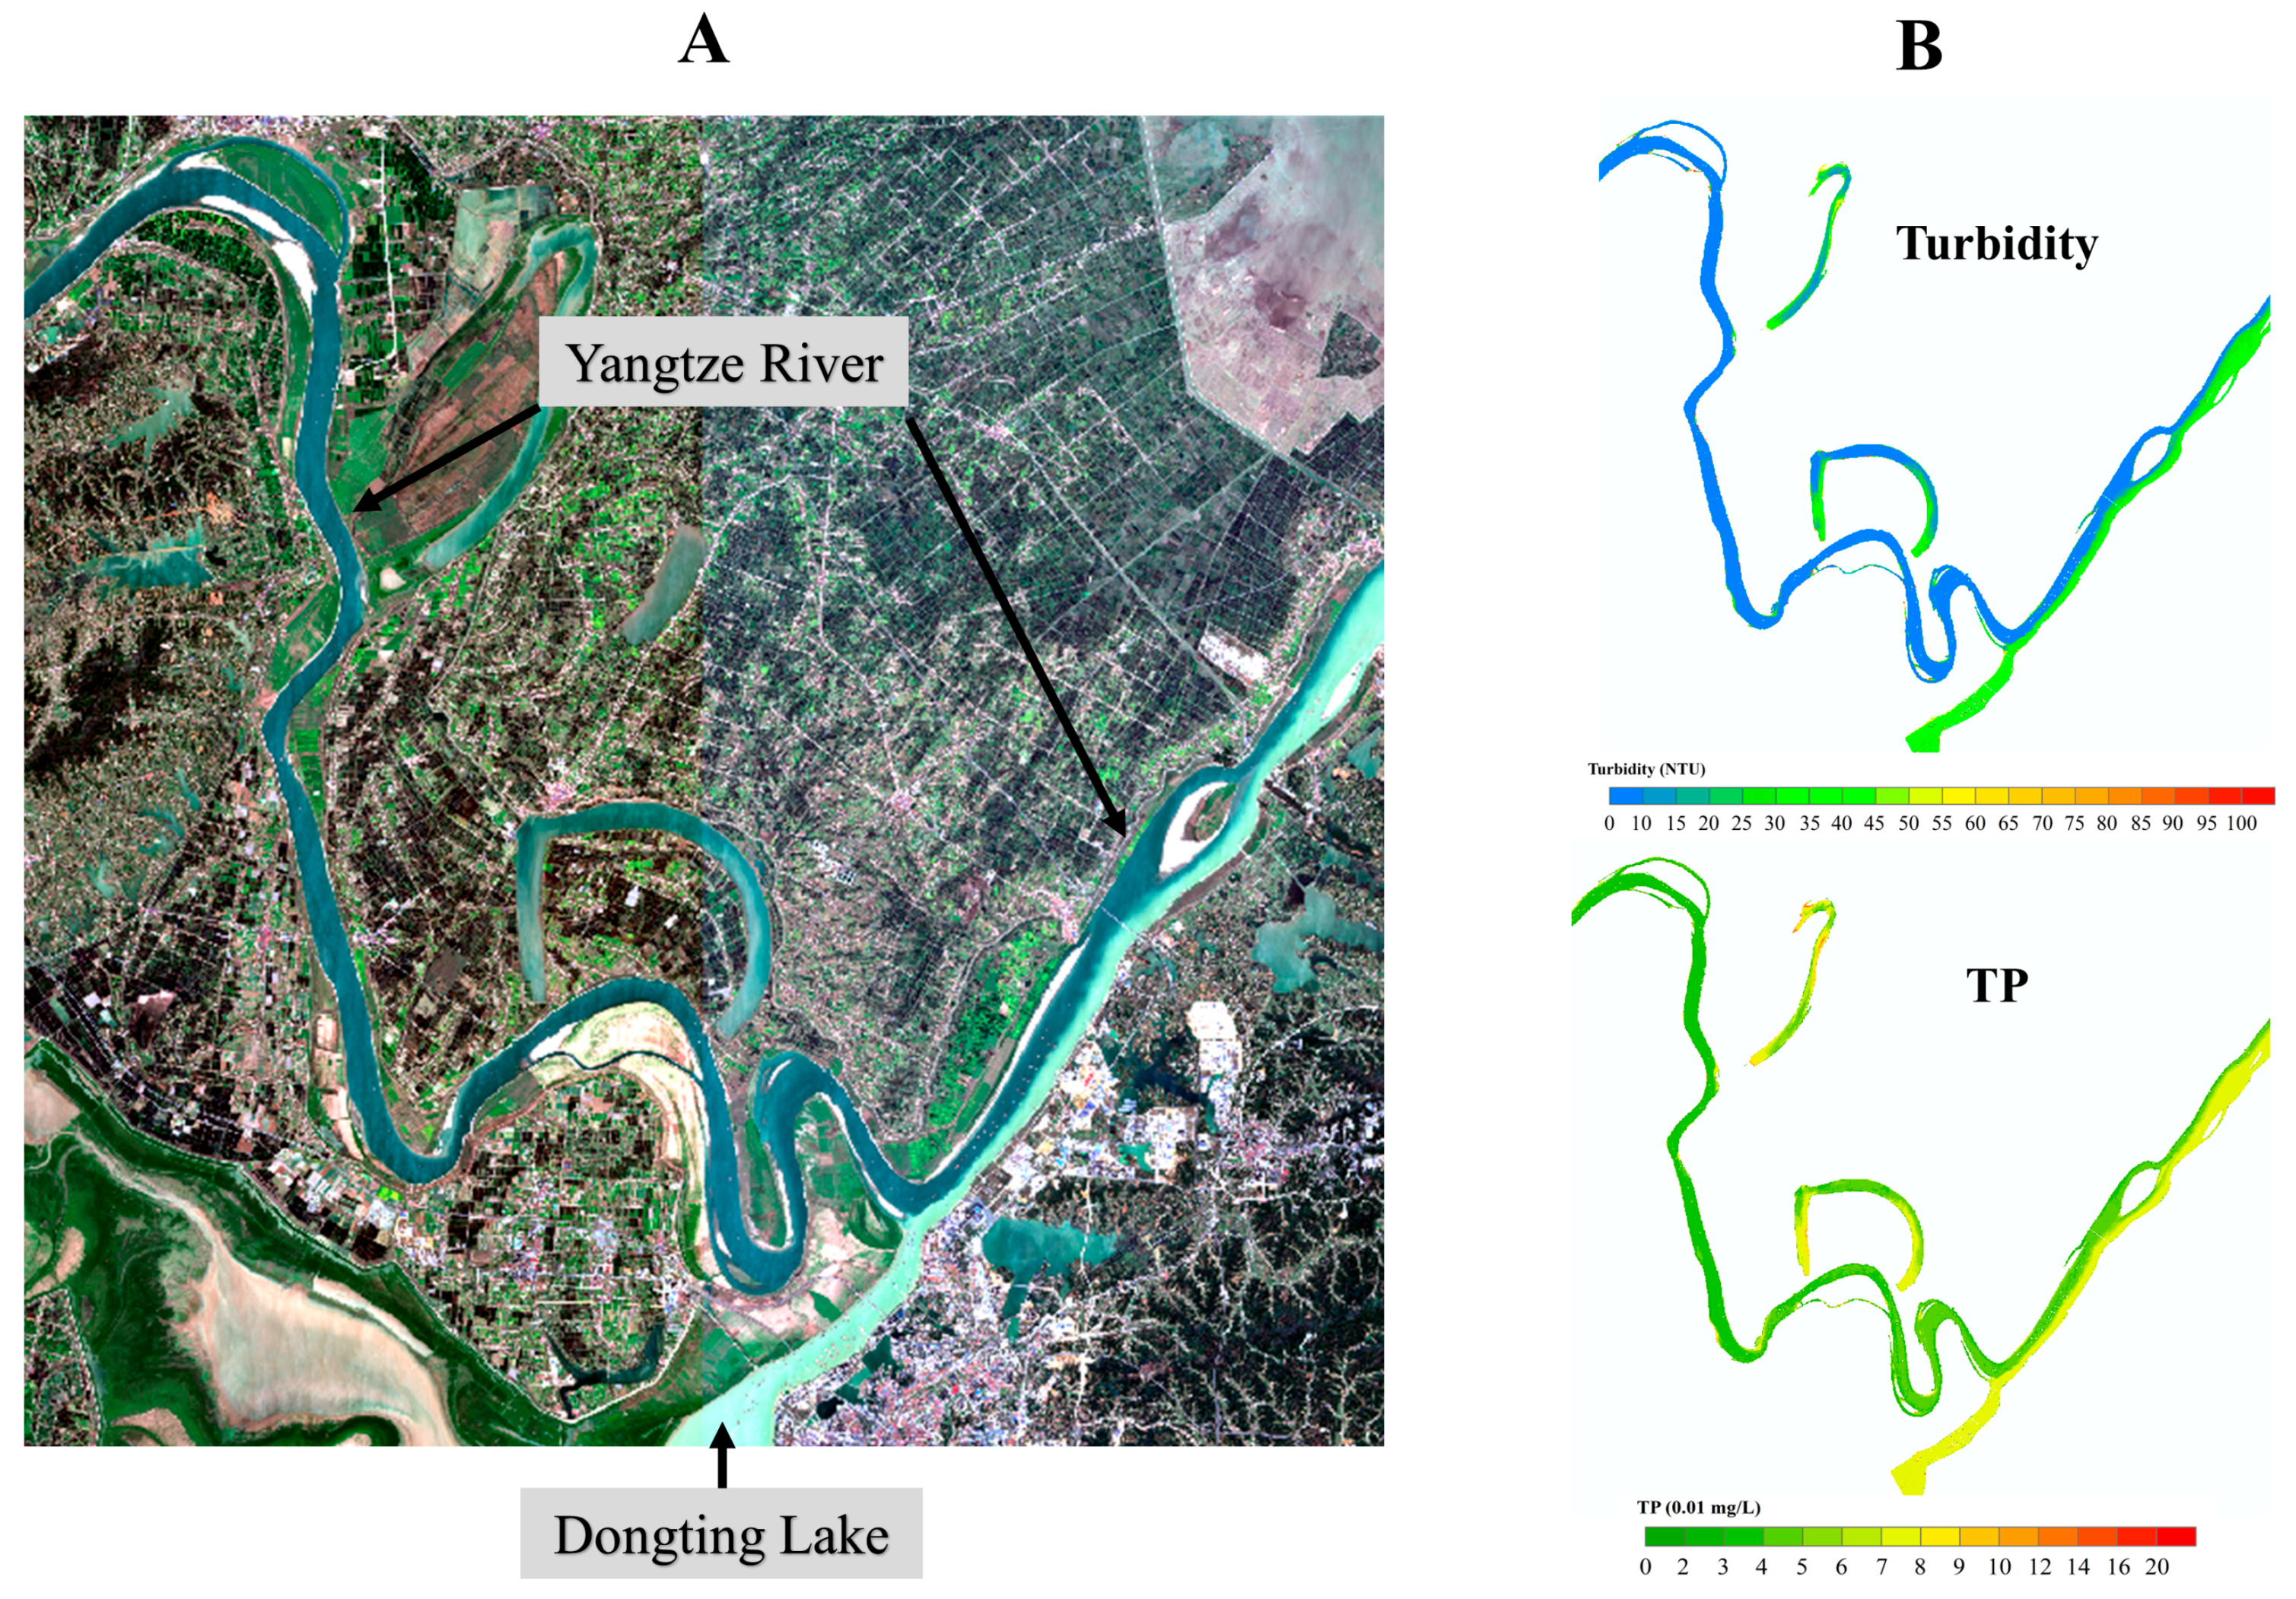
Dongting Lake is the fourth largest lake in China and the only lake connected to Yangtze River in the MYR, covering an area of about 2580 km2, with high suspended sediment content and high turbidity [48]. Over the past few decades, the average TP concentration in Dongting Lake has increased from about 0.05 mg/L in 1986 to about 0.1 mg/L in 2015, showing a significant increasing trend, and TP has gradually become the main influencing factor on the water quality change in Dongting Lake [49]. As the TP concentration in Dongting Lake increases, more and more phosphorus will enter the Yangtze River, bringing challenges to the improvement of the Yangtze River’s water quality. In this study, the average turbidity and average TP concentration in the MYR are 28 NTU and 0.047 mg/L in the upper reaches of Dongting Lake, and 43 NTU and 0.072 mg/L in the lower reaches of Dongting Lake from 2020 to 2023 (Figure 8 and Figure 9), which indicates that the Dongting Lake brought different degrees of turbidity increase and TP concentration to the Yangtze River.
Figure 10A,B represent the RGB images and turbidity/TP concentration retrieval results at the Yangtze River and Dongting Lake confluence in August 2022, respectively. Dongting Lake affects the water color and quality of the Yangtze River due to its higher turbidity and TP concentration compared to the Yangtze River. When Dongting Lake water merges with the Yangtze River, the water from the two sources does not completely mix in a short period of time, resulting in the presence of two distinct colors in the Yangtze River. To better understand the impact of Dongting Lake on the water quality of the Yangtze River, we statistically analyzed the results of the remote-sensing retrieval of turbidity and TP concentration. As shown in Figure 11, from 2020 to 2023, before the Yangtze River passes Dongting Lake, the turbidity is concentrated at 8–12 NTU and the TP concentration is concentrated at 0.03–0.05 mg/L; after the Yangtze River passes through Dongting Lake, the turbidity is concentrated at 24–36 NTU and the TP concentration is concentrated at 0.06–0.08 mg/L (Figure 11). The turbidity and TP concentration of the Yangtze River increase significantly after passing through Dongting Lake (p < 0.01, Figure 11).
The relationship between the Yangtze River and Dongting Lake is complex. On the one hand, the hydrological situation of the Yangtze River constantly changes the pattern of Dongting Lake [50,51]. On the other hand, the increase of industrial and agricultural pollution, the release of endogenous pollution and the reduction of water environment capacity in the Dongting Lake basin, and the significant increase of nutrients such as TP and TN in the lake will also challenge the water quality of the Yangtze River [49]. Further study is needed to determine the specific impact of Dongting Lake on the water quality of the Yangtze River.
6. Conclusions
Phosphorus pollution has become the primary factor limiting the improvement of water quality in the Yangtze River. In this study, an indirect retrieval algorithm for TP concentration is proposed. We established a retrieval model based on the relationship between the Sentinel-2 MSI band combination and TP, and added turbidity as an input parameter in the retrieval TP concentration model. Compared with the TP concentration retrieval model without turbidity (R2 = 0.62, MAPE = 16.38%), the addition of turbidity can significantly improve the accuracy of the TP concentration retrieval model (R2 = 0.71, MAPE = 15.78%). Our results show that in 2020–2023, the average turbidity value in the MYR is 42.8 NTN, and the average TP concentration is 0.072 mg/L. In terms of seasonal variation, the turbidity and TP concentrations in the MYR were higher in summer and fall than in winter and spring. In terms of spatial variation, the turbidity and TP concentration of the Yangtze River increased significantly after passing through Dongting Lake. Dongting Lake, dam construction and climate change are all important causes of water quality changes in the Yangtze River, which need to be further studied and analyzed.
Author Contributions
Conceptualization, F.Y. and B.H.; methodology, F.Y.; software, F.Y.; validation, Q.F., Y.Z. and B.H.; formal analysis, F.Y.; investigation, F.Y.; resources, B.H.; data curation, W.L.; writing—original draft preparation, F.Y.; writing—review and editing, X.Z.; visualization, Q.F.; supervision, B.H.; project administration, B.H.; funding acquisition, Q.F., Y.Z. and B.H. All authors have read and agreed to the published version of the manuscript.
Funding
This work was supported by the National Natural Science Foundation of China (U21A2025); Beautiful China Ecological Civilization Construction Science and Technology Project (XDA23040201); the Water Resources Department of Hubei Province (HBSLKY202127); Knowledge Innovation Program of Wuhan, Basic Research (2022010801010135); Innovation Academy for Precision Measurement Science and Technology, CAS (S21S7102); Hubei Provincial Natural Science Foundation of China (2022CFB857); Knowledge Innovation Program of Wuhan-Shuguang Project (2023020201020284).
Data Availability Statement
Data are contained within the article.
Acknowledgments
Thanks to Ministry of Ecology and Environment of the People’s Republic of China for providing us with water quality data. In addition, Thanks to the equipment and data processing software provided by Key Laboratory for Environment and Disaster Monitoring and Evaluation of Hubei.
Conflicts of Interest
The authors declare that they have no known competing financial interests or personal relationships that could have appeared to influence the work reported in this paper.
References
- Maavara, T.; Parsons, C.T.; Ridenour, C.; Stojanovic, S.; Dürr, H.H.; Powley, H.R.; Van Cappellen, P. Global phosphorus retention by river damming. Proc. Natl. Acad. Sci. USA 2015, 112, 15603–15608. [Google Scholar] [CrossRef] [PubMed]
- Withers, P.; Jarvie, H. Delivery and cycling of phosphorus in rivers: A review. Sci. Total Environ. 2008, 400, 379–395. [Google Scholar] [CrossRef] [PubMed]
- Ho, J.C.; Michalak, A.M.; Pahlevan, N. Widespread global increase in intense lake phytoplankton blooms since the 1980s. Nature 2019, 574, 667–670. [Google Scholar] [CrossRef] [PubMed]
- Xiong, J.F.; Lin, C.; Cao, Z.G.; Hu, M.Q.; Xue, K.; Chen, X.; Ma, R.H. Development of remote sensing algorithm for total phosphorus concentration in eutrophic lakes: Conventional or machine learning? Water Res. 2022, 215, 11. [Google Scholar] [CrossRef] [PubMed]
- Du, C.; Wang, Q.; Li, Y.; Lyu, H.; Zhu, L.; Zheng, Z.; Wen, S.; Liu, G.; Guo, Y. Estimation of total phosphorus concentration using a water classification method in inland water. Int. J. Appl. Earth Obs. Geoinform. 2018, 71, 29–42. [Google Scholar] [CrossRef]
- Powers, S.M.; Bruulsema, T.W.; Burt, T.P.; Chan, N.I.; Elser, J.J.; Haygarth, P.M.; Howden, N.J.K.; Jarvie, H.P.; Lyu, Y.; Peterson, H.M.; et al. Long-term accumulation and transport of anthropogenic phosphorus in three river basins. Nat. Geosci. 2016, 9, 353–356. [Google Scholar] [CrossRef]
- Ding, S.; Chen, P.; Liu, S.; Zhang, G.; Zhang, J.; Dan, S.F. Nutrient dynamics in the Changjiang and retention effect in the Three Gorges Reservoir. J. Hydrol. 2019, 574, 96–109. [Google Scholar] [CrossRef]
- Hu, M.; Liu, Y.; Zhang, Y.; Shen, H.; Yao, M.; Dahlgren, R.A.; Chen, D. Long-term (1980–2015) changes in net anthropogenic phosphorus inputs and riverine phosphorus export in the Yangtze River basin. Water Res. 2020, 177, 115779. [Google Scholar] [CrossRef] [PubMed]
- Records, R.M.; Wohl, E.; Arabi, M. Phosphorus in the river corridor. Earth-Sci. Rev. 2016, 158, 65–88. [Google Scholar] [CrossRef]
- Yang, Y.; Gao, B.; Hao, H.; Zhou, H.D.; Lu, J. Nitrogen and phosphorus in sediments in China: A national-scale assessment and review. Sci. Total Environ. 2017, 576, 840–849. [Google Scholar] [CrossRef] [PubMed]
- Cao, Z.; Ma, R.; Melack, J.M.; Duan, H.; Liu, M.; Kutser, T.; Xue, K.; Shen, M.; Qi, T.; Yuan, H. Landsat observations of chlorophyll-a variations in Lake Taihu from 1984 to 2019. Int. J. Appl. Earth Obs. Geoinform. 2022, 106, 102642. [Google Scholar] [CrossRef]
- Volpe, V.; Silvestri, S.; Marani, M. Remote sensing retrieval of suspended sediment concentration in shallow waters. Remote Sens. Environ. 2011, 115, 44–54. [Google Scholar] [CrossRef]
- Dogliotti, A.; Ruddick, K.G.; Nechad, B.; Doxaran, D.; Knaeps, E. A single algorithm to retrieve turbidity from remotely-sensed data in all coastal and estuarine waters. Remote Sens. Environ. 2015, 156, 157–168. [Google Scholar] [CrossRef]
- Cao, Z.; Duan, H.; Feng, L.; Ma, R.; Xue, K. Climate- and human-induced changes in suspended particulate matter over Lake Hongze on short and long timescales. Remote Sens. Environ. 2017, 192, 98–113. [Google Scholar] [CrossRef]
- Gao, Y.; Gao, J.; Yin, H.; Liu, C.; Xia, T.; Wang, J.; Huang, Q. Remote sensing estimation of the total phosphorus concentration in a large lake using band combinations and regional multivariate statistical modeling techniques. J. Environ. Manag. 2015, 151, 33–43. [Google Scholar] [CrossRef] [PubMed]
- Wu, C.; Wu, J.; Qi, J.; Zhang, L.; Huang, H.; Lou, L.; Chen, Y. Empirical estimation of total phosphorus concentration in the mainstream of the Qiantang River in China using Landsat TM data. Int. J. Remote Sens. 2010, 31, 2309–2324. [Google Scholar] [CrossRef]
- Carlson, R.E. A trophic state index for lakes. Limnol. Oceanogr. 1977, 22, 361–369. [Google Scholar] [CrossRef]
- Huang, C.; Guo, Y.; Yang, H.; Li, Y.; Zou, J.; Zhang, M.; Lyu, H.; Zhu, A.; Huang, T. Using Remote Sensing to Track Variation in Phosphorus and Its Interaction with Chlorophyll-a and Suspended Sediment. IEEE J. Sel. Top. Appl. Earth Obs. Remote Sens. 2015, 8, 4171–4180. [Google Scholar] [CrossRef]
- Li, Y.; Zhang, Y.L.; Shi, K.; Zhu, G.W.; Zhou, Y.Q.; Zhang, Y.B.; Guo, Y.L. Monitoring spatiotemporal variations in nutrients in a large drinking water reservoir and their relationships with hydrological and meteorological conditions based on Landsat 8 imagery. Sci. Total Environ. 2017, 599, 1705–1717. [Google Scholar] [CrossRef] [PubMed]
- Wang, S.; Shen, M.; Liu, W.; Ma, Y.; Shi, H.; Zhang, J.; Liu, D. Developing remote sensing methods for monitoring water quality of alpine rivers on the Tibetan Plateau. GISci. Remote Sens. 2022, 59, 1384–1405. [Google Scholar] [CrossRef]
- Zhao, J.R.; Jin, S.G.; Zhang, Y.Y. Dynamic Water Quality Changes in the Main Stream of the Yangtze River from Multi-Source Remote Sensing Data. Remote Sens. 2023, 15, 2526. [Google Scholar] [CrossRef]
- Dai, Z.; Du, J.; Zhang, X.; Su, N.; Li, J. Variation of Riverine Material Loads and Environmental Consequences on the Changjiang (Yangtze) Estuary in Recent Decades (1955–2008). Environ. Sci. Technol. 2010, 45, 223–227. [Google Scholar] [CrossRef] [PubMed]
- Deng, C.; Liu, L.; Li, H.; Peng, D.; Wu, Y.; Xia, H.; Zhang, Z.; Zhu, Q. A data-driven framework for spatiotemporal characteristics, complexity dynamics, and environmental risk evaluation of river water quality. Sci. Total Environ. 2021, 785, 147134. [Google Scholar] [CrossRef] [PubMed]
- Liu, L.S.; Huang, G.X.; Wang, F.; Chu, Z.S.; Li, H.S. Main Problems, Situation and Countermeasures of Water Eco-Environment Security in the Yangtze River Basin. Res. Environ. Sci. 2020, 33, 1081–1090. (In Chinese) [Google Scholar]
- Yin, W.; Wang, C.; Zhang, H. Consideration on total phosphorus problem in Yangtze River Basin. Yangtze River 2022, 53, 44–52. (In Chinese) [Google Scholar]
- Jia, H.; Chen, F.; Pan, D.; Du, E.; Wang, L.; Wang, N.; Yang, A. Flood risk management in the Yangtze River basin—Comparison of 1998 and 2020 events. Int. J. Disaster Risk Reduct. 2022, 68, 102724. [Google Scholar] [CrossRef]
- Yang, F.; He, B.; Zhou, Y.; Li, W.; Zhang, X.; Feng, Q. Trophic status observations for Honghu Lake in China from 2000 to 2021 using Landsat Satellites. Ecol. Indic. 2023, 146, 109898. [Google Scholar] [CrossRef]
- Main-Knorn, M.; Pflug, B.; Louis, J.; Debaecker, V.; Muller-Wilm, U.; Gascon, F. Sen2Cor for Sentinel-2. In Proceedings of the Conference on Image and Signal Processing for Remote Sensing XXIII, Warsaw, Poland, 11–14 September 2017. [Google Scholar]
- McFeeters, S.K. The use of the Normalized Difference Water Index (NDWI) in the delineation of open water features. Int. J. Remote Sens. 1996, 17, 1425–1432. [Google Scholar] [CrossRef]
- Zhou, Y.; He, B.; Xiao, F.; Feng, Q.; Kou, J.; Liu, H. Retrieving the Lake Trophic Level Index with Landsat-8 Image by Atmospheric Parameter and RBF: A Case Study of Lakes in Wuhan, China. Remote Sens. 2019, 11, 457. [Google Scholar] [CrossRef]
- Ma, R.; Duan, H.; Tang, J.; Chen, Z.; Al, E. Remote Sensing on Water Environment of Lakes; Sciences Press: Beijing, China, 2010. (In Chinese) [Google Scholar]
- Wang, C.; Li, W.; Chen, S.; Li, D.; Wang, D.; Liu, J. The spatial and temporal variation of total suspended solid concentration in Pearl River Estuary during 1987–2015 based on remote sensing. Sci. Total Environ. 2018, 618, 1125–1138. [Google Scholar] [CrossRef] [PubMed]
- Tham, T.T.; Hung, T.L.; Thuy, T.T.; Mai, V.T.; Trinh, L.T.; Hai, C.V.; Minh, T.B. Assessment of some water quality parameters in the Red River downstream, Vietnam by combining field monitoring and remote sensing method. Environ. Sci. Pollut. Res. 2022, 29, 41992–42004. [Google Scholar] [CrossRef] [PubMed]
- Umar, M.; Rhoads, B.L.; Greenberg, J.A. Use of multispectral satellite remote sensing to assess mixing of suspended sediment downstream of large river confluences. J. Hydrol. 2018, 556, 325–338. [Google Scholar] [CrossRef]
- Fang, C.; Song, C.; Wang, X.; Wang, Q.; Tao, H.; Wang, X.; Ma, Y.; Song, K. A novel total phosphorus concentration retrieval method based on two-line classification in lakes and reservoirs across China. Sci. Total Environ. 2023, 906, 167522. [Google Scholar] [CrossRef] [PubMed]
- Guo, H.; Tian, S.; Huang, J.J.; Zhu, X.; Wang, B.; Zhang, Z. Performance of deep learning in mapping water quality of Lake Simcoe with long-term Landsat archive. ISPRS J. Photogramm. Remote Sens. 2022, 183, 451–469. [Google Scholar] [CrossRef]
- Song, K.; Li, L.; Li, S.; Tedesco, L.; Hall, B.; Li, L. Hyperspectral Remote Sensing of Total Phosphorus (TP) in Three Central Indiana Water Supply Reservoirs. Water Air Soil Pollut. 2012, 223, 1481–1502. [Google Scholar] [CrossRef]
- Liu, H.; He, B.; Zhou, Y.; Yang, X.; Zhang, X.; Xiao, F.; Feng, Q.; Liang, S.; Zhou, X.; Fu, C. Eutrophication monitoring of lakes in Wuhan based on Sentinel-2 data. GISci. Remote Sens. 2021, 58, 776–798. [Google Scholar] [CrossRef]
- Wang, L.; Peng, Z.; Ma, X.; Zheng, Y.; Chen, C. Multiscale gravity measurements to characterize 2020 flood events and their spatio-temporal evolution in Yangtze river of China. J. Hydrol. 2021, 603, 127176. [Google Scholar] [CrossRef]
- Ma, J.H. Work and achievements of flood prevention in the Yangtze River Basin in 2021. China Water Resour. 2022, 5, 12–15. (In Chinese) [Google Scholar]
- Yang, Y.; Zheng, J.; Zhu, L.; Zhang, H.; Wang, J. Influence of the Three Gorges Dam on the transport and sorting of coarse and fine sediments downstream of the dam. J. Hydrol. 2022, 615, 128654. [Google Scholar] [CrossRef]
- Zhang, Y.N.; Guo, L.C.; Yu, H.S.; He, Q. Changes in suspended sediment grain size along the mainstream of the Yangtze River under the influences of cascade dams. J. Sediment Res. 2022, 47, 51–58. (In Chinese) [Google Scholar]
- Yang, W.; Deng, G.D.; Zhang, S.; Xie, P.; Guo, L.G.; Wang, S.R. Seasonal dynamic and spatial distribution of chlorophyll-a concentration in Lake Erhai. J. Lake Sci. 2012, 24, 858–864. (In Chinese) [Google Scholar]
- Zhang, F.; Li, J.; Shen, Q.; Zhang, B.; Tian, L.; Ye, H.; Wang, S.; Lu, Z. A soft-classification-based chlorophyll-a estimation method using MERIS data in the highly turbid and eutrophic Taihu Lake. Int. J. Appl. Earth Obs. Geoinform. 2018, 74, 138–149. [Google Scholar] [CrossRef]
- Béjaoui, B.; Armi, Z.; Ottaviani, E.; Barelli, E.; Gargouri-Ellouz, E.; Chérif, R.; Turki, S.; Solidoro, C.; Aleya, L. Random Forest model and TRIX used in combination to assess and diagnose the trophic status of Bizerte Lagoon, southern Mediterranean. Ecol. Indic. 2016, 71, 293–301. [Google Scholar] [CrossRef]
- Chen, Q.; Huang, M.; Tang, X. Eutrophication assessment of seasonal urban lakes in China Yangtze River Basin using Landsat 8-derived Forel-Ule index: A six-year (2013–2018) observation. Sci. Total Environ. 2020, 745, 135392. [Google Scholar] [CrossRef] [PubMed]
- Ji, B.; Liu, C.; Liang, J.; Wang, J. Seasonal Succession of Bacterial Communities in Three Eutrophic Freshwater Lakes. Int. J. Environ. Res. Public Health 2021, 18, 6950. [Google Scholar] [CrossRef] [PubMed]
- Tian, Z.B.; Zheng, B.H.; Wang, L.J.; Li, H.; Wang, X. Effects of river-lake interactions in water and sediment on phosphorus in Dongting Lake, China. Environ. Sci. Pollut. Res. 2017, 24, 23250–23260. [Google Scholar] [CrossRef] [PubMed]
- Xiong, J.; Yu, F.Q.; Tian, Q.; Huang, D.Z.; Li, L.Q. The evolution of water quality and nutrient condition in Lake Dongting in recent 30 years. J. Lake Sci. 2016, 28, 1217–1225. (In Chinese) [Google Scholar]
- Tian, Z.; Wang, L.; Li, Y.; Zheng, B.; Chu, Z. Changes of phosphorus delivery from Yangtze River to Dongting Lake under new water and sediment conditions. J. Clean. Prod. 2021, 316, 128248. [Google Scholar] [CrossRef]
- Yu, Y.; Mei, X.; Dai, Z.; Gao, J.; Li, J.; Wang, J.; Lou, Y. Hydromorphological processes of Dongting Lake in China between 1951 and 2014. J. Hydrol. 2018, 562, 254–266. [Google Scholar] [CrossRef]
Figure 1.
Location of the study area and sampling sites.
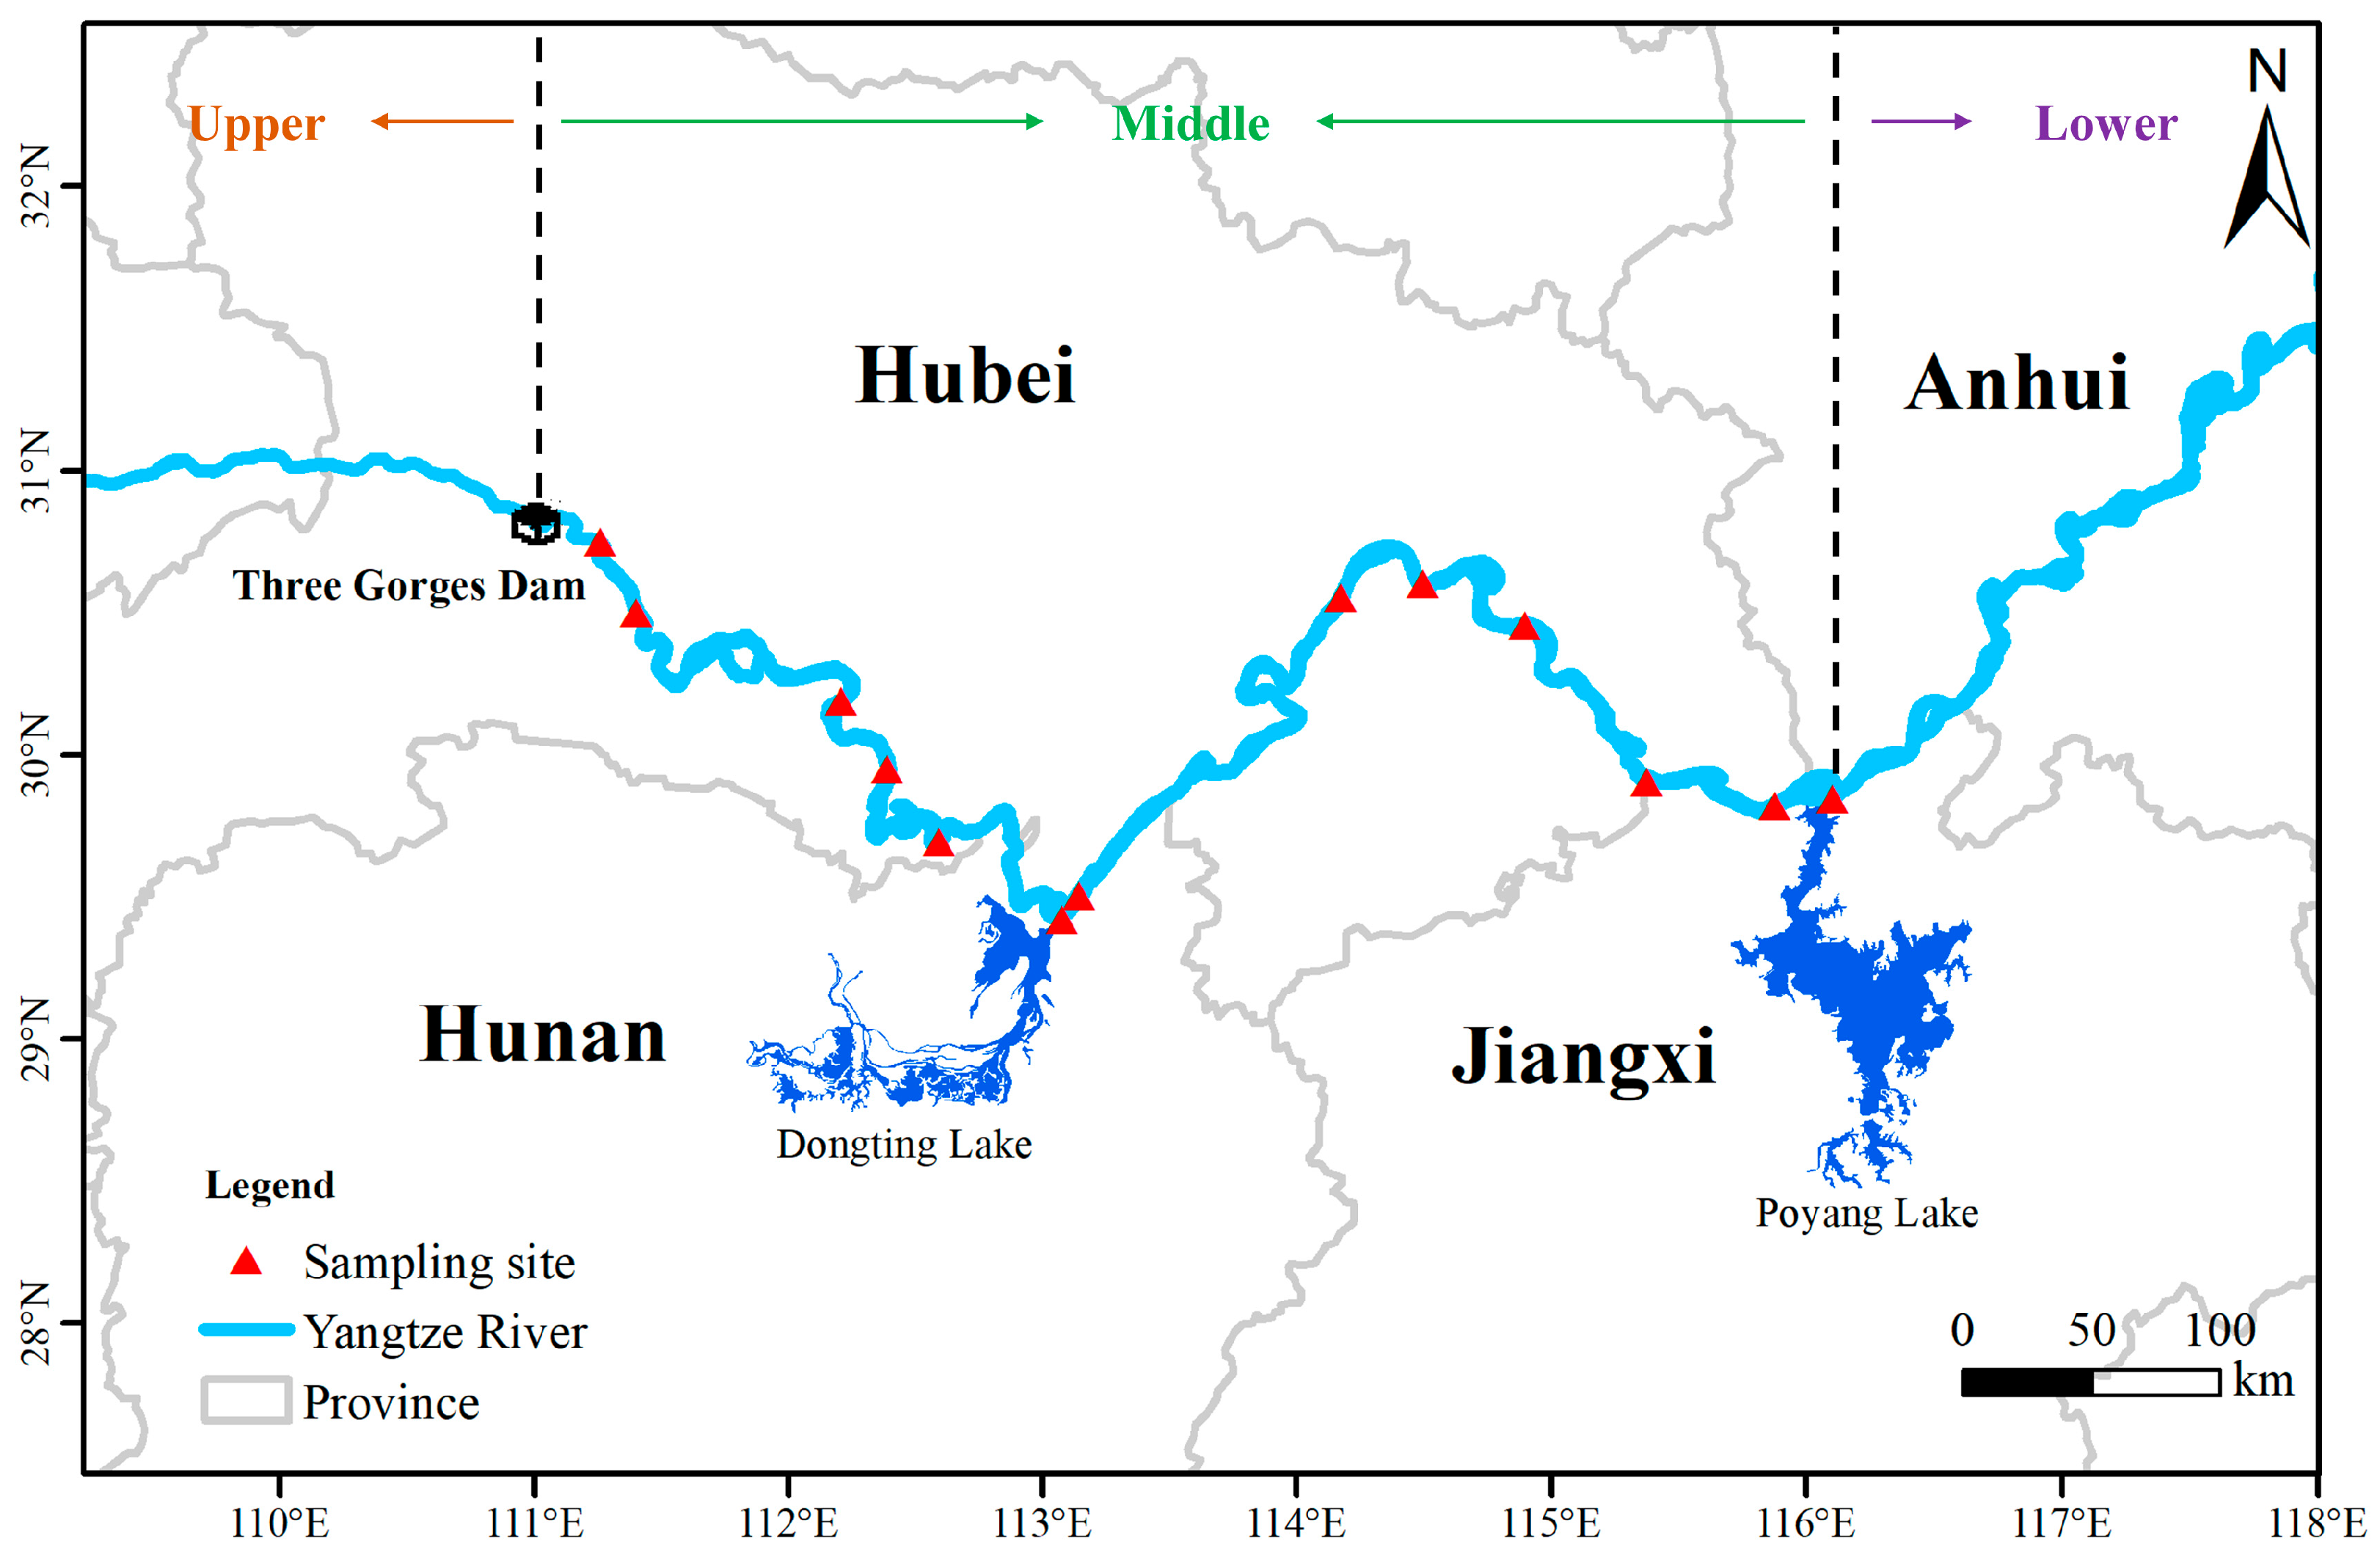
Figure 2.
Correlation of water quality parameters with band combinations. A total of 220 band combinations were computed, and only the eight that have high correlation coefficients with TP are shown here.
Figure 2.
Correlation of water quality parameters with band combinations. A total of 220 band combinations were computed, and only the eight that have high correlation coefficients with TP are shown here.
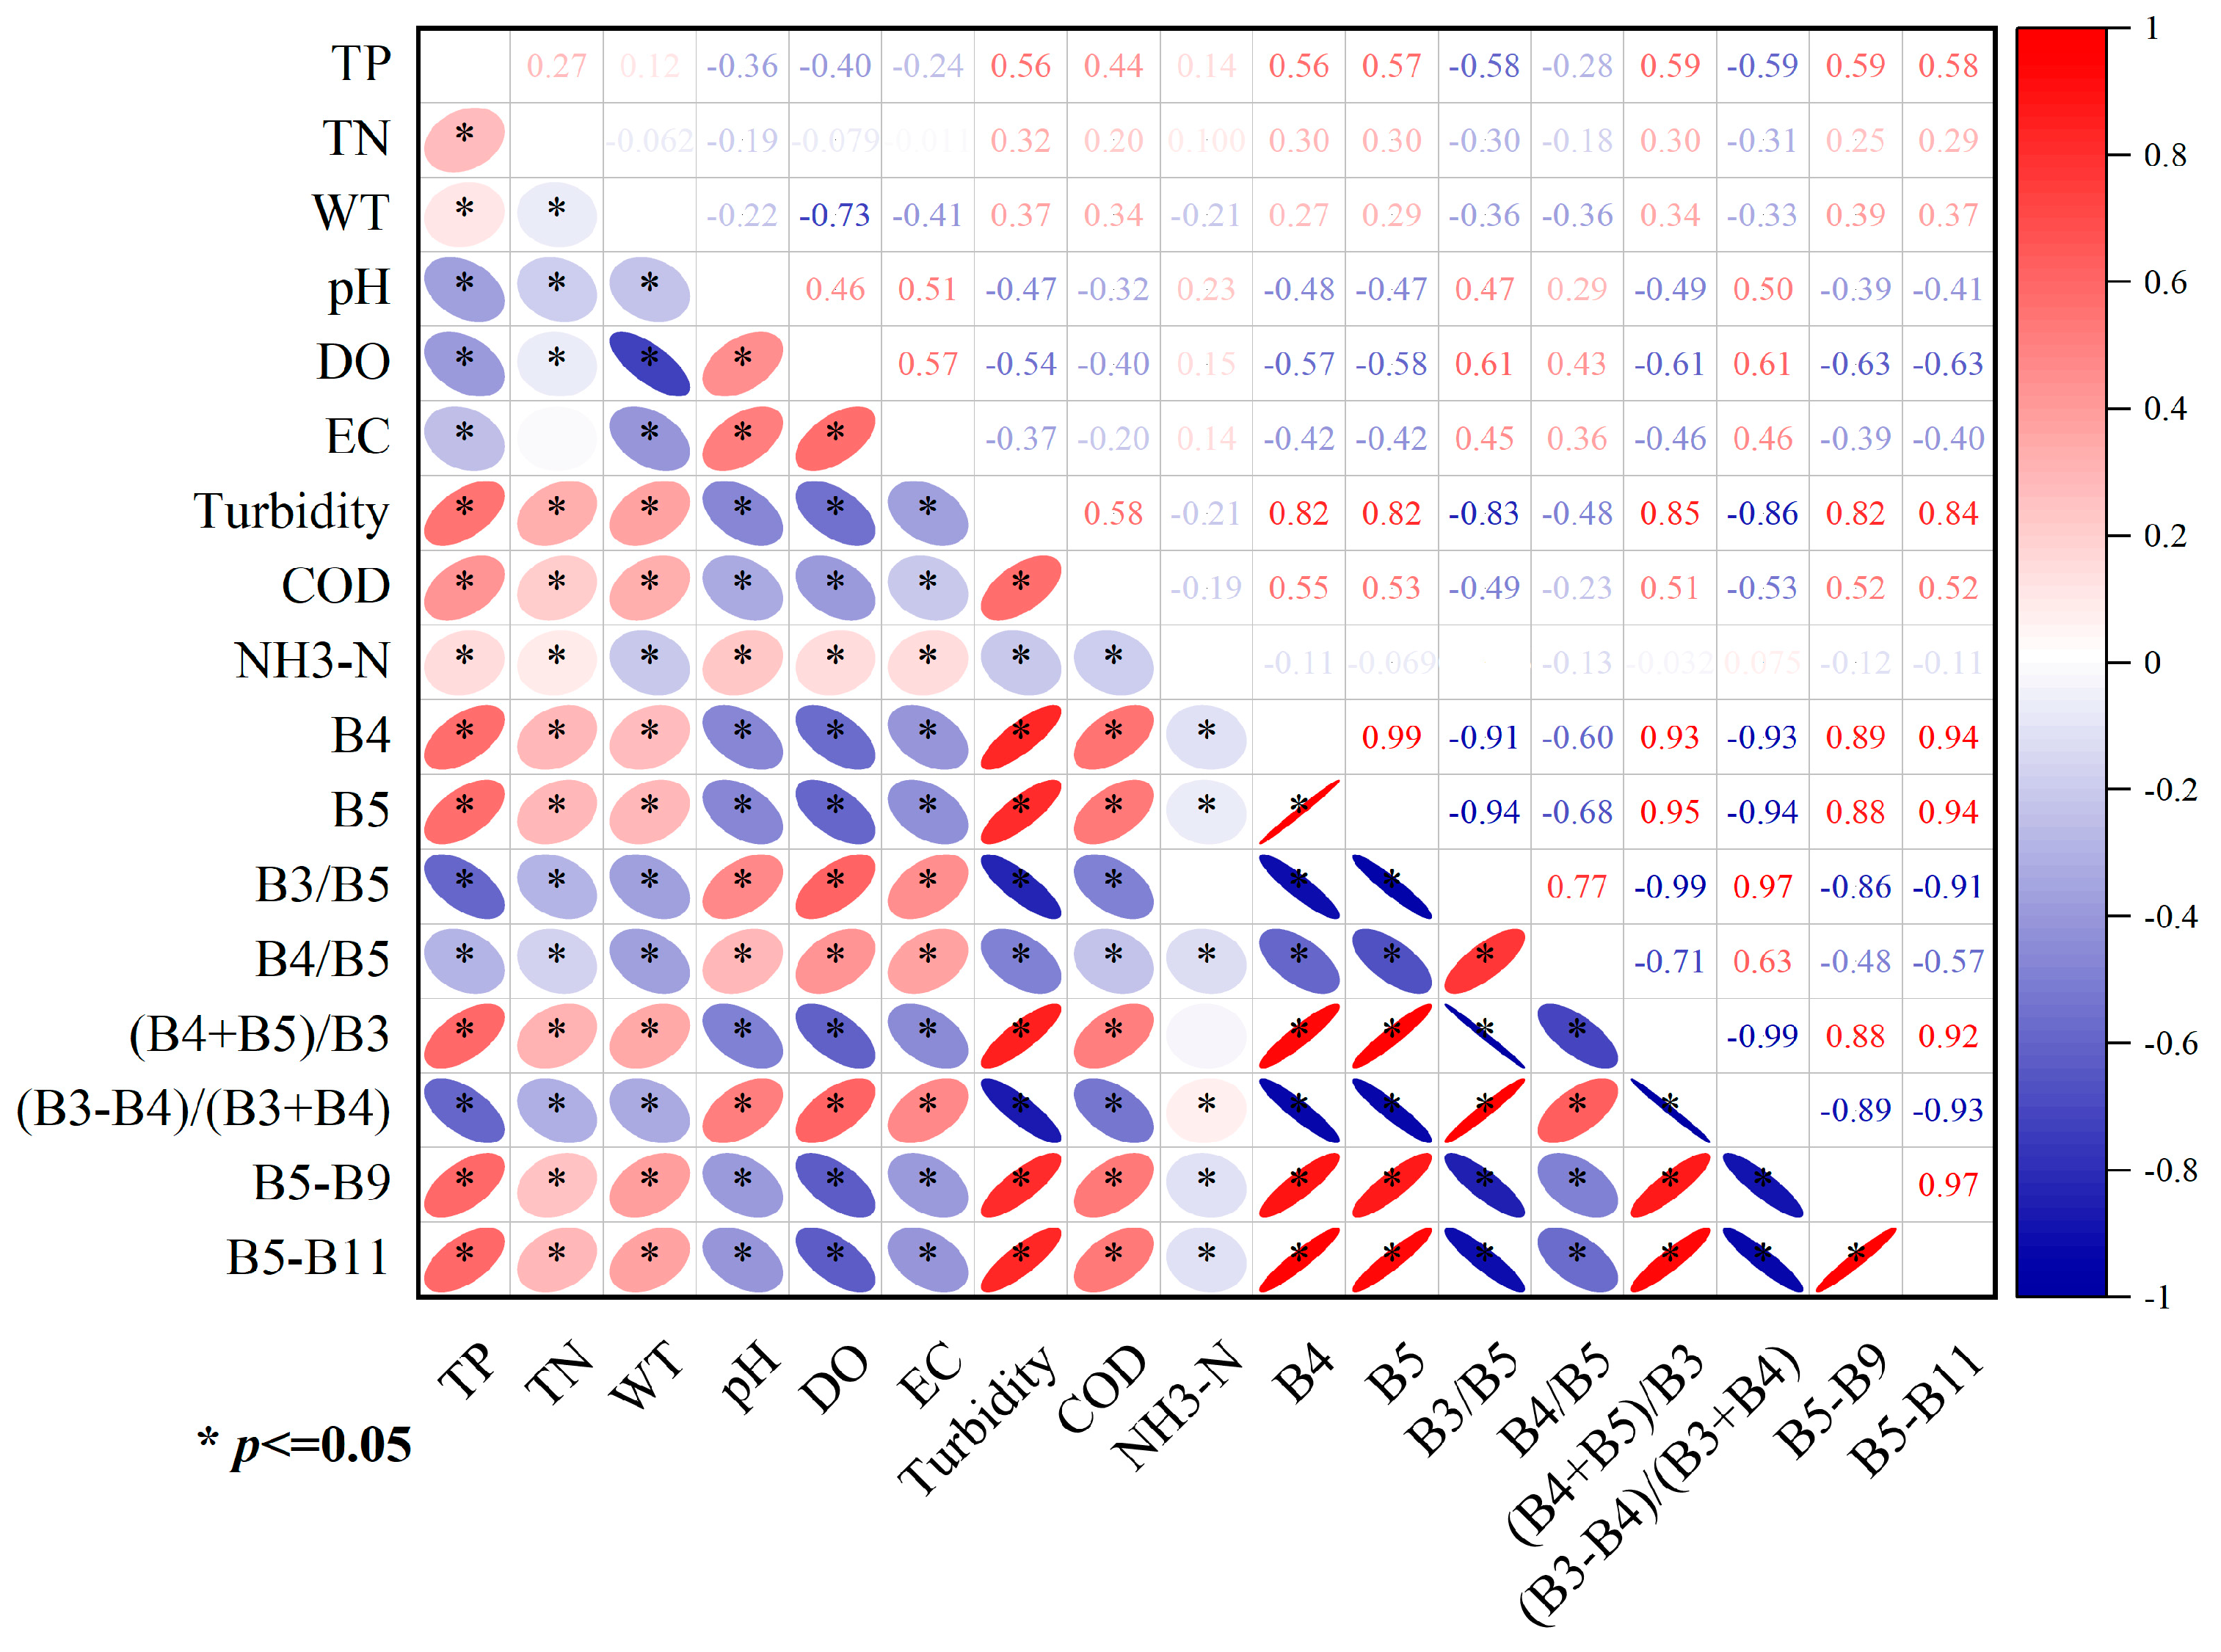
Figure 3.
Architecture of the RBFNN.
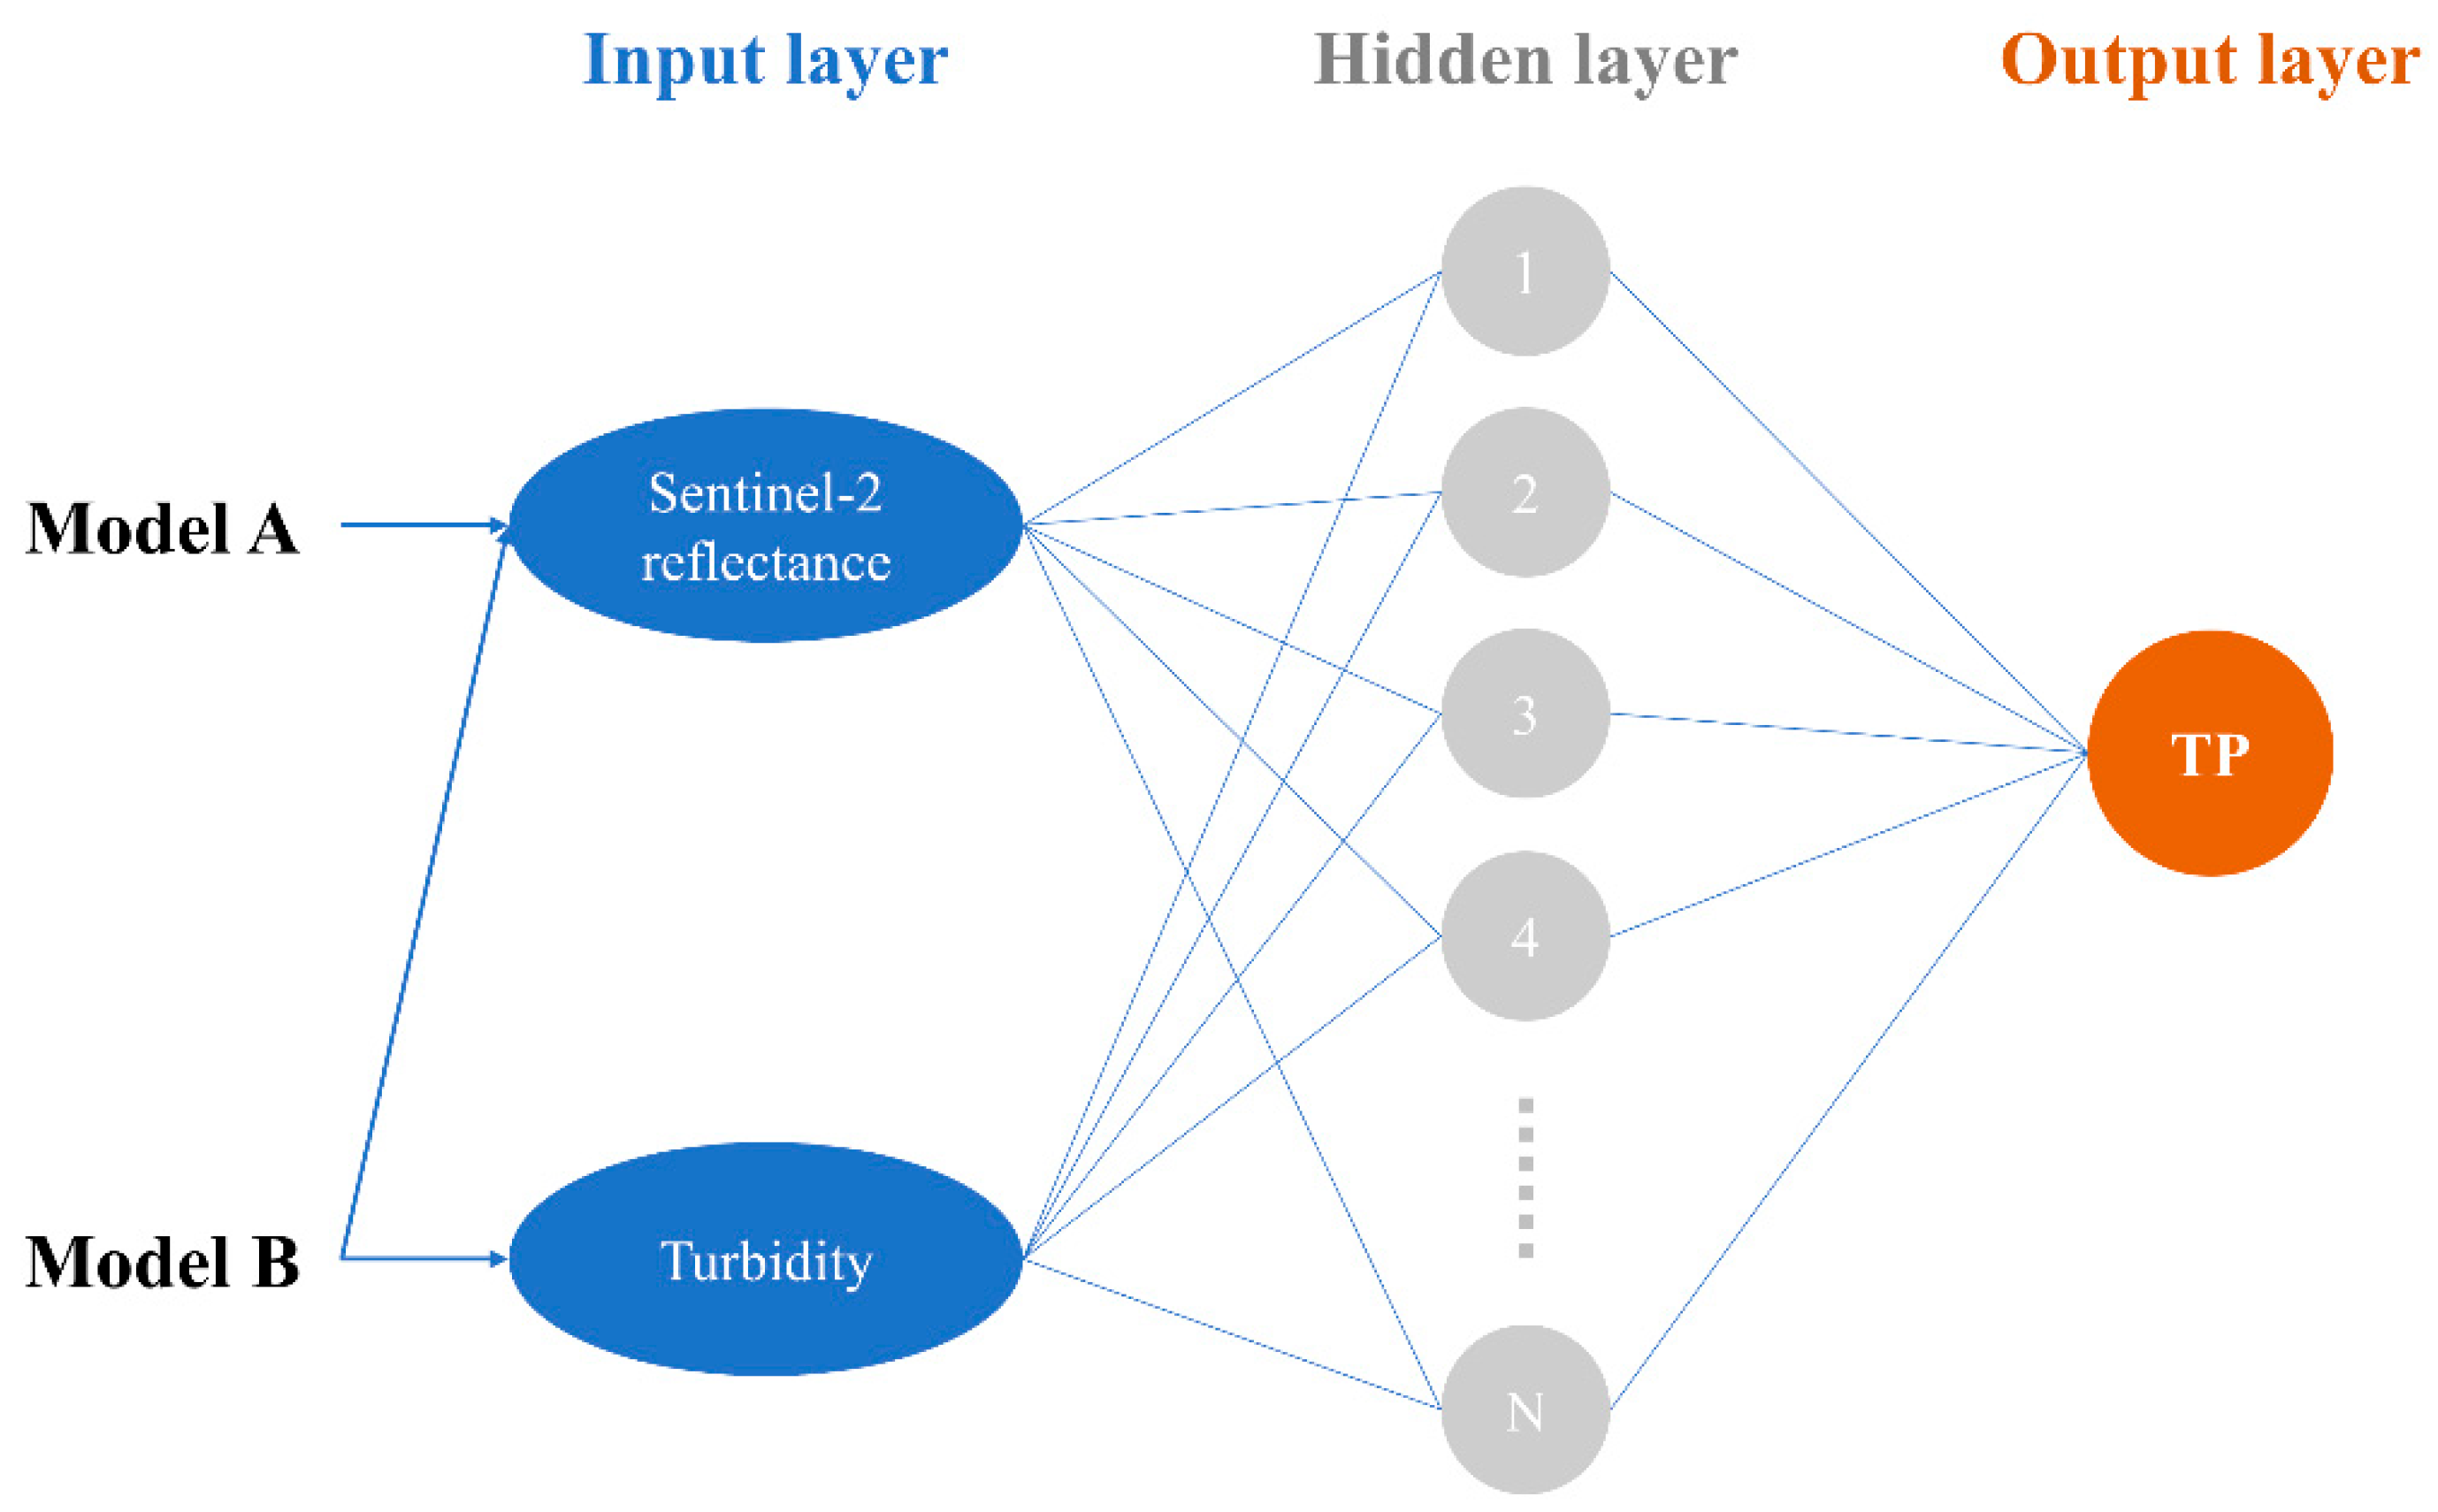
Figure 4.
Scatter diagram of measured-retrieved turbidity. The blue line is the fitted line for the training sample, the red line is the fitted line for the validation sample, and the gray line is the 1:1 line.
Figure 4.
Scatter diagram of measured-retrieved turbidity. The blue line is the fitted line for the training sample, the red line is the fitted line for the validation sample, and the gray line is the 1:1 line.

Figure 5.
Scatter diagram of measured-retrieved TP. Unlike Model (A), Model (B) is the result of the TP concentration retrieval with the addition of turbidity. The blue line is the fitted line for the training sample, the red line is the fitted line for the validation sample, and the gray line is the 1:1 line.

Figure 6.
Spatial and temporal variability of turbidity in the MYR.
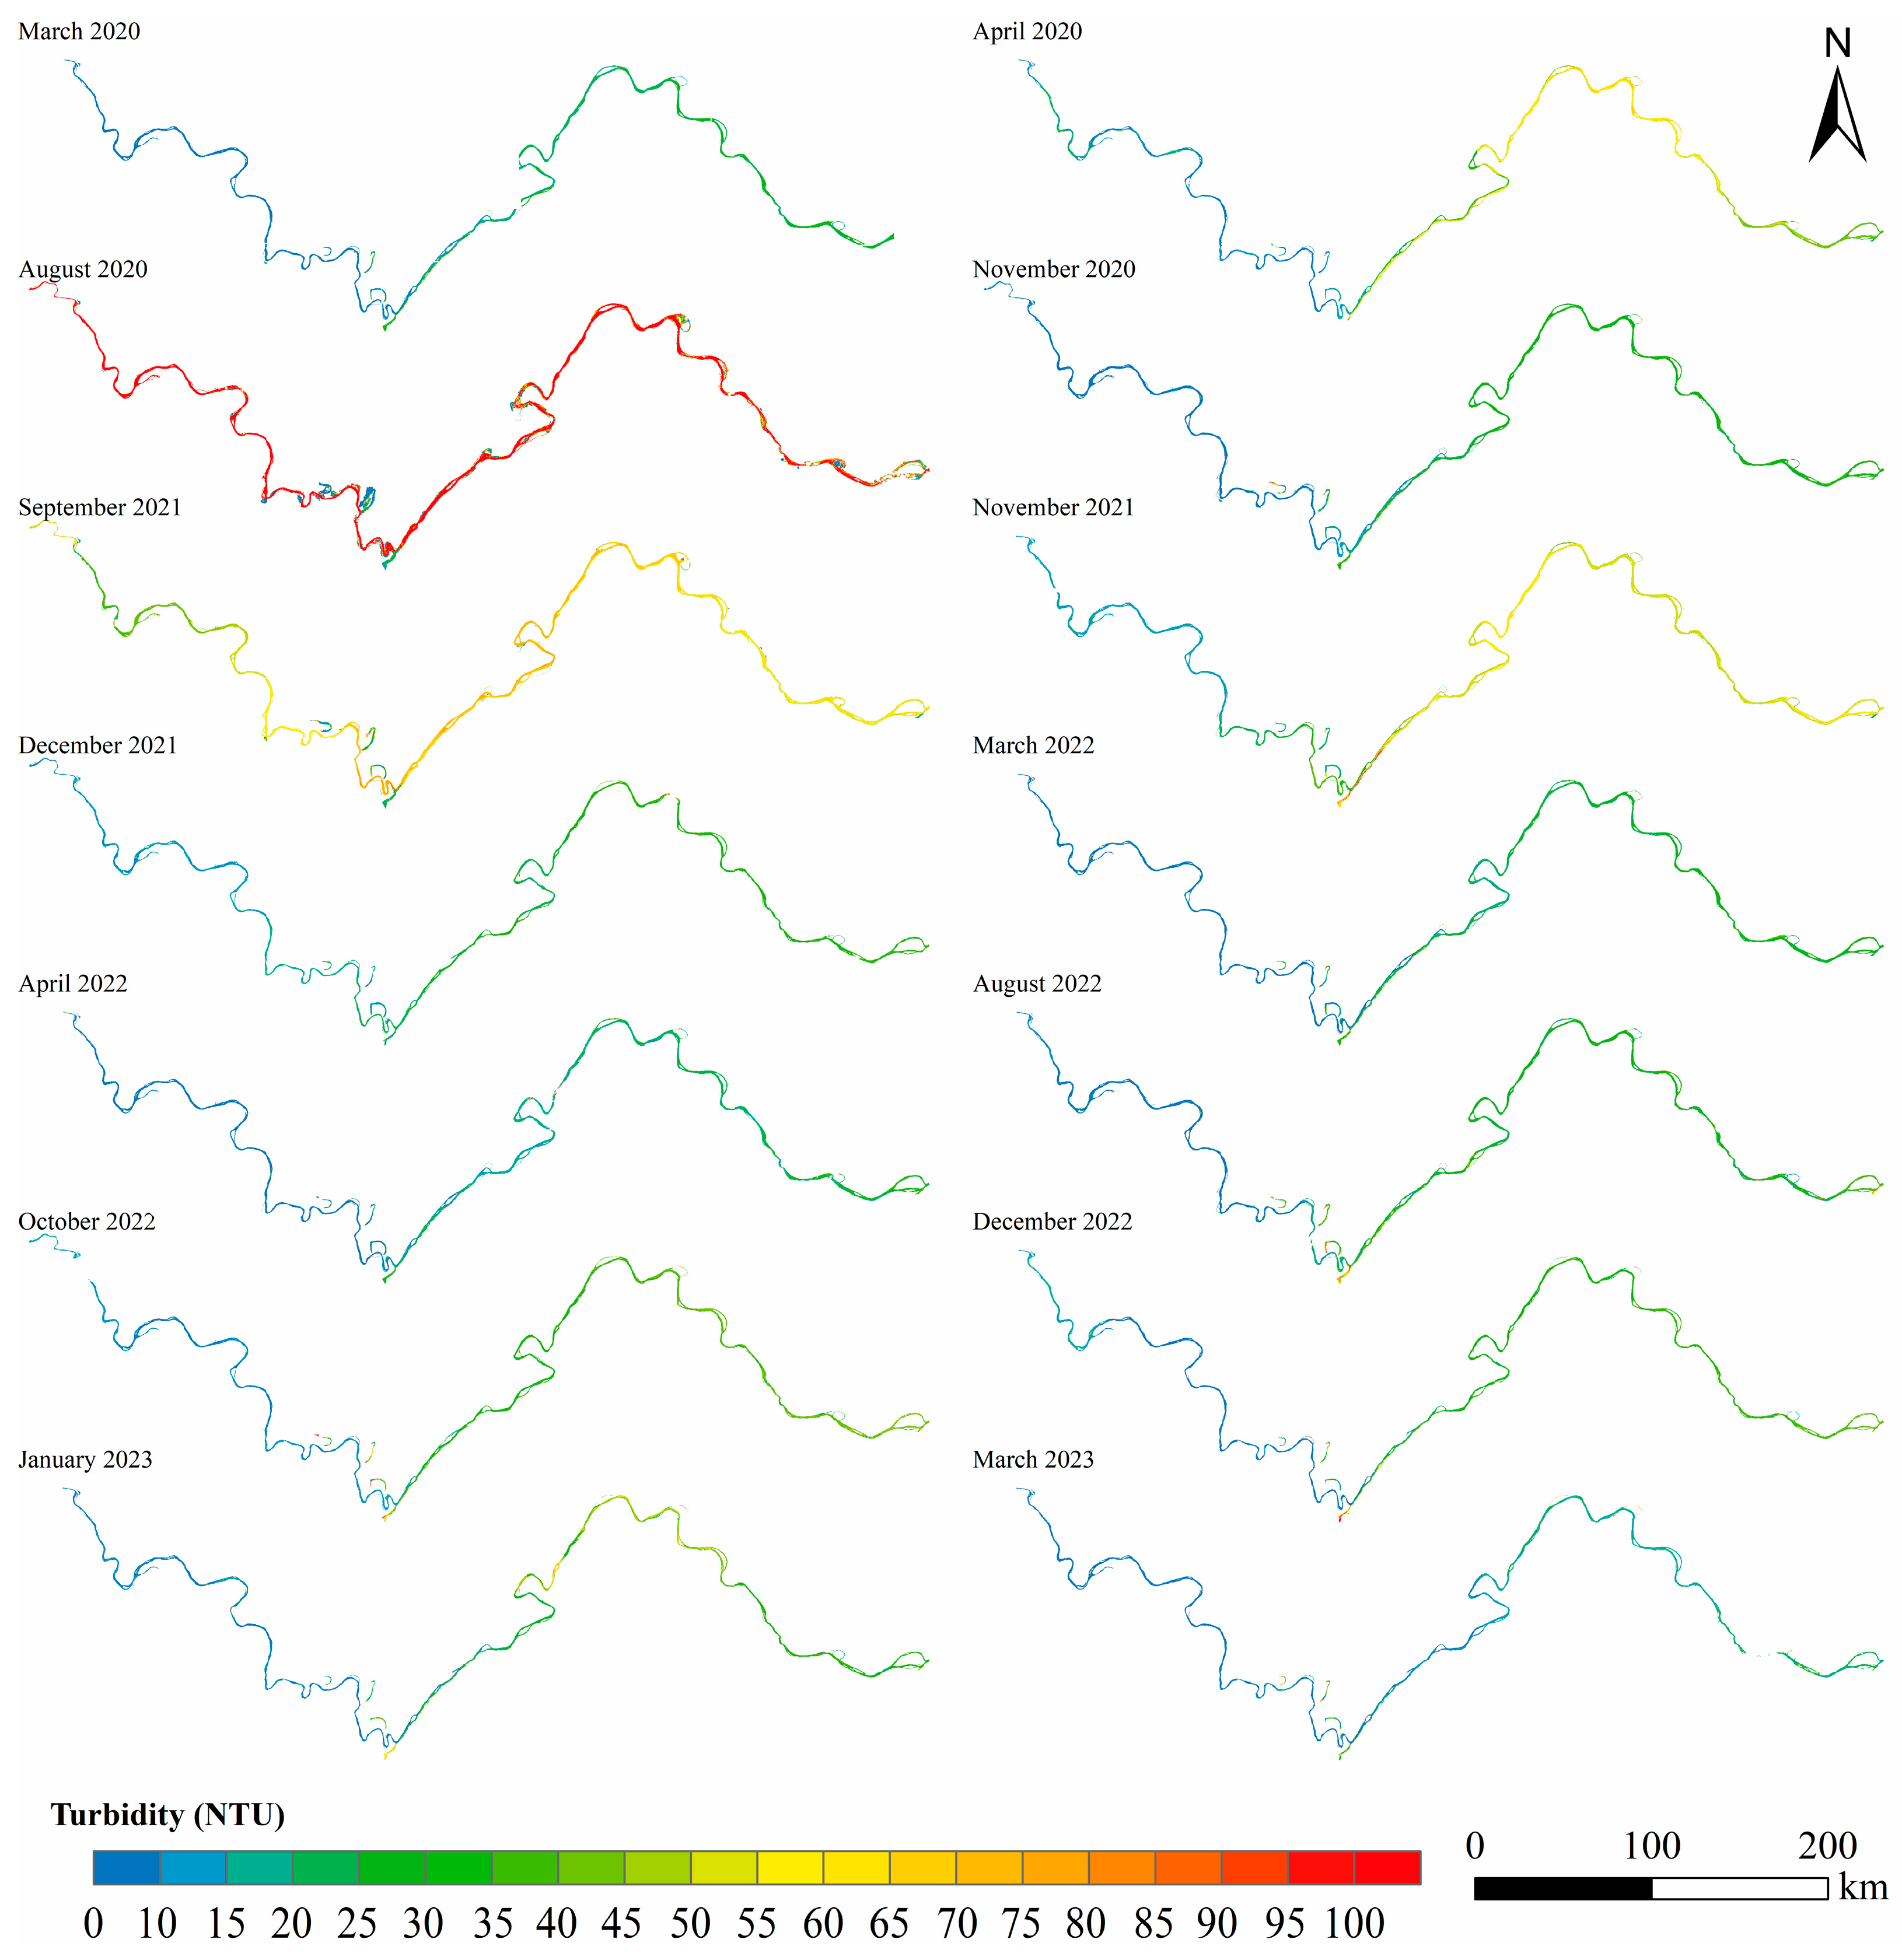
Figure 7.
Spatial and temporal variability of TP in the MYR.
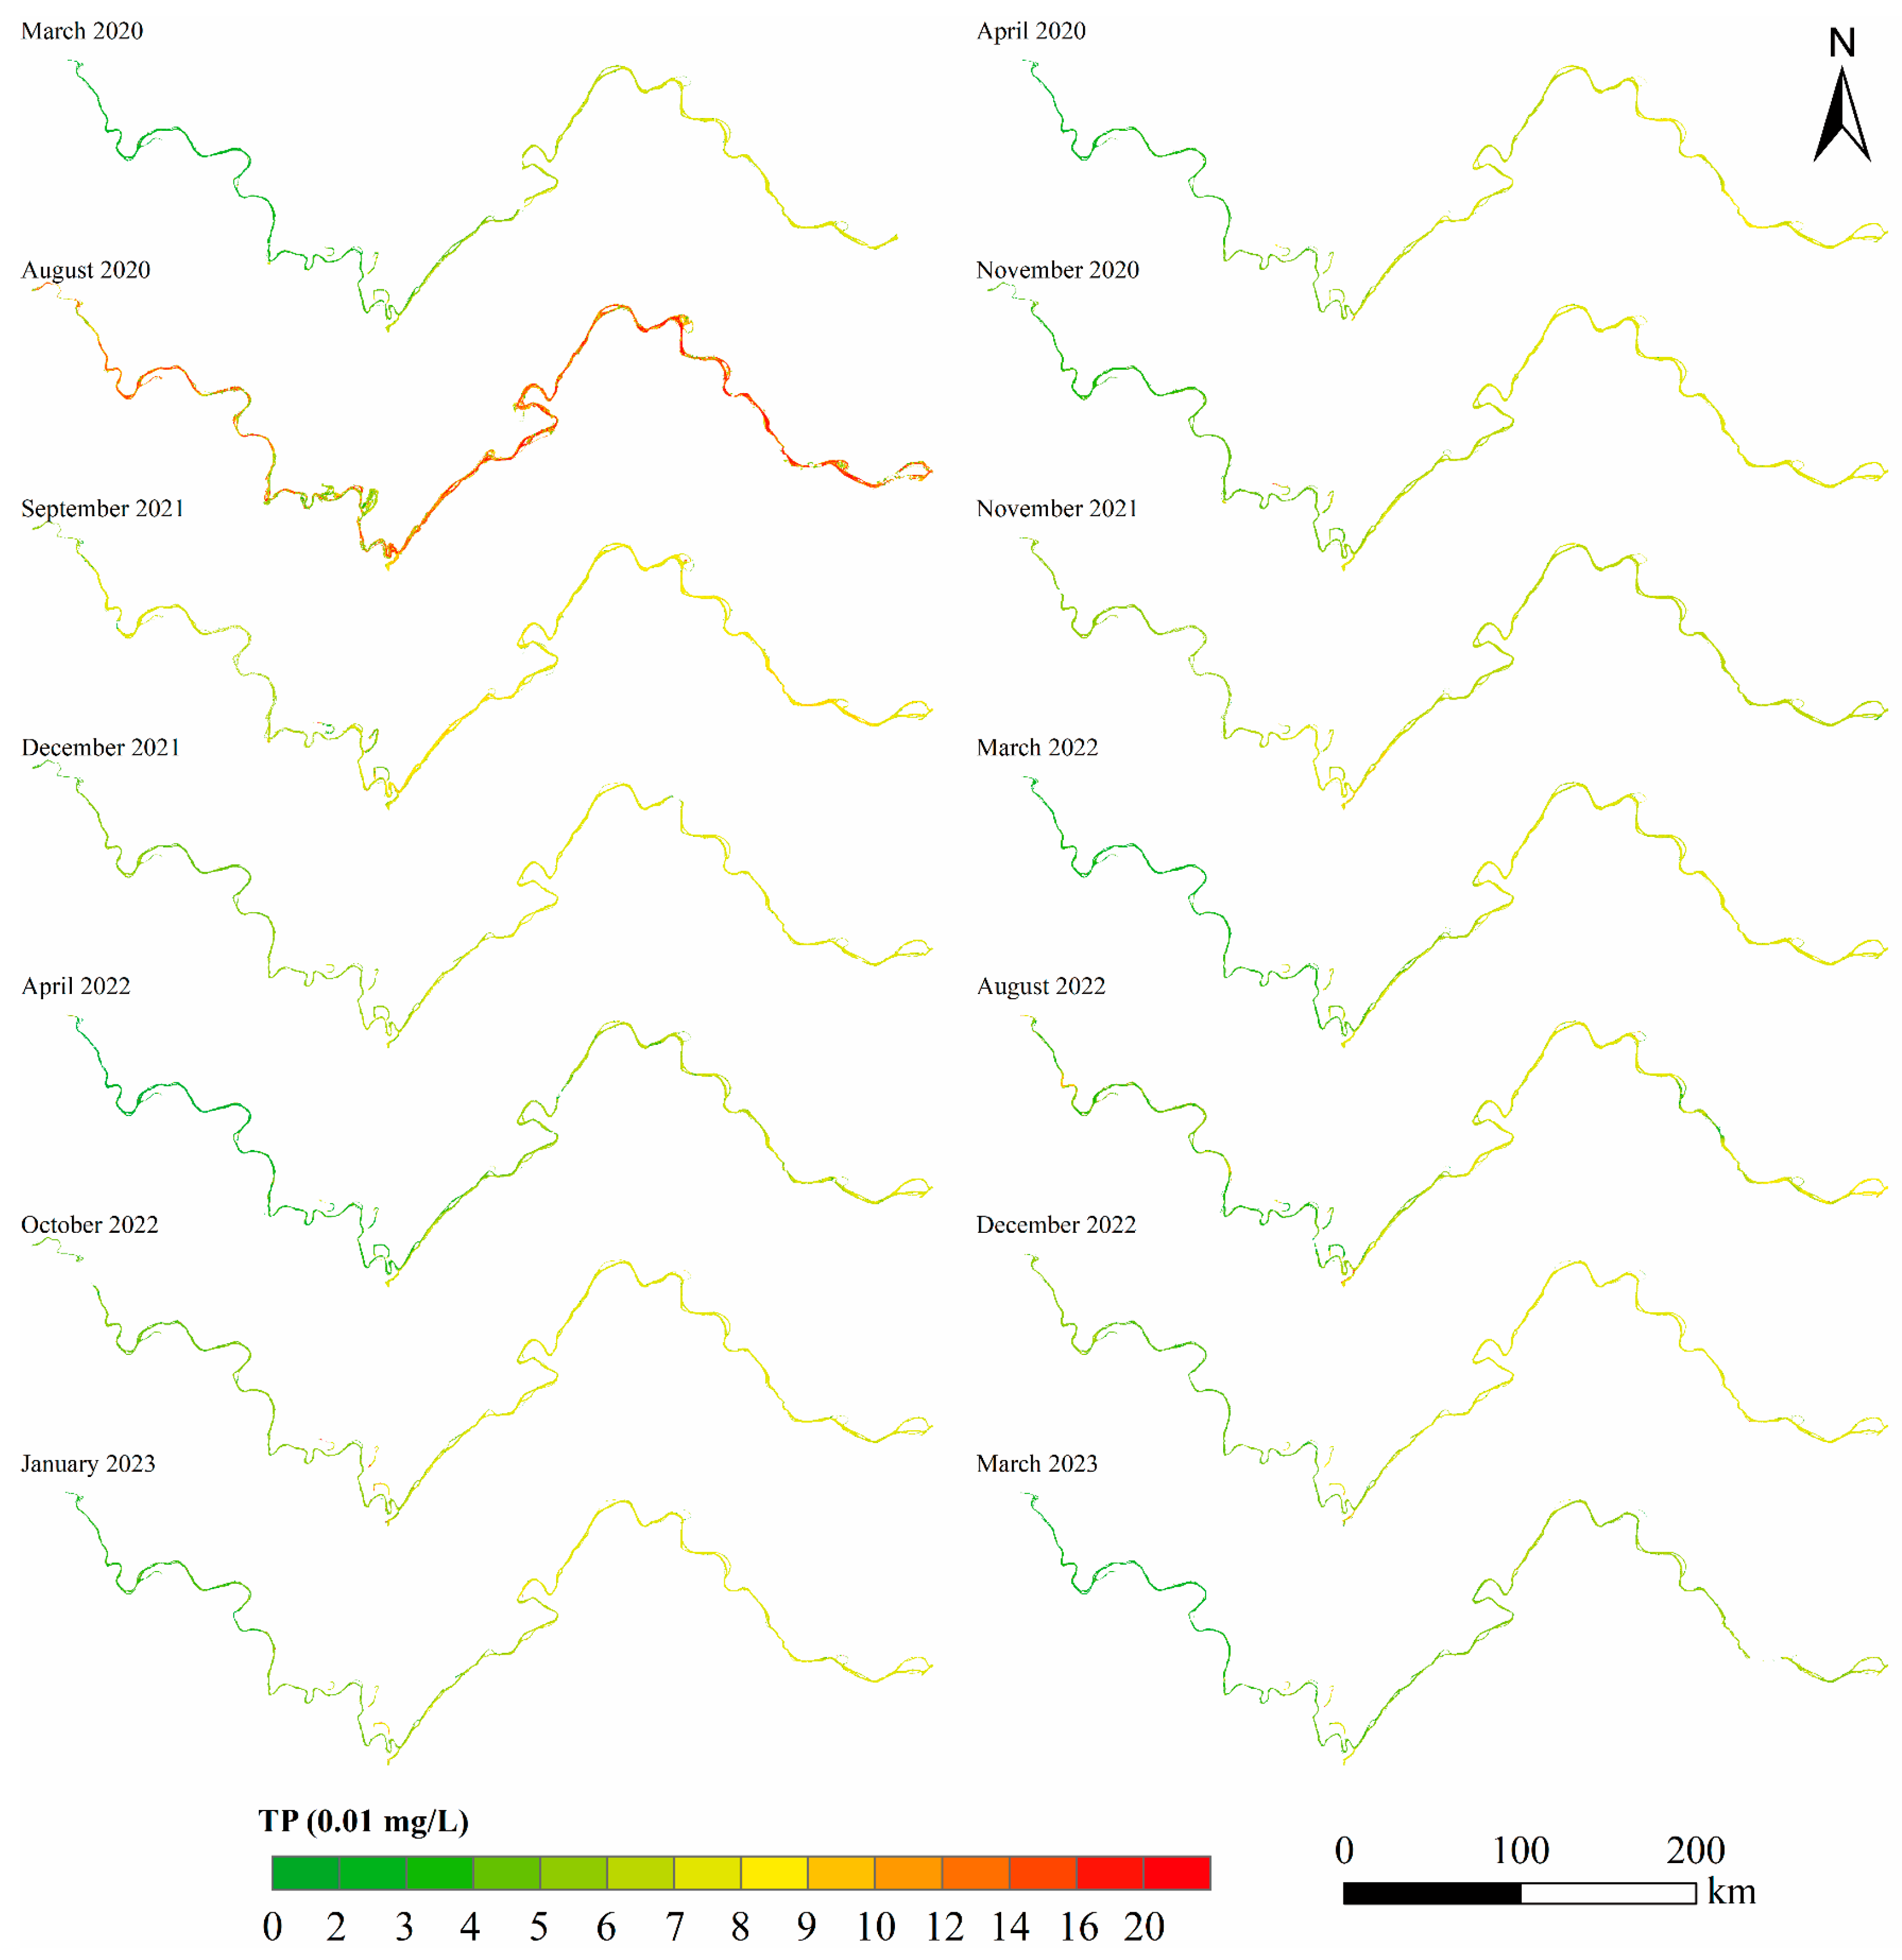
Figure 8.
Spatial and temporal variability of turbidity in the MYR. The left-to-right rasters indicate the turbidity in different river sections along the middle reaches of the Yangtze River.
Figure 8.
Spatial and temporal variability of turbidity in the MYR. The left-to-right rasters indicate the turbidity in different river sections along the middle reaches of the Yangtze River.

Figure 9.
Spatial and temporal variability of TP concentration in the MYR. The left-to-right rasters indicate the TP concentration in different river sections along the middle reaches of the Yangtze River.
Figure 9.
Spatial and temporal variability of TP concentration in the MYR. The left-to-right rasters indicate the TP concentration in different river sections along the middle reaches of the Yangtze River.

Figure 10.
(A) 8 March 2022, RBG image of the Dongting Lake export. (B) 8 March 2022, turbidity and TP concentration.
Figure 10.
(A) 8 March 2022, RBG image of the Dongting Lake export. (B) 8 March 2022, turbidity and TP concentration.

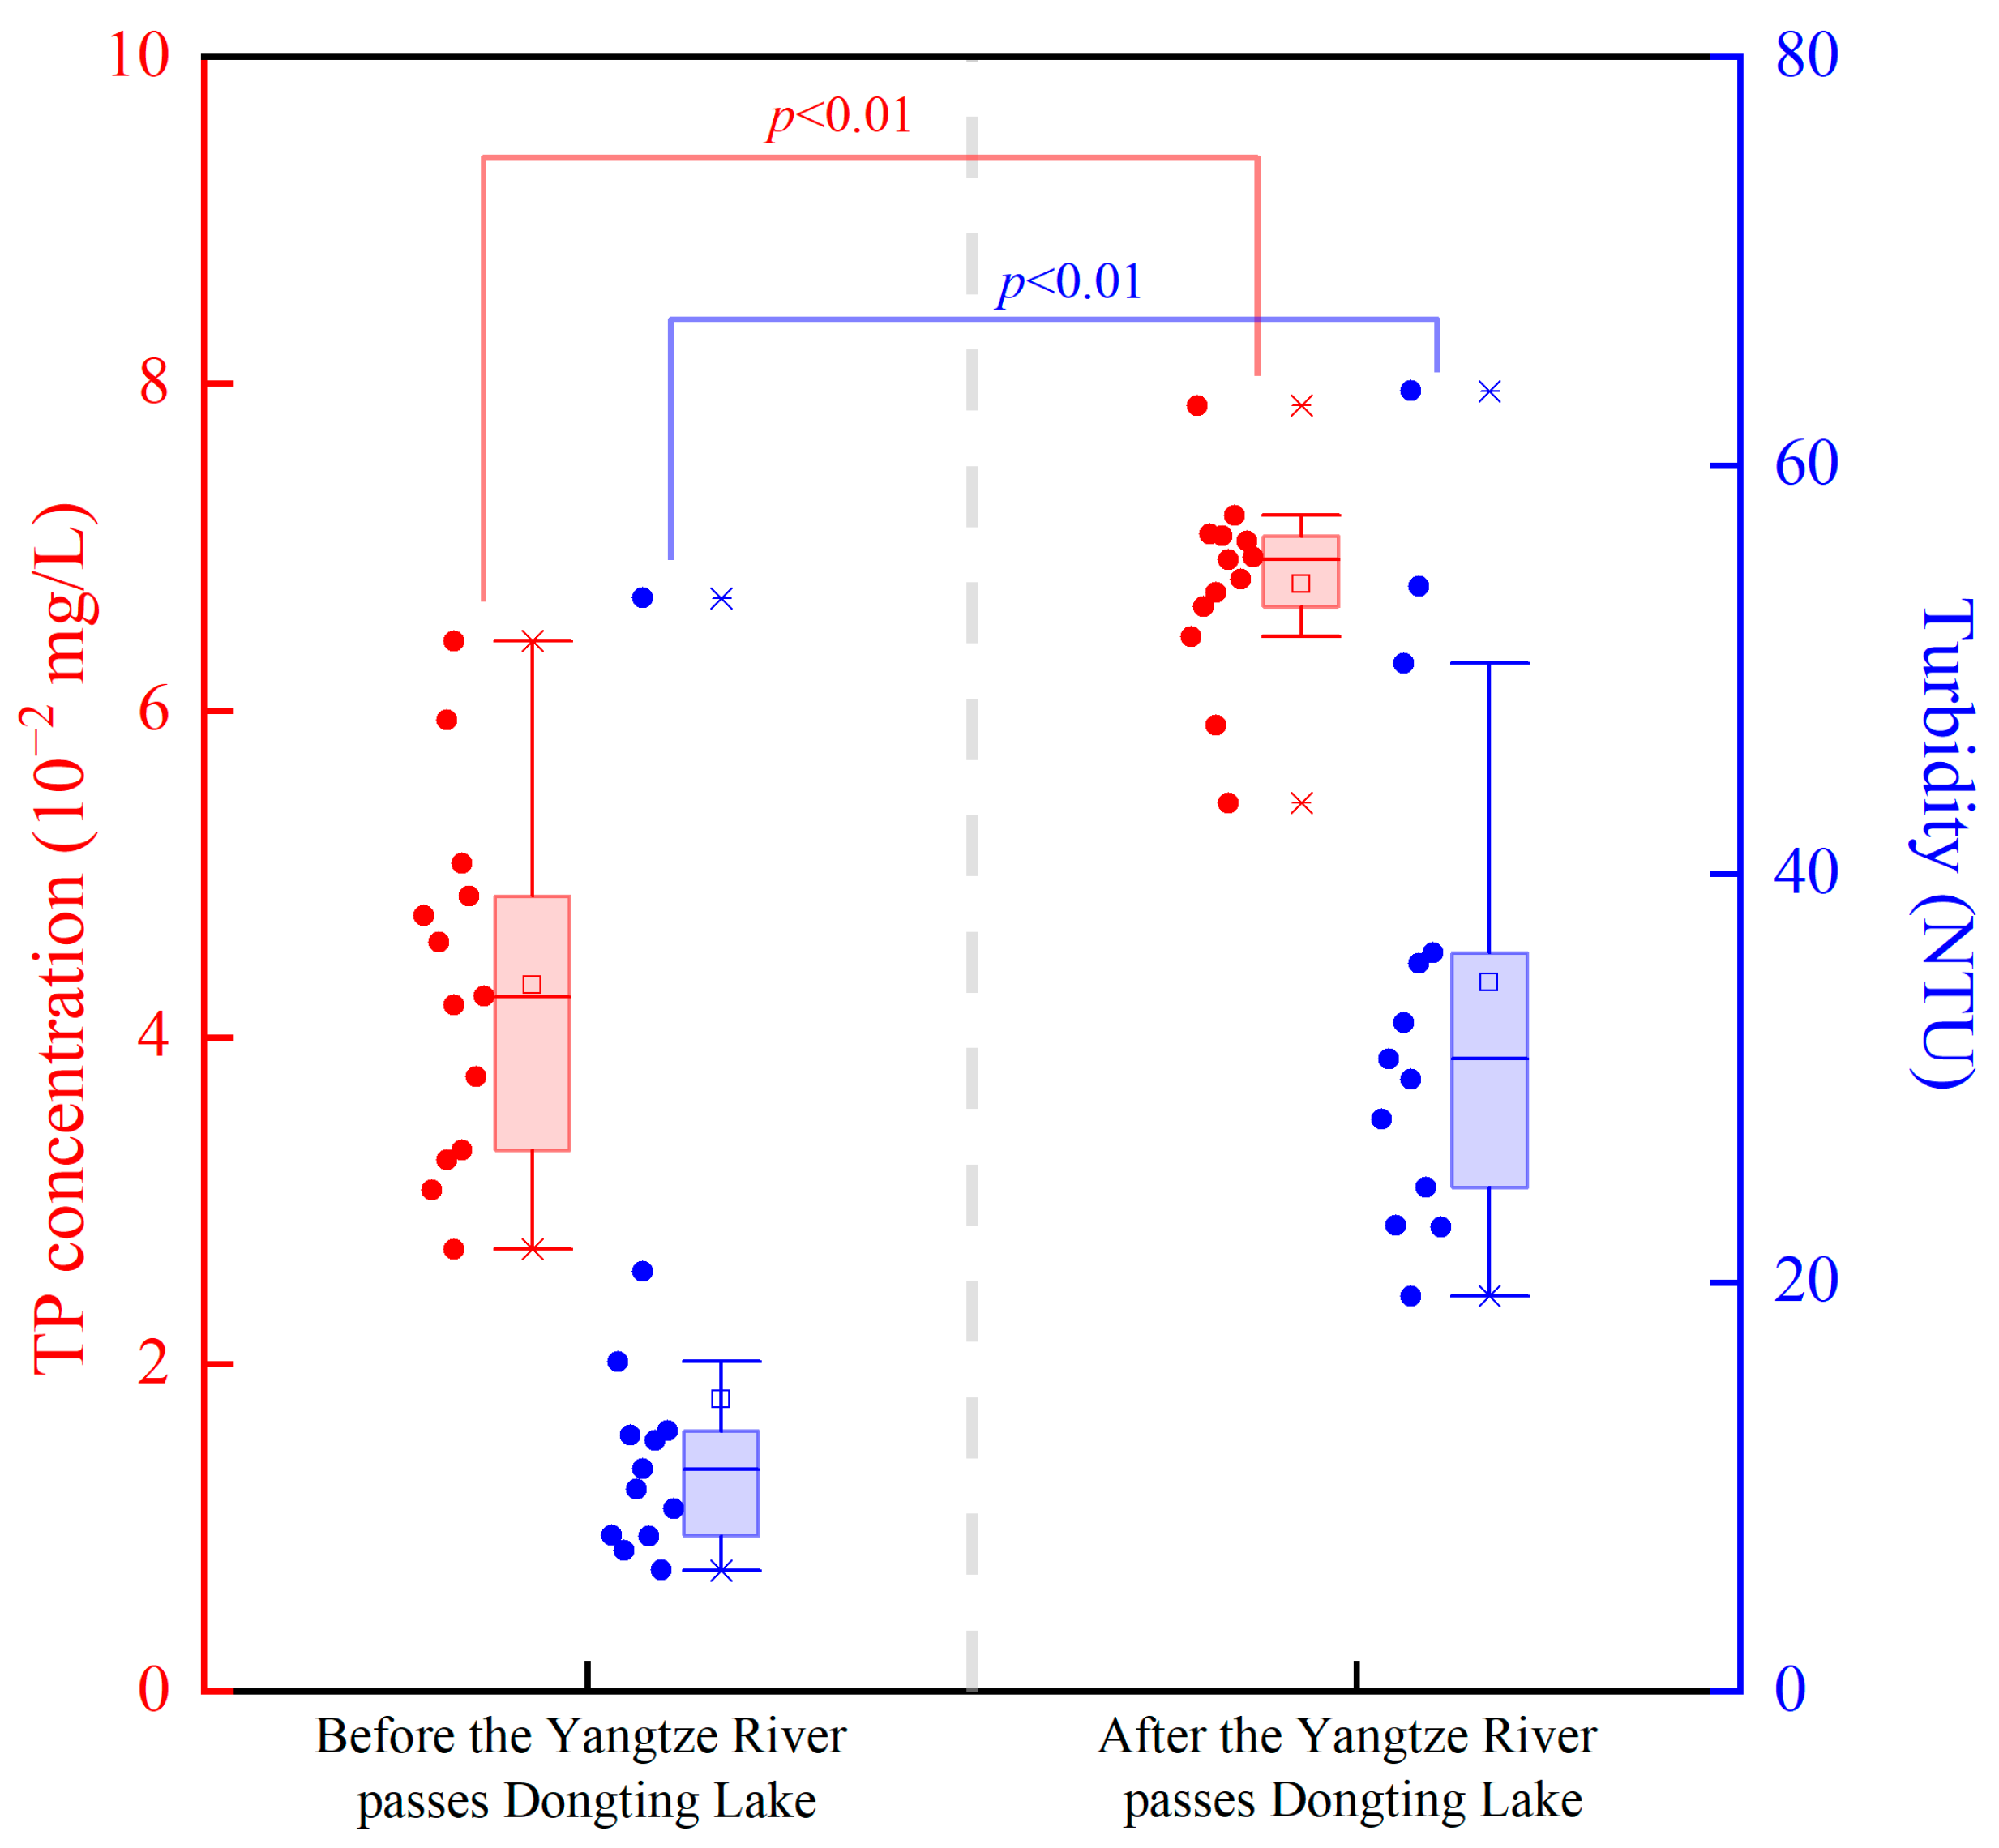
Figure 11.
Variation of turbidity and TP concentration before and after the Yangtze River passes through Dongting Lake (August 2020 is not included in the statistics). Scattered dots indicate turbidity and TP concentration values in the MYR in Figure 8 and Figure 9, and “x” indicates maximum and minimum values. The dash line is used to distinguish before and after the Yangtze River passes through Dongting Lake.

Table 1.
Numerical description of measured water quality parameters in samples. Std: standard deviation; Q25 and Q75 are the 1st quartile and 3rd quartile, respectively.
Table 1.
Numerical description of measured water quality parameters in samples. Std: standard deviation; Q25 and Q75 are the 1st quartile and 3rd quartile, respectively.
| Range | Mean ± Std | Median | Q25–Q75 | |
|---|---|---|---|---|
| TP (mg/L) | 0.01–0.162 | 0.068 ± 0.024 | 0.067 | 0.05–0.08 |
| TN (mg/L) | 0.8–3.19 | 1.81 ± 0.45 | 1.76 | 1.48–2.05 |
| WT. (°C) | 8–30.22 | 20.1 ± 5.8 | 20.7 | 15.18–25.6 |
| pH | 6.1–8.71 | 7.9 ± 0.4 | 7.9 | 7.64–8.19 |
| DO (mg/L) | 3.16–13.22 | 8.82 ± 1.56 | 8.87 | 7.66–9.87 |
| EC (μS/cm) | 249.12–523.5 | 356.9 ± 42.9 | 357.2 | 328.57–381.3 |
| Turbidity (NTU) | 2–135.93 | 33.7 ± 23.6 | 30.3 | 16.73–44.86 |
| COD (mg/L) | 0.41–14.9 | 1.76 ± 1.15 | 1.59 | 1.275–2.03 |
| NH3-N (mg/L) | 0.02–0.92 | 0.068 ± 0.137 | 0.025 | 0.02–0.028 |
Table 2.
Recent application of related research to remote sensing of river water quality.
| Study Area | Water Quality Parameter | Satellite | Band | R2 | References |
|---|---|---|---|---|---|
| Alpine rivers on the Tibetan Plateau | TP | Sentinel-2 | (B4 + B5)/B3 | 0.734 | Wang et al. (2022) [20] |
| Pearl River Estuary | Total suspended solid | Landsat 5, 7, 8 | B5, B4 | / | Wang et al. (2018) [32] |
| Yangtze River | TP | Landsat 8 | B2, B3, B6 | 0.59 | Zhao et al. (2023) [21] |
| The Red River | Turbidity | Sentinel-2 | B2, B3, B4, B8 | 0.774 | Tham et al. (2022) [33] |
| Mississippi and Missouri Rivers | Surficial suspended sediment concentration | Landsat 5 | B2, B3, B4, B5 | 0.72 | Umar et al. (2018) [34] |
Disclaimer/Publisher’s Note: The statements, opinions and data contained in all publications are solely those of the individual author(s) and contributor(s) and not of MDPI and/or the editor(s). MDPI and/or the editor(s) disclaim responsibility for any injury to people or property resulting from any ideas, methods, instructions or products referred to in the content. |
© 2024 by the authors. Licensee MDPI, Basel, Switzerland. This article is an open access article distributed under the terms and conditions of the Creative Commons Attribution (CC BY) license (https://creativecommons.org/licenses/by/4.0/).
Share and Cite
MDPI and ACS Style
Yang, F.; Feng, Q.; Zhou, Y.; Li, W.; Zhang, X.; He, B. Monitoring Total Phosphorus Concentration in the Middle Reaches of the Yangtze River Using Sentinel-2 Satellites. Remote Sens. 2024, 16, 1491. https://doi.org/10.3390/rs16091491
AMA Style
Yang F, Feng Q, Zhou Y, Li W, Zhang X, He B. Monitoring Total Phosphorus Concentration in the Middle Reaches of the Yangtze River Using Sentinel-2 Satellites. Remote Sensing. 2024; 16(9):1491. https://doi.org/10.3390/rs16091491
Chicago/Turabian StyleYang, Fan, Qi Feng, Yadong Zhou, Wen Li, Xiaoyang Zhang, and Baoyin He. 2024. "Monitoring Total Phosphorus Concentration in the Middle Reaches of the Yangtze River Using Sentinel-2 Satellites" Remote Sensing 16, no. 9: 1491. https://doi.org/10.3390/rs16091491
Note that from the first issue of 2016, this journal uses article numbers instead of page numbers. See further details here.