
Twin Satellites HY-1C/D Reveal the Local Details of Astronomical Tide Flooding into the Qiantang River, China


1
Marine Science and Technology College, Zhejiang Ocean University, Zhoushan 316004, China
2
National Satellite Ocean Application Service, Beijing 100081, China
*
Author to whom correspondence should be addressed.
Remote Sens. 2024, 16(9), 1507; https://doi.org/10.3390/rs16091507
Submission received: 14 February 2024
/
Revised: 15 April 2024
/
Accepted: 20 April 2024
/
Published: 24 April 2024
(This article belongs to the Special Issue New Developments in Remote Sensing for the Environment II)
Abstract
:This article extracts the Qiantang River tidal bore, analyzing the water environment characteristics in front of the tidal line of the Qiantang River tidal bore and behind it. The Qiantang River tidal bore Index (QRI) was established using HY-1C, HY-1D, and Gao Fen-1 wide field-of-view (GF-1 WFV) satellite data to precisely determine the location and details of the Qiantang River tidal bore. Comparative analyses of the changes on the two sides of the Qiantang River tidal bore were conducted. The results indicate the following: (1) QRI enhances the visibility of tidal bore lines, accentuating their contrast with the surrounding river water, resulting in a more vivid character. QRI proves to be an effective extraction method, with potential applicability to similar tidal lines in different regions. (2) Observable roughness changes occur at the tidal bore location, with smoother surface textures observed in front of the tidal line compared to those behind it. There is a discernible increase in suspended sediment concentration (SSC) as the tidal bore passes through. (3) This study reveals the mechanism of water environment change induced by the Qiantang River tidal bore, emphasizing its significance in promoting vertical water body exchange as well as scouring the bottom sediments. This effect increases SSC and surface roughness.
1. Introduction
Tidal bore, a phenomenon occurring during rising tides, involves the upstream flow of incoming tides along rivers or narrow bays, resulting in tidal waves with dynamic wavelengths and frequencies. It is estimated that over 400 estuaries worldwide, excluding Antarctica, experience tidal bores. The tidal bore affects the environment, ecology, and culture near these estuaries [1]. Traditionally, ocean tide research relied on in situ measurements and numerical modeling. Over the past 40 years, the integration of remote sensing (RS) through satellite technology has filled gaps in ocean tide (OT) measurement. RS technology has not only advanced our understanding of global OT [2,3,4] but has also facilitated large-scale and continuous OT monitoring and prediction. Utilizing RS technology has become a crucial tool for studying ocean tides.
At present, various RS systems are employed for ocean tide observation, including optical, Global Navigation Satellite Systems-Reflectometry (GNSS-R), Synthetic Aperture Radar (SAR), Altimeter, and Light Detection and Ranging (LiDAR). Optical satellite images, widely used for OT studies, benefit from open access and appropriate temporal and spatial resolution [5,6,7]. The extraction of waterlines from high spatial resolution optical satellite images is crucial for studying tidal flats and coastlines [8]. The extraction of waterlines also requires selecting appropriate spectral bands based on various conditions [9,10]. The spatial analysis and edge detection methods of optical satellite images have also been widely used. The multi-scale edge detection algorithm based on multi-layer knowledge method is used to extract channel edges in optical images [11]. Angeles proposed a fractal analysis of tidal channels based on Landsat-5 and used box-counting and contiguity methods to derive the degree of geomorphic control of the tidal channel network at the Bahia Blanca Estuary in Argentina [10]. Optical satellite data play a crucial role in tidal wetland classification, where spectral and texture indexes, along with advanced machine learning (ML) algorithms, are employed [12,13,14,15,16]. GNSS-R provides distance measurements useful for removing vertical land motion from tide gauge records [17]. GNSS-R, along with airborne RS technology, contributes to a semi-automatic method for creating three-dimensional distributed tidal channel maps, including shapes and positions [18]. The SAR is the one of the most commonly used remote sensing resources for studying tidal currents, and more and more SAR methods such as radar Line of Sight (LOS), Fourier transform images, and interferometry are being used for tidal currents research [19]. Satellite altimetry data have been used to study OT and improve global OT models [20,21]. In addition, altimetry is also employed to detect shoreline changes in tidal flats [22]. Over the past two decades, satellite altimetry has been instrumental in studying global sea level changes and mapping Ocean Wave Height [23,24,25]. LiDAR data provide topographic information for the ocean and land, significantly aiding in tidal wetland mapping and change analysis [13,15].
The Qiantang River tidal bore is renowned for its impressive height and distinctive shape, attributed to the funnel-like structure of its estuary. This natural phenomenon occurs as tides surge into Hangzhou Bay from the East China Sea. Originating in Ganpu, the tidal bore propels upstream at a remarkable speed of 20–30 km per hour, covering a distance exceeding 100 km. Preceding the autumnal equinox, the estuary’s riverbed undergoes erosion due to high flow. During the autumn equinox, as river flow diminishes, the tidal range and bore level escalate, creating spectacular tides typically observed in August of the lunar calendar, drawing large crowds of tourists. Notably, the Yanguan River section hosts the largest tidal bore, reaching a height of 3.0 m [26]. Researchers such as Huang, Tu, and Li have made significant contributions to understanding the Qiantang River bore. Huang developed a new two-dimensional high-order Boussinesq-type equation and employed the finite volume method to simulate the tidal bore, considering dynamic dry and wet boundaries [27]. Tu’s study utilized high-frequency data from survey stations to uncover turbulence and sediment dynamics distinct from traditional boundary processes [28]. Li’s real-time tidal height and velocity calculations using ocean radar aligned with observational results in the estuarine area [29].
GF-1 launched on 26 April 2013, which is the first satellite of the China High-resolution Earth Observation System (CHEOS) project, equipped with panchromatic and multispectral cameras, short revisit cycles, multiple available times and phases, and plays an important role in agricultural resource surveys and marine environmental monitoring [30,31,32,33,34]. On 28 June 2019, China’s independent research marine satellite “HY-1C” was officially put into use, and in June of the following year, “HY-1D” was officially put into use. The Coastal Zone Imager (CZI) is mainly used for real-time monitoring of vegetation and coastal zones, with a resolution of 50 m. With the advantages of high spatial resolution, these satellite images are playing an increasingly important role in the development of marine ecology and monitoring of the marine water color environment [35,36,37,38].
This paper focuses on leveraging imagery from domestic remote sensing satellites for researching the Qiantang River tidal bore. The investigation encompasses the extraction of the tidal bore, detailed analysis of its changes, and exploration of trends in suspended sediment concentration induced by the bore. Satellite remote sensing technology makes it possible to continuously observe the global tides, thus providing the spatial distribution and spatiotemporal variation in tidal characteristics on a global scale. By using satellite height data and microwave remote sensing data, scientists can accurately calculate sea level height changes, deduce tidal parameters such as tidal height and tidal velocity, etc., and then study the propagation law of tidal waves and the formation mechanism of ocean currents [19,20,21]. However, satellite studies of tides still have some limitations. First of all, satellite remote sensing data are affected by weather, cloud cover, and other factors, which may lead to the deterioration of data quality and affect the accuracy and reliability of tidal parameters [6]. Secondly, due to the limitation of satellite orbit, the observation period of conventional satellites is limited, and continuous observation of tidal changes on a long time scale cannot be realized [5]. In addition, the spatial resolution of satellite remote sensing data is limited, and it is difficult to capture some small-scale tidal features [7], such as tidal changes in local areas such as estuaries and gulf banks. The innovation of this study is reflected in the use of high spatial resolution data to capture fine-scale tidal surge characteristics. The purpose of this study is to observe the detailed changes in the tidal bore of Qiantang River by using high spatial resolution water color remote sensing satellite and to explore the reasons for the changes in the tidal bore of Qiantang River on the water environment of Hangzhou Bay. This study has used the HY-1C, HY-1D, GF-1 satellite data, with 50 m’ spatial resolution and 16 m’ spatial resolution, respectively. This paper studies the details of the Qiantang River tidal line and the changes in marine environmental elements on both sides of the tidal line, including suspended substance concentration and sea surface texture details. The research objectives include two aspects: firstly, developing algorithms for extracting high resolution tidal information from the Qiantang River; secondly, to study the impact of the Qiantang River spring tide on the water environment of Hangzhou Bay, reveal the details of changes in the sea surface hydrodynamic environment and suspended substance concentration on both sides of the tidal line, and analyze the mechanism of the Qiantang River tidal bore’s impact on the water environment.
2. Materials and Methods
2.1. Study Area
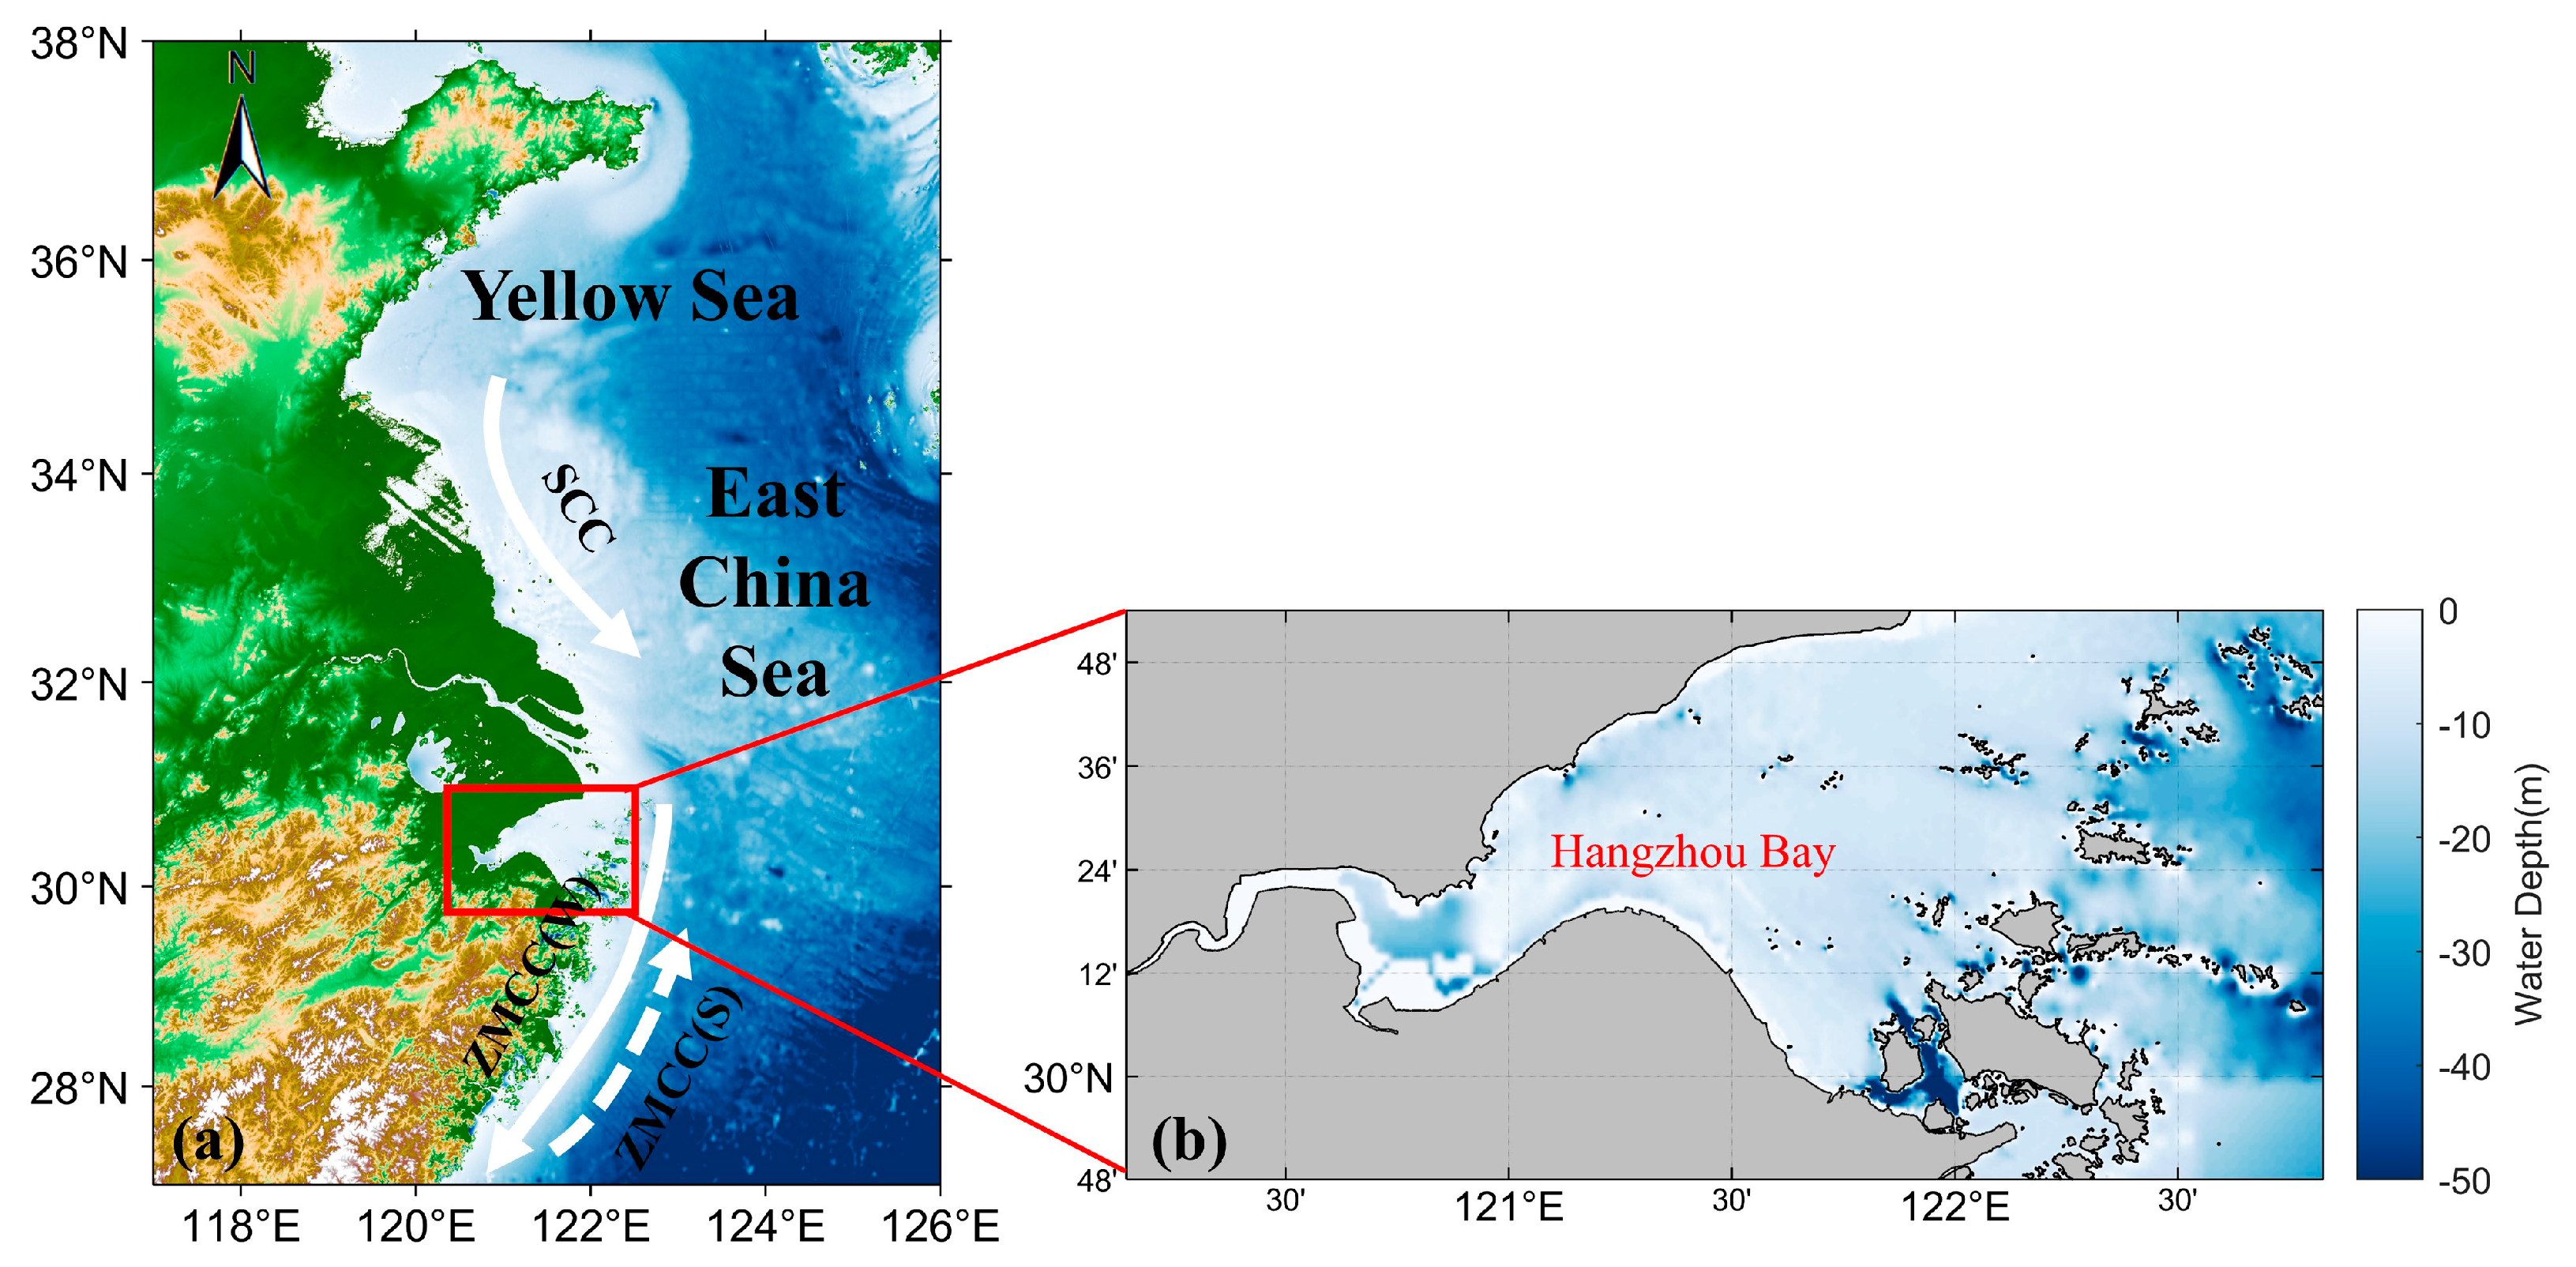
Hangzhou Bay is situated approximately between 29.5°–32°N and 120.5°–123°E in the East China Sea (Figure 1). Adjacent to the estuary of the Yangtze River to the north, which is the longest river in China, the western part of Hangzhou Bay constitutes the estuary of the Qiantang River, flowing across the northwest of Zhejiang Province. The bay resembles a trumpet in shape, with a width ranging from about 21 km at the narrowest estuary to approximately 100 km at the trumpet mouth. Hangzhou Bay has an average depth of approximately 10 m and covers a total water area of about 5000 km2. The Qiantang River estuary is a typical tidal estuary, influenced by both river discharge and tidal currents [39]. In the estuary, suspended sediments are transported and circulated, showing significant temporal variations in response to the ebb and flow of tidal bores [40,41].
The Qiantang River tidal bore is a distinctive feature resulting from the funneling of the flood tidal wave into Hangzhou Bay, surging more than a hundred kilometers upstream at a rapid speed of 20–30 km per hour [29]. Beyond its captivating nature, the tidal bore plays a pivotal role in controlling the morpho dynamics and sediment transport within the estuary [42].
2.2. Satellite Data
HY-1C and HY-1D are satellites launched by China on 7 September 2018 and 11 June 2020, respectively, both carrying CZI visible payloads. The successful launch of HY-1C marked the beginning of a new era of integrated land and sea development of China’s natural resource satellites [39,43]. The subsequent launch of HY-1D was coupled with it to form a two-star observation network, providing morning and afternoon coverage. The CZI payload of HY-1C/D provides 50 m high-resolution imagery covering commonly used wavelength bands, including visible and near-infrared (NIR). It has a wide ground swath width of about 950 km, with a 3-day time period for data acquisition and free access. Table 1 shows the detailed wavelength settings of the HY-1C/D CZI payload.
GF-1 is a Chinese high-resolution Earth observation satellite launched by the China National Space Administration (CNSA) on 26 April 2013. This satellite is equipped with the GF-1 WFV sensor, which possesses advanced multispectral imaging capabilities for Earth observation. GF-1 WFV’s spatial resolution is 16 m, and temporal resolution is 4 days. The sensor has a moderate spatial resolution, usually ranging from 16 m to 64 m, enabling the capture of coarse features on the Earth’s surface and supporting large-scale surface coverage monitoring. With wavelength settings spanning the visible and NIR bands, the sensor acquires essential multispectral data crucial for diverse applications, including land-use classification, environmental monitoring, and agricultural resource management [44]. Detailed wavelength settings for the GF-1 WFV sensor are outlined in Table 1.
2.3. Data Processing
2.3.1. Data Preprocessing
The preprocessing of HY-1C, HY-1D, and GF-1 WFV data involves three key steps: radiometric calibration, atmospheric correction, and orthorectification [30,43].
Radiometric Calibration: This step converts raw Digital Number (DN) values recorded by the sensors into ground object radiation values. It eliminates sensor errors, ensuring accurate radiation values at the sensor entrance.
Atmospheric Correction: This correction mitigates the effects of atmospheric interference on surface reflectance, enabling the accurate extraction of true spectral characteristics. This process utilizes atmospheric correction models and radiative transfer theory, accounting for parameters such as atmospheric spectral characteristics, surface reflectance, and atmospheric conditions. In this study, the accurate remote sensing reflectance results from atmospheric corrections that include Rayleigh and aerosol scattering corrections [45].
Orthorectification: This process projects remotely sensed images from a spherical or ellipsoidal surface onto a planar map, eliminating topographic effects and image distortions. Utilizing a Digital Elevation Model (DEM), each pixel of the image is accurately mapped to its corresponding position on the Earth’s surface through geometric corrections and projection transformations. Orthorectification ensures the removal of terrain deformations and image distortions, guaranteeing geospatial accuracy and comparability of the image.
2.3.2. Inversion Model of the SSC in the Qiantang River
In this paper, the two-band linear model of the red band and NIR band from a previous study, which was proven to be more sensitive to the SSC as verified in a previous study, was applied in this paper for SSC inversion based on HY-1C CZI data. The chosen linear model is an inversion algorithm tailored for high turbidity waters in Hangzhou Bay, with verified feasibility. The inversion of the distribution of suspended matter concentration in Hangzhou Bay is consistent with the distribution of suspended matter concentration in this area in previous studies [46,47].
where SSC is the concentration of suspended sediment in mg/L, and represents the value of the red band and NIR band obtained after atmosphere correction, respectively.
2.4. Methods of Extracting Qiantang River Tidal Bore
2.4.1. The Exploration of Qiantang Tidal Sensitive Band
In order to judge the sensitive wave bands, we visualize the satellite wave band data. We present a visualization of the band reflectance data within the tidal line region, depicted in Figure 2, to provide a comprehensive understanding of the spectral changes in this dynamic environment. Firstly, the specific methodology employed for generating the three-dimensional map of band reflectance was given further elucidation. Detailing the techniques used, such as data processing procedures, would facilitate replication and comprehension by readers. Additionally, while the visualization offers an intuitive insight into the numerical variations across bands within the tidal bore region, a more thorough interpretation of these variations in relation to environmental factors or phenomena could enrich the discussion. Furthermore, incorporating comparative analyses with previous studies or alternative methodologies could strengthen the validity and robustness of the findings. By addressing these aspects, the article can achieve greater clarity, depth, and scientific rigor in its exploration of band reflectance dynamics in tidal environments.
We can identify the sensitive bands of the satellite data based on the tidal line position band data compared to the surrounding data. Analysis indicates that the fluctuations in values proximate to the tidal line within the blue, green, and red bands of the HY-1C image are relatively minor, with magnitudes ranging between 0.11, 0.12, and 0.14, respectively (refer to Figure 2(A1–A3)). Initially, elucidating the significance of these fluctuations in the context of remote sensing observations in tidal environments would be beneficial. An elaboration on the potential causes or implications of these variations, such as their correlation with environmental parameters or relevance to tidal dynamics, would deepen understanding. Furthermore, including statistical analyses, like measures of variability or significance testing, would quantitatively support the observed fluctuations. Moreover, comparative assessments with similar datasets or alternative methodologies could provide insights into the consistency and reliability of the trends observed. By addressing these aspects, the analysis can be refined to offer a more comprehensive and robust interpretation of the fluctuations in band values near the tidal line in the HY-1C image. The NIR band values fluctuate considerably near the tidal line, with a range exceeding 0.15 (Figure 2(A4)), indicating greater sensitivity of the HY-1C image to the NIR band.
In the HY-1D image, marginal fluctuations are observed in the blue and green bands near the tidal line, with values ranging between 0.15 and 0.13 (refer to Figure 2(B1,B2)). Conversely, the red and NIR bands exhibit more pronounced variations, with the red band fluctuating at 0.15 (Figure 2(B3)), and the NIR band approaching 0.2 (Figure 2(B4)). These observations suggest a differential sensitivity of the HY-1D image to various spectral bands. Firstly, elucidating the potential factors driving the observed fluctuations, such as atmospheric conditions, sensor characteristics, or environmental variability, would provide valuable context for interpreting the results. Furthermore, comparing these findings with those from the HY-1C image or other relevant datasets could offer insights into the consistency and generalizability of the observed trends. Additionally, discussing the implications of these sensitivity variations in terms of data interpretation or monitoring applications would enrich the discussion and enhance the practical relevance of the findings. By addressing these aspects, the analysis can be refined to provide a more comprehensive understanding of the sensitivity of the HY-1D image to different spectral bands near the tidal line.
In the analysis of the GF-1 image, it is noted that the fluctuation range of the blue band near the tidal line is minimal (refer to Figure 2(C1)), contrasting with the higher fluctuations observed in the other three bands (Figure 2(C2–C4)). This observation suggests a differential sensitivity among the spectral bands. Firstly, a more explicit explanation of what constitutes ‘small’ and ‘higher’ fluctuations, preferably quantified through statistical measures or comparative analyses, would provide a clearer understanding of the observed trends. Moreover, elucidating the potential factors contributing to these variations, such as atmospheric conditions, sensor characteristics, or environmental dynamics, would offer valuable context for interpreting the results. Additionally, discussing the implications of band sensitivity in relation to the objectives of the study or broader remote sensing applications would enrich the analysis.
To further identify sensitive bands near the Qiantang River tidal bore, reflectance values near the Qiantang River tidal bore were compared for the four bands (Table 2, Table 3 and Table 4). Firstly, one sampling point was identified on the Qiantang River tidal bore, and other two sampling points were identified as a group of sampling points at the symmetric position of the tidal bore; these three points are considered as a set of sample points. The three satellites identified 15, 10, and 15 sets of sampling points, respectively (Table 2, Table 3 and Table 4), and the mean of the difference between neighboring sampling points in each group was calculated. Finally, the average difference in the data in a band group was derived. The larger the band difference, the more sensitive the band is.
In the HY-1C image, we calculate the band data difference to obtain Table 2. The average differences in band 1, band 2, and band 3 are 0.00136, 0.00151, and 0.00485, respectively, which are much smaller than the average difference in band 4. It can be concluded that band 4 in the HY-1C image is more sensitive than band 1, band 2, and band 3 in discriminating the Qiantang River tidal bore. Therefore, the proportion of band 4 can be appropriately increased in the extraction process of Qiantang River tidal bore in HY-1C images.
In the HY-1D image, we calculate the band data difference to obtain Table 3. The average differences in band 1 and band 2 are 0.00829 and 0.01368, which are smaller than the average differences in band 3 and band 4. It can be concluded that band 3 and band 4 in the HY-1D image are more sensitive than band 1 and band 2 in discriminating the Qiantang River tidal bore. Therefore, the proportion of band 3 and band 4 can be appropriately increased in the extraction process of Qiantang River tidal bore in HY-1D images.
In the GF-1 WFV images, we calculate the band data difference to obtain Table 4. The average differences in band 1, band 2, and band 3 are 65.3, 129.1, and 147.2, respectively, which are much smaller than the average difference in band 4. It can be concluded that band 4 in the GF-1 WFV image is more sensitive than band 1, band 2, and band 3 in resolving the Qiantang River tidal bore. Therefore, the proportion of band 4 can be appropriately increased in the extraction process of Qiantang River tidal bore from GF-1 WFV images.
2.4.2. Tidal Texture Extraction Method
The texture information of remote sensing images can reflect the spatial correlation of pixels, and the Grey-Level Co-occurrence Matrix (GLCM) is a commonly used texture statistical analysis method based on the second-order probabilistic statistical filtering to describe the texture features [48,49]; it describes the grey-level change in the image in a certain direction of the image pixels, which can be directly specific to the texture features in each angular direction, and it can be realized that the texture feature values are visualized in the image, and texture feature statistics are computed through the matrix thus providing a quantitative statistic and evaluation of the texture.
In this study, we used ENVI software to perform the calculations, with the sliding window size set to 3 × 3 and the grayscale quantization level set to 16 bits. Then, the following three texture features were extracted using the computed GLCM: energy (angular second moment), entropy, and correlation. The formulas for calculating the texture features are as follows [49].
where i, j are the pixel values represented by the index in the GLCM, p(i, j) is the element value of row i and column j in the GLCM.
3. Results
3.1. Tidal Bore Information Extracting from HY-1C/D CZI, GF-1 WFV
We have developed a Qiantang River tidal bore extraction method based on band calculation. As identified in the analysis in Section 2.4.1, band 4 of HY-1C, HY-1D, and GF-1 WFV satellite images is determined to be the sensitive band for detecting the Qiantang River tidal bore. Utilizing the band characteristics of the satellite images, we combine and calculate the four bands. By increasing the weight of the sensitive bands, various band combinations are tested in ENVI to extract the Qiantang River tidal bore, resulting in the construction of the Qiantang River tidal bore extraction model (QRI).
Several different band combinations are attempted, and through the comparison of various extraction models (Figure 3), it is observed that QRI1 (5) and QRI2 (6) exhibit the most effective extraction performance in HY-1C/D and GF-1 WFV images, respectively.
where B1, B2, B3 and B4 represent the value of the blue band, green band, red band, and NIR band obtained after atmosphere correction from the HY-1C/D, GF-1 WFV fusion image, respectively.
In order to verify the feasibility of the QRI, we validated it using the grey value difference as a test criterion. The validation method is as follows. The DN value of the satellite image processed by QRI is converted to the range of 0–100 by Equation (7). In the Qiantang River tidal bore region, 20 groups of symmetric points were selected, and each group of point pairs consisted of equidistant vertically symmetric tidal bore; the DN difference was obtained by the absolute value of the DN difference in each group of symmetric points. The DN differences were averaged to obtain the mean values corresponding to the different methods.
We performed percentage conversion for each set of difference data and selected the models with higher percentage data for comparison. As shown in Figure 3, the best extracted QRI1 and QRI2 values were ranked higher among them with the value of 94.2% and 96.8%, respectively, which also verifies the feasibility of our extraction model.
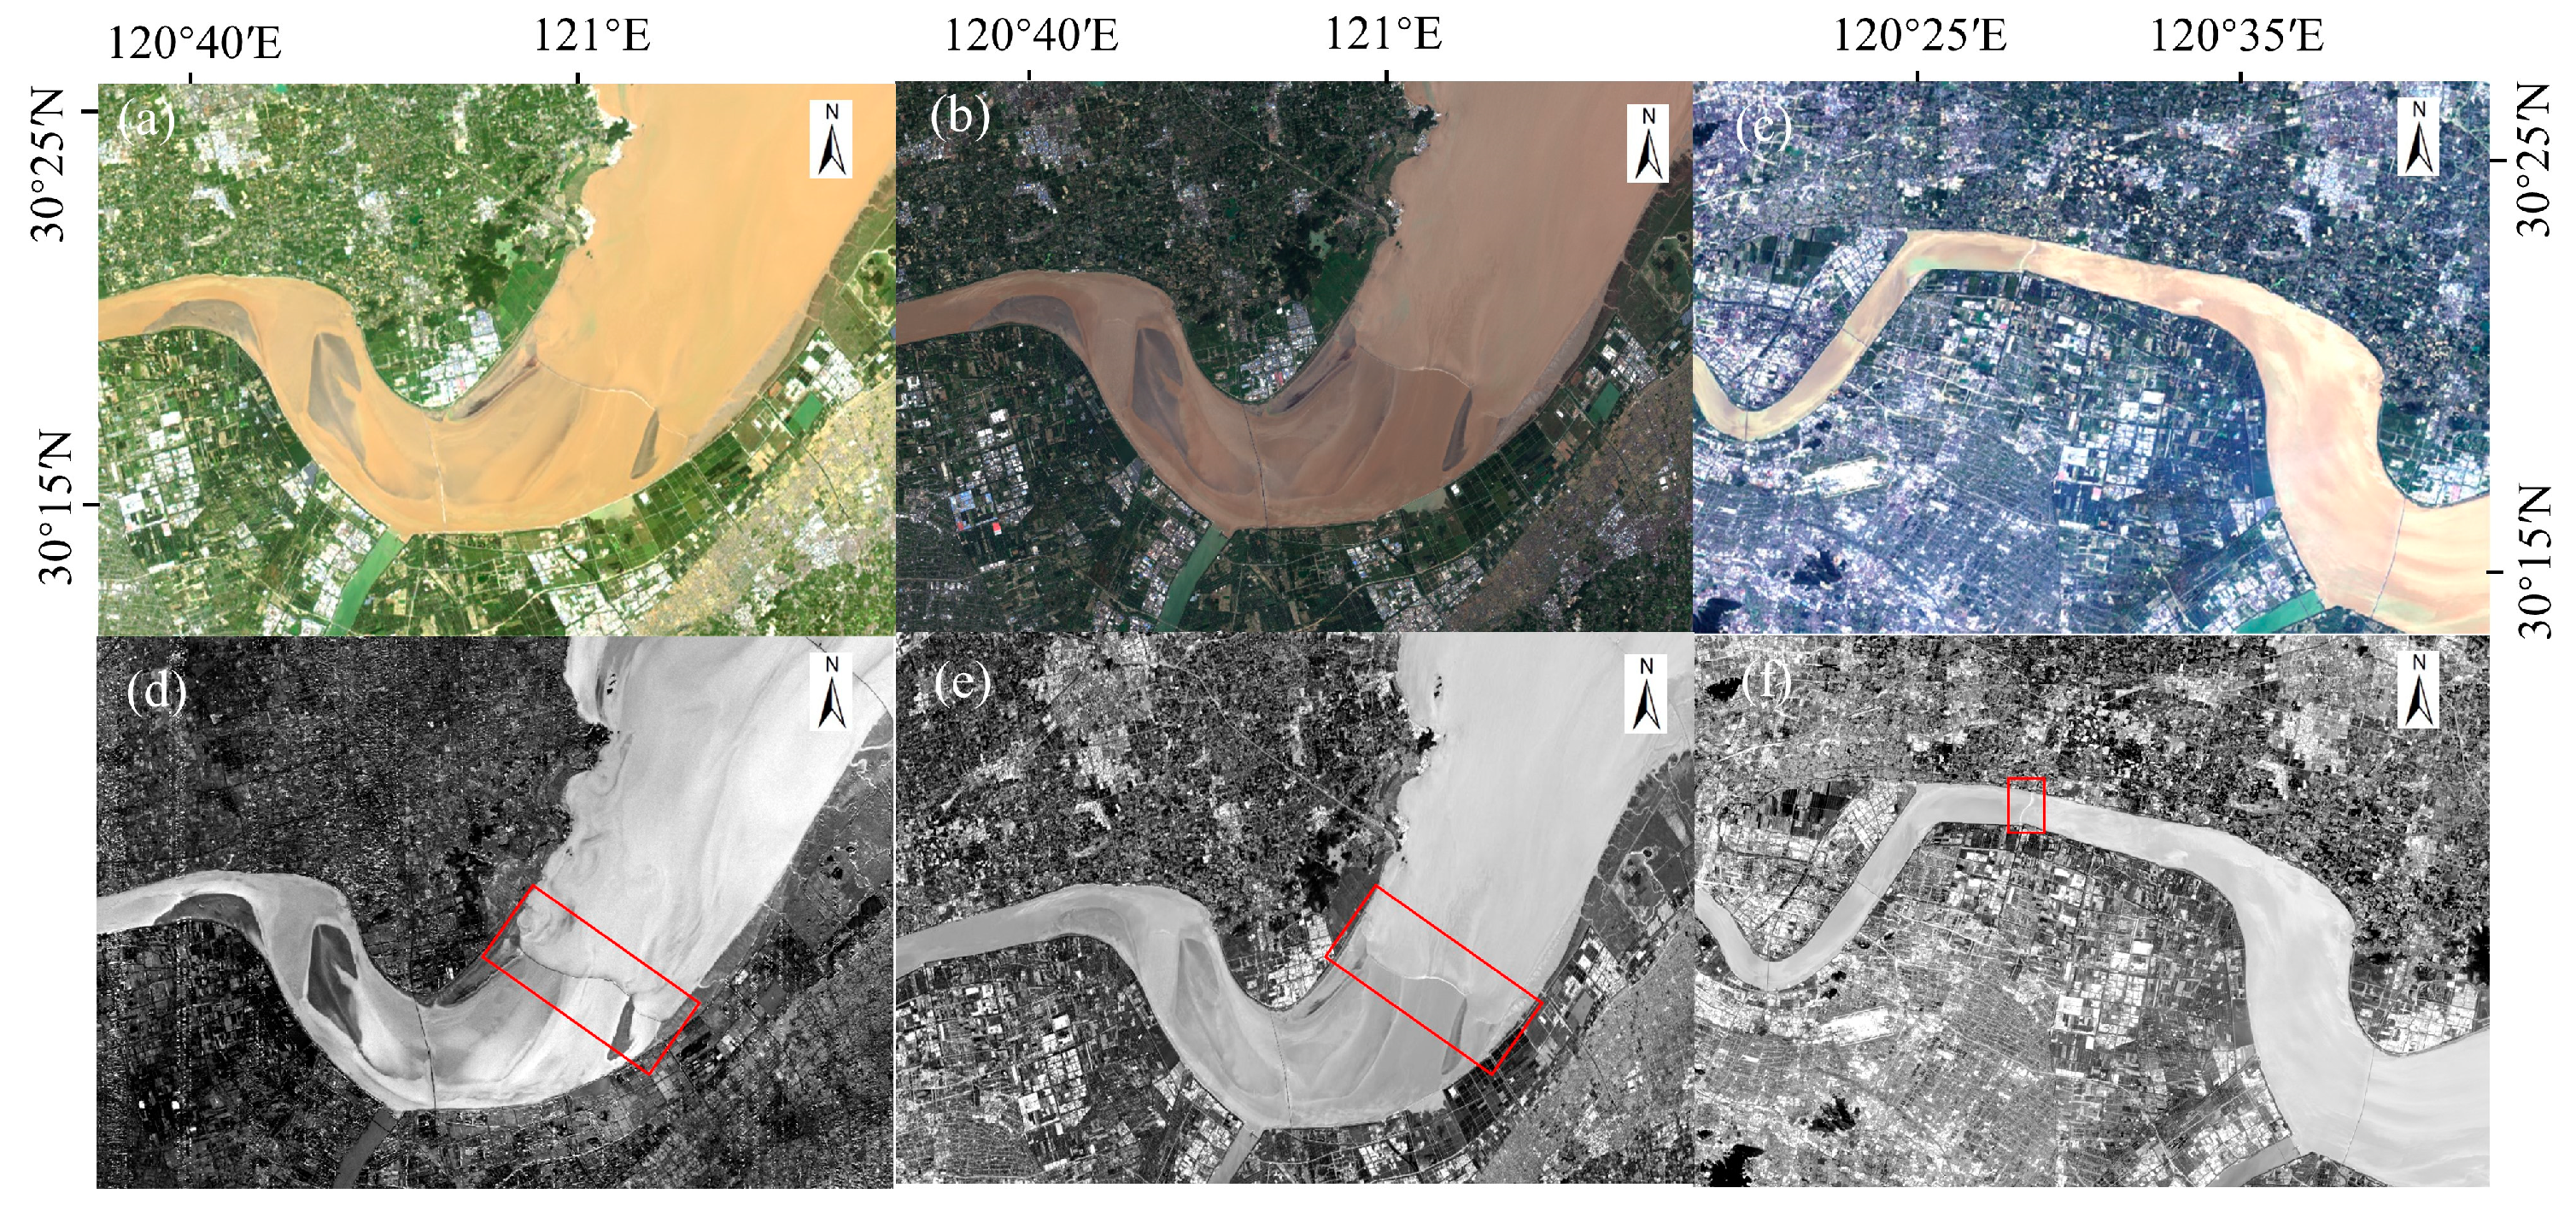
It can be found that the color of the tidal bore line in Figure 4e,f is brighter and contrasts with the grey color of the surrounding river water, which is more obvious in the image. The tidal bore lines in Figure 4d are rougher and darker in color, which contrasts with the surrounding smooth and bright river water, thus achieving the extraction effect.
Among the three extraction effects, it can be seen that Figure 4d has the best extraction effect, and the contrast between the tide line and the surrounding river water is the most obvious. These data are GF-1 WFV satellite image data, using the QRI2 extraction algorithm, and have the advantages of higher resolution and more obvious color difference than the other two kinds of data.
3.2. The Change in Water Surface Roughness Induced by the Qiantang River Tidal Bore
To observe the variations in sea surface water roughness before and after the scouring caused by the Qiantang River tidal bore, we conducted additional statistical processing on the GLCM of images capturing the Qiantang River tidal bore. The secondary statistical measures obtained were then utilized as texture features for the images, as illustrated in Figure 5.
Figure 5 presents two sets of Qiantang River tidal bore extraction results alongside the outcomes derived from statistical processing using GLCM. Notably, there is a robust positive correlation between the entropy value and roughness, indicating that areas with higher entropy values exhibit greater roughness (Figure 5a,c,e). Additionally, the energy value reflects the complexity of image information, with higher energy values corresponding to more intricate textures (Figure 5b,d,f).
From Figure 5, it is discernible that the entropy values of the areas scoured by the tidal bore are higher than those of the areas unaffected by the tidal bore (Figure 5a,c,e). In other words, the roughness of the areas scoured by the tidal bore is higher than that of the unaffected areas. This substantiates that the Qiantang River tidal bore significantly influences the scouring of river water, yielding a noteworthy impact on the overall dynamics of river water.
Figure 6 shows the distribution of entropy and energy values extracted from remote sensing images of the Qiantang River tidal bore. Figure 6a,c,e display the upstream and downstream distribution of entropy values from satellite images, indicating minimal differences between the values on either side of the tidal bore, with many values being very close and most upstream values being higher than downstream values. Figure 6b,d,f illustrate the distribution of energy values extracted from satellite images of the Qiantang River tidal bore, showing similar trends in value changes on both sides of the tidal bore, with relatively higher values in the upstream region.
3.3. The Change in SSC Induced by the Qiantang River Tidal Bore
The distribution of SSC in Hangzhou Bay is obtained by retrieval using HY-1C CZI satellite data (Figure 7). It is found that there was significant variability in the spatial distribution of SSC in the study area, and the suspended sediment was generally high in the Hangzhou Bay region, with most of the concentration ranges in the inner portion of the bay exceeding 1000 mg/L. The SSC in the study area was also significantly different from that in the inner portion of the bay. In addition, the SSC in the study area varied with the movement trend of the tidal bores.
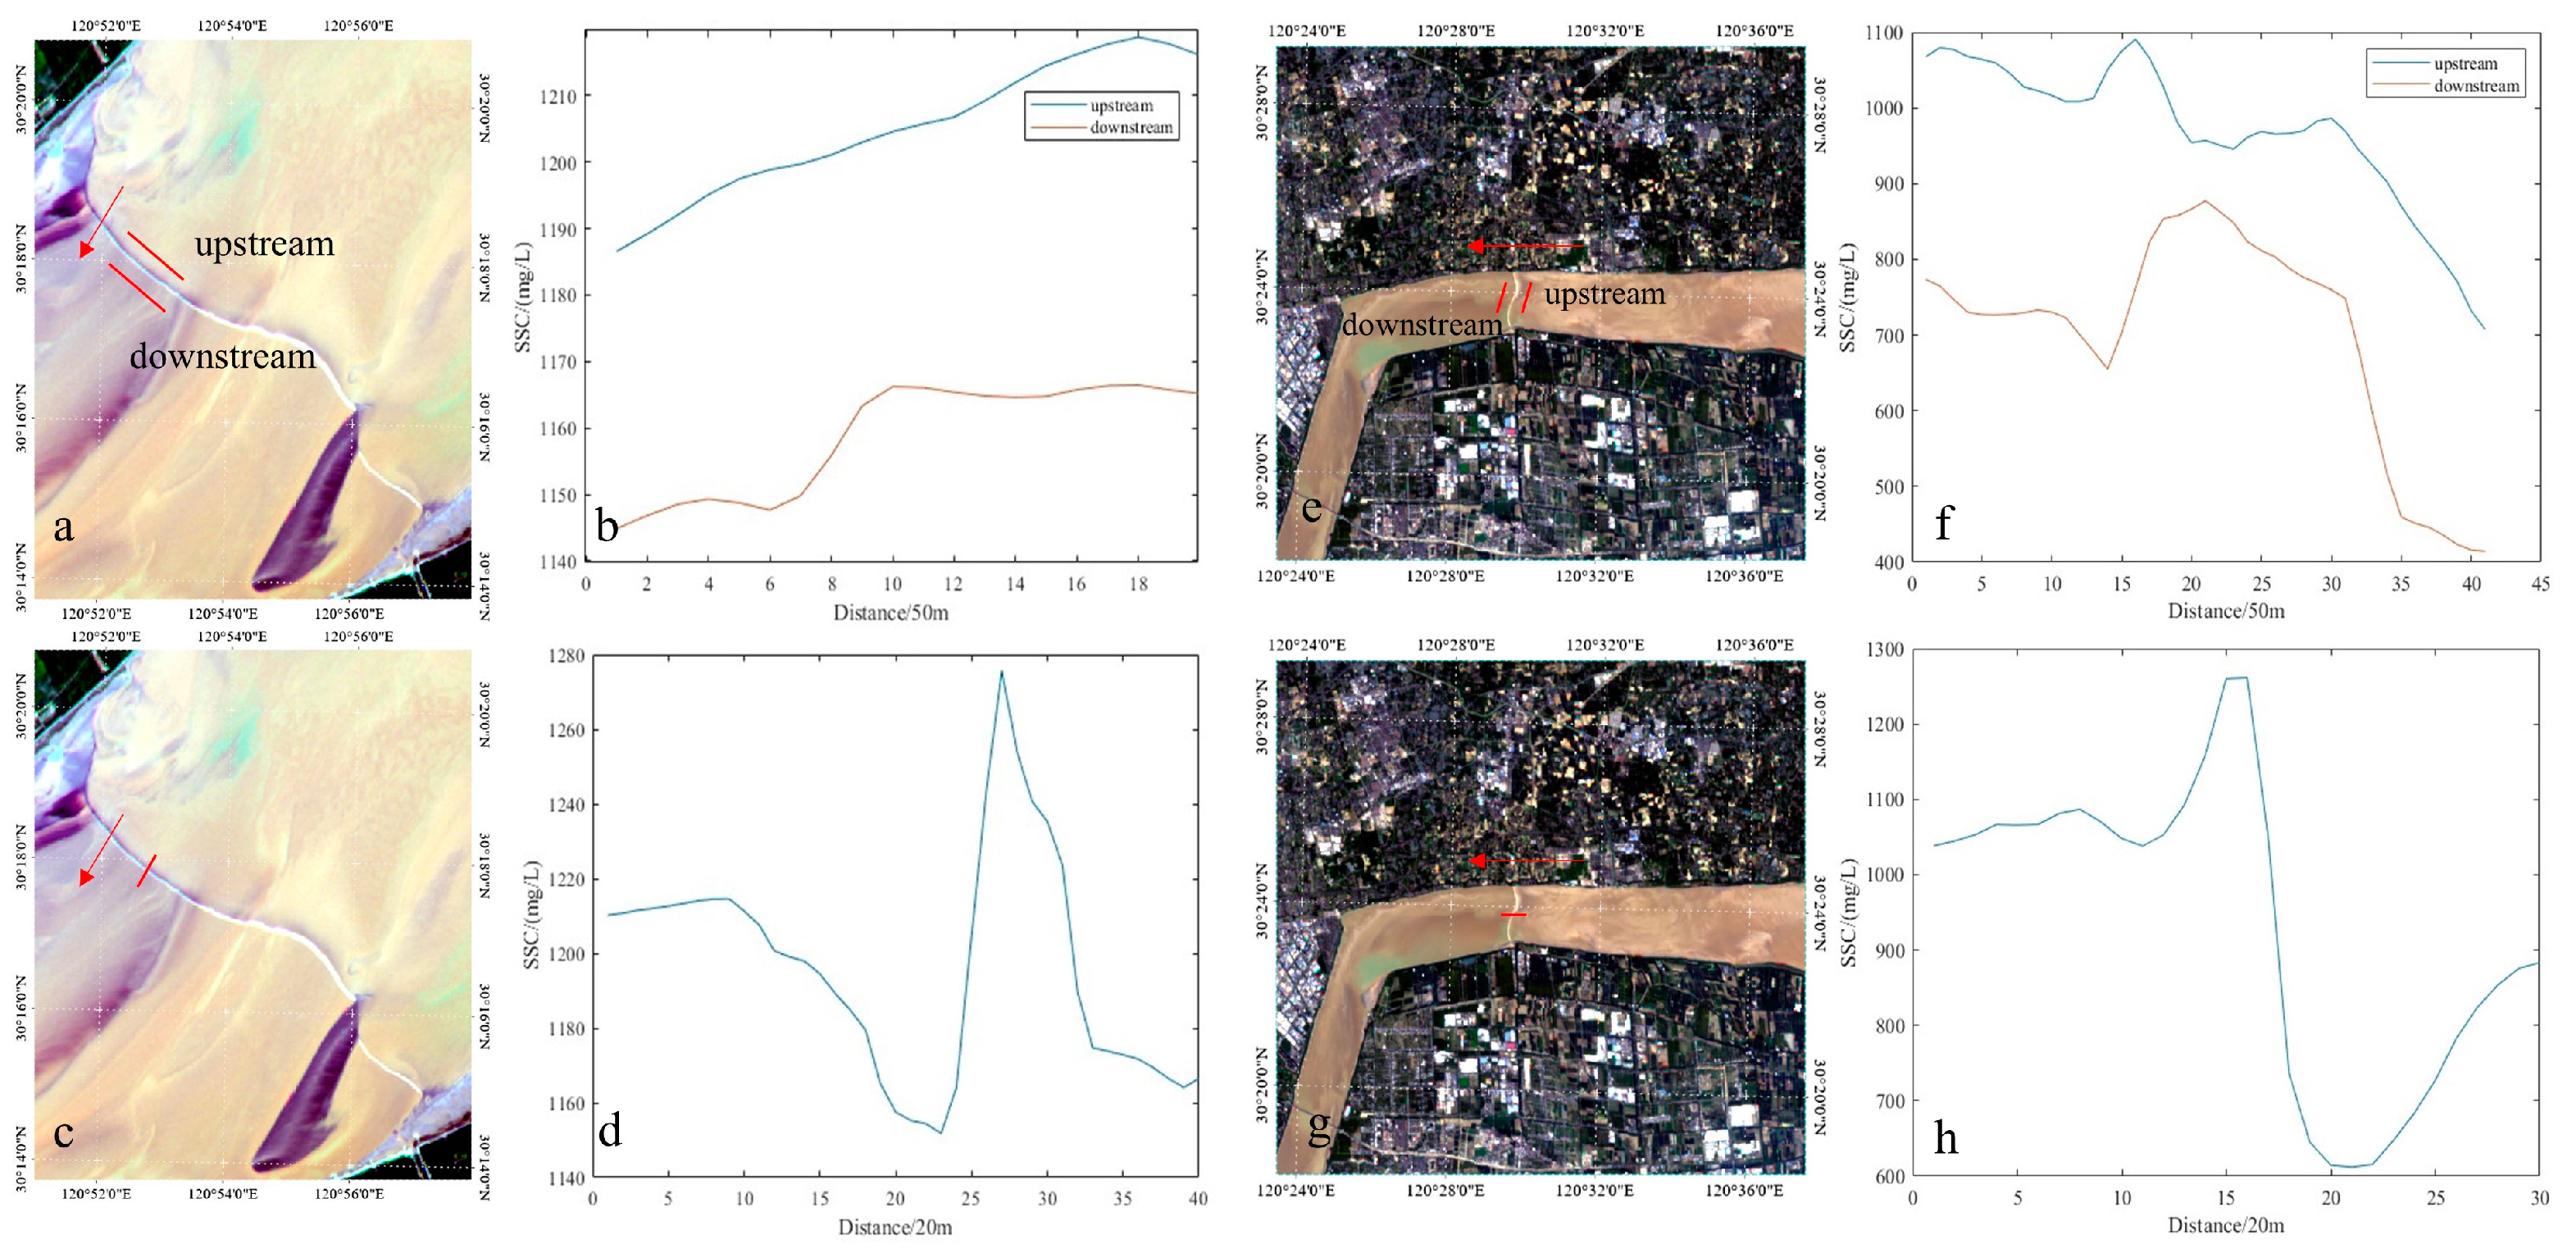
To assess the changes in suspended sediment concentration before and after the tidal bore, we conducted a profile analysis presenting the variation in suspended sediment concentration in graphical form (Figure 8). A comparison was made between the SSC behind the tidal line in the area where the tidal bore passed through and the area in front of the tidal line of the Qiantang River.
Profiles were generated from both sides of the tidal line (Figure 8b,f), revealing a notable difference in SSC between the upstream and downstream areas. The SSC in the upstream area was significantly higher than that in the downstream area. Simultaneously, when profiles were selected in the direction of the tide (Figure 8d,h), a clear decreasing trend of SSC downstream along the direction of the tide was observed. This analysis provides insights into the spatial distribution of suspended sediment concentration before and after the tidal bore, illustrating its impact on sediment dynamics along the Qiantang River.
Observable roughness changes occur at the tidal bore location, with smoother surface textures observed in front of the tidal line compared to those behind it. There is a discernible increase in SSC as the tidal bore passes through. When the Qiantang River high tide occurs, the tidal bore surges from the east side to the west side through the Qiantang River, from deep water to shallow water, scouring the bottom of the river and causing sediments in suspension, which in turn increases the concentration of suspended sediment. At the same time, the tidal bore promotes the vertical exchange of the water body, causing disturbance of the sea surface, which in turn enhances the texture roughness of the sea surface.
4. Discussion
4.1. Applicability of QRI for Qiantang River Tidal Bore Extraction
With the popularization and wide application of remote sensing images, optical remote sensing plays an important role in extracting information extraction of water bodies, coastlines, tidal flats, and sandbanks [50,51,52]. In all these extraction methods, water body information can be extracted more accurately.
In this paper, we determined the tidal line sensitive bands by the method and found that the NIR bands were more sensitive at the tidal line location. Therefore, we selected bands such as the NIR band as the tide line sensitive bands and established QRI based on the sensitive bands. After validation, it was found that the extraction accuracy was high, up to more than 90%.
Compared with previous studies [53,54], the model proposed in this paper can be used in a more complex tidal surge environment. This model is simpler in composition, more convenient in use, and more efficient in calculation. Others’ models are more complex and less efficient. This model has a higher extraction success rate, and the success rate of GF-1 WFV can reach more than 90%. Other models do not have the same success rate. However, the extraction type is relatively simple, and only the first tide is extracted at present. It is limited by time and space, such as rainy days and clouds, which cause major obstacles to research.
4.2. Mechanisms of Tidal Bore Impacting on the Water Environment
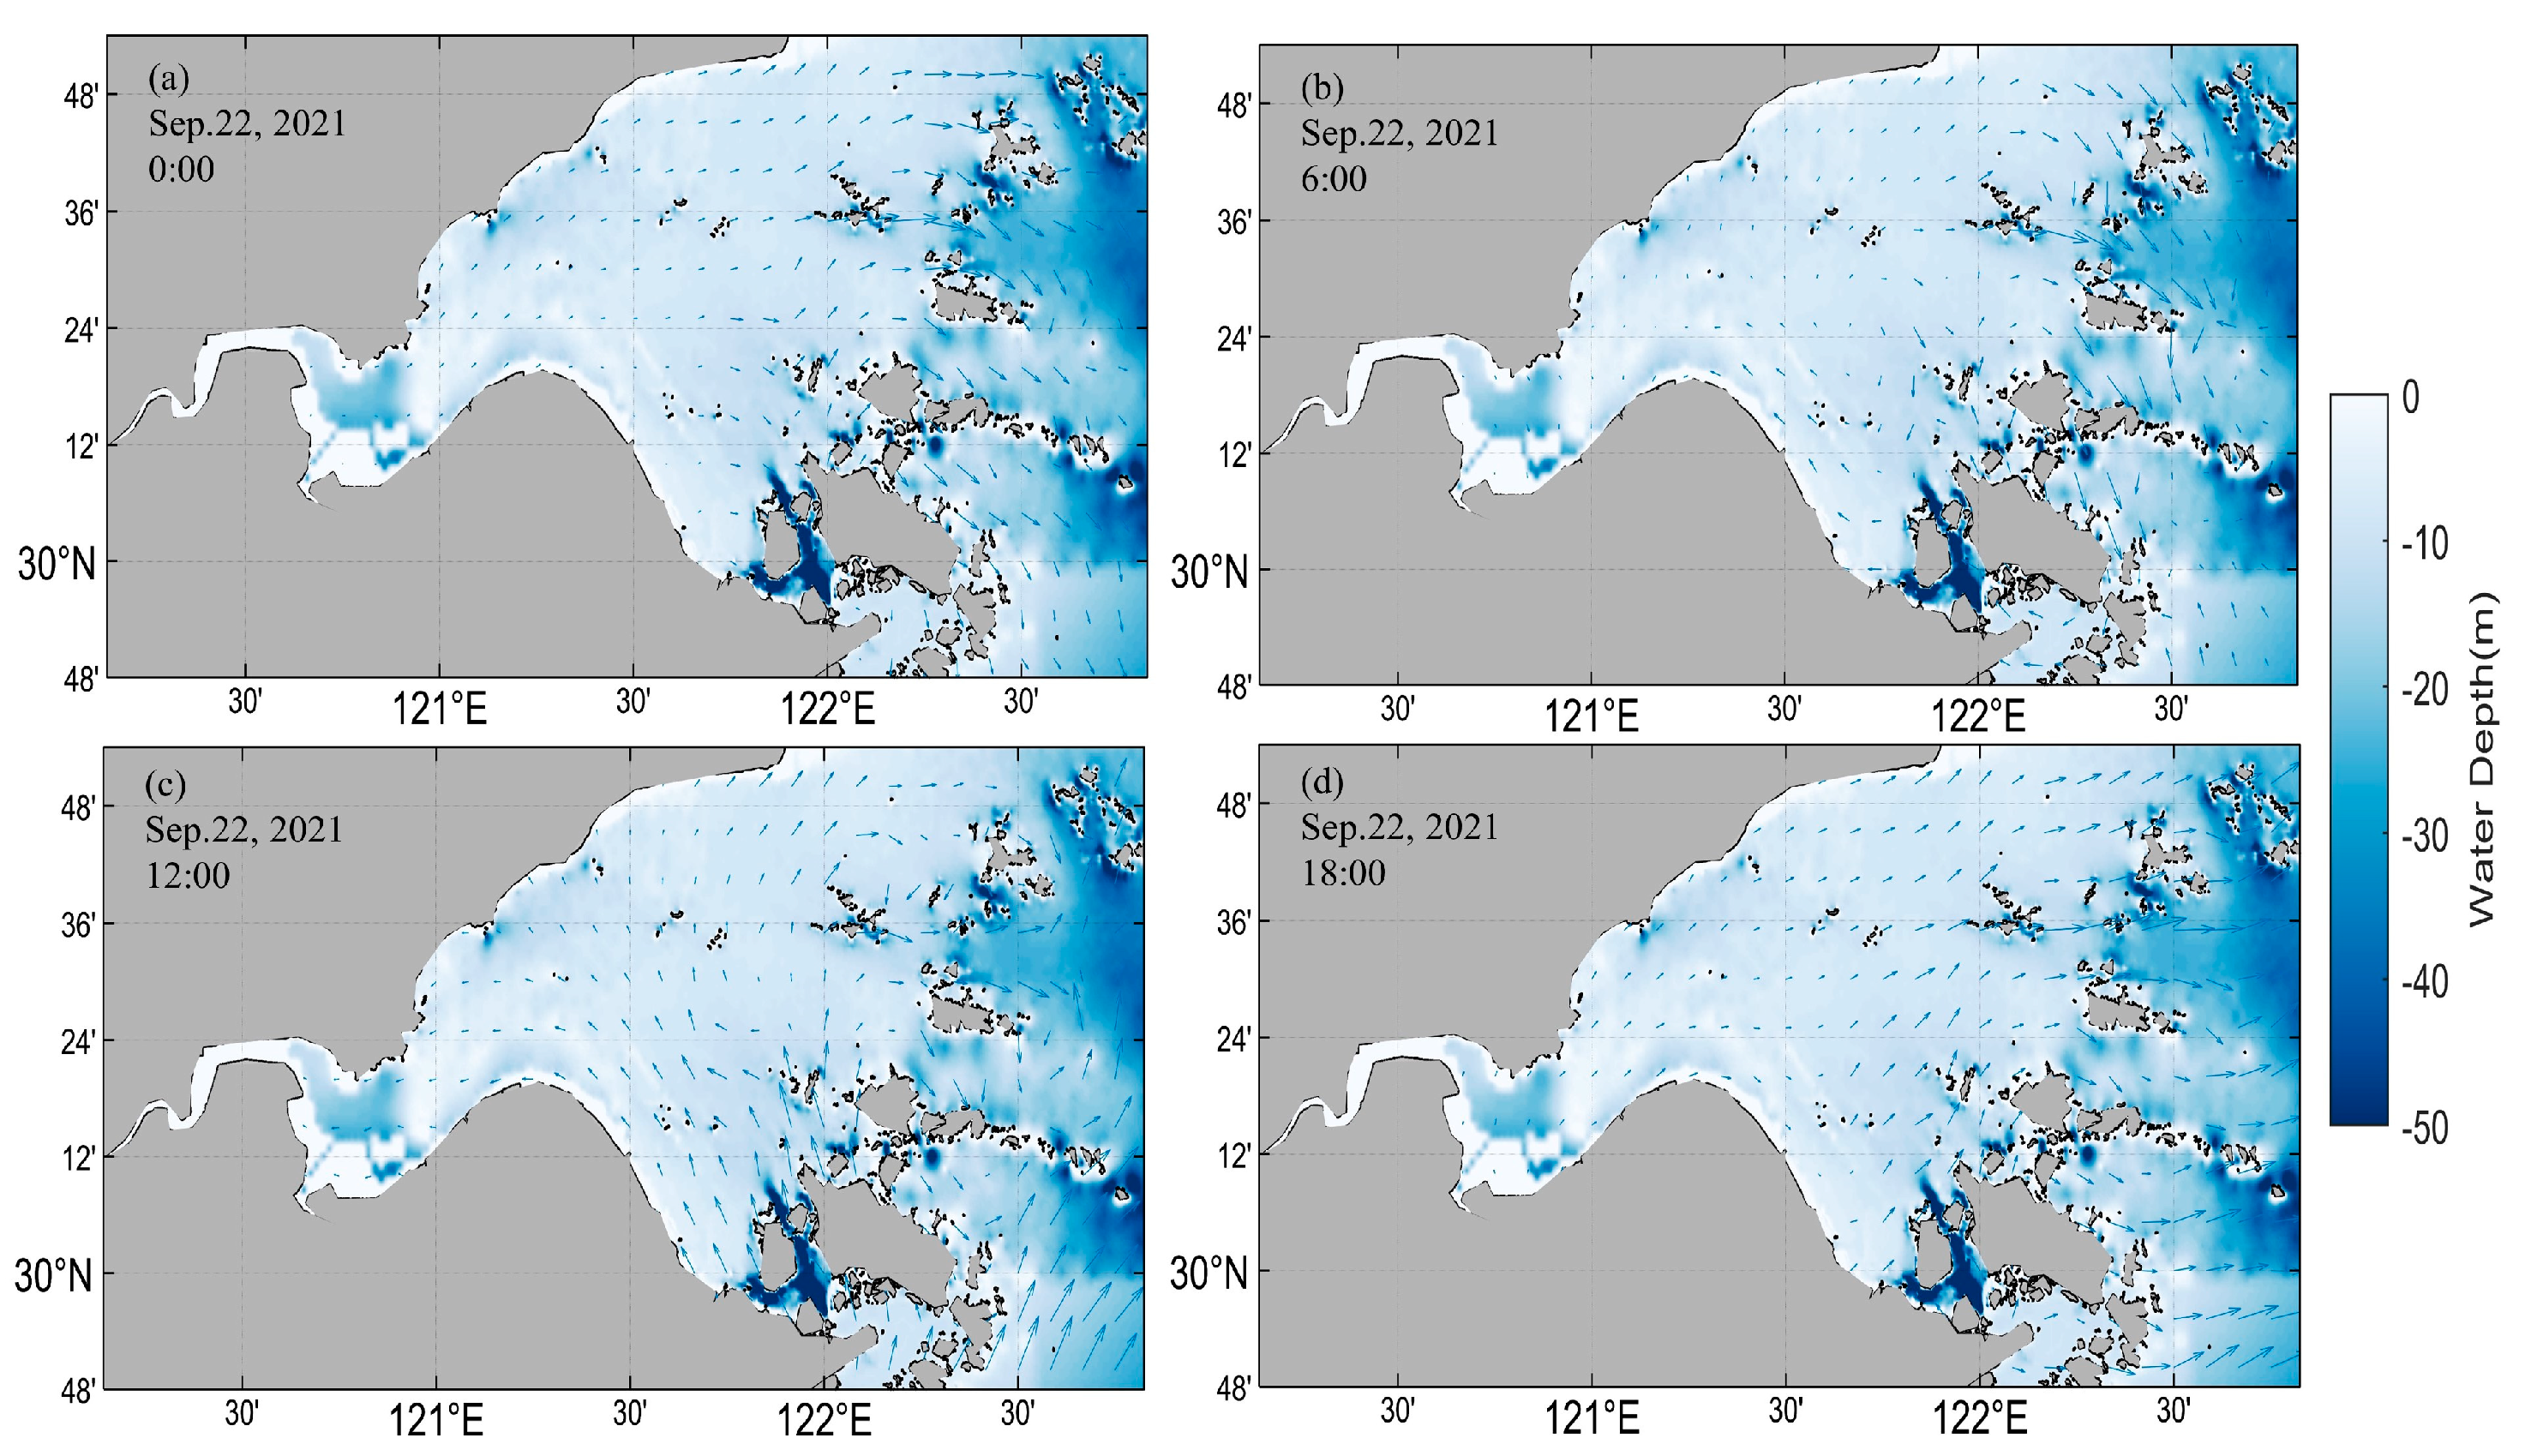
The Qiantang River is closely geographically linked to Hangzhou Bay, which is the location of the estuary of the Qiantang River and the open water area where the Qiantang River flows into the East China Sea [55]. The tides in Hangzhou Bay show variable characteristics, and the main tidal types include semi-diurnal tides and full diurnal tides, and the two types of tides alternate, which has an impact on the tidal characteristics of the area. Figure 9 shows the tidal direction of Hangzhou Bay on 22 September 2021, for four time periods.
The Qiantang River tidal bore occurs mainly at the mouth of the Qiantang River [26], and changes in its tidal range can affect the ecology of the waters in the coastal areas and the fisheries industry, among other things. Due to the combined effect of the tides from Hangzhou Bay and the East China Sea, the Qiantang River tidal bore moves faster during climax, creating a swift tidal flow [56].
When the Qiantang River high tide occurs, the tidal bore surges from the east side to the west side through the Qiantang River, from deep water to shallow water, scouring the bottom of the river and causing sediments in suspension, which in turn increases the concentration of the suspended sediment [56,57]. At the same time, the tidal bore promotes the scouring of seabed and enhances the vertical exchange of the water body, causing more disturbance of the sea surface, which in turn induces the texture roughness of the sea surface.
The influence of the tidal bore on the surface roughness and suspended sediment concentration of river water is primarily achieved through the following two mechanisms: (a) Accelerated flow velocity and water level changes: During the tidal bore process, as seawater enters the river mouth, it is restricted by the narrowness of the river channel and friction at the bottom, leading to a sharp increase in flow velocity. This accelerated flow can cause turbulence at the water surface, thereby increasing its roughness. Concurrently, the rapid influx of seawater during the tidal bore process quickly raises the water level of the river, resulting in significant water level fluctuations, which in turn increases the wave action and roughness at the river surface. (b) Suspended sediment transport: The inrush of seawater during the tidal bore process carries a large amount of suspended sediment into the river channel. These sediments undergo processes such as suspension and deposition under the action of the flow during the tidal bore. The transport and deposition of suspended sediment alter the characteristics of disturbance and movement within the water body, affecting the surface roughness. Particularly at the crest of the tidal bore, where the flow velocity is at its maximum and sediment suspension is most intense, the surface roughness of the water is relatively higher.
Enhancing QRI with AI: Integrate machine learning to automate tidal bore detection in satellite images. Multi-Sensor Integration: Combine satellite data with ground and ocean sensors for comprehensive tidal analysis. High-Resolution Modeling: Develop detailed models to simulate tidal bore impacts on sediments and water quality. Global Application: Validate and apply the QRI model to other estuaries worldwide for broader insights. Environmental Impacts: Assess long-term effects of tidal bores on ecosystems and coastal processes. Climate Change Adaptation: Study tidal bore changes due to climate variations for future hazard prediction. Community Outreach: Engage local communities for environmental education and sustainable management practices.
5. Conclusions
In this study, HY-1C, HY-1D, and GF-1 WFV satellite data were used to extract the first-line tide of the Qiantang River tidal bore. A new tidal bore extraction model QRI was established to analyze the tidal line details. The roughness of the area washed by the tidal bore is higher than that of the area not washed by the tidal bore. Meanwhile, SSC in-creased obviously behind the tidal line as the tidal bore passed through, leading higher SSC upstream of the tidal line than that in front of the tidal line. The water environment change induced by the Qiantang River tidal bore mainly lies on its significant scouring effect on bottom sediments and promotes vertical water body exchange, contributing to increased SSC and surface roughness.
In the future, new satellite sensor technologies will be developed, such as microwave remote sensing technology, LiDAR technology, to obtain more precise surface elevation and water dynamic information. These technologies have higher spatiotemporal resolution and stronger transparency, enabling more accurate monitoring of tidal phenomena.
Author Contributions
Conceptualization, L.C. and H.Z.; methodology, L.C. and X.Y.; software, H.Z. and X.Y.; validation, H.Z., X.Y. and J.Y.; formal analysis, X.Y. and R.T.; investigation, H.Z. and J.Y.; resources, L.C.; data curation, H.Z.; writing—original draft preparation, L.C., H.Z. and X.Y.; writing—review and editing, H.Z. and R.T.; project administration, X.Y.; funding acquisition, L.C. All authors have read and agreed to the published version of the manuscript.
Funding
This work is supported by the following research projects: Basic Public Welfare Research Program of Zhejiang Province (LGF21D010004); the Science Foundation of Donghai Laboratory (DH-2022KF01010).
Data Availability Statement
Publicly available datasets were analyzed in this study.
Acknowledgments
The authors would like to thank the China Centre for Resources Satellite Data and Application for providing the GF satellite data.
Conflicts of Interest
The authors declare no conflicts of interest.
References
- Chanson, H. Environmental, ecological and cultural impacts of tidal bores, benaks, bonos and burros. In Proceedings of the International Workshop on Environmental Hydraulics: Theoretical, Experimental and Computational Solutions, Valencia, Spain, 29–30 October 2009; pp. 1–20. [Google Scholar]
- Tierney, C.C.; Kantha, L.H.; Born, G.H. Shallow and deep water global ocean tides from altimetry and numerical modeling. J. Geophys. Res. Ocean. 2000, 105, 11259–11277. [Google Scholar] [CrossRef]
- Egbert, G.D.; Ray, R.D. Significant dissipation of tidal energy in the deep ocean inferred from satellite altimeter data. Nature 2000, 405, 775–778. [Google Scholar] [CrossRef] [PubMed]
- Cartwright, D.E.; Ray, R. Oceanic tides from Geosat altimetry. J. Geophys. Res. Ocean. 1990, 95, 3069–3090. [Google Scholar] [CrossRef]
- Murray, N.J.; Phinn, S.R.; DeWitt, M.; Ferrari, R.; Johnston, R.; Lyons, M.B.; Clinton, N.; Thau, D.; Fuller, R.A. The global distribution and trajectory of tidal flats. Nature 2019, 565, 222–225. [Google Scholar] [CrossRef]
- Wang, C.; Liu, H.-Y.; Zhang, Y.; Li, Y.-F. Classification of land-cover types in muddy tidal flat wetlands using remote sensing data. J. Appl. Remote Sens. 2014, 7, 073457. [Google Scholar] [CrossRef]
- Whyte, A.; Ferentinos, K.P.; Petropoulos, G.P. A new synergistic approach for monitoring wetlands using Sentinels -1 and 2 data with object-based machine learning algorithms. Environ. Model. Softw. 2018, 104, 40–54. [Google Scholar] [CrossRef]
- Ryu, J.-H.; Won, J.-S.; Min, K.D. Waterline extraction from Landsat TM data in a tidal flat: A case study in Gomso Bay, Korea. Remote Sens. Environ. 2002, 83, 442–456. [Google Scholar] [CrossRef]
- Murray, N.; Phinn, S.; Clemens, R.; Roelfsema, C.; Fuller, R. Continental Scale Mapping of Tidal Flats across East Asia Using the Landsat Archive. Remote Sens. 2012, 4, 3417–3426. [Google Scholar] [CrossRef]
- Angeles, G.R.; Perillo, G.M.E.; Piccolo, M.C.; Pierini, J.O. Fractal analysis of tidal channels in the Bahía Blanca Estuary (Argentina). Geomorphology 2004, 57, 263–274. [Google Scholar] [CrossRef]
- Mason, D.C.; Scott, T.R.; Wang, H.-J. Extraction of tidal channel networks from airborne scanning laser altimetry. ISPRS J. Photogramm. Remote Sens. 2006, 61, 67–83. [Google Scholar] [CrossRef]
- Kelly, M.; Tuxen, K. Remote sensing support for tidal wetland vegetation research and management. In Remote Sensing and Geospatial Technologies for Coastal Ecosystem Assessment and Management; Springer: Berlin/Heidelberg, Germany, 2009; pp. 341–363. [Google Scholar]
- Magolan, J.L.; Halls, J.N. A Multi-Decadal Investigation of Tidal Creek Wetland Changes, Water Level Rise, and Ghost Forests. Remote Sens. 2020, 12, 1141. [Google Scholar] [CrossRef]
- Mahdavi, S.; Salehi, B.; Granger, J.; Amani, M.; Brisco, B.; Huang, W. Remote sensing for wetland classification: A comprehensive review. GIScience Remote Sens. 2017, 55, 623–658. [Google Scholar] [CrossRef]
- Amani, M.; Mahdavi, S.; Berard, O. Supervised wetland classification using high spatial resolution optical, SAR, and LiDAR imagery. J. Appl. Remote Sens. 2020, 14, 024502. [Google Scholar] [CrossRef]
- Mahdavi, S.; Salehi, B.; Amani, M.; Granger, J.; Brisco, B.; Huang, W. A dynamic classification scheme for mapping spectrally similar classes: Application to wetland classification. Int. J. Appl. Earth Obs. Geoinf. 2019, 83, 101914. [Google Scholar] [CrossRef]
- Kleinherenbrink, M.; Riva, R.; Frederikse, T. A comparison of methods to estimate vertical land motion trends from GNSS and altimetry at tide gauge stations. Ocean Sci. 2018, 14, 187–204. [Google Scholar] [CrossRef]
- Lee, J.K.; Lee, I.; Kim, J.O. Analysis on tidal channels based on UAV photogrammetry: Focused on the west coast, South Korea case analysis. J. Coast. Res. 2017, 79, 199–203. [Google Scholar] [CrossRef]
- Amani, M.; Moghimi, A.; Mirmazloumi, S.M.; Ranjgar, B.; Ghorbanian, A.; Ojaghi, S.; Ebrahimy, H.; Naboureh, A.; Nazari, M.E.; Mahdavi, S. Ocean Remote Sensing Techniques and Applications: A Review (Part I). Water 2022, 14, 3400. [Google Scholar] [CrossRef]
- Egbert, G.D.; Ray, R.D. Tidal prediction. J. Mar. Res. 2017, 75, 189–237. [Google Scholar] [CrossRef]
- Ray, R.D.; Zaron, E.D. Non-stationary internal tides observed with satellite altimetry. Geophys. Res. Lett. 2011, 38. [Google Scholar] [CrossRef]
- Chen, L. Detection of shoreline changes for tideland areas using multi-temporal satellite images. Int. J. Remote Sens. 1998, 19, 3383–3397. [Google Scholar] [CrossRef]
- Tseng, K.-H.; Kuo, C.-Y.; Lin, T.-H.; Huang, Z.-C.; Lin, Y.-C.; Liao, W.-H.; Chen, C.-F. Reconstruction of time-varying tidal flat topography using optical remote sensing imageries. ISPRS J. Photogramm. Remote Sens. 2017, 131, 92–103. [Google Scholar] [CrossRef]
- Passaro, M.; Fenoglio-Marc, L.; Cipollini, P. Validation of significant wave height from improved satellite altimetry in the German Bight. IEEE Trans. Geosci. Remote Sens. 2014, 53, 2146–2156. [Google Scholar] [CrossRef]
- Yu, H.; Li, J.; Wu, K.; Wang, Z.; Yu, H.; Zhang, S.; Hou, Y.; Kelly, R.M. A global high-resolution ocean wave model improved by assimilating the satellite altimeter significant wave height. Int. J. Appl. Earth Obs. Geoinf. 2018, 70, 43–50. [Google Scholar] [CrossRef]
- Pan, C.-H.; Lu, H.-Y.; Zeng, J. Characteristic and numerical simulation of tidal bore in Qiantang River. Hydro-Sci. Eng. 2008, 2, 1–9. [Google Scholar]
- Huang, T.; Zhang, H.; Shi, Y. Numerical simulation of the tidal bore in the Qiantang River based on Boussinesq-type equations. Chin. J. Geophys. 2022, 65, 79–95. [Google Scholar]
- Tu, J.; Fan, D.; Voulgaris, G. Field observations of turbulence, sediment suspension, and transport under breaking tidal bores. Mar. Geol. 2021, 437, 106498. [Google Scholar] [CrossRef]
- Li, Y.; Pan, D.-Z.; Chanson, H.; Pan, C.-H. Real-time characteristics of tidal bore propagation in the Qiantang River Estuary, China, recorded by marine radar. Cont. Shelf Res. 2019, 180, 48–58. [Google Scholar] [CrossRef]
- Cai, L.; Chen, S.; Yan, X.; Bai, Y.; Bu, J. Study on High-Resolution Suspended Sediment Distribution under the Influence of Coastal Zone Engineering in the Yangtze River Mouth, China. Remote Sens. 2022, 14, 486. [Google Scholar] [CrossRef]
- Yao, Y.; Liang, S.; Fisher, J.B.; Zhang, Y.; Cheng, J.; Chen, J.; Jia, K.; Zhang, X.; Bei, X.; Shang, K.; et al. A Novel NIR–Red Spectral Domain Evapotranspiration Model From the Chinese GF-1 Satellite: Application to the Huailai Agricultural Region of China. IEEE Trans. Geosci. Remote Sens. 2021, 59, 4105–4119. [Google Scholar] [CrossRef]
- Hang, X.; Li, Y.; Li, X.; Xu, M.; Sun, L. Estimation of Chlorophyll-a Concentration in Lake Taihu from Gaofen-1 Wide-Field-of-View Data through a Machine Learning Trained Algorithm. J. Meteorol. Res. 2022, 36, 208–226. [Google Scholar] [CrossRef]
- Huang, X.; Xuan, F.; Dong, Y.; Su, W.; Wang, X.; Huang, J.; Li, X.; Zeng, Y.; Miao, S.; Li, J. Identifying Corn Lodging in the Mature Period Using Chinese GF-1 PMS Images. Remote Sens. 2023, 15, 894. [Google Scholar] [CrossRef]
- Zhu, Q.; Xu, X.; Sun, Z.; Liang, D.; An, X.; Chen, L.; Yang, G.; Huang, L.; Xu, S.; Yang, M. Estimation of Winter Wheat Residue Coverage Based on GF-1 Imagery and Machine Learning Algorithm. Agronomy 2022, 12, 1051. [Google Scholar] [CrossRef]
- Cai, L.; Yu, M.; Yan, X.; Zhou, Y.; Chen, S. HY-1C/D Reveals the Chlorophyll-a Concentration Distribution Details in the Intensive Islands’ Waters and Its Consistency with the Distribution of Fish Spawning Ground. Remote Sens. 2022, 14, 4270. [Google Scholar] [CrossRef]
- Liu, R.; Xiao, Y.; Ma, Y.; Cui, T.; An, J. Red tide detection based on high spatial resolution broad band optical satellite data. ISPRS J. Photogramm. Remote Sens. 2022, 184, 131–147. [Google Scholar] [CrossRef]
- Cheng, Y.; Sun, Y.; Peng, L.; He, Y.; Zha, M. An Improved Retrieval Method for Porphyra Cultivation Area Based on Suspended Sediment Concentration. Remote Sens. 2022, 14, 4338. [Google Scholar] [CrossRef]
- Ye, X.; Liu, J.; Lin, M.; Ding, J.; Zou, B.; Song, Q.; Teng, Y. Evaluation of Sea Surface Temperatures Derived From the HY-1D Satellite. IEEE J. Sel. Top. Appl. Earth Obs. Remote Sens. 2022, 15, 654–665. [Google Scholar] [CrossRef]
- Huang, S.; Liu, J.; Cai, L.; Zhou, M.; Bu, J.; Xu, J. Satellites HY-1C and Landsat 8 Combined to Observe the Influence of Bridge on Sea Surface Temperature and Suspended Sediment Concentration in Hangzhou Bay, China. Water 2020, 12, 2595. [Google Scholar] [CrossRef]
- Wang, F.; Zhou, B.; Xu, J.; Song, L.; Wang, X. Application of neural network and MODIS 250 m imagery for estimating suspended sediments concentration in Hangzhou Bay, China. Environ. Geol. 2009, 56, 1093–1101. [Google Scholar] [CrossRef]
- Cheng, L.; Sui, J.; Yun, H.; Hirshfield, F. Changes in runoff and sediment load from major Chinese rivers to the Pacific Ocean over the period 1955–2010. Int. J. Sediment Res. 2013, 28, 486–495. [Google Scholar]
- Wang, Q.; Pan, C.; Pan, D. Numerical study of the effect of typhoon Yagi on the Qiantang River tidal bore. Reg. Stud. Mar. Sci. 2021, 44, 101780. [Google Scholar] [CrossRef]
- Bu, J.; Cai, L.; Yan, X.; Xu, H.; Hu, H.; Jiang, J. Monitoring the Chl-a Distribution Details in the Yangtze River Mouth Using Satellite Remote Sensing. Water 2022, 14, 1295. [Google Scholar] [CrossRef]
- Li, J.; Chen, X.; Tian, L.; Huang, J.; Feng, L. Improved capabilities of the Chinese high-resolution remote sensing satellite GF-1 for monitoring suspended particulate matter (SPM) in inland waters: Radiometric and spatial considerations. ISPRS J. Photogramm. Remote Sens. 2015, 106, 145–156. [Google Scholar] [CrossRef]
- Tong, C.; Mu, B.; Liu, R.-J.; Ding, J.; Zhang, M.-W.; Xiao, Y.-F.; Liang, X.-J.; Chen, X.-Y. Atmospheric correction algorithm for HY-1C CZI over turbid waters. J. Coast. Res. 2019, 90, 156–163. [Google Scholar] [CrossRef]
- Cai, L.; Zhou, M.; Liu, J.; Tang, D.; Zuo, J. HY-1C Observations of the Impacts of Islands on Suspended Sediment Distribution in Zhoushan Coastal Waters, China. Remote Sens. 2020, 12, 1766. [Google Scholar] [CrossRef]
- Zeng, M.; Peng, J.; Jiang, L.; Feng, J. Temporal and Spatial Distribution of Suspended Sediment Concentration in Lakes Based on Satellite Remote Sensing and Internet of Things. IEEE Access 2021, 9, 87849–87856. [Google Scholar] [CrossRef]
- Zhang, X.; Zhang, K.; Sun, Y.; Zhao, Y.; Zhuang, H.; Ban, W.; Chen, Y.; Fu, E.; Chen, S.; Liu, J. Combining spectral and texture features of UAS-based multispectral images for maize leaf area index estimation. Remote Sens. 2022, 14, 331. [Google Scholar] [CrossRef]
- Yang, Y.; Zhang, X.; Gao, W.; Zhang, Y.; Hou, X. Improving lake chlorophyll-a interpreting accuracy by combining spectral and texture features of remote sensing. Environ. Sci. Pollut. Res. 2023, 30, 83628–83642. [Google Scholar] [CrossRef]
- Li, M.; Wu, P.; Wang, B.; Park, H.; Yang, H.; Wu, Y. A deep learning method of water body extraction from high resolution remote sensing images with multisensors. IEEE J. Sel. Top. Appl. Earth Obs. Remote Sens. 2021, 14, 3120–3132. [Google Scholar] [CrossRef]
- Zhou, X.; Wang, J.; Zheng, F.; Wang, H.; Yang, H. An Overview of Coastline Extraction from Remote Sensing Data. Remote Sens. 2023, 15, 4865. [Google Scholar] [CrossRef]
- Wang, Y.; Liu, Y.; Jin, S.; Sun, C.; Wei, X. Evolution of the topography of tidal flats and sandbanks along the Jiangsu coast from 1973 to 2016 observed from satellites. ISPRS J. Photogramm. Remote Sens. 2019, 150, 27–43. [Google Scholar] [CrossRef]
- Yang, H.; Chen, M.; Xi, X.; Wang, Y. A Novel Approach for Instantaneous Waterline Extraction for Tidal Flats. Remote Sens. 2024, 16, 413. [Google Scholar] [CrossRef]
- Yu, H.; Wang, C.; Li, J.; Sui, Y. Automatic Extraction of Green Tide From GF-3 SAR Images Based on Feature Selection and Deep Learning. IEEE J. Sel. Top. Appl. Earth Obs. Remote Sens. 2021, 14, 10598–10613. [Google Scholar] [CrossRef]
- Chen, S. Seasonal, neap-spring variation of sediment concentration in the joint area between Yangtze Estuary and Hangzhou Bay. Sci. China Ser. B Chem. 2001, 44, 57–62. [Google Scholar] [CrossRef]
- Xie, D.; Gao, S.; Wang, Z.B.; Pan, C.; Wu, X.; Wang, Q. Morphodynamic modeling of a large inside sandbar and its dextral morphology in a convergent estuary: Qiantang Estuary, China. J. Geophys. Res. Earth Surf. 2017, 122, 1553–1572. [Google Scholar] [CrossRef]
- Liu, Z.; Chen, M.; Li, Y.; Huang, Y.; Fan, B.; Lv, W.; Yu, P.; Wu, D.; Zhao, Y. Different effects of reclamation methods on macrobenthos community structure in the Yangtze Estuary, China. Mar. Pollut. Bull. 2018, 127, 429–436. [Google Scholar] [CrossRef]
Figure 1.
(a) The location of Hangzhou Bay—SCC: Subei Coastal Current; ZMCC(W): Zhe min Coastal Current (Winter); ZMCC(S): Zhe min Coastal Current (Summer); (b) Topography of the Hangzhou Bay.
Figure 1.
(a) The location of Hangzhou Bay—SCC: Subei Coastal Current; ZMCC(W): Zhe min Coastal Current (Winter); ZMCC(S): Zhe min Coastal Current (Summer); (b) Topography of the Hangzhou Bay.

Figure 2.
DN values of Band1 to Band4 of the Qiantang River tidal bore. (A) Obtained from HY-1C. (B) Obtained from HY-1D. (C) Obtained from GF-1 WFV. The four coordinate plots from top left to bottom right (1–4) represent the band value maps for the blue, green, red, and NIR bands, respectively. Horizontal and vertical coordinates on the two-dimensional plane represent the horizontal position of the band data. The letters a, b, c, and d correspond to the red boundary a, b, c, and d of the region in the right figure, and the vertical coordinates represent the reflectance values of the bands.

Figure 3.
The extraction efficiency of Qiantang River tidal bore by different models from Hy1-c and Hy1-d CZI images and GF-1 on 22 September 2021.
Figure 3.
The extraction efficiency of Qiantang River tidal bore by different models from Hy1-c and Hy1-d CZI images and GF-1 on 22 September 2021.

Figure 4.
It shows the true color images of HY-1C, HY-1D, and GF-1 WFV and the images after using QRI1 and QRI2. (b,c,e,f) are the comparison images before and after using QRI1 in HY-1C and HY-1D, respectively. (a,d) show the comparison of GF-1 WFV before and after using QRI2. Red box represents the location of tidal bore.

Figure 5.
It shows the GLCM processing results of GF-1 WFV, HY-1C, HY-1D. (a,c,e) show the entropy value images of Figure 4d, Figure 4e, Figure 4f, respectively. (b,d,f) show the energy value images of Figure 4d, Figure 4e, Figure 4f, respectively.

Figure 6.
Comparison of GLCM results analysis between upstream and downstream of the Qiantang River Tidal Bore. (a,b) show the entropy and energy values of Figure 4d. (c,d) show the entropy and energy values of Figure 4e. (e,f) show the entropy and energy values of Figure 4f.

Figure 7.
The retrieval SSC in Qiantang. (a–c) represent the inversion results of SSC before the tidal bore occurred. (d–f) represent the inversion results of SSC during the tidal bore occurrence. (g–i) represent the inversion results of SSC after the tidal bore occurred.
Figure 7.
The retrieval SSC in Qiantang. (a–c) represent the inversion results of SSC before the tidal bore occurred. (d–f) represent the inversion results of SSC during the tidal bore occurrence. (g–i) represent the inversion results of SSC after the tidal bore occurred.

Figure 8.
SSC distribution details in the Qiantang River retrieved from HY-1C CZI and HY-1D CZI images on 22 September. The two curves in (b) are the SSC corresponding to the regions of the two red lines in panel (a). The curve in (d) corresponds to the SSC in the region of the vertical profile in panel (c). They are the SSC distributions of HY-1C. The two curves in (f) are the SSC corresponding to the regions of the two red lines in panel (e). The curve in (h) corresponds to the SSC in the region of the vertical profile in panel (g). They are the SSC distributions of HY-1D. The red arrow represents the flow direction of the tidal bore.

Figure 9.
The currents in Qiantang on 22 September 2021. (a) represents the currents conditions at 00:00 on the day. (b) represents the currents conditions at 06:00 on the day. (c) represents the currents conditions at 12:00 on the day. (d) represents the currents conditions at 18:00 on the day.
Figure 9.
The currents in Qiantang on 22 September 2021. (a) represents the currents conditions at 00:00 on the day. (b) represents the currents conditions at 06:00 on the day. (c) represents the currents conditions at 12:00 on the day. (d) represents the currents conditions at 18:00 on the day.


Table 1.
Band information of HY1-C/D and GF-1 WFV satellites.
| Sensor | Band No. | Spectral Range/µm |
|---|---|---|
| HY-1C/D CZI | Band 1 (Blue) | 0.421–0.500 |
| Band 2 (Green) | 0.517–0.598 | |
| Band 3 (Red) | 0.608–0.690 | |
| Band 4 (NIR) | 0.761–0.891 | |
| GF-1 WFV | Band 1 (Blue) | 0.450–0.520 |
| Band 2 (Green) | 0.520–0.590 | |
| Band 3 (Red) | 0.630–0.690 | |
| Band 4 (NIR) | 0.770–0.890 |
Table 2.
The values represent the differences from Band 1 to Band 4 in HY-1C.
| Band 1 | Band 2 | Band 3 | Band 4 | |
|---|---|---|---|---|
| Group 1 | 0.001 | 0.0015 | 0.0035 | 0.0112 |
| Group 2 | 0.0009 | 0.0015 | 0.0039 | 0.0116 |
| Group 3 | 0.001 | 0.0014 | 0.0043 | 0.012 |
| Group 4 | 0.001 | 0.0011 | 0.0046 | 0.0122 |
| Group 5 | 0.0012 | 0.0009 | 0.005 | 0.0123 |
| Group 6 | 0.0015 | 0.0007 | 0.0053 | 0.0124 |
| Group 7 | 0.0016 | 0.0011 | 0.005 | 0.0126 |
| Group 8 | 0.0017 | 0.0015 | 0.0047 | 0.0128 |
| Group 9 | 0.0018 | 0.0019 | 0.0044 | 0.0128 |
| Group 10 | 0.0018 | 0.0019 | 0.0045 | 0.013 |
| Group 11 | 0.0018 | 0.0019 | 0.0048 | 0.0132 |
| Group 12 | 0.0019 | 0.0018 | 0.0051 | 0.0135 |
| Group 13 | 0.0015 | 0.0018 | 0.0056 | 0.0145 |
| Group 14 | 0.0011 | 0.0019 | 0.006 | 0.0153 |
| Group 15 | 0.0006 | 0.0017 | 0.0061 | 0.0159 |
| Average value | 0.00136 | 0.00151 | 0.00485 | 0.01302 |
Table 3.
The values represent the differences from Band 1 to Band 4 in HY-1D.
| Band 1 | Band 2 | Band 3 | Band 4 | |
|---|---|---|---|---|
| Group 1 | 0.0051 | 0.0097 | 0.0123 | 0.0163 |
| Group 2 | 0.0059 | 0.0089 | 0.0114 | 0.0146 |
| Group 3 | 0.0068 | 0.0098 | 0.0118 | 0.0158 |
| Group 4 | 0.0064 | 0.0122 | 0.0154 | 0.0175 |
| Group 5 | 0.0072 | 0.0127 | 0.0163 | 0.0174 |
| Group 6 | 0.0086 | 0.0141 | 0.0164 | 0.0181 |
| Group 7 | 0.0105 | 0.017 | 0.0189 | 0.0214 |
| Group 8 | 0.0115 | 0.0187 | 0.022 | 0.0256 |
| Group 9 | 0.0107 | 0.0173 | 0.0241 | 0.0328 |
| Group 10 | 0.0102 | 0.0164 | 0.0236 | 0.0382 |
| Average value | 0.00829 | 0.01368 | 0.01722 | 0.02177 |
Table 4.
The values represent the differences from Band 1 to Band 4 in GF-1 WFV.
| Band 1 | Band 2 | Band 3 | Band 4 | |
|---|---|---|---|---|
| Group 1 | 114 | 180 | 188 | 346 |
| Group 2 | 103 | 175 | 167 | 357 |
| Group 3 | 114 | 194 | 169 | 346 |
| Group 4 | 98 | 199 | 164 | 312 |
| Group 5 | 82 | 103 | 141 | 270 |
| Group 6 | 80 | 107 | 149 | 239 |
| Group 7 | 76 | 126 | 161 | 192 |
| Group 8 | 33 | 157 | 153 | 189 |
| Group 9 | 37 | 108 | 153 | 217 |
| Group 10 | 63 | 104 | 152 | 217 |
| Group 11 | 49 | 112 | 134 | 205 |
| Group 12 | 56 | 106 | 136 | 205 |
| Group 13 | 21 | 108 | 133 | 209 |
| Group 14 | 31 | 94 | 101 | 217 |
| Group 15 | 23 | 63 | 107 | 236 |
| Average value | 65.3 | 129.1 | 147.2 | 250.5 |
Disclaimer/Publisher’s Note: The statements, opinions and data contained in all publications are solely those of the individual author(s) and contributor(s) and not of MDPI and/or the editor(s). MDPI and/or the editor(s) disclaim responsibility for any injury to people or property resulting from any ideas, methods, instructions or products referred to in the content. |
© 2024 by the authors. Licensee MDPI, Basel, Switzerland. This article is an open access article distributed under the terms and conditions of the Creative Commons Attribution (CC BY) license (https://creativecommons.org/licenses/by/4.0/).
Share and Cite
MDPI and ACS Style
Cai, L.; Zhang, H.; Ye, X.; Yin, J.; Tang, R. Twin Satellites HY-1C/D Reveal the Local Details of Astronomical Tide Flooding into the Qiantang River, China. Remote Sens. 2024, 16, 1507. https://doi.org/10.3390/rs16091507
AMA Style
Cai L, Zhang H, Ye X, Yin J, Tang R. Twin Satellites HY-1C/D Reveal the Local Details of Astronomical Tide Flooding into the Qiantang River, China. Remote Sensing. 2024; 16(9):1507. https://doi.org/10.3390/rs16091507
Chicago/Turabian StyleCai, Lina, Hengpan Zhang, Xiaomin Ye, Jie Yin, and Rong Tang. 2024. "Twin Satellites HY-1C/D Reveal the Local Details of Astronomical Tide Flooding into the Qiantang River, China" Remote Sensing 16, no. 9: 1507. https://doi.org/10.3390/rs16091507
Note that from the first issue of 2016, this journal uses article numbers instead of page numbers. See further details here.