Article

Hyperspectral Data for Mangrove Species Mapping: A Comparison of Pixel-Based and Object-Based Approach

1
Biophysical Remote Sensing Group, Centre for Spatial and Environmental Research, School of Geography, Planning and Environmental Management, The University of Queensland, Brisbane, QLD 4072, Australia
2
Cartography and Remote Sensing Section, Faculty of Geography, Gadjah Mada University, Bulaksumur, Yogyakarta 55281, Indonesia
*
Author to whom correspondence should be addressed.
Remote Sens. 2011, 3(10), 2222-2242; https://doi.org/10.3390/rs3102222
Submission received: 12 August 2011 / Revised: 4 October 2011 / Accepted: 11 October 2011 / Published: 20 October 2011
(This article belongs to the Special Issue Hyperspectral Remote Sensing)

Abstract

:
Visual image interpretation and digital image classification have been used to map and monitor mangrove extent and composition for decades. The presence of a high-spatial resolution hyperspectral sensor can potentially improve our ability to differentiate mangrove species. However, little research has explored the use of pixel-based and object-based approaches on high-spatial hyperspectral datasets for this purpose. This study assessed the ability of CASI-2 data for mangrove species mapping using pixel-based and object-based approaches at the mouth of the Brisbane River area, southeast Queensland, Australia. Three mapping techniques used in this study: spectral angle mapper (SAM) and linear spectral unmixing (LSU) for the pixel-based approaches, and multi-scale segmentation for the object-based image analysis (OBIA). The endmembers for the pixel-based approach were collected based on existing vegetation community map. Nine targeted classes were mapped in the study area from each approach, including three mangrove species: Avicennia marina, Rhizophora stylosa, and Ceriops australis. The mapping results showed that SAM produced accurate class polygons with only few unclassified pixels (overall accuracy 69%, Kappa 0.57), the LSU resulted in a patchy polygon pattern with many unclassified pixels (overall accuracy 56%, Kappa 0.41), and the object-based mapping produced the most accurate results (overall accuracy 76%, Kappa 0.67). Our results demonstrated that the object-based approach, which combined a rule-based and nearest-neighbor classification method, was the best classifier to map mangrove species and its adjacent environments.

1. Introduction

The role and importance of mangroves as a coastal resource is well established. Mangroves are one of the most important objects of wetland ecosystems, which are essential for maintaining coastal environment. They are highly productive ecosystems that typically dominate the intertidal zone of low energy tropical and subtropical coastlines [1,2]. Mangroves not only characterize the ecosystem, but also define an economic resource for the surrounding communities. They also provide an important nursery area for the juveniles of many commercial fish and crustacean species and play important roles in coastal protection and water quality [3,4,5].
Mapping the distribution of species and vegetation communities in coastal wetlands is important to provide wetland inventories, assess change over time and to map and quantify biodiversity [6]. Remote sensing has an essential role to provide a fast and efficient method of ecosystem baseline mapping and subsequent monitoring in mangrove areas which are temporarily inundated and sometime inaccessible [7,8]. Mangrove environments often grow in remote and inaccessible areas and field-survey and airborne data acquisition is difficult and time consuming. High-spatial resolution multi-spectral optical sensors are well-suited technologies for detailed coastal ecosystem mapping, such as mangroves, and are also cost-effective when compared to traditional air photo interpretation [5,7]. Mangrove stands of different species composition are hard to distinguish in conventional, moderate-spatial resolution, and multi-spectral satellite images [9,10,11], but was possible using hyperspectral images from airborne sensors [12,13,14,15,16].
The potential of hyperspectral imaging and image processing has already been demonstrated for numerous applications in vegetation structure, composition and physiology [8,17,18]. This advantage is mainly driven by its ability to measure reflectance and absorption in specific and narrow spectral bands. Airborne and satellite hyperspectral data offer a large number of narrow, contiguous, spectral bands, covering the 400 to 2,500 nm range of the electromagnetic spectrum [17,18]. Each pixel in the remotely acquired scene has an associated spectrum similar to the spectra of the material obtained in the laboratory or from the field. As a result, hyperspectral data allow for a better separation of feature types based on their unique spectral reflectance and absorption characteristics. Therefore, hyperspectral data may improve our ability of to differentiate mangrove species composition [13,14,16].
Most of hyperspectral applications for mangrove species composition were conducted using pixel-based mapping approach, such as maximum likelihood [12,19], spectral angle mapper (SAM) [12,13,14], and spectral unmixing [14]. Another approach, object-based image analysis (OBIA), has not been assessed for mapping mangrove species composition from hyperspectral data. This approach is different to the conventional pixel-based classification methods which rely only on the spectral reflectance information from each individual pixel in an image. Object-based techniques recognize that important semantic information is not always represented in single pixels, but in meaningful image objects and in their contextual relations [20,21]. Thus, it is necessary to implement those approaches and evaluate the results to understand their potentials for mangrove species mapping.
The CASI-2 hyperspectral image has a combination of properties for accurate mapping of mangrove environments, namely the narrow spectral bands and high spatial resolution. These properties offer an opportunity to apply either pixel-based or object-based analysis for mangrove mapping. To date, there is no specific results have been published comparing and evaluating the results of pixel-based (per-pixel and sub-pixel) and object-based classification techniques applied to hyperspectral image for mangrove species mapping. This study assesses the CASI-2® airborne hyperspectral images for mangrove species mapping by comparing the accuracy of pixel-based and object-based approaches applied to the same data set captured over an area of sub-tropical mangroves in eastern Australia.

2. Data and Methods

2.1. Study Area

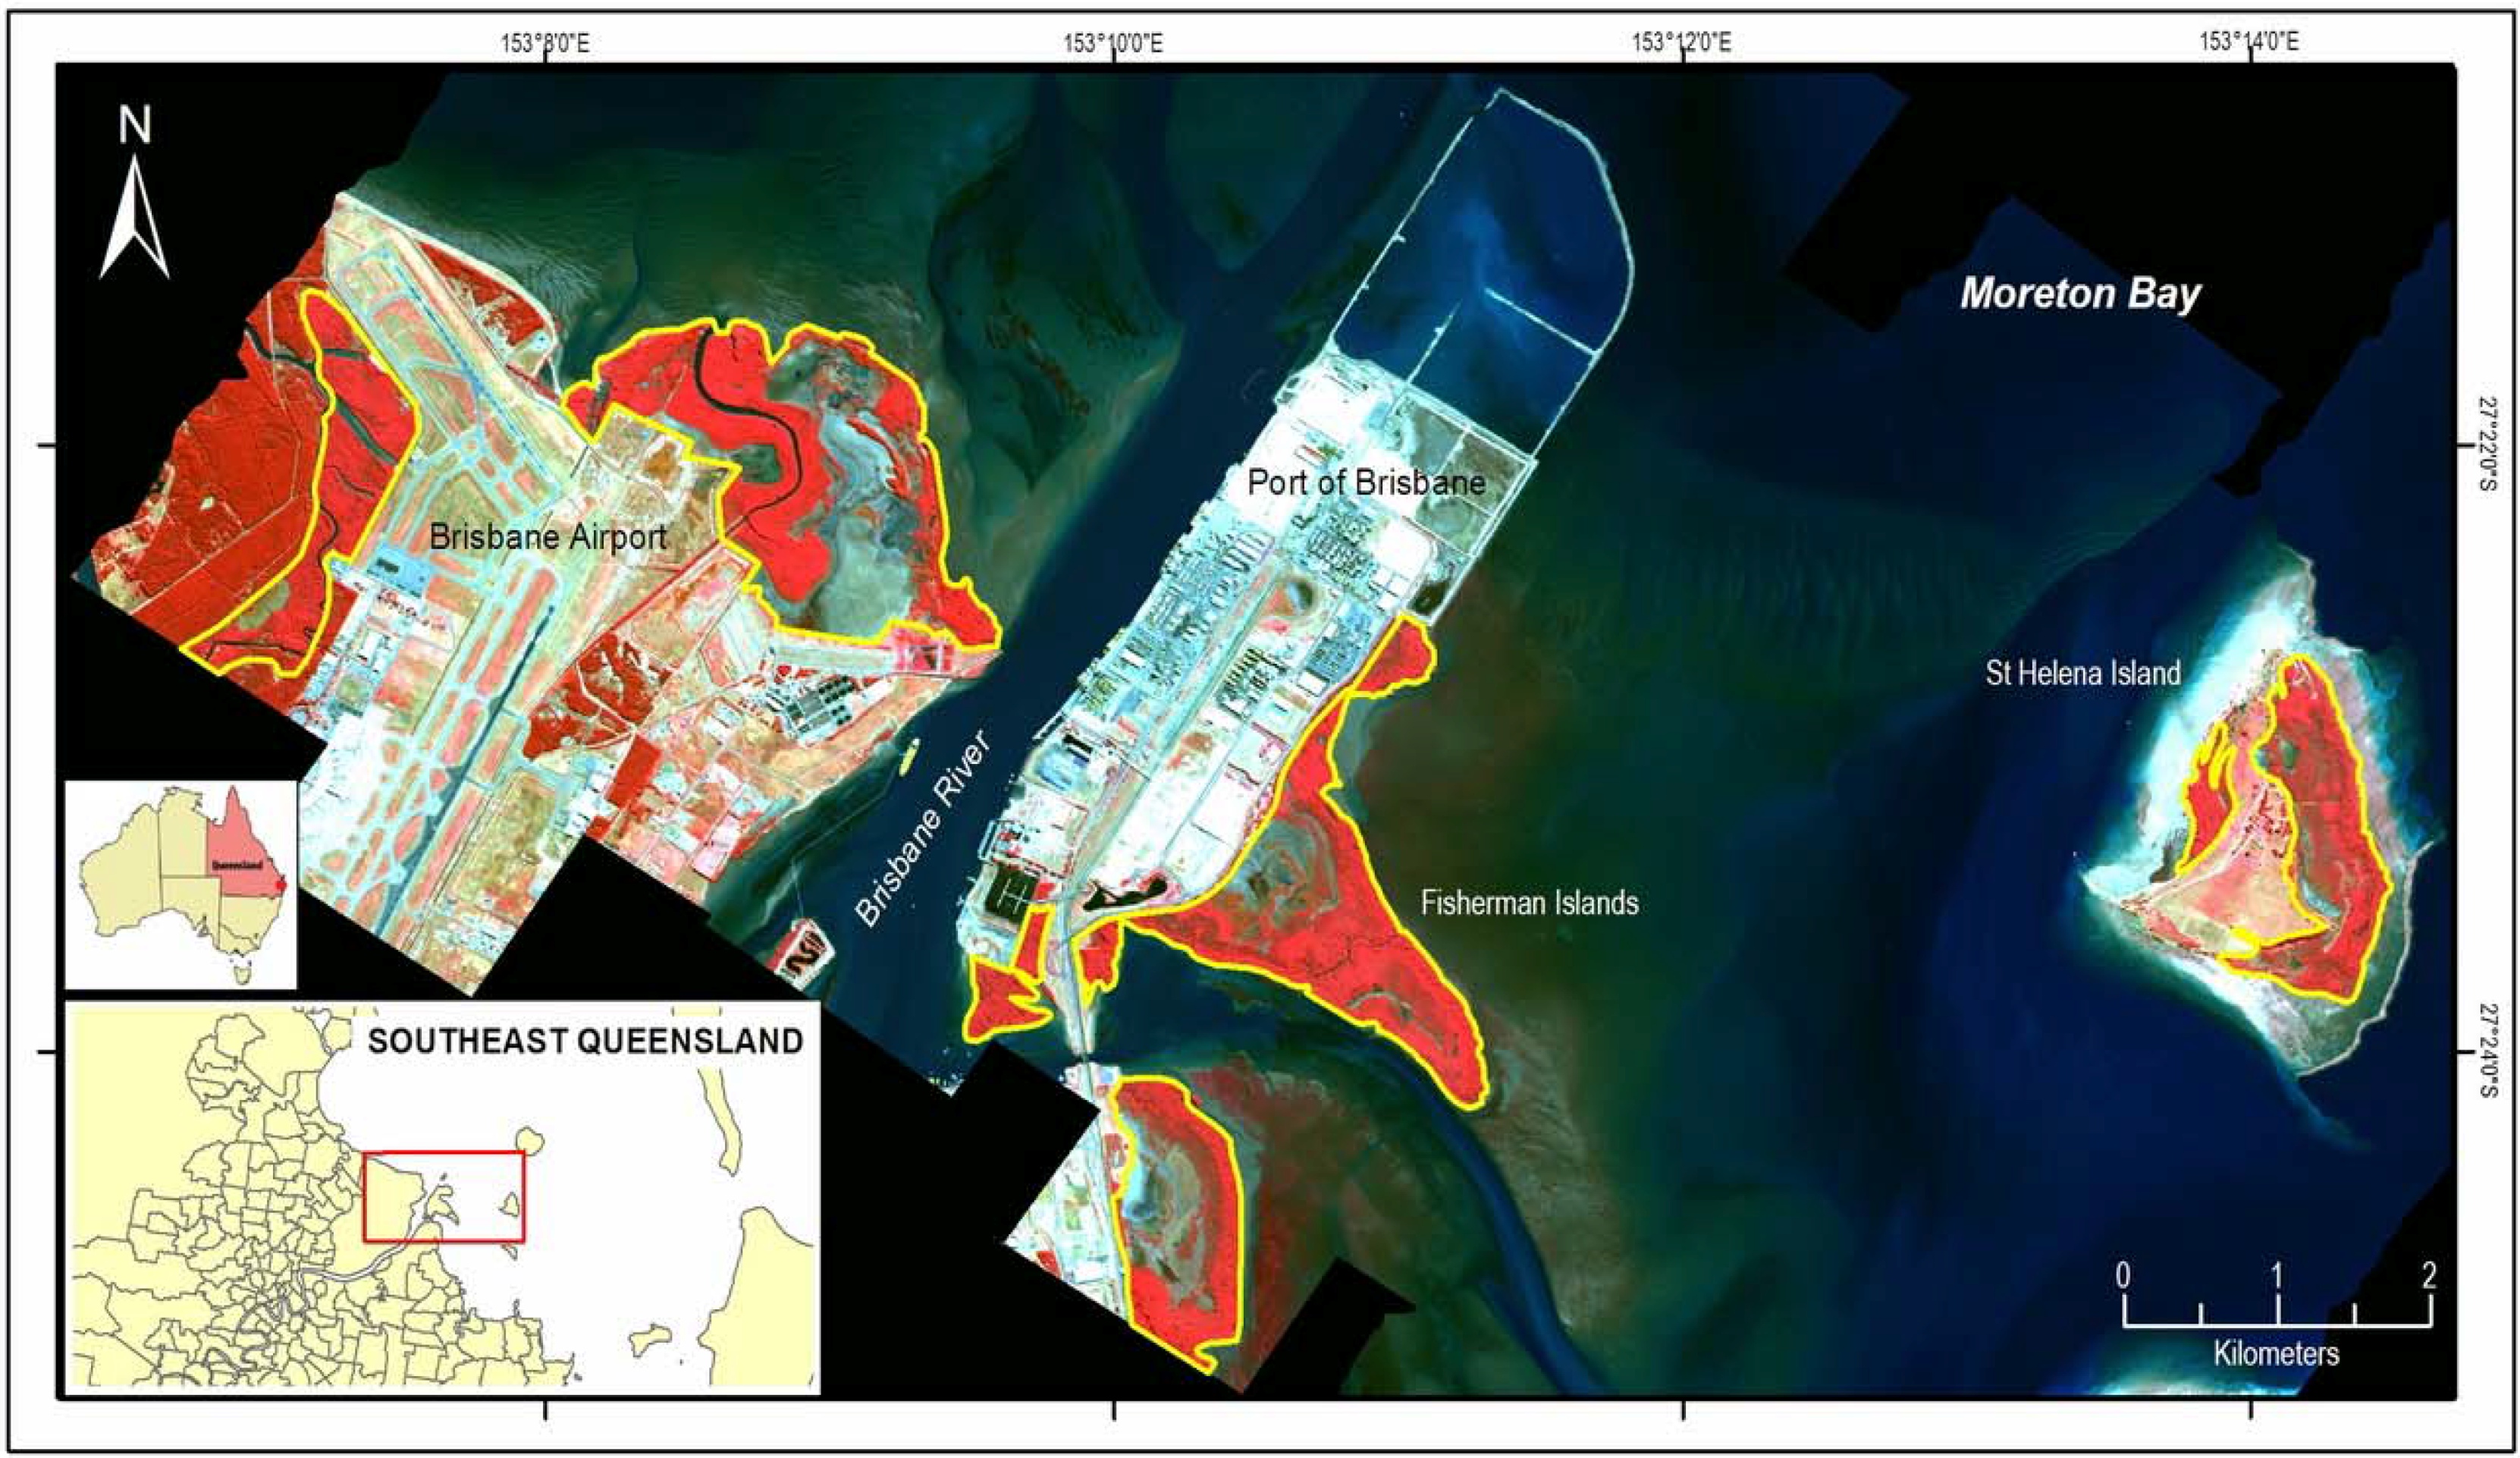
This study was located at the mouth of the Brisbane River, southeast Queensland, Australia, which is a part of Moreton Bay, centered at approximately 153°10′30″E and 27°23′00″S (Figure 1). This area is separated from the Pacific Ocean by two sand islands, Moreton Island in the north and North Stradbroke Island in the south. Mangroves are the most noticeable component of the wetlands in this area. They occur along the shoreline, on the banks of creek and streams, in swamps, in river mouths and also around islands and in bays and other low-laying areas [22]. Mangroves proliferate in areas protected from high-energy waves. The Brisbane River mouth and St. Helena Island are among the areas protected from strong wave action where mangroves communities exist in this area. There are three mangrove species in the study area, which are Avicennia marina, Rhizophora stylosa, and Ceriops australis [23,24]. Among them Avicennia marina is the most widespread species, which comprises approximately 75% of the entire community within this region [25]. It grows along riverbanks, the bay islands and along the intertidal fringes of the Bay.

2.2. Image Data and Reference Map

The primary dataset used in this study was a CASI-2® hyperspectral dataset with 30 bands and 4 m spatial resolution, covering the mouth of the Brisbane River area, acquired on 29 July 2004 at 9:56:29 am (Figure 1). This dataset was chosen due to its high spectral and spatial resolutions (Table 1). The data meets the requirement for both hyperspectral pixel-based and object-based mapping. As the CASI sensors allow users to choose their own band sets, all of the 30 bands were optimized for vegetation discrimination purposes.
Several image pre-processing procedures were applied to the dataset. The CASI provider applied radiometric correction to at sensor spectral radiance. Anstee at CSIRO further processed the image data, by applying cross-track corrections and using Brando & Dekker [26] method to derive at-surface reflectance. The imagery used in this study has been fully corrected geometrically and radiometrically to at surface reflectance. All image processing for pixel-based approach were using ENVI 4.4 software, while the object-based approach was using Definiens® Developer 7.
Figure 1. CASI-2® image of the study area, the mouth of the Brisbane River, Southeast Queensland, Australia, in false color composite (R: band 29 [799 nm], G: band 15 [650 nm], B: band 9 [540 nm]), acquired on 29 July 2004. The yellow polygons show boundaries of the mapped mangrove.
Remotesensing 03 02222 g001
Table 1. Summary of image dataset collection parameters CASI-2 and band set used for mangrove mapping (Source: [27]).
Acquisition Parameters
Sensor altitude: ~1,200 m
Acquisition date and time:
 -Date: 29 July 2004
 -UTC: 23:56:29
 -Local: 09:56:29
Meteorological conditions at acquisition:
 - Temperature: 16.7 °C
 - Atmospheric pressure: 66 %
 - Humidity: 1,022.4 hPa
Acquisition and Solar Geometry:
 Off-NADIR view = 2.6 (ideal = 0)
 Satellite Azimuth = 97.6
 Satellite Elevation= 87.3
 Sun Azimuth = 35.0
 Sun Elevation = 36.5
Image size (pixels, rows): 4,971, 4,108
Pixel size: 4.0 m × 4.0 m
Geometric Attributes:
WGS84 in Decimal degrees for Lat/Lon
Spectral band for vegetation mapping: 30 bands
Radiometric resolution (dynamic range):
14 bit (16,384 levels)
The reference map used in this study was a digital map of the mangrove species in the study area, which was an official product of Queensland Herbarium/Environmental Protection Agency (EPA) [28]. This map was derived from aerial photographic interpretation at scale of 1:25,000, site data, traverses, and other available data in 1999 for regional coastal wetland assessment and produced mangrove species map at scale 1:25,000, which has a coarser level of information compare to CASI-2 image. However, the map provides valuable information on the existing mangrove species in this area, as well as a guide for endmembers selection and a reference for accuracy assessments of the resulting mangrove maps.

2.3. Endmember Selection

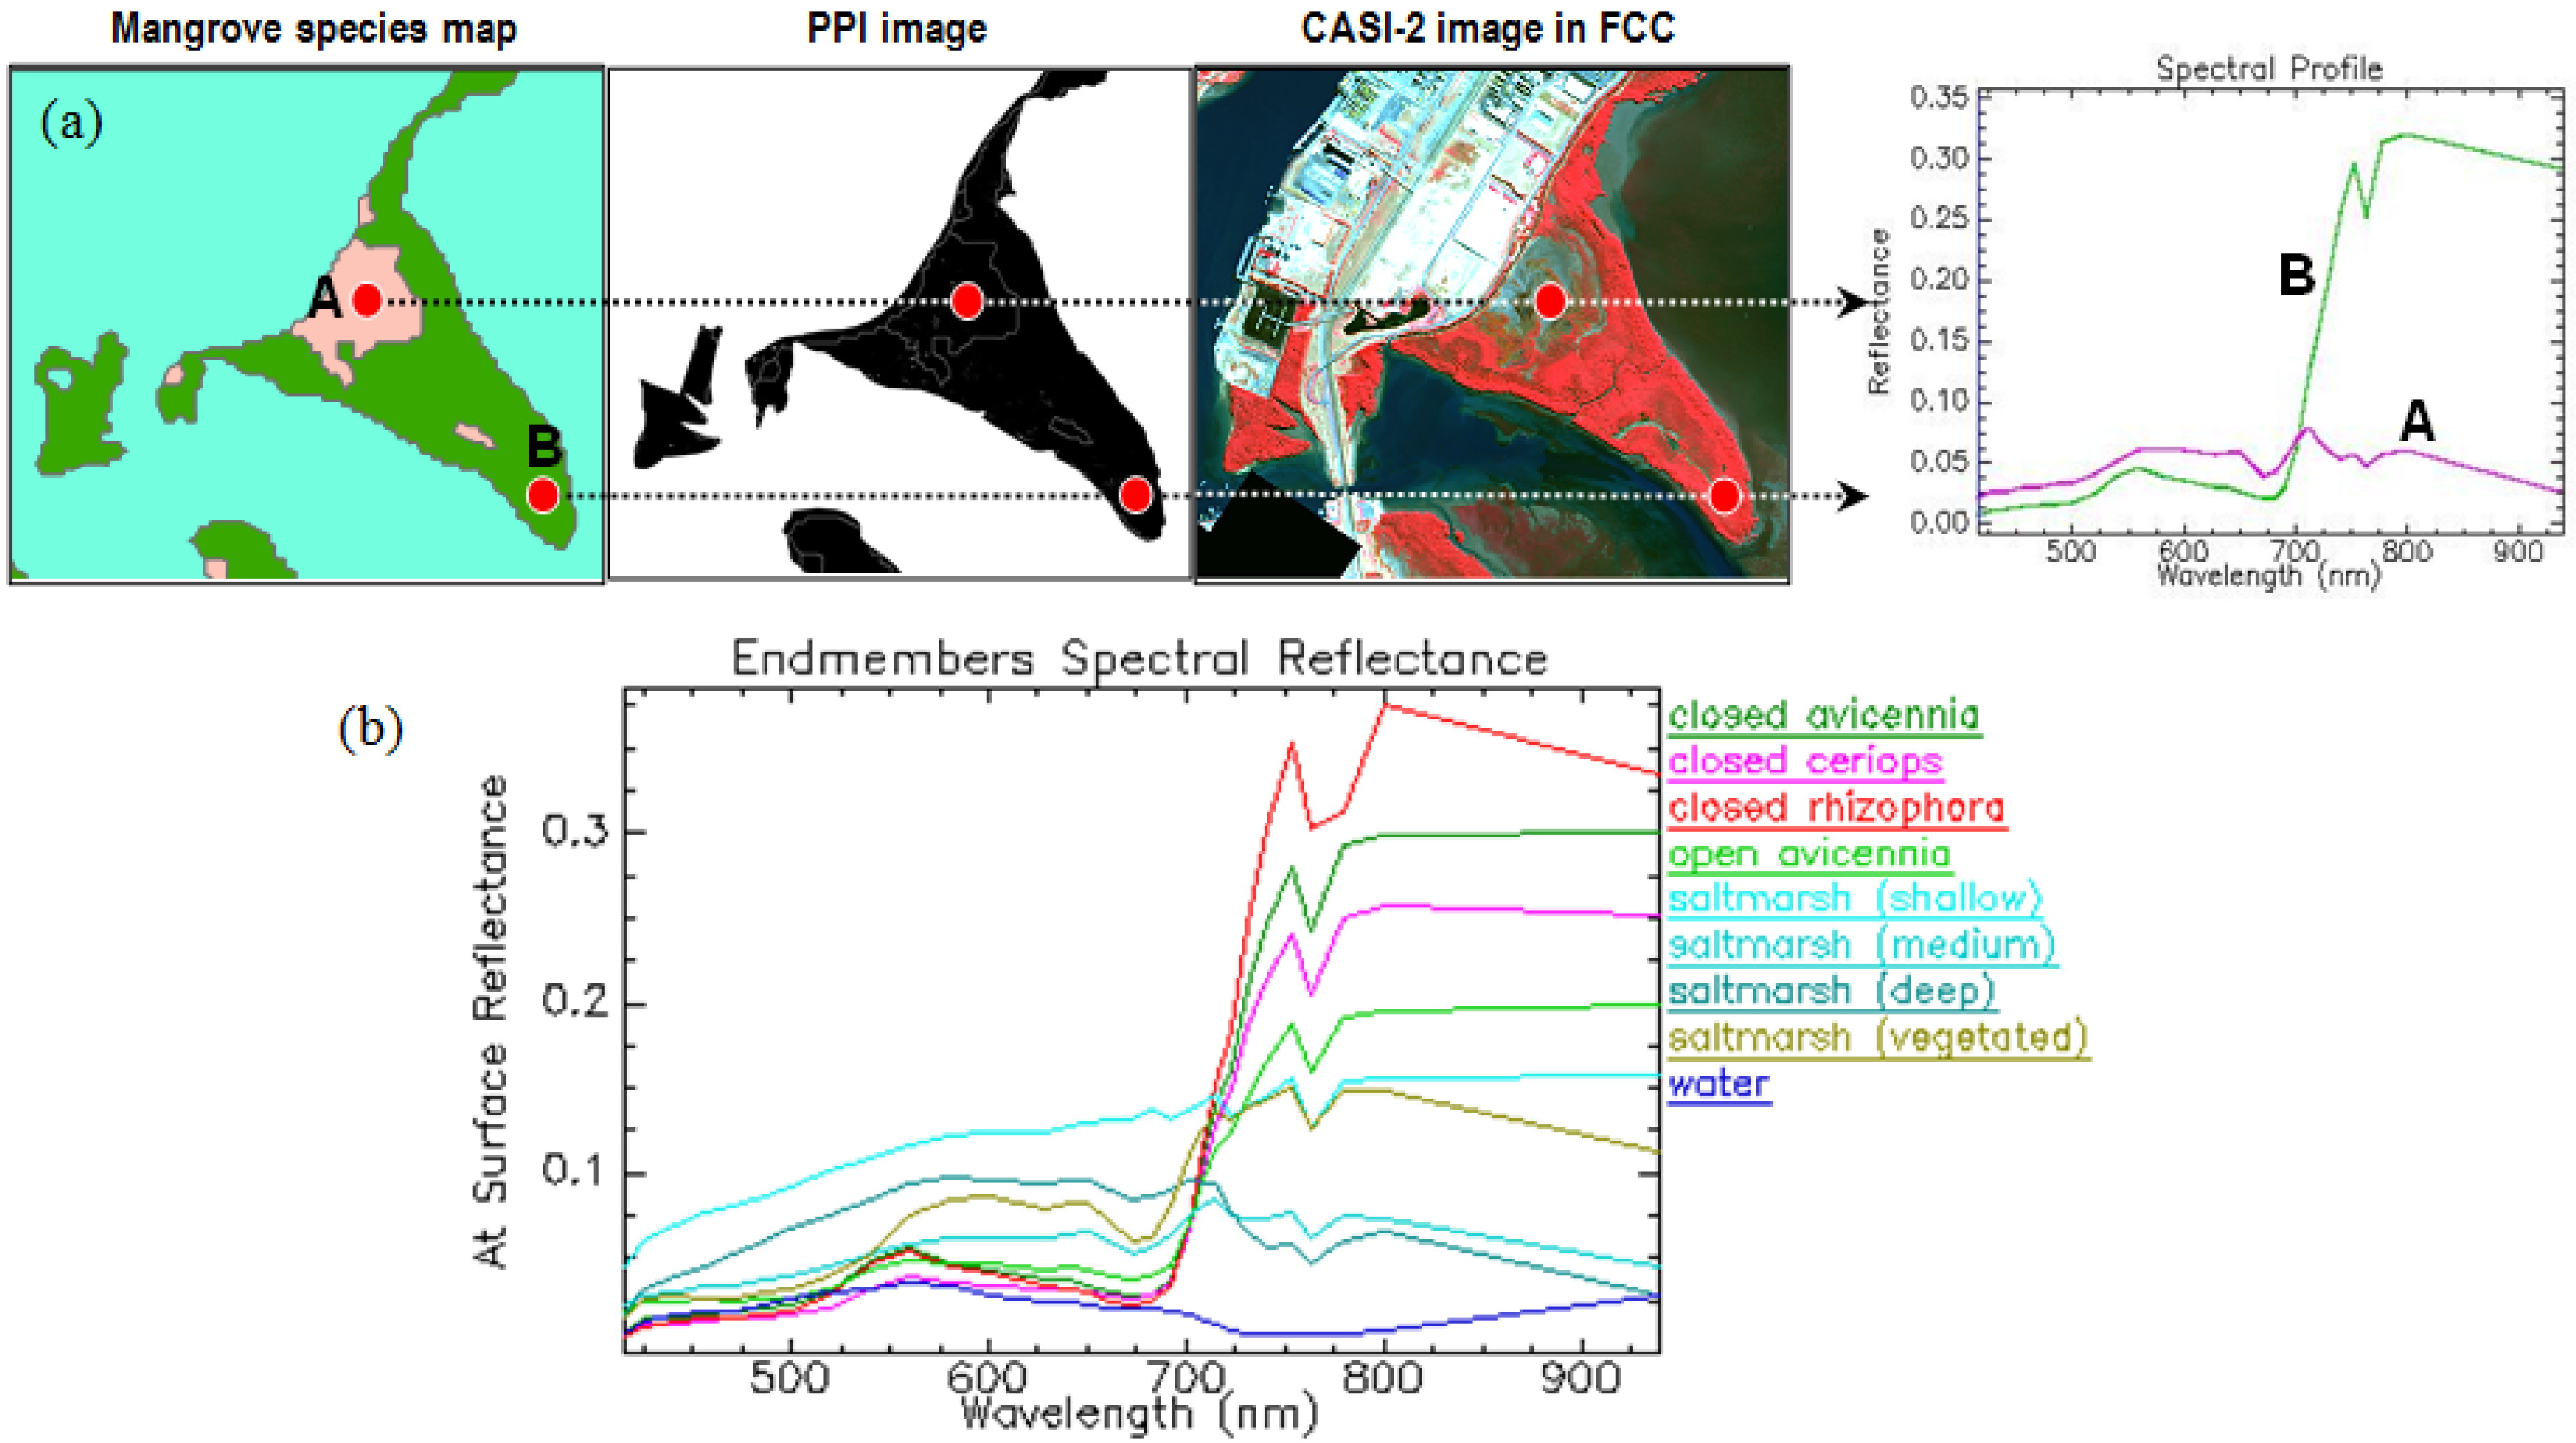
Image endmember reflectance spectra were selected to enable mapping of wetland classes mapping from spectral angle mapper (SAM) and linear spectral unmixing (LSU) algorithms (Figure 2). Image-based endmembers were ideal because they were drawn from the population of data points to be analyzed, increasing the likelihood that the composition of image pixels will be estimated accurately [17,29]. A minimum noise fraction (MNF) transformation was also applied to all of the 30 bands to reduce the dimensionality of hyperspectral data. In addition, as the selection of image endmembers requires identification of homogenous pixels comprised of a dominant cover type, a pixel purity image (PPI) was also produced, and interpreted in relation to the reference map, to identify pixels occupied by one of the target mapping classes which correspond to endmembers [30].
Figure 2. (a) Endmember selection strategy for pixel-based classification. Each image objects’ spectral reflectance was derived from known-associated objects in the map, pixel purity image (PPI) image, and false-color composite (FCC) image. Object code: A is saltmarsh and B is closed Avicennia. (b) The spectral reflectance of the nine-collected endmembers in different color code.
Remotesensing 03 02222 g002
In order to develop spectral signature of known features to be mapped, supporting data were required to ensure appropriate endmember selection. Endmembers were derived from three sources: the existing mangrove species map, false-color composite (FCC) image of CASI-2, and PPI image (Figure 2). There were nine endmembers collected from the study area: four mangrove species classes (closed Avicennia, open Avicennia, closed Rhizophora, closed Ceriops), four saltmarsh classes (deep, medium and shallow, and vegetated saltmarsh), and water bodies (river and others).
The endmembers collected (Figure 2(b)) showed that mangroves classes have similar spectral reflectance pattern. All of the mangrove classes have a typical healthy vegetation spectral reflectance. They have low spectral reflectance in visible bands (approximately 400–700 nm), and dramatically increase in the shifting area between the red and near infrared band, which known as “red edge” region (between 680 and 730 nm). The saltmarsh class contained three variants, due to significant differences in the amounts of vegetation cover and standing water. Vegetated saltmarsh had the highest vegetation cover with limited water cover, while shallow and deep saltmarsh had lower amounts of vegetation cover and higher amounts of standing water.

2.4. Image Classification

2.4.1. Spectral Angle Mapper (Per-Pixel Mapping)
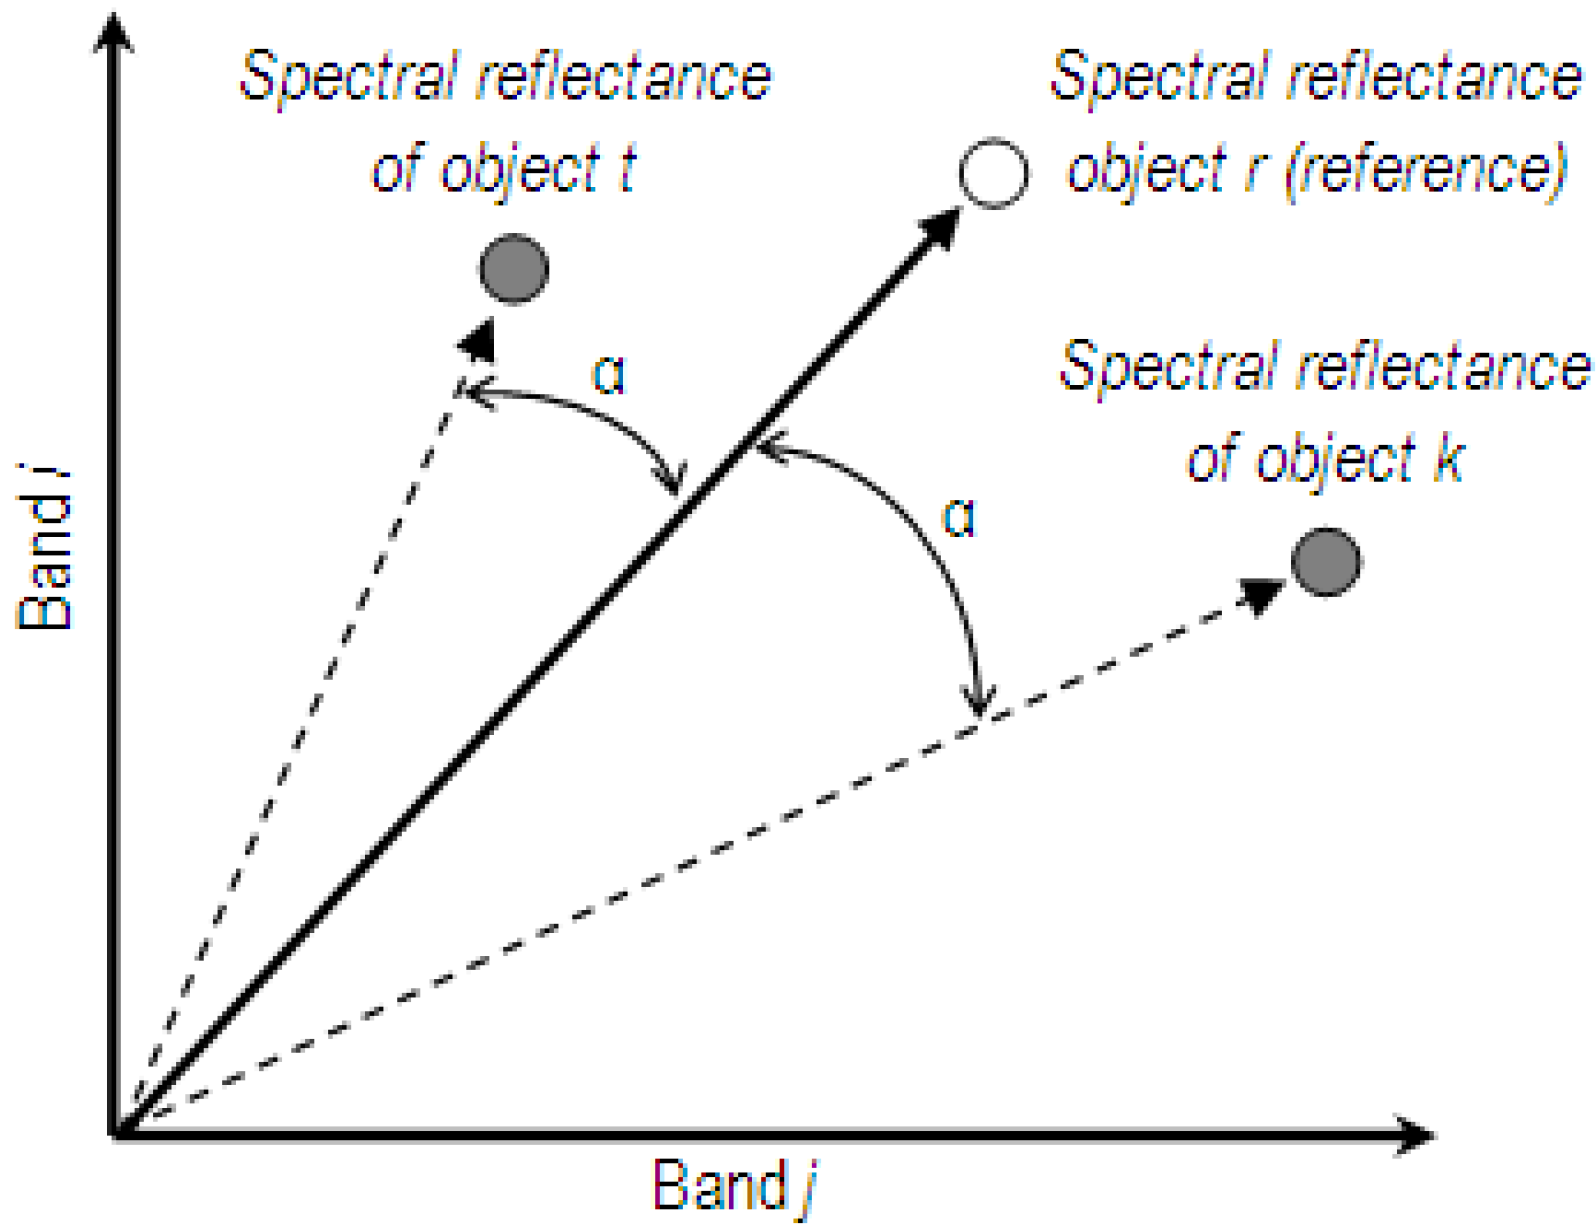
The Spectral Angle Mapper (SAM) technique determines the similarity between two reflectance spectra by calculating the ‘spectral angle’ between them, treating them as vectors in a space with dimensionality equal to the number of bands (Figure 3) [31]. The image reflectance spectra is then assigned a correlation factor between 0 (low correlation) and 1 (high correlation) relative to the reference reflectance spectral library or endmembers. The spectral angle is the angle between any two vectors originating from a common origin. The magnitude of the angle specifies the degree of dis-similarity between material and reference; a smaller angle correlates to a more similar spectral reflectance signature [32].
Figure 3. Diagram of spectral angle between vector representation of image pixel spectral (object t and k in a multi-dimensional image), and the reflectance spectra of reference object in the spectral library. Object t is more similar to the reference than k, i.e., the angle (α) in radians between r and t is smaller (modified from [31], p. 453).
Remotesensing 03 02222 g003
A coincident or small spectral angle between an image pixel and specific feature class reflectance spectra indicates the likelihood that the unknown pixels could be assigned to that feature class [13,31] (Figure 3). Results from the SAM algorithm were displayed as a rule image for each feature class, with image digital numbers representing the spectral angle. In this study, the nine-targeted wetland endmembers were used in the SAM classification, which created nine rule images. In order to create a single classified map, an additional process was then used to combine the rule images into a single image layer by setting up a threshold value to each rule image to determine membership for each class.

2.4.2. Linear Spectral Unmixing (Sub-Pixel Mapping)
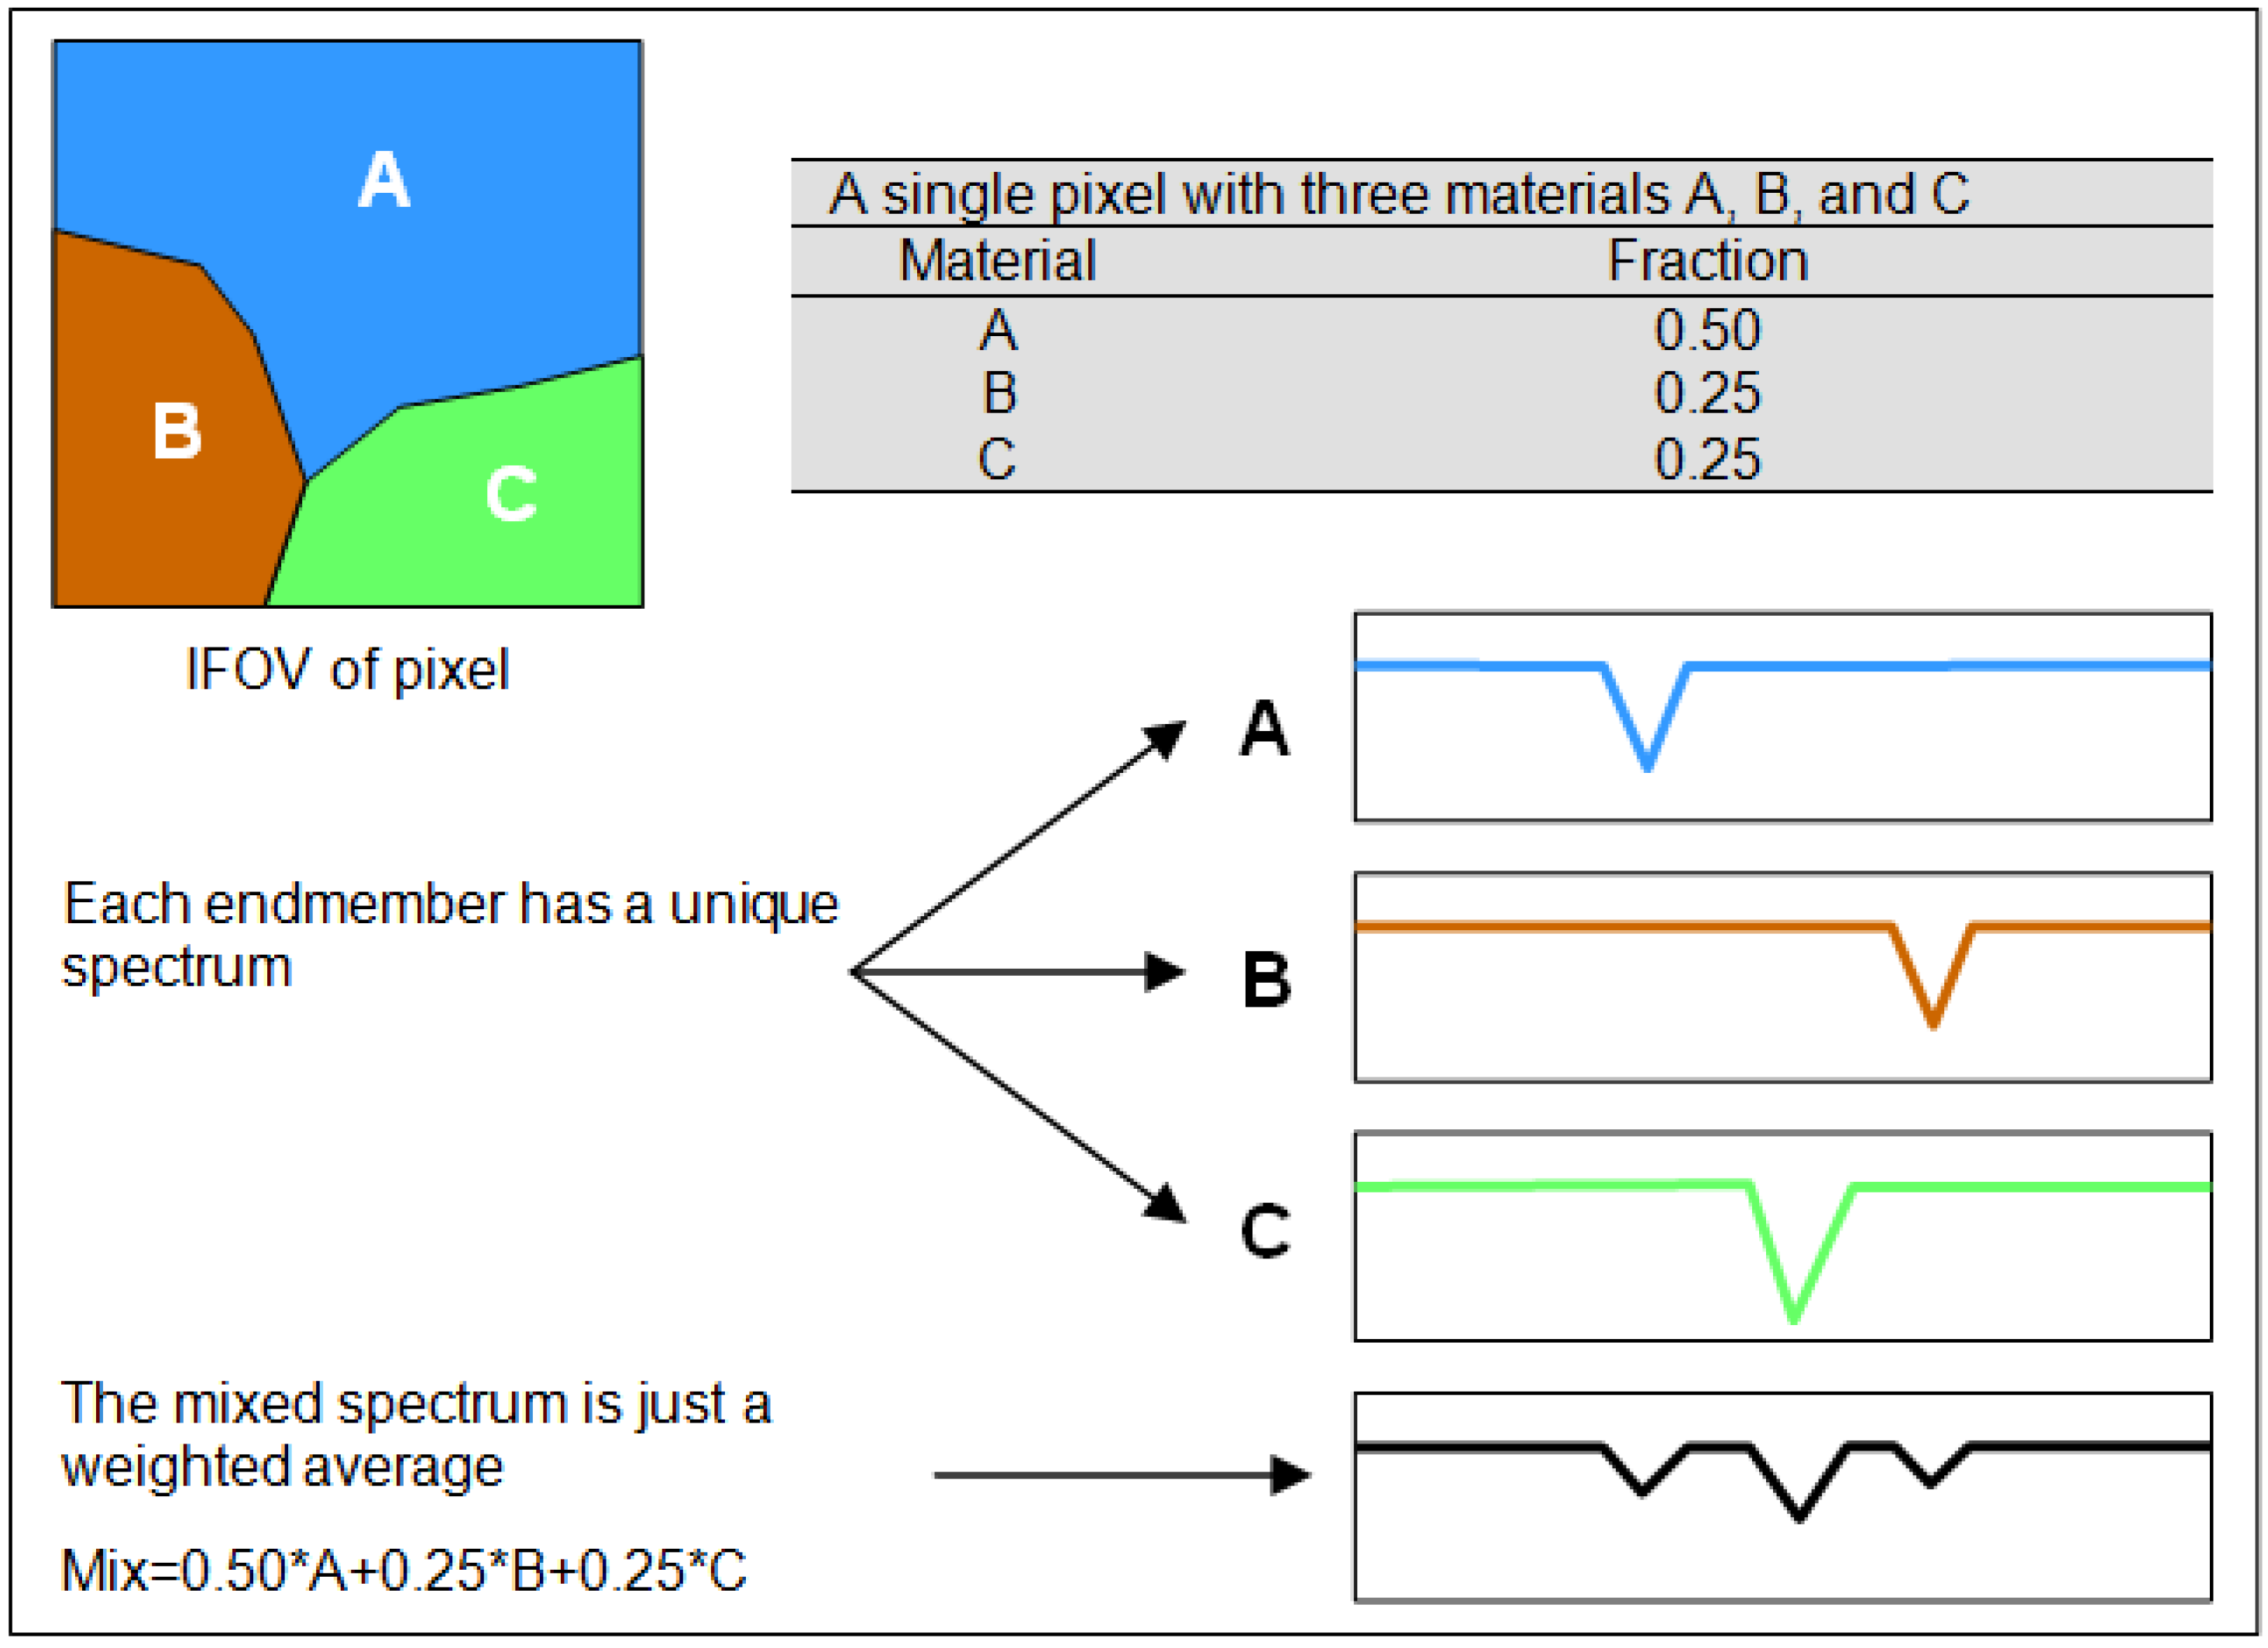
Linear spectral unmixing, also known as sub-pixel sampling or spectral mixture analysis, is a method developed to estimate sub-pixel information or fractional cover of selected target features (endmembers) that contribute to a pixel’s spectral reflectance [17]. This method assumes the reflectance in a pixel is the result of a linear combination or the area weighted sum of reflectance spectra of selected endmembers. The un-mixing algorithm estimates the relative fraction, abundance or area of the pixel occupied by each end-member (Figure 4) [33,34].
This mapping approach is based on the assumption that the reflectance spectra of materials in a sensor’s instantaneous field of view (IFOV) combines linearly, with proportions given by their relative abundances. A reflectance spectrum can be decomposed into a linear mixture of its spectral endmembers [33], where the weighting coefficients of each endmember, were then interpreted as the relative area occupied by each endmember in a pixel (Figure 4). The results produced from this mapping method were fraction images for each of the endmembers or wetland classes, indicating the fraction of a pixel covered by each class.
Figure 4. Principle of spectral mixing and unmixing (modified from [17], Figure 6, p. 48, with kind permission from Springer Science+Business Media B.V.).
Remotesensing 03 02222 g004
In order to produce a single output wetlands map to compare with the other mapping approaches developed in this work, the fraction images needed to be combined into a single image layer. In a similar approach to the SAM rule images, the fraction images were forced into a hard classification type by defining a threshold for each pixel to be assigned to one wetland class and then combined together into one layer. In ENVI, the thresholds were defined prior to the fraction images combination. In this approach, larger weights in relation to the variance of the data cause the unmixing to honor the unit-sum constraint more closely [35].

2.4.3. Object-Based Mapping

Object-based classifications were developed as a means of incorporating hierarchical spatial and contextual information into an image mapping procedure. This approach enables image analysts to work from large simple objects to smaller more complex objects, and use both spatial and spectral reflectance information. An image object can be defined as a grouping of pixel having similar spectral and spatial properties [20,21,36]. In this context the object-based image analysis (OBIA) refers to analyzing the image in an object space rather than in a pixel space, and objects can be used as the primitives for image classification rather than pixel value. The processing approach described here was developed and applied using the Definiens® software, hence some of nomenclature reflects processing operations specific to that software. The process of detecting objects in an image in object-based approach consists of sequences of image segmentation and classification procedures, which together develop the rule sets.
The main task of image segmentation is to partition the whole image into a series of discrete objects, which coincide with the spatial patterns at specific scales. The image is segmented into homogeneous objects based on the spectral information and local pattern or textual information that are included in groups of neighboring pixels [20,21]. Multi-resolution segmentation is a bottom up region-merging technique starting with one-pixel objects. In numerous subsequent steps, smaller image objects are merged into bigger ones. Region growing is among the most commonly used segmentation methods. This procedure starts with the generation of seed points over the whole scene, followed by grouping neighborhood pixels into an object under a specific homogeneity criterion [20]. The object continues to grow until its spectral closeness metric exceeds a predefined break off value (scale factor). Different break-off points result in different object resolution, the higher the break-off values producing larger segmented objects (Figure 5).
The outcome of the segmentation algorithm is controlled by a scale factor and a heterogeneity criterion. The scale factor is indirectly related to the average size of the objects to be detected. The heterogeneity criterion controls the merging process, and is computed using image spectral layers or non-spectral layers, e.g., thematic data such as elevation. This criterion consists of two properties; color and shape. Color refers to the spectral homogeneity, whereas shape considers the semantic characteristics of the objects, which consist of smoothness and compactness [20,37].
Designing appropriate mapping sequences in an object-based approach is a fundamental strategy to obtain accurate results. In contrast to the pixel-based approach which only consider on pixel values, image analysis in this approach is based on more than one object’s features and object levels [37,38]. Different object might have different features composition and semantic classification level. Thus, strategically, to map mangrove species and its environment properly, the mapping process has been broken down into several consecutive sequences.
Figure 5. Example of image segmentation using three different scale parameters.
Remotesensing 03 02222 g005
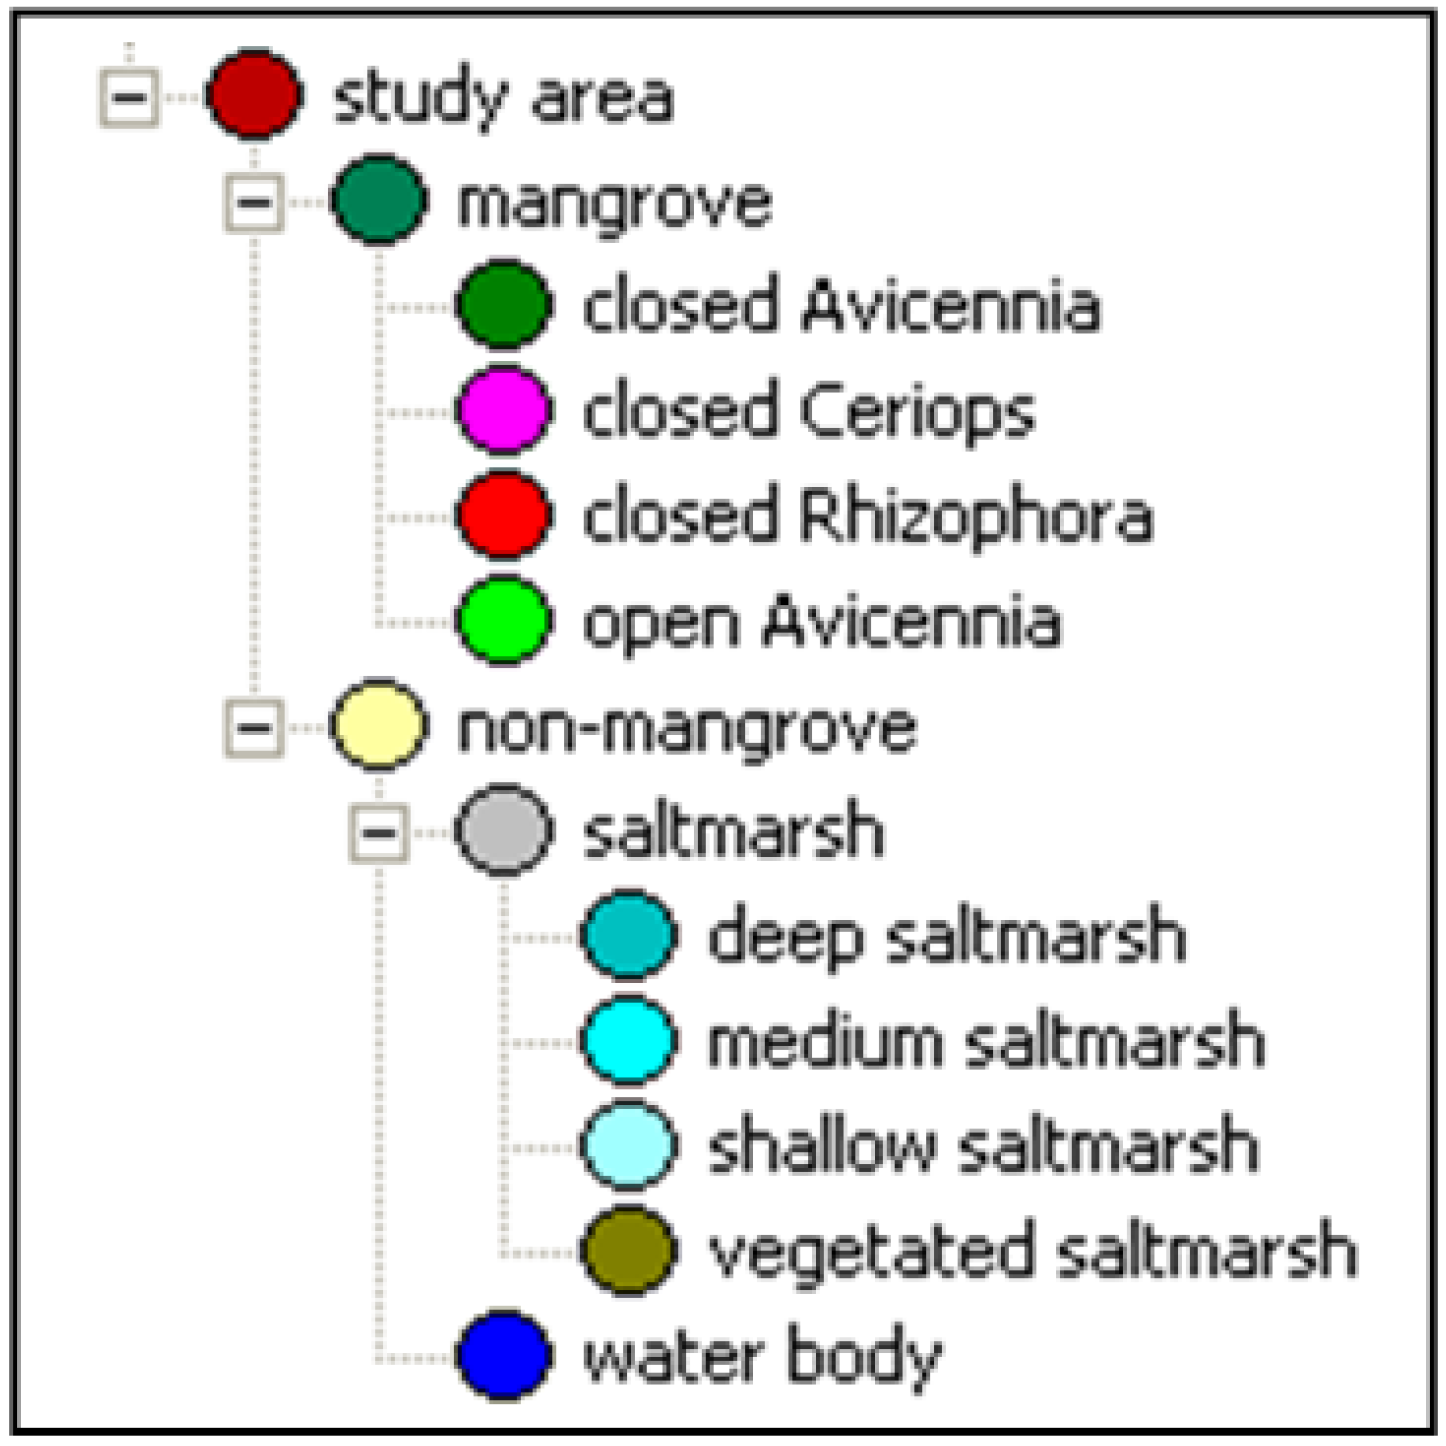
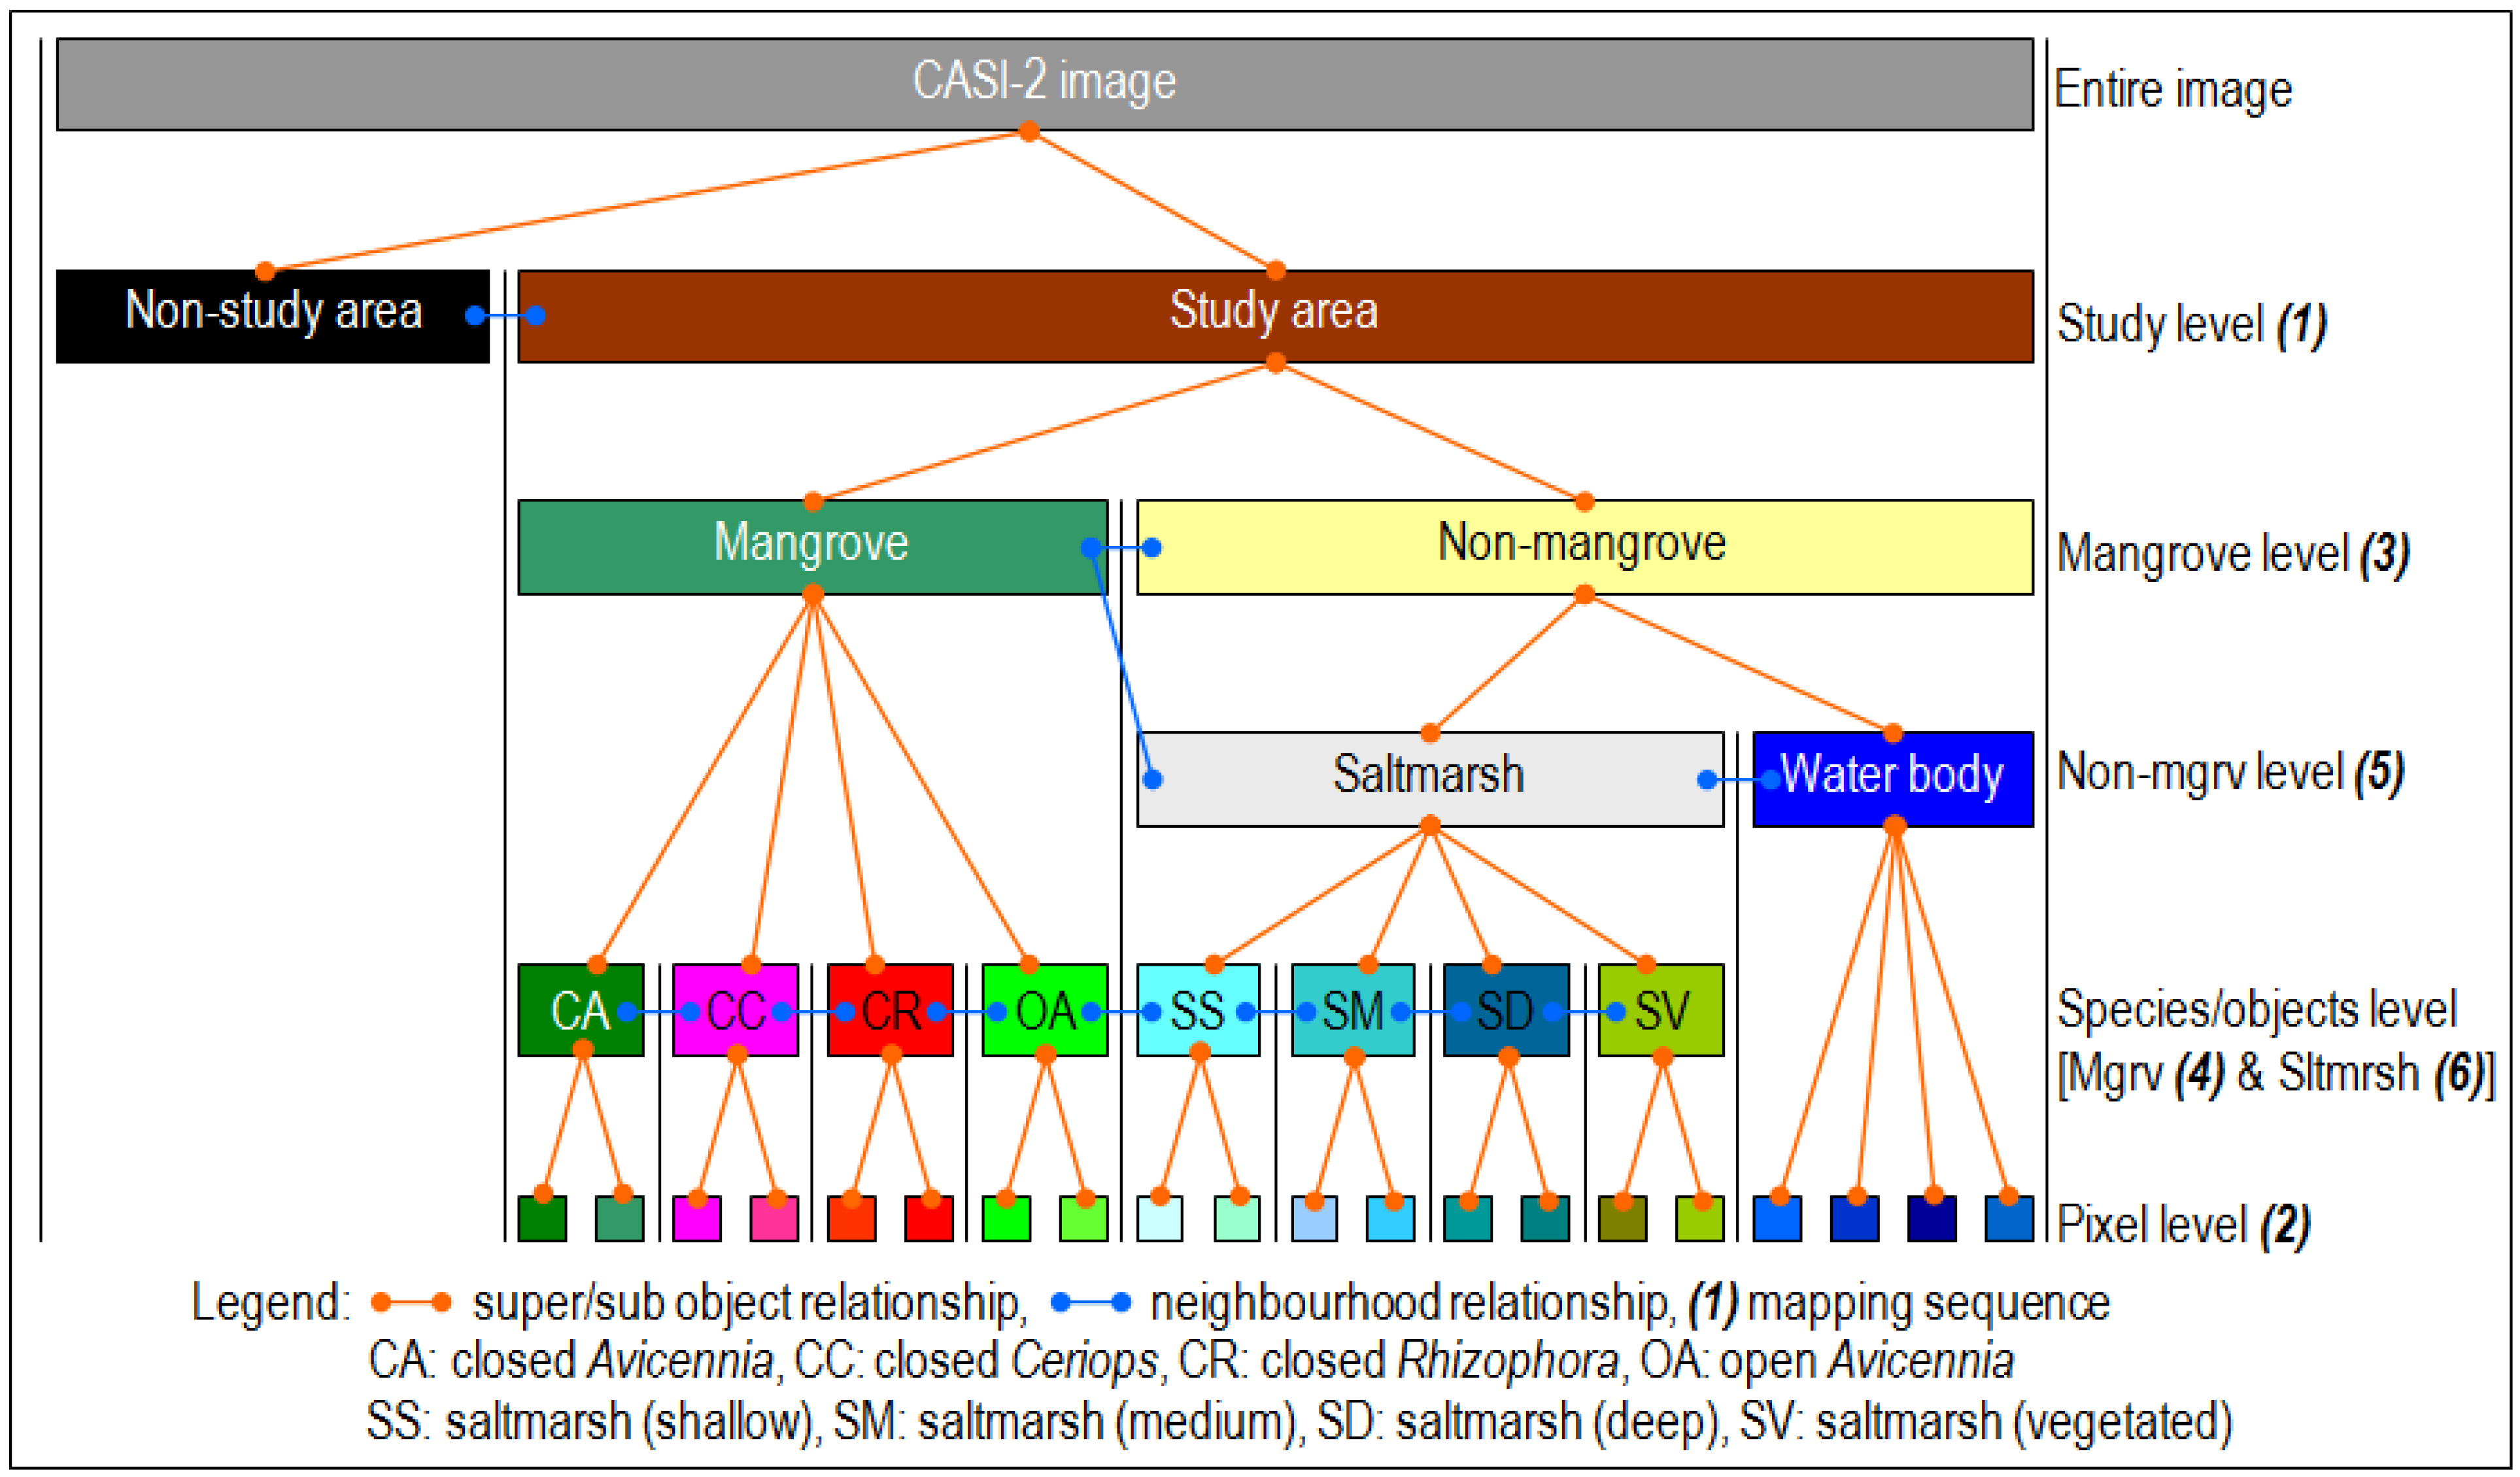
A combination of top-down (subdividing) and bottom-up (merging) segmentation strategy was used in this study. The image was segmented into some image objects during the process of image analysis. According to the developed class hierarchy (Figure 6), the image objects were organized into image object levels on which the image analyses would be performed. In this study, not all of the image extent was used for analysis; only parts of the image where the mangrove stands existed were considered as the study area.
Figure 6. Objects class hierarchy used in this study.
Remotesensing 03 02222 g006
In the classification stage, a combination of nearest neighbor and rule-based classification was used, which form a supervised classification method. The nearest neighbor classifier classifies image by finding the k-neighbor nearest to the new sample from the training space based on a suitable similarity or distance metric [20]. First, sample objects were declared for each class, and then the algorithm searched for the closest sample object in the feature space for each image object. All class assignments in Definiens® were determined by assignment values in the range 01. The closer an image object was located in the feature space to the reference spectral reflectance signature. For a class, the higher the membership function value will be for this class. The best classification result kept the objects with highest membership values [38]. The rule-based classification assigned the class membership according to the object features on the image or the class’ rule. This rule was developed by combining several object feature characteristics which represent the class.

2.5. Error and Accuracy Assessment

Accuracy assessment is an integral part of information extraction from remotely sensed data, since thematic information always contains error [31,39,40]. In this study, the accuracy assessment was performed for each of the classified maps using reference map from the Queensland Herbarium/EPA. The class samples were collected within the area occupied by both classified map and reference map. According to the reference map, there were five classes used to assess the accuracy of classified map, which were closed Avicennia, closed Ceriops, closed Rhizophora, open Avicennia, and Saltmarsh. The four classes of saltmarsh in classified maps were combined to form a single saltmarsh class for this purpose.
The sampling design used in this study was stratified random sampling, which is preferred for remote sensing analysis [31]. 400 samples were collected for this purpose, where each class has different sample size based on the class distribution or importance. The accuracy measures used in this study were error matrix and Kappa coefficient, which both were discrete multivariate techniques. This technique is appropriate for accuracy assessment because remotely sensed data are discrete rather than continuous [31]. An error matrix is the standard way to represent map accuracy, with individual accuracies of each category (class) being described along with both the errors of inclusion (commission errors) and errors of exclusion (omission errors) present in the classification.

3. Results and Discussion

3.1. Image Classification Results

3.1.1. Spectral Angle Mapper

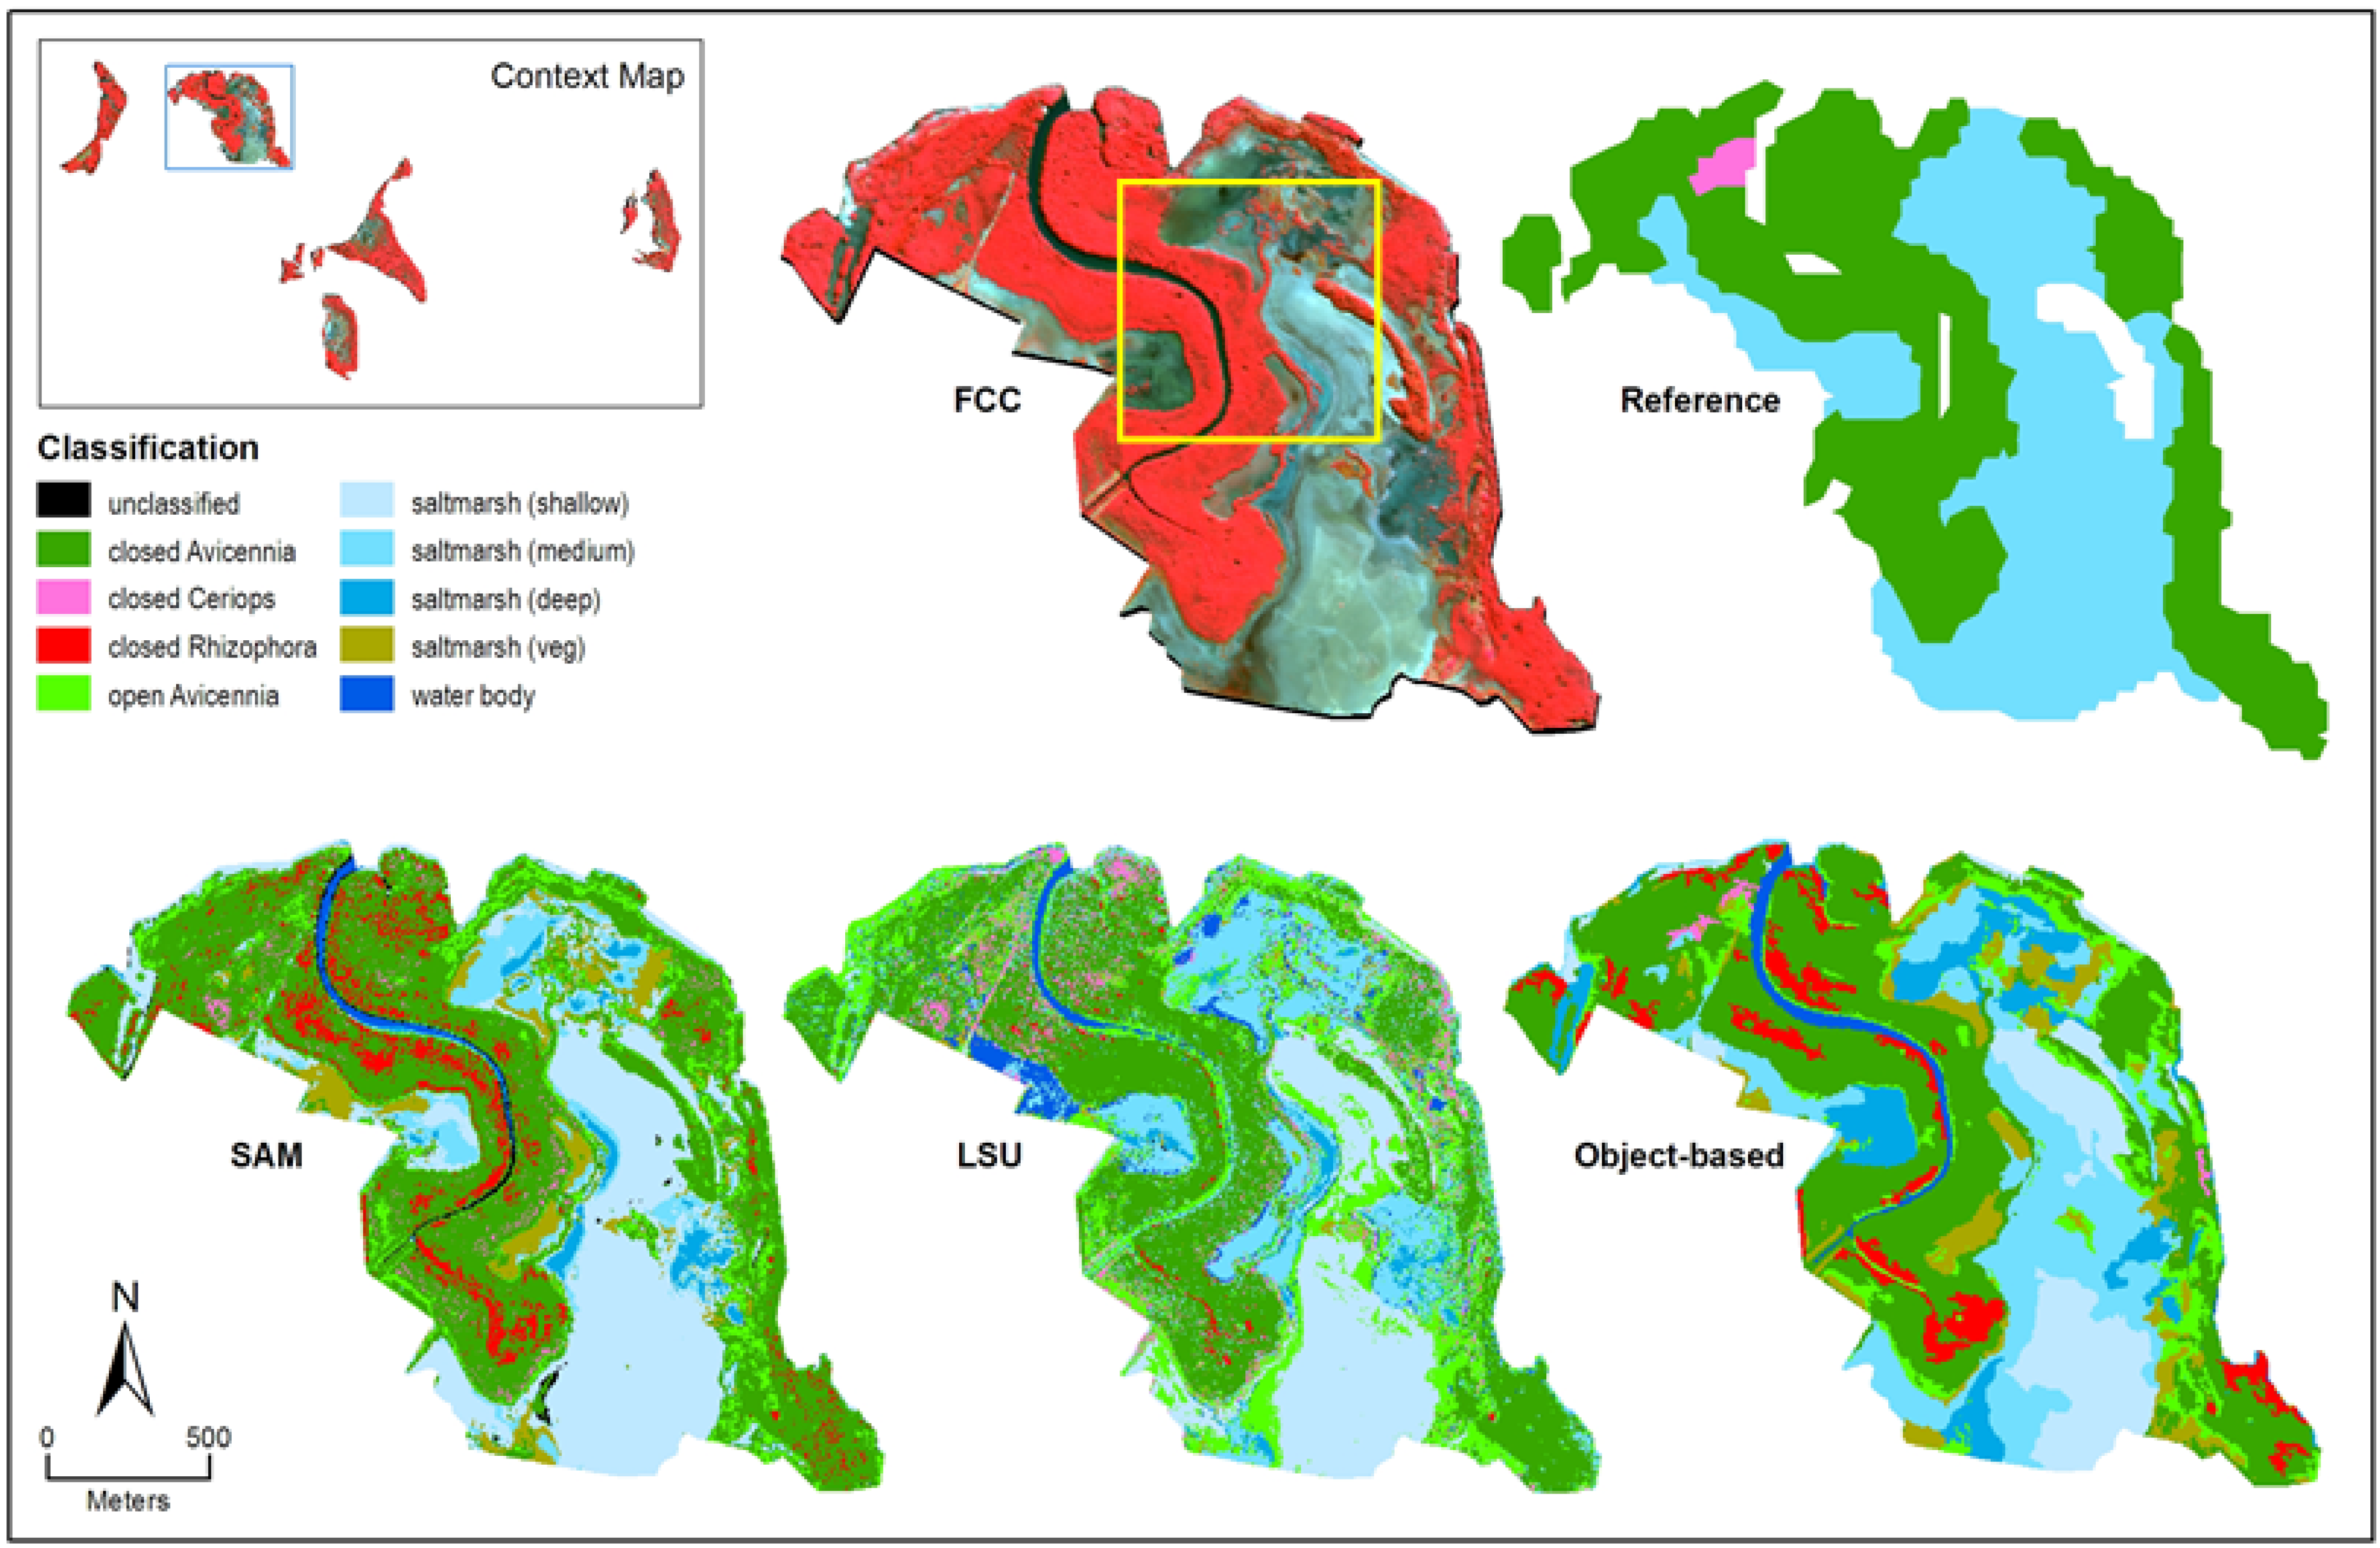
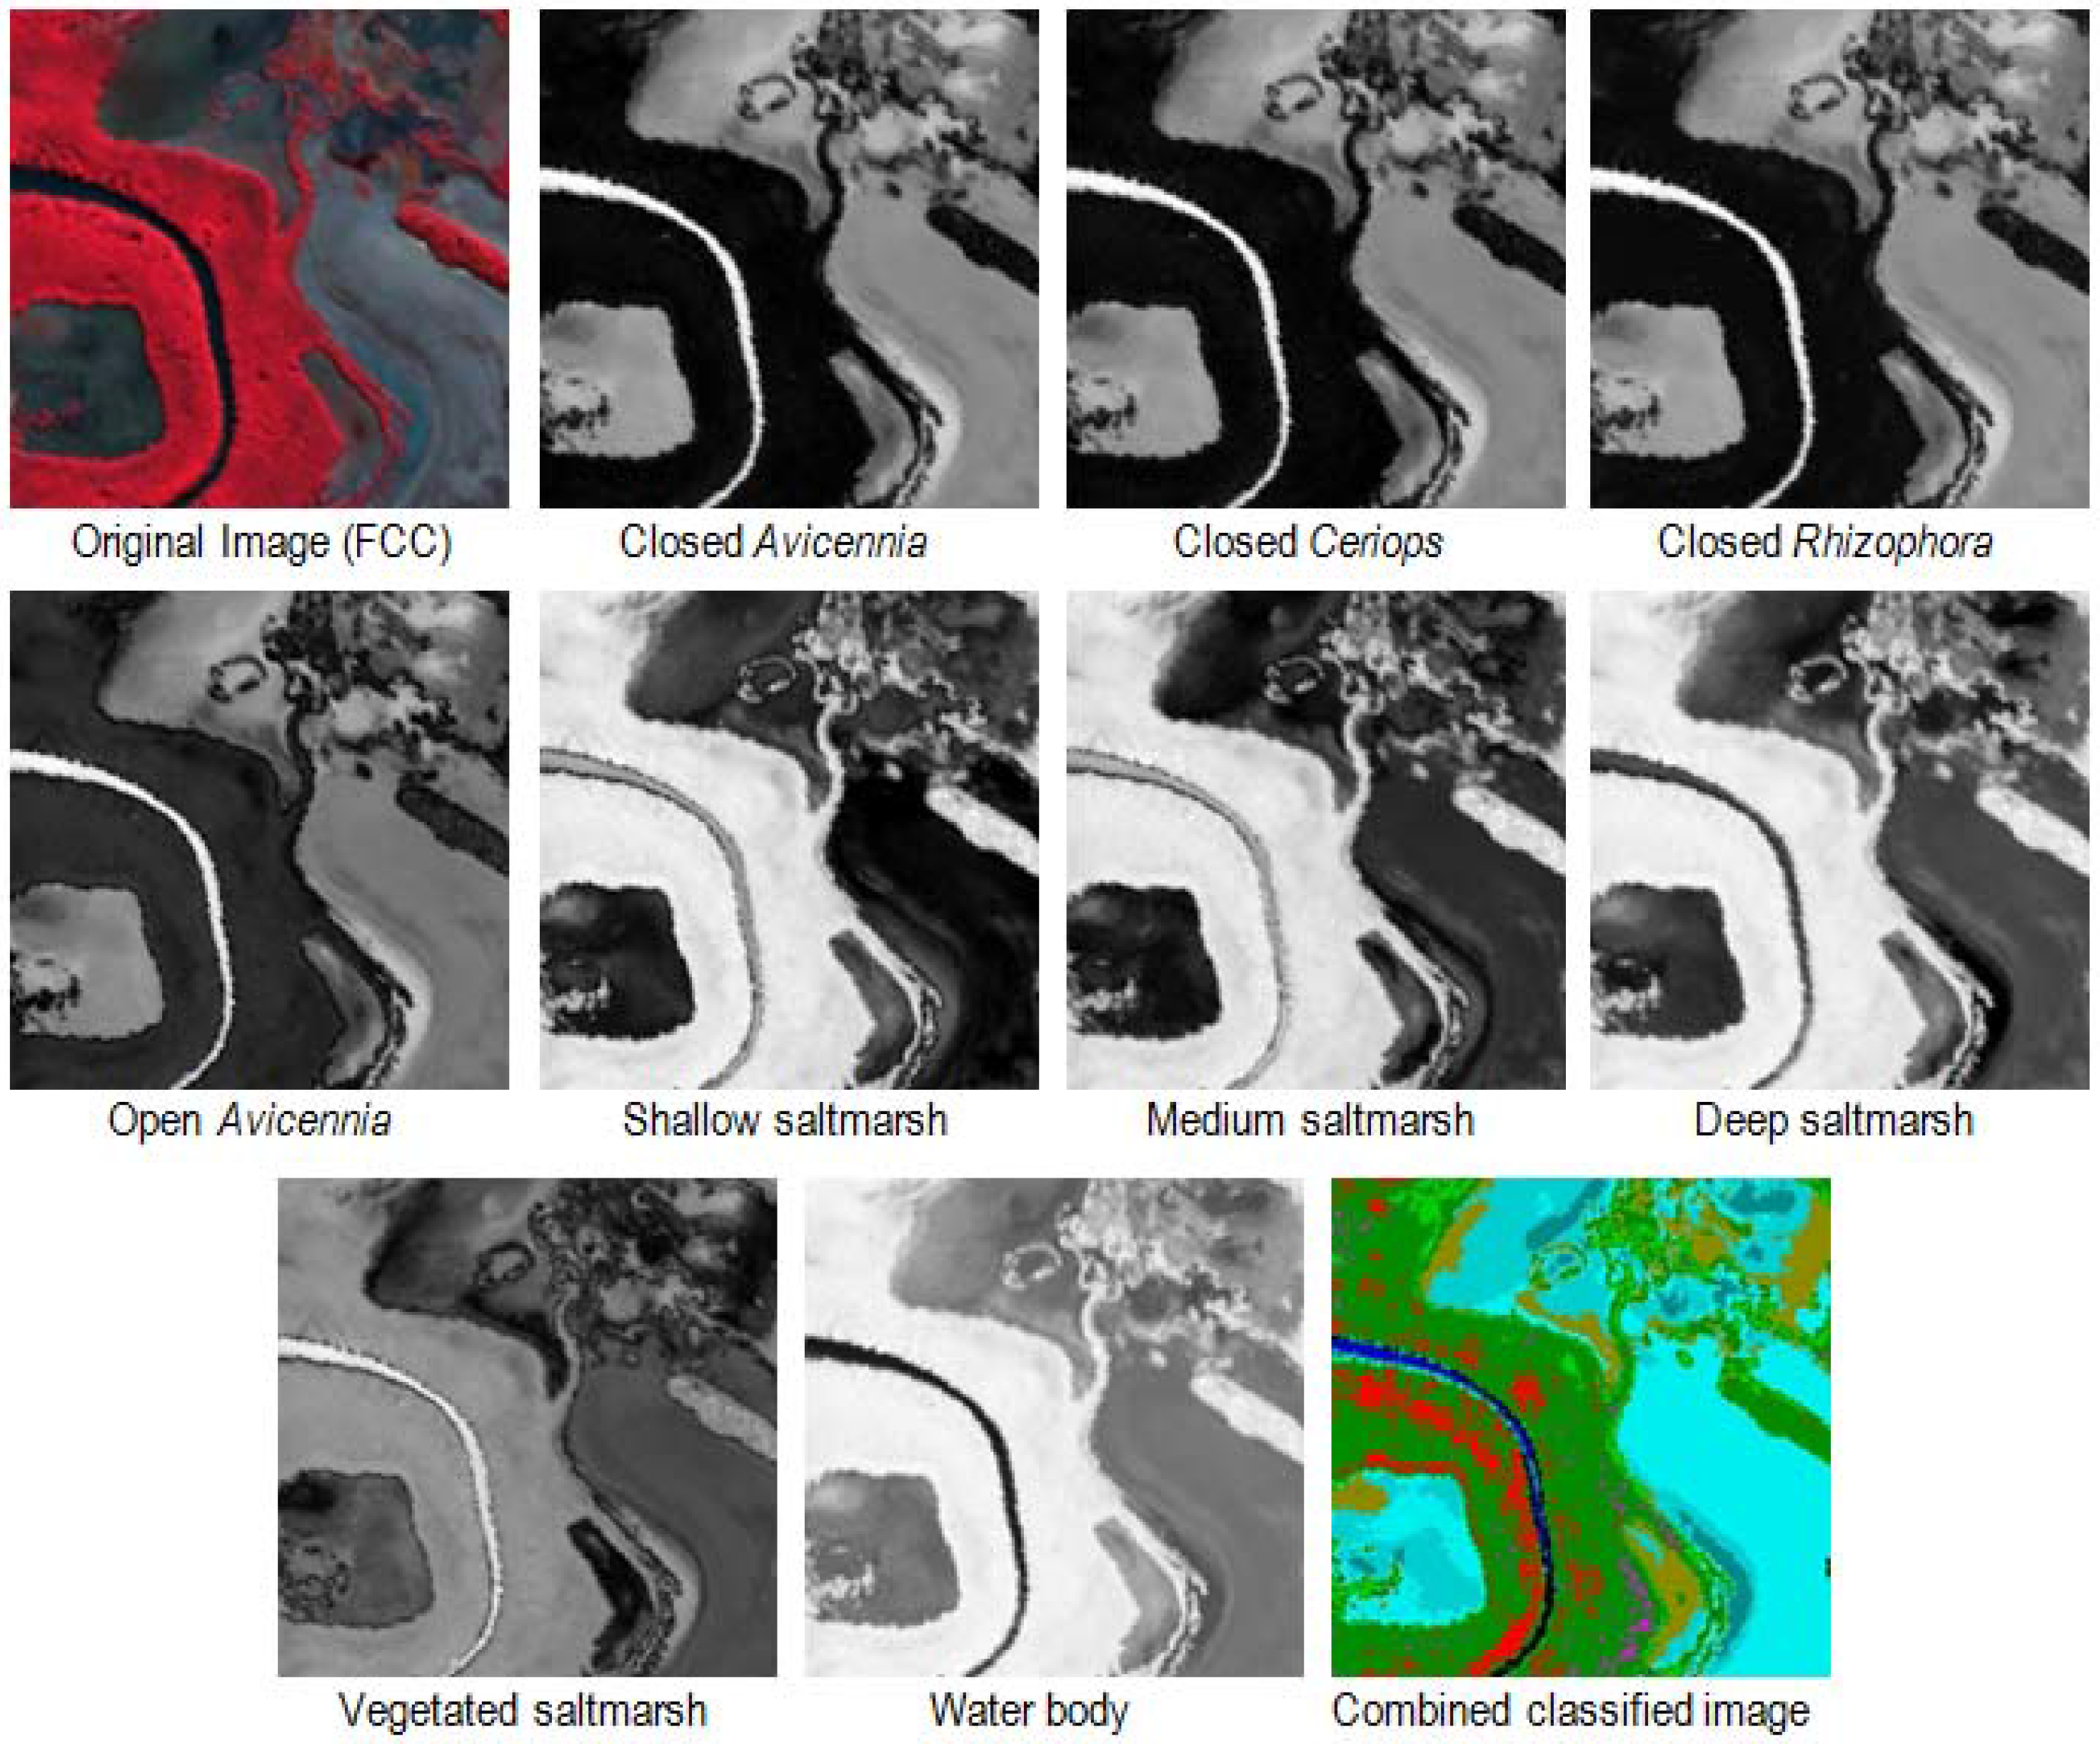
Overall, the class boundaries of resulting SAM classification map produced a high degree of correspondence to the reference map and image features (Figure 7). Figure 8 demonstrates the individual rule images which were used for each class in the final combined classification. Avicennia marina dominated the land cover of the study area, about 55.44% of the total area (Table 2). According to Duke [41], this type of mangrove has remarkable adaptation ability to wide range of temperature conditions, tidal inundation level, moisture condition, salinity variability, and various growing substrates. The Closed Ceriops class exhibited a patchy distribution in the classified map, and occupied only 1.71% of the total study area. Most of this class occurred within the closed Avicennia class, at the upper left of the map. This class has the most similar spectral reflectance to the closed Avicennia and consequently produced some miss-classifications which will be discussed in the accuracy assessment.
Table 2. Summary statistics of the wetland classes for all classified map.
Wetland ClassSAMLSUObject-Based
PixelArea (ha)%PixelArea (ha)%Area (ha)%
Unclassified3,1014.960.659061.450.199.851.28
Closed Avicennia265,894425.4355.44155,560248.9032.43347.2445.25
Closed Ceriops8,18713.101.7120,99233.594.3818.372.39
Closed Rhizophora20,11732.194.192,8094.490.5930.233.94
Open Avicennia69,515111.2214.49142,675228.2829.75122.1615.92
Shallow saltmarsh59,86395.7812.4835,18056.297.3340.695.30
Medium saltmarsh21,43634.304.4795,059152.0919.8272.489.44
Deep saltmarsh5,3138.501.114,2316.770.8829.683.87
Vegetated saltmarsh24,64739.445.146,98311.171.4681.6710.64
Water body (river)1,5652.500.3315,24324.393.1815.041.96
Total479,638767.42100.00479,638767.42100.00767.42100.00
Figure 7. Classification results comparison for one of the selected areas in the study site. The FCC and reference are provided for comparison. Note that reference map has one saltmarsh class only.
Remotesensing 03 02222 g007
Figure 8. Rule images of each class and combined classes of spectral angle mapper (SAM) (see yellow box in Figure 7 for location subset). The greyscale images show the SAM angle, darker objects represent smaller angle, or high similarity to the reference class. The final image resulted from a combination of rule images based on the smallest angle in each reference class.
Remotesensing 03 02222 g008
Closed Rhizophora were mostly found in narrow stands along the river or near the seaward area of closed Avicennia. This is in accordance to their characteristics previously studied. However, the distribution of this class was much wider than the reference map, which only indicated patches on St. Helena Island. Open Avicennia were widely spread throughout the study area, particularly in the inner mainland, and associated with the saltmarsh, and occupies 14.49% of total area (Table 2). Saltmarsh classes occupy the lowland part of the mainland which was inundated due to tidal flow from the Bay and River at the time of image acquisition. This class occupied about 23.20% of the study area or 178.01 hectares. Areas assigned to the water class were mainly small tidal creeks and some patches within the more open saltmarsh.

3.1.2. Linear Spectral Unmixing

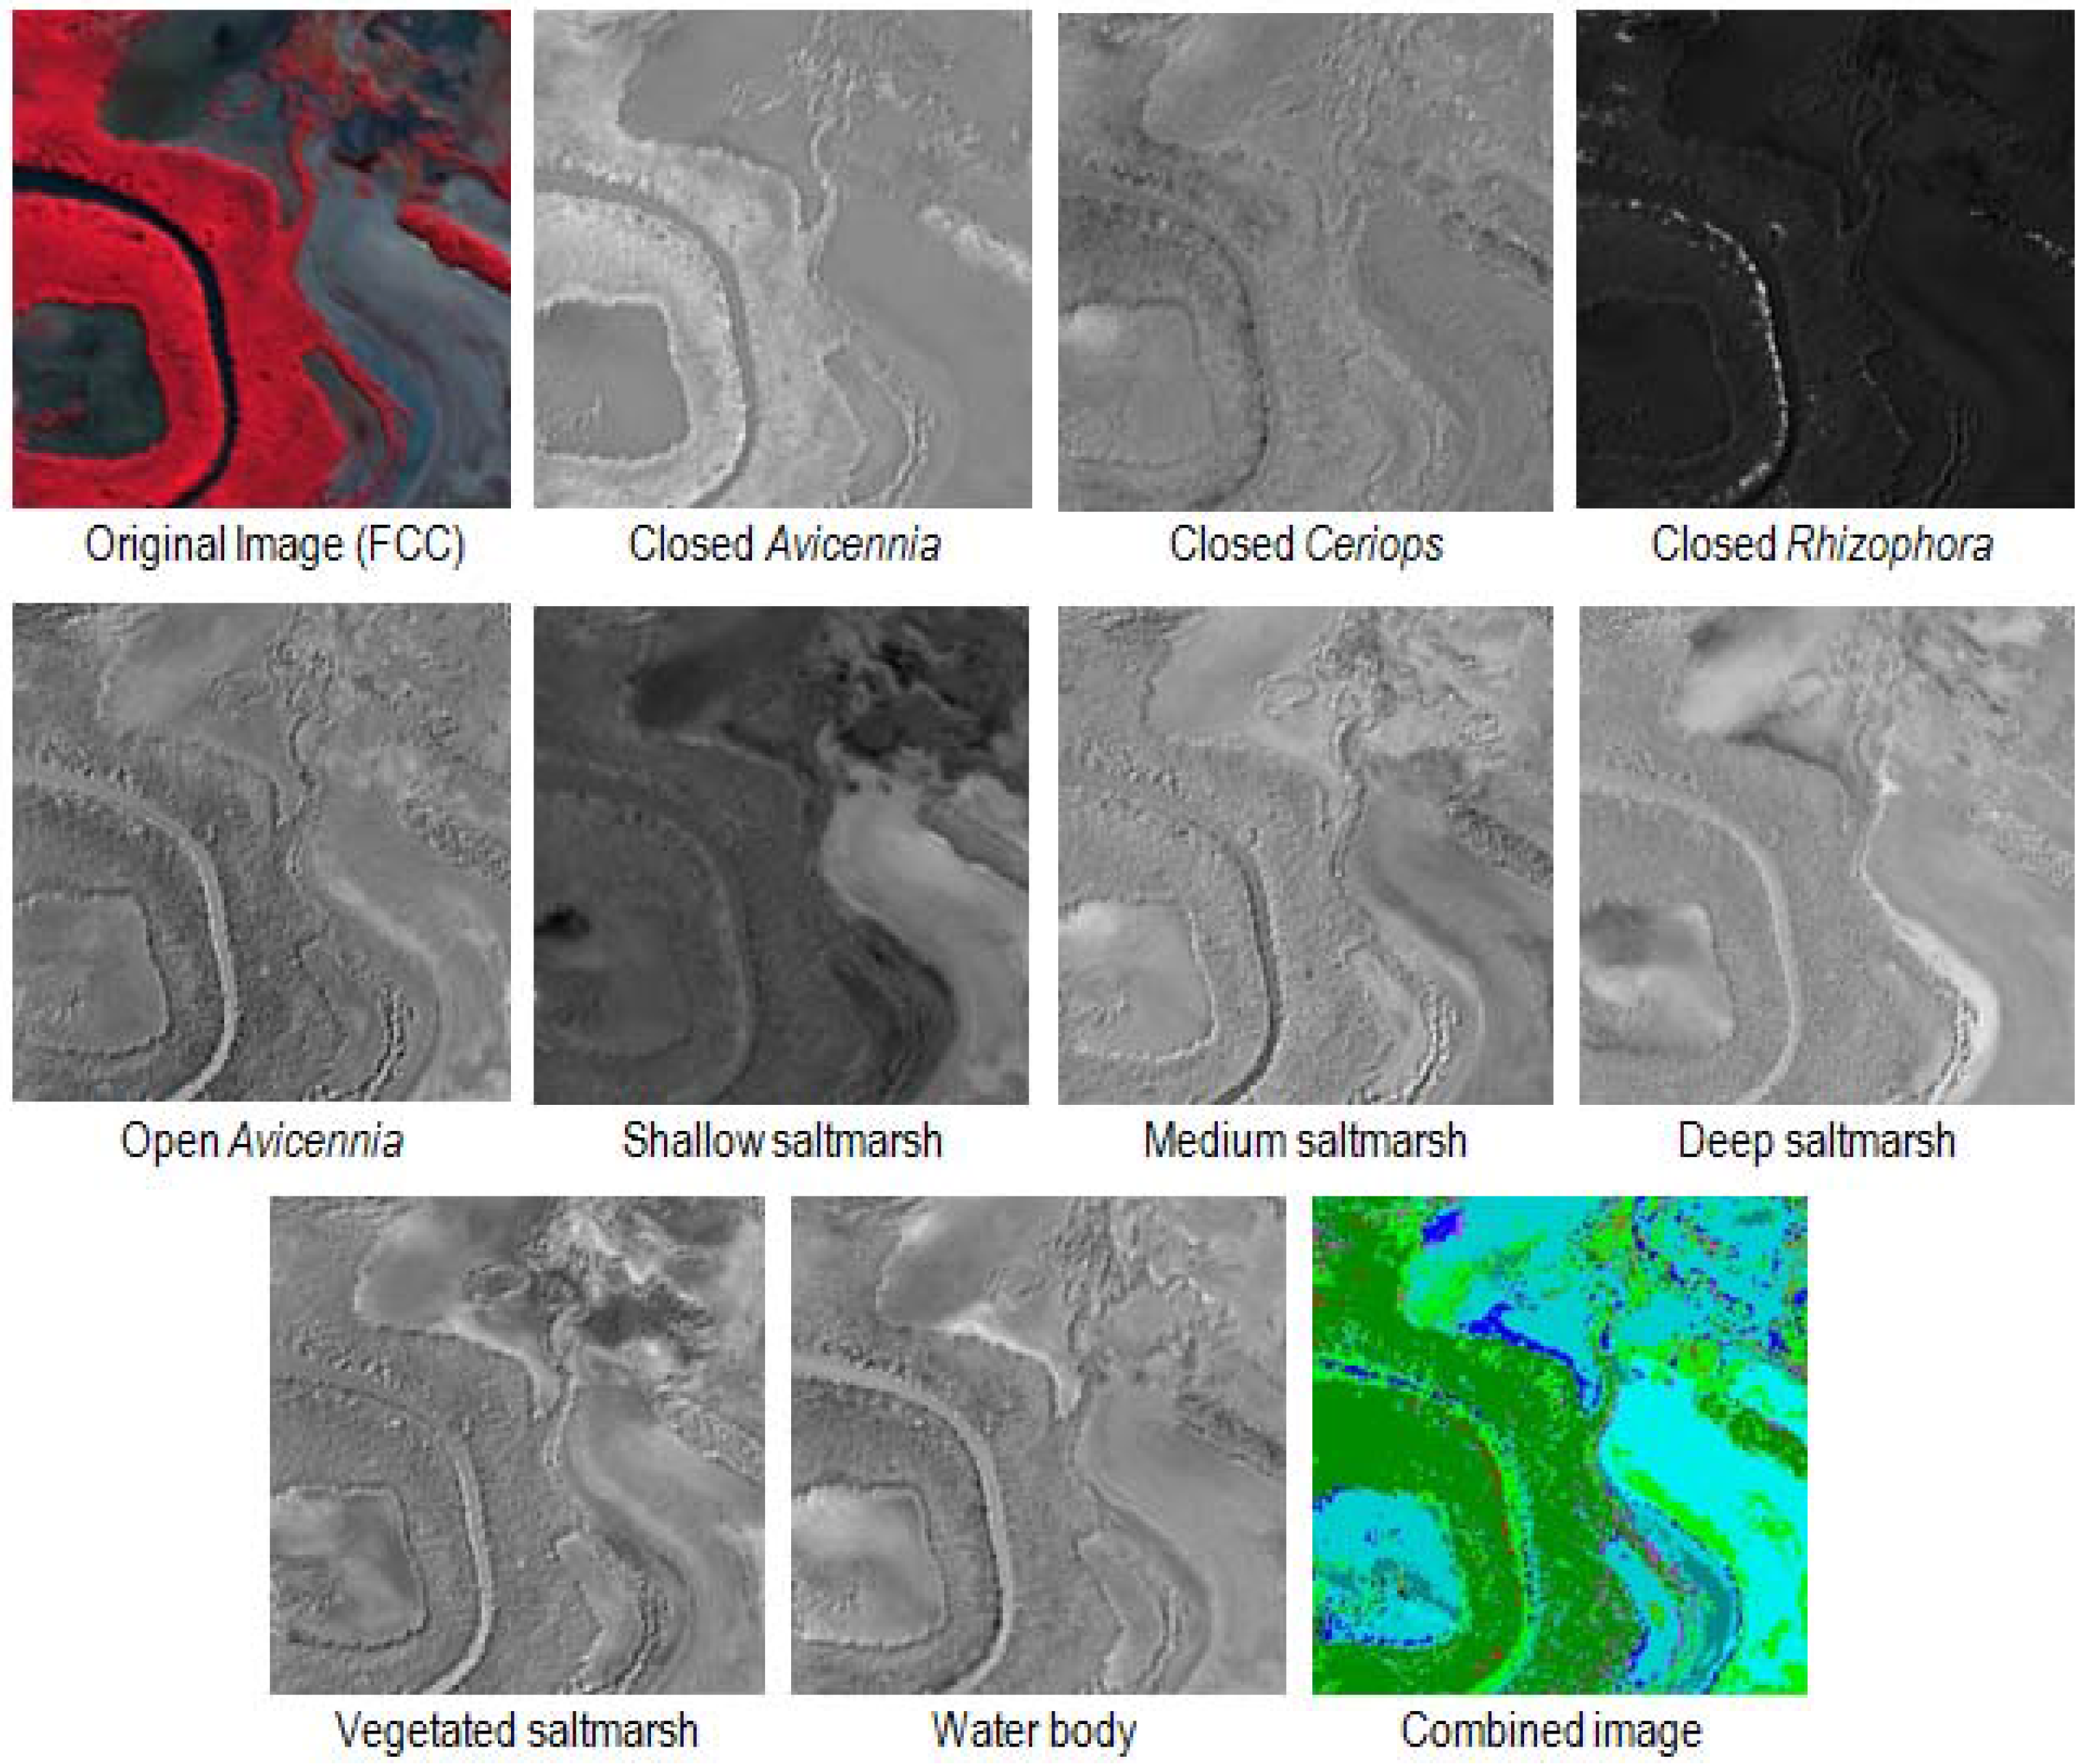
The results of spectral unmixing were a series of gray-scale images, one for each endmember, plus a root-mean-square (RMS) error image (Figure 9). Higher abundances, and higher errors for the RMS error image, were represented by brighter pixels. The unmixing results should have a data range from 0 to 1, which represent endmembers’ abundance or fractional cover. The RMS error images were used to determine areas of missing or inappropriate endmembers.
Figure 9. Linear spectral unmixing (LSU) images of each class and combined classification result. The greyscale images show the objects abundance or fractional cover of a pixel, brighter pixel represents higher abundance or fractional cover. The final combined classification image was produced after applying thresholds to each individual abundance/fraction image. See Figure 7 for classes’ legend to interpret the combined classified image.
Remotesensing 03 02222 g009
The resulting classification map shows a different pattern compared to the SAM classified maps (Figure 8). The classes were patchier and less contiguous than on the SAM map. In terms of class distribution, the most noticeable difference was found between closed Avicennia, open Avicennia and medium saltmarsh classes. In this classification, closed Avicennia and open Avicennia have a very high value of area, followed by medium saltmarsh. These three classes were distributed extensively on the map, with the percentage of 32.43%, 29.75%, and 19.82% respectively (Table 2). The two most markedly different classified areas were found at Fisherman Islands and St. Helena Island. Most of the saltmarsh classes produced by SAM at Fisherman Islands were classified as open Avicennia. Therefore, the percentage of this class in LSU classification increased significantly. At St. Helena Island, most of closed Avicennia class from SAM was classified as saltmarsh in this classification. Hence, this considerably reduces the percentage of closed Avicennia class.

3.1.3. Object-Based Classification

In object-based approach, the essential process prior to mapping objects is to design the appropriate mapping approach. Figure 10 shows the mapping approach used in this study, this is including decisions on how objects and sub-objects related in an image object hierarchy. The first process was intended to separate the image objects between mangrove and non-mangrove classes within the study area. However, prior to the separation process, a chessboard segmentation in pixel level detail was performed. This process was intended to maintain pixels’ spectral information for mangrove species discrimination in the next sequence. If a multi-resolution segmentation applied in this stage, the individual pixels information would be lost, which consequently between mangrove species discrimination would be difficult. The separation of mangrove and non-mangrove class used rule-based classification in regard to pixels’ features, and generating a ‘Mangrove Level’.
Figure 10. Image object hierarchy and the mapping sequences.
Remotesensing 03 02222 g010
Based on pixel features, the mangrove species classes were then discriminated within mangrove class using a rule-based classification. This classification used because although the mangrove species discrimination was guided by existing mangrove map, the species visual appearances on image were indivisible. This stage generated ‘Mgrv Level’. Non-mangrove class was broken down into saltmarsh and water body prior to detailed division of saltmarsh class which generated ‘Non-mgrv Level’. Water body (i.e., river water) has a unique feature on image, it has nearly black in colour and elongated shape. Thus, this object was separated in advance from saltmarsh object using rule-based classification before saltmarsh classes’ discrimination. Saltmarsh classes were then distinguished using sample or training and test area (TTA) because their differences were very clear, generating ‘Sltmrsh Level’.

3.2. Comparison between Classification Approaches
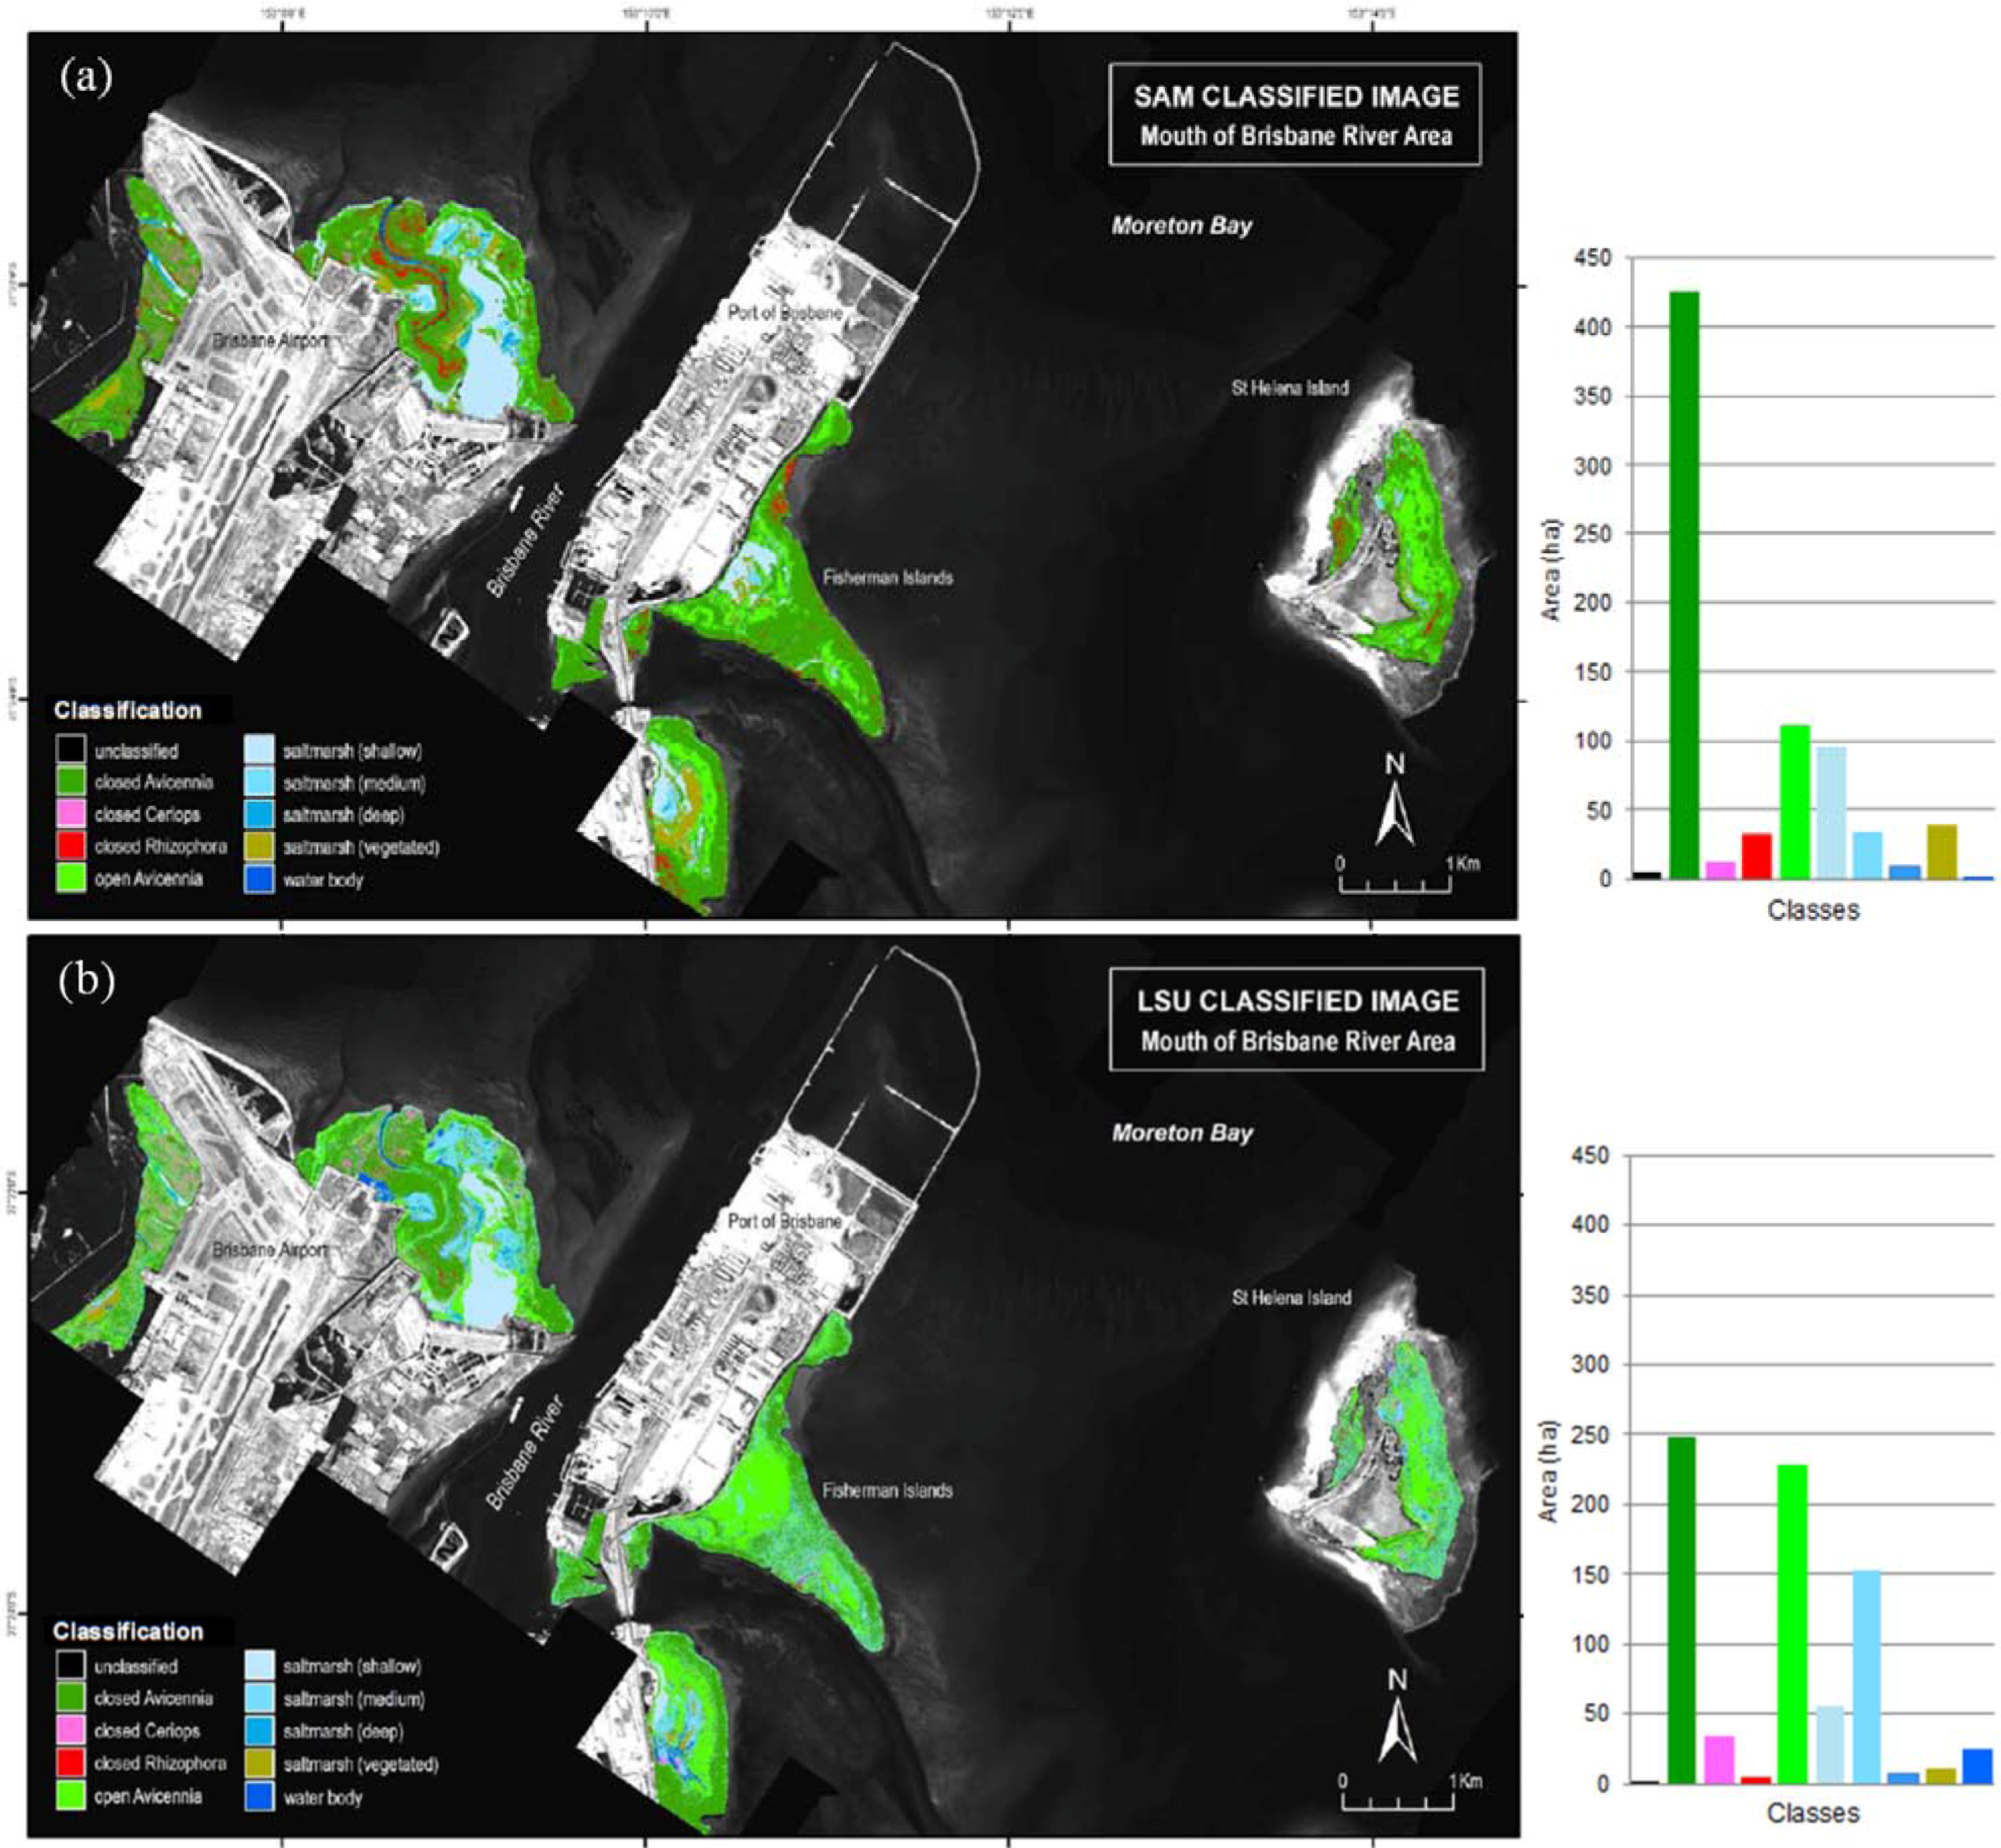
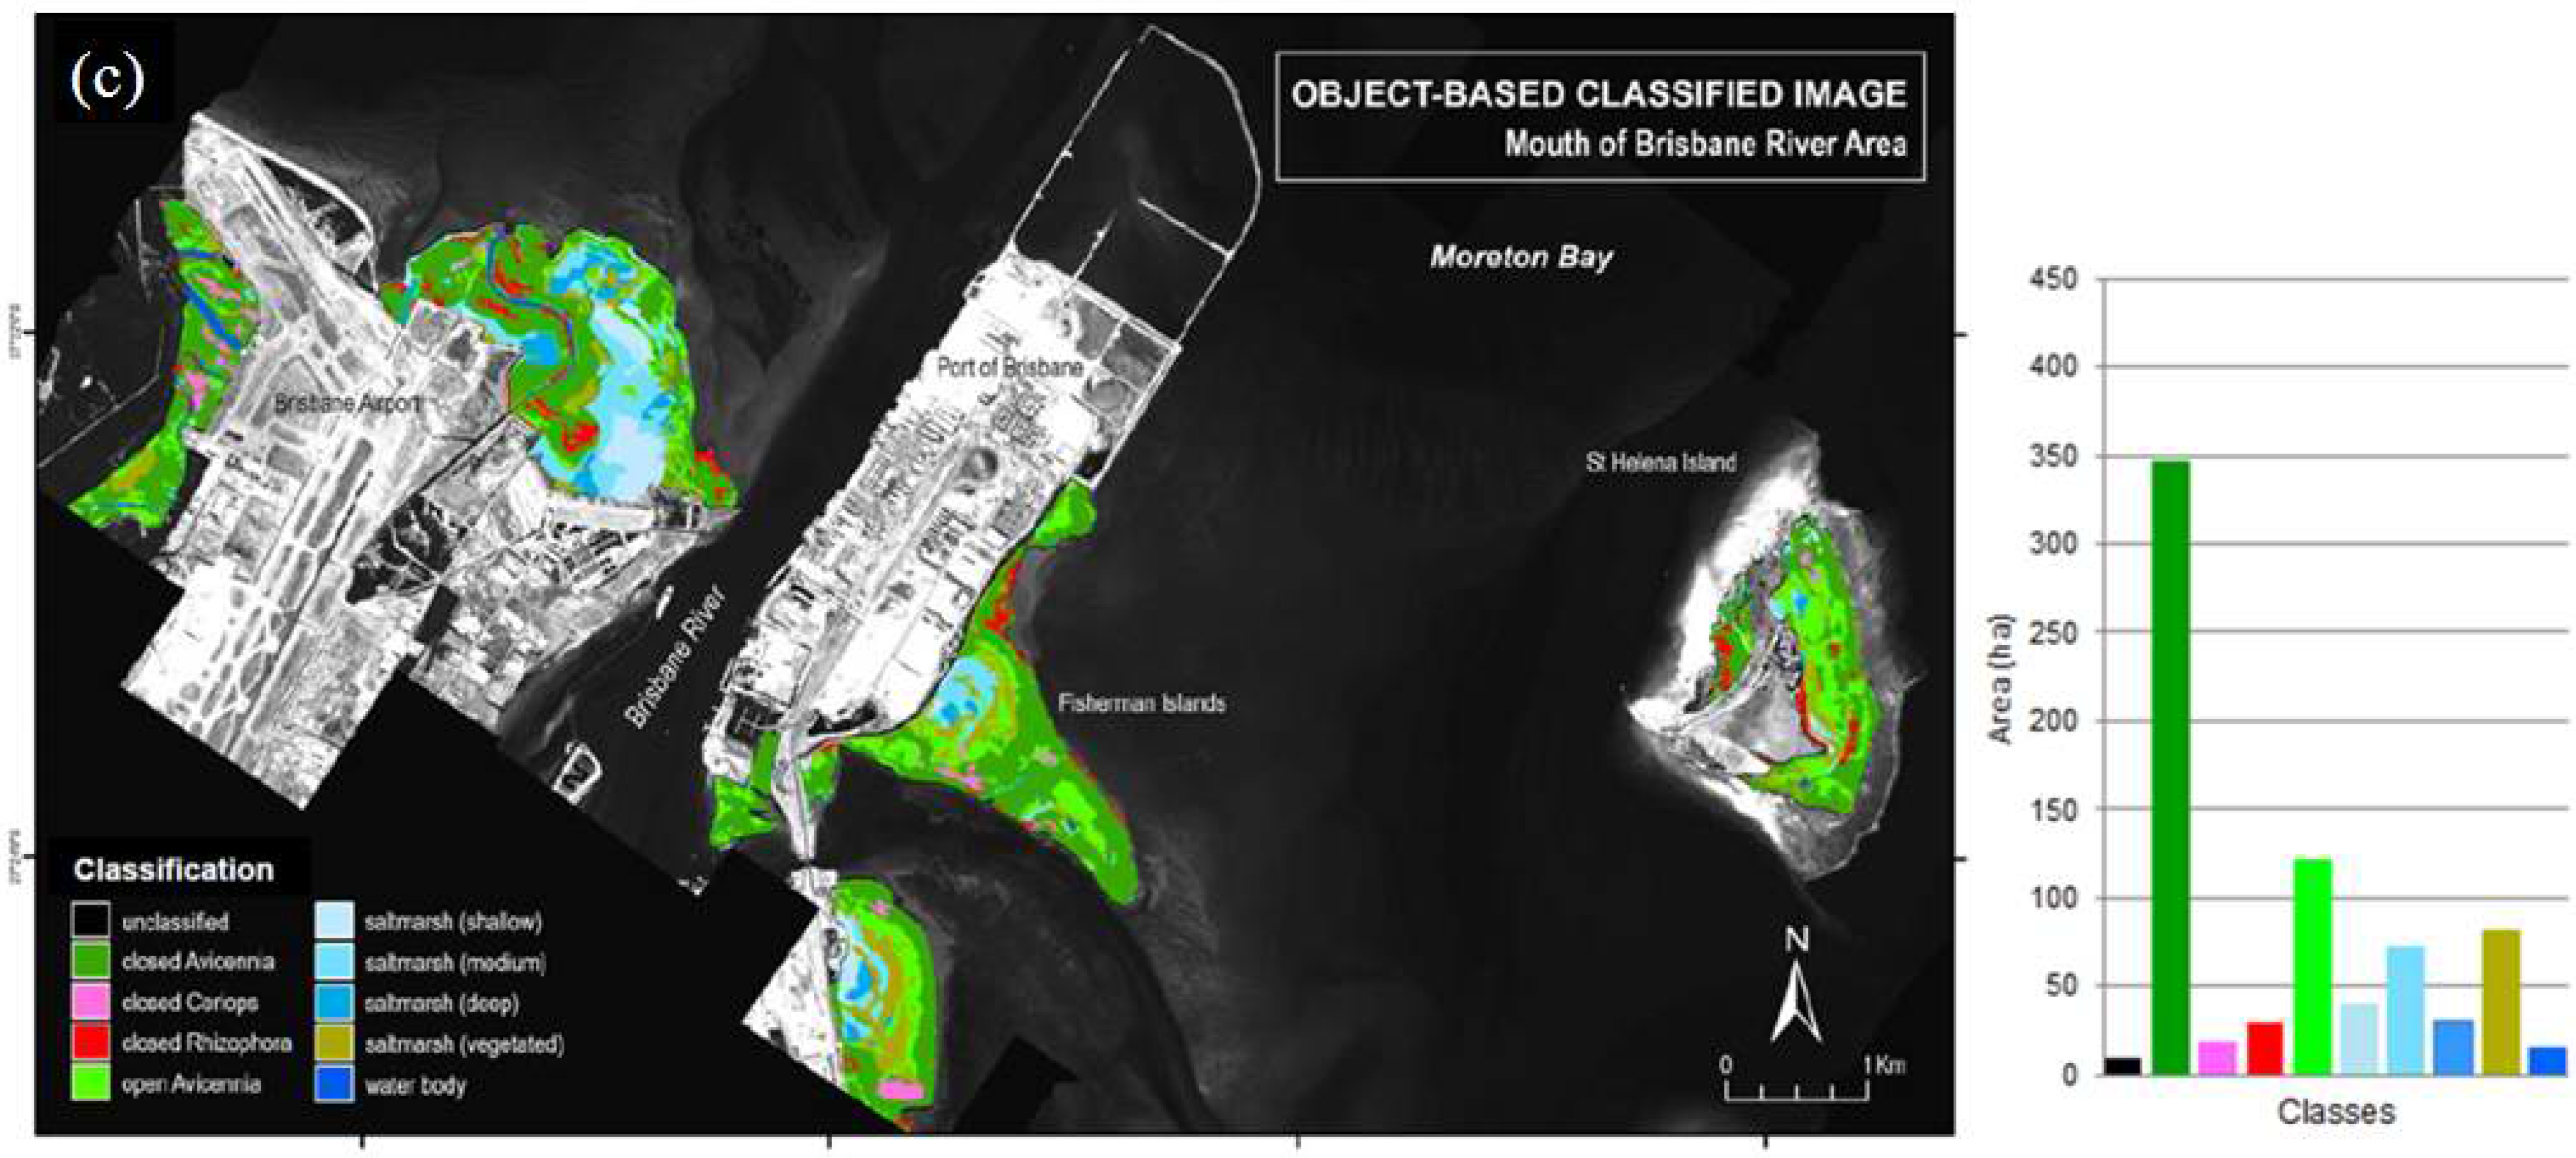
Different mapping and classification methods used in this study resulted in different wetland class distributions on the derived map, in terms of patterns and compositions of the mapped classes. Overall, the two classes of Avicennia, closed and open Avicennia, dominated all of the classification results (see graphs on Figure 11). This result was in accordance to the studies reported by Dowling [22] and Duke [41], as well as the reference map, that Avicennia marina dominates this area. Therefore, the classifiers have successfully identified this pattern.
The resulting maps show that pixels assigned to the Avicennia classes and shallow saltmarsh matched among the three classifications. Closed Rhizophora were found to be matched only on the SAM and object-based classified maps. They were found along the Brisbane River and some patches on Fisherman Island and St Helena Islands. Closed Ceriops has the least matched among the three classified maps; and it also formed small patches on the west-side of Brisbane Airport and Fisherman Island. Visually, the disagreement between mapping methods was most evident in the saltmarsh classes. This was attributed to the saltmarsh areas that are typically containing mixed pixels, i.e., water, vegetation, and soil.
Figure 11. Maps of wetland classes and their area in hectares: (a) spectral angle mapper (SAM); (b) linear spectral unmixing (LSU); and (c) object-based approach. Background image is near infrared band of CASI-2 (band 29, centred at 799 nm).
Remotesensing 03 02222 g011aRemotesensing 03 02222 g011b
In discriminating objects, SAM was heavily dependent on endmembers derived from the image. It matched the spectra of all image pixels to the endmembers spectral reflectance, and classified each class within certain angle threshold from it. Thus, if the derived endmembers were correctly representative of object classes, the SAM classification result would be accurately represent the distribution of those classes in the map. The object-based mapping approach, relied on object homogeneity, and segmented the image based on it. If the segmentation criteria selected were appropriate, the image objects would be accurately segmented. The problem arose when attempting to assign each object into certain class. Despite of our knowledge about the targeted objects entity, it was difficult to set the rules so that software could recognize that object as defined class. Although the classification rules have been set up as close to the recognized objects in the scene as possible, the class decision has involving subjective judgment from the analyst. Therefore, the result could be overestimates or underestimates in some extents, and did not exactly represent the distribution of objects.
The LSU has been developed to spectrally decompose the mixed pixels into their component abundance. Rather than representing the landscape in terms of a number of certain classes, it acknowledged the compositional abundance of components (or endmembers) that together contribute to the observed reflectance value on the image. Therefore, the outputs of this classifier were images that portray the fraction of certain component within a pixel. The difficulty was found when combining those images into a fixed classification map. Although logical thresholds have been assigned to each endmember according to their importance, the result was not satisfactory since there were still many unclassified pixels spread around the image.

3.3. Error and Accuracy Assessment

The accuracy assessment results showed that overall, object-based mapping approach has the highest accuracy value, both for the overall accuracy and Kappa analysis (Table 3, Table 4 and Table 5). This meant that statistically, the object-based classification map has the highest corresponding degree to the reference map. This approach resulted in an overall accuracy of 76%. On the other hand, the LSU classifier has the lowest accuracy value, which was only 56%. This classifier produced many unclassified objects; the classifier could not successfully determine the feature abundance within the mixed pixels. SAM classifier resulted in overall accuracy and Khat statistic value between object-based and LSU, which were 69% and 0.57. However, according to the accuracy assessment result (Table 3, Table 4 and Table 5), the Khat coefficient of all classification methods fell within 0.40 and 0.80, which meant they have moderate agreement according to Landis & Koch [42] category.
Table 3. Error matrix for the SAM classified map versus reference map.
Reference MapProducer’s
Accuracy
User’s
Accuracy
ClassCACCCROASMTotal
Classified (SAM)CA1222422271120681%59%
CC3210202642%81%
CR10025003550%71%
OA13532124442%48%
SM2000878987%98%
Total150505050100400
Overall classification accuracy = 69%, Kappa = 0.57
Table 4. Error matrix of LSU classified map versus reference map.
Reference MapProducer’s
Accuracy
User’s
Accuracy
ClassCACCCROASMTotal
Classified (LSU)CA8772510012958%67%
CC2331303966%85%
CR20600812%75%
OA2410129339758%30%
SM3501786712767%53%
Total150505050100400
Overall classification accuracy = 56%, Kappa = 0.41
Table 5. Error matrix of object-based classified map versus reference map.
Reference MapProducer’s
Accuracy
User’s
Accuracy
ClassCACCCROASMTotal
Classified (OBIA)CA114181812316576%69%
CC7270003454%79%
CR6030003660%83%
OA19323616172%59%
SM42029610496%92%
Total 150505050100400
Overall classification accuracy = 76%, Kappa = 0.67
From the error matrix tables, saltmarsh had the highest value of producer’s accuracy or has the lowest omission error among those three classification methods. The probability of saltmarsh class being classified as another class was low. This was because saltmarsh has a very distinct pattern and is easily recognized by the classification rules due to its smooth pattern with homogeneous colours, and relatively similar spatial patterns. The highest value of omission errors were varied among classifiers. Closed Ceriops and open Avicennia have both 58% of omission error on SAM, this is mainly because the mixed pixel problem which evidence in those classes and the difficulty of obtaining pure pixels for those classes. The high omission error was also evidence for closed Rhizophora on LSU by 88% and on SAM by 50%. This high omission error indicates that according to the endmember selected, this classifier failed to identify this class as can be seen in Figure 11(a,b).
Different patterns were shown by the user’s accuracy. All classifiers have low value of user’s accuracy or high commission error for open Avicennia class. Meaning that there was an over-estimate classification result, or other classes were highly miss-classified as this class. SAM and OBIA classification have low commission error on saltmarsh, while LSU on closed Ceriops. This is evidence that LSU was a powerful classifier for mixed environment.

4. Conclusions

This study demonstrated the ability of CASI-2 hyperspectral data for mangrove species mapping in a limited test area and with three different mapping approaches. Overall, the dataset and algorithms mapped the target classes with moderate accuracy using both pixel-based and object-based approaches. This moderate accuracy was attributed to the heterogeneous mixture of vegetation, soil, and water in mangrove and saltmarsh environments. The results show that by applying different classification methods, different degree of mapping accuracy was produced. The object-based classification had the highest overall accuracy of 76%, followed by SAM and LSU with overall accuracies of 69% and 56% respectively. The object-based classification gave a better image object delineation compare to the pixel-based approaches, because of its advantage in incorporating various combinations of pixel’s features to identify an object in the classification process.
For future research, a larger study area and higher mangrove species diversity is needed to achieve a better understanding on how effective these classifiers are for differentiating mangrove species. Also the inclusion of more image object properties such as shape, texture, size, and context should be tested for object-based image analysis to improve the classification result. The high degree of analyst-biased interaction existing in all classification methods tested remains a challenge to transfer the rules and algorithm to other location.

Acknowledgements

The CASI-2 dataset for this study were collected by The Defence Science Technology Organization with funds provided from an Australian Research Council Linkage Grant to Justin Marshall and Stuart Phinn. CASI-2 cross track and additional radiometric corrections were provided by Janet Anstee, CSIRO Land and Water, Canberra, Australia. Authors wish to thank Kasper Johansen, Lara A. Arroyo Mendez, and Chris Roelfsema for the object-based image analysis discussions. Authors would also like to thank the two anonymous reviewers whose comments were detailed and constructive, improving the overall quality of the paper.

References

  1. Kathiresan, K.; Bingham, B.L. Biology of mangroves and mangrove ecosystems. Adv. Mar. Biol. 2001, 40, 81–251. [Google Scholar]
  2. Green, E.P.; Clark, C.D.; Mumby, P.J.; Edwards, A.J.; Ellis, A.C. Remote sensing techniques for mangrove mapping. Int. J. Remote Sens. 1998, 19, 935–956. [Google Scholar] [CrossRef]
  3. Saenger, P.; Hegerl, E.; Davis, J. Global status of mangrove ecosystems. The Environmentalist 1983, 3, 1–88. [Google Scholar]
  4. Robertson, A.I.; Duke, N.C. Mangroves as nursery sites, comparisons of the abundance of fish and crustaceans in mangroves and other near shore habitats in tropical Australia. Mar. Biol. 1987, 96, 193–205. [Google Scholar] [CrossRef]
  5. Green, E.P.; Mumby, P.J.; Edwards, A.J.; Clark, C.D.; Ellis, A.C. The assessment of mangrove areas using high resolution multispectral airborne imagery. J. Coast. Res. 1998, 14, 433–443. [Google Scholar]
  6. Phinn, S.R.; Hess, L.; Finlayson, C.M. An assessment of the usefulness of remote sensing for wetland inventory and monitoring in Australia. In Techniques for Enhanced Wetland Inventory and Monitoring; Supervising Scientist Report 147; Finlayson, C.M., Speirs, A.G., Eds.; Supervising Scientist, Environment Australia: Canberra, ACT, Australia, 1999; pp. 44–83. [Google Scholar]
  7. Davis, B.A.; Jensen, J.R. Remote sensing of mangrove biophysical characteristics. Geocarto Int. 1998, 13, 55–64. [Google Scholar] [CrossRef]
  8. Kuenzer, C.; Bluemel, A.; Gebhardt, S.; Quoc, T.V.; Dech, S. Remote sensing of mangrove ecosystems: A review. Remote Sens. 2011, 3, 878–928. [Google Scholar] [CrossRef]
  9. Green, E.P.; Clark, C.D.; Mumby, P.J.; Edwards, A.J.; Ellis, A.C. Remote sensing techniques for mangrove mapping. Int. J. Remote Sens. 1999, 19, 935–956. [Google Scholar] [CrossRef]
  10. Held, A.; Ticehurst, C.; Lymburner, L.; Williams, N. High resolution mapping of tropical mangrove ecosystem using hyperspectral and radar remote sensing. Int. J. Remote Sens. 2003, 24, 2739–2759. [Google Scholar] [CrossRef]
  11. Heumann, B.W. Satellite remote sensing of mangrove forests: Recent advances and future opportunities. Prog. Phys. Geog. 2011, 35, 87–108. [Google Scholar] [CrossRef]
  12. Yang, C.; Everitt, J.H.; Fletcher, R.S.; Jensen, R.R.; Mausel, P.W. Evaluating AISA+ hyperspectral imagery for mapping black mangrove along the South Texas Gulf Coast. Photogramm. Eng. Remote Sensing 2009, 75, 425–435. [Google Scholar] [CrossRef]
  13. Hirano, A.; Madden, M.; Welch, R. Hyperspectral image data for mapping wetland vegetation. Wetlands 2003, 23, 436–448. [Google Scholar] [CrossRef]
  14. Demuro, M.; Chisholm, L. Assessment of Hyperion for Characterizing Mangrove Communities. In Proceedings of the 12th Earth Science Airborne Workshop, Pasadena, CA, USA, 25–28 February 2003; Available online: ftp://popo.jpl.nasa.gov/pub/docs/workshops/03_docs/Demuro_AVIRIS _2003_web.pdf (accessed on 5 August 2007).
  15. Wang, L.; Sousa, W.P. Distinguishing mangrove species with laboratory measurements of hyperspectral leaf reflectance. Int. J. Remote Sens. 2009, 30, 1267–1281. [Google Scholar] [CrossRef]
  16. Jensen, R.; Mausel, P.; Dias, N.; Gonser, R.; Yang, C.; Everitt, J.; Fletcher, R. Spectral analysis of coastal vegetation and land cover using AISA+ hyperspectral data. Geocarto Int. 2007, 22, 17–28. [Google Scholar] [CrossRef]
  17. Van Der Meer, F.; De Jong, S.; Bakker, W. Imaging Spectrometry: Basic analytical techniques. In Imaging Spectrometry: Basic Principles and Prospective Applications; Van Der Meer, F., De Jong, S., Eds.; Kluwer Academic Publishers: Dordrecht, The Netherlands, 2001; pp. 17–61. [Google Scholar]
  18. Apan, A.; Phinn, S. Special feature hyperspectral remote sensing. J. Spat. Sci. 2006, 52, 47–48. [Google Scholar] [CrossRef]
  19. Held, A.; Ticehurst, C.; Lymburner, L.; Williams, N. High resolution mapping of tropical mangrove ecosystems using hyperspectral and radar remote sensing. Int. J. Remote Sens. 2003, 24, 2739–2759. [Google Scholar] [CrossRef]
  20. Baatz, M.; Schape, A. Multiresolution Segmentation: an optimization approach for high quality multiscale image segmentation. In Angewandte Geographische Informationsverarbeitung XII; Strobl, J., Blaschke, T., Griesebner, G., Eds.; Wichmann-Verlag: Heidelberg, Germany, 2000; pp. 12–23. [Google Scholar]
  21. Blaschke, T. Object based image analysis for remote sensing. ISPRS J. Photogramm. 2010, 65, 2–16. [Google Scholar] [CrossRef]
  22. Dowling, R.M. The mangrove vegetation of Moreton Bay. Queensland Bot. Bull. 1986, 6, 1–45. [Google Scholar]
  23. Abal, E.G.; Dennison, W.C.; O’Dononhue, M.H. Seagrass and mangroves in Moreton Bay. In Moreton Bay and Catchment; Tibbetts, I.R., Hall, N.J., Dennison, W.C., Eds.; School of Marine Science, University of Queensland: Brisbane, QLD, Australia, 1998; pp. 269–278. [Google Scholar]
  24. Duke, N.C.; Lawn, P.; Roelfsema, C.M.; Phinn, S.; Zahmel, K.N.; Pedersen, D.; Haris, C.; Steggles, N.; Tack, C. Assessing Historical Change in Coastal Environments; Port Curtis, Fitzroy River Estuary and Moreton Bay Regions; CRC for Coastal Zone Estuary & Waterway Management: Brisbane, QLD, Australia, 2003. [Google Scholar]
  25. Manson, F.J.; Loneragan, N.R.; Phinn, S.R. Spatial and temporal variation in distribution of mangroves in Moreton Bay, subtropcal Australia: A comparison of pattern metrics and change detection analyses based on aerial photographs. Estuar. Coast. Shelf Sci. 2003, 57, 657–670. [Google Scholar] [CrossRef]
  26. Brando, V.E.; Dekker, A.G. Satellite hyperspectral remote sensing for estimating estuarine and coastal water quality. IEEE Trans. Geosci. Remote Sens. 2003, 41, 1378–1387. [Google Scholar] [CrossRef]
  27. Phinn, S.; Roelfsema, C.; Dekker, A.; Brando, V.; Anstee, J. Mapping seagrass species, cover and biomass in shallow waters: An assessment of satellite multi-spectral and airborne hyperspectral imaging systems in Moreton Bay (Australia). Remote Sens. Environ. 2008, 112, 3413–3425. [Google Scholar] [CrossRef]
  28. Dowling, R.M.; Stephen, K. Coastal Wetlands of South-Eastern Queensland Maroochy Shire to New South Waler Border; Queensland Herbarium, Environmental Protection Agency: Brisbane, QLD, Australia, 1999. [Google Scholar]
  29. Asner, G.P.; Heidebrecht, K.B. Spectral unmixing of vegetation, soil and dry carbon cover in arid regions: Comparing multispectral and hyperspectral observations. Int. J. Remote Sens. 2002, 23, 3939–3958. [Google Scholar] [CrossRef]
  30. Kruse, F.A.; Boardman, J.W.; Lefkoff, A.B.; Young, J.M.; Kierein-Young, K.S. HyMap: An Australian Hyperspectral Sensor Solving Global Problems Results from USA HyMap Data Acquisition. In Proceedings of the 10th Australasian Remote Sensing and Photogrammetry Conference, Adelaide, SA, Australia, 21–25 August 2000; Available online: : www.hgimaging.com/PDF/kruse_10ARSPC_hymap.pdf (accessed on 5 August 2007).
  31. Jensen, J.R. Introductory Digital Image Processing: A Remote Sensing Perspective, 3rd ed.; Pearson Prentice Hall: Sydney, NSW, Australia, 2005. [Google Scholar]
  32. Borengasser, M.; Hungate, W.S.; Watkins, R. Hyperspectral Remote Sensing: Principles and Applications; Taylor & Francis in Remote Sensing Applications; CRC Press: New York, NY, USA, 2008. [Google Scholar]
  33. Okin, G.S.; Roberts, D.A.; Murray, B.; Okin, W.J. Practical limit on hyperspectral vegetation discrimination in arid and semiarid environment. Remote Sens. Environ. 2001, 77, 212–225. [Google Scholar] [CrossRef]
  34. Rosso, P.H.; Ustin, S.L.; Hasting, A. Mapping marshland vegetation of San Fransisco Bay, California, using hyperspectral data. Int. J. Remote Sens. 2005, 26, 5169–5191. [Google Scholar] [CrossRef]
  35. ITT. ENVI Online Manuals and Tutorials. ITT Visual Information Solution. 2003. Available online: http://www.ittvis.com/language/en-us/productsservices/envi/tutorials.aspx (accessed on 26 August 2008).
  36. Navulur, K. Multispectral Image Analysis Using the Object-Oriented Paradigm; CRC Press: Boca Raton, FL, USA, 2007. [Google Scholar]
  37. Definiens. Definiens Developer 7 User Guide; Definiens AG: Munich, Germany, 2007; Available online: http://www.pcigeomatics.com/products/pdfs/definiens/ReferenceBook.pdf (accessed on 26 March 2008).
  38. Baatz, M.; Benz, U.; Dehghani, S.; Heynen, M.; Holtje, A.; Hofmann, P.; Lingenfelder, I.; Mimler, M.; Sohlbach, M.; Weber, M.; Willhauck, G. eCognition Elements User Guide 4; Definiens AG: Munich, Germany, 2004. [Google Scholar]
  39. Congalton, R.G. A review of assessing the accuracy of classifications of remotely sensed data. Remote Sens. Environ. 1999, 35, 35–46. [Google Scholar] [CrossRef]
  40. Congalton, R.G.; Green, K. Assessing the Accuracy of Remotely Sensed Data: Principles and Practices; Lewis Pulishers: Boca Raton, FL, USA, 1999. [Google Scholar]
  41. Duke, N. Australia’s Mangroves: The Authoritative Guide to Australia’s Mangrove Plants; University of Queensland: Brisbane, QLD, Australia, 2006. [Google Scholar]
  42. Congalton, R.G. Putting the map back in map accuracy assessment. In Remote Sensing and GIS Accuracy Assessment; Lunetta, R.S., Lyon, J.G., Eds.; CRC Press: Boca Raton, FL, USA, 2004. [Google Scholar]