How Normalized Difference Vegetation Index (NDVI) Trendsfrom Advanced Very High Resolution Radiometer (AVHRR) and Système Probatoire d’Observation de la Terre VEGETATION (SPOT VGT) Time Series Differ in Agricultural Areas: An Inner Mongolian Case Study


Abstract
:1. Introduction
2. Materials
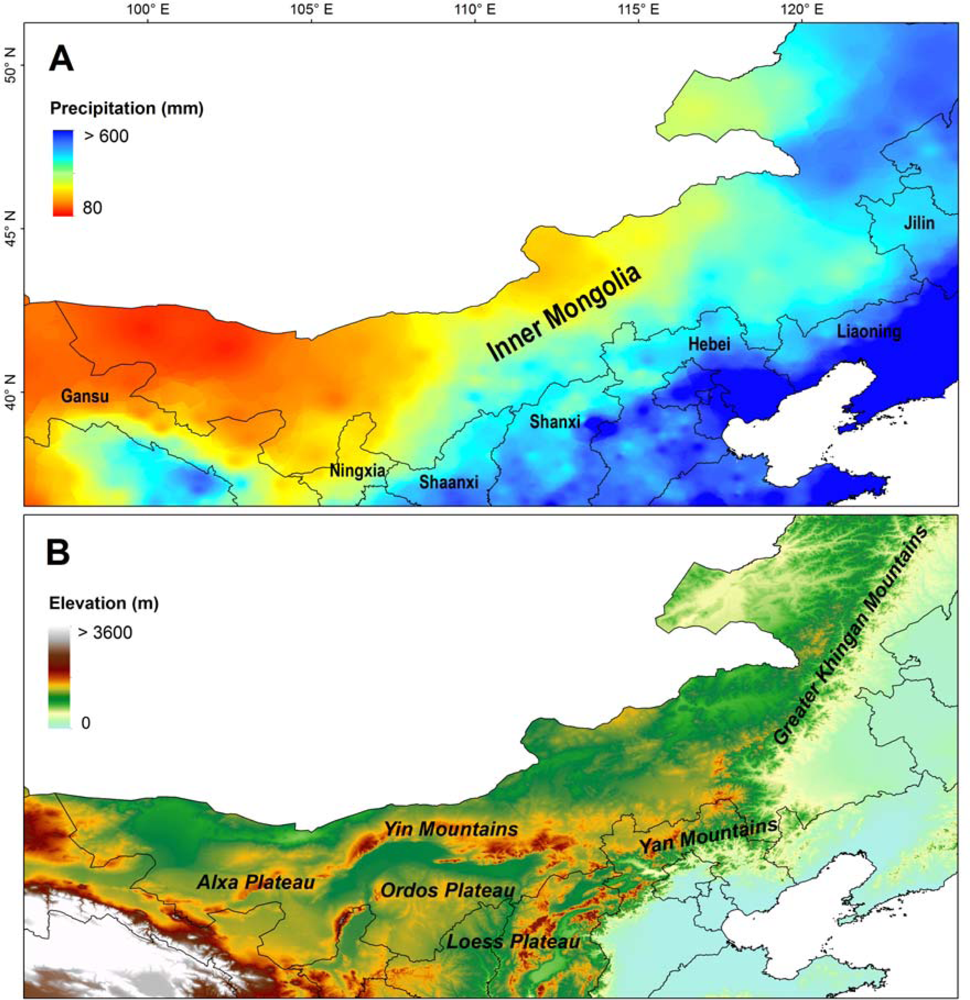
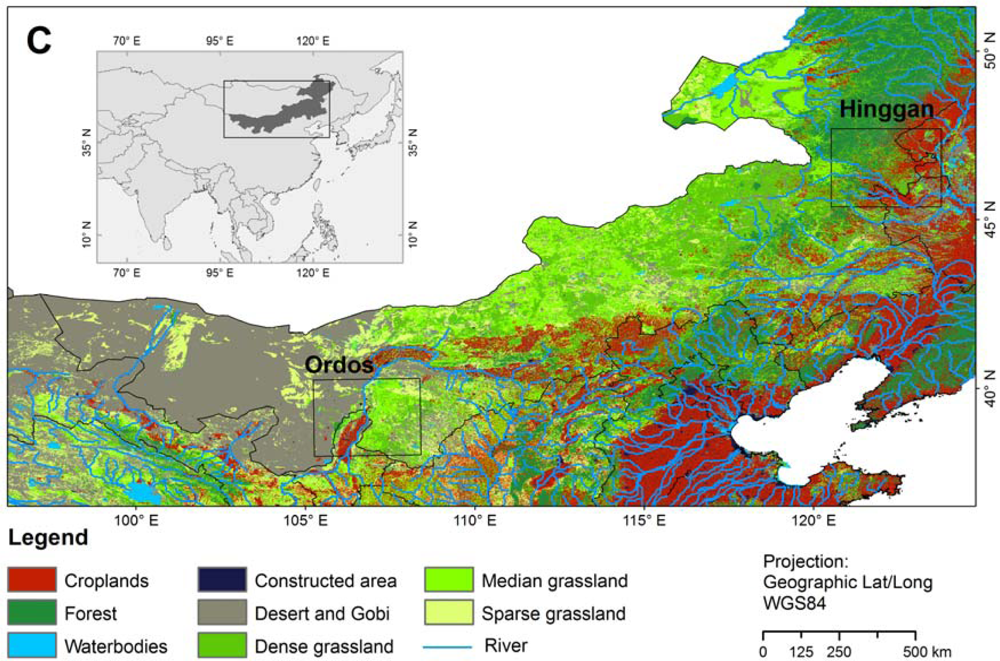
2.1. Study Area
2.2. Data
2.2.1. AVHRR NDVI Composites
2.2.2. SPOT-VGT NDVI Composites
2.2.3. MODIS Terra NDVI Composites
2.2.4. Other Data
3. Methods
3.1. Time Series Fitting and Phenological Metrics
3.2. Correlation Analysis
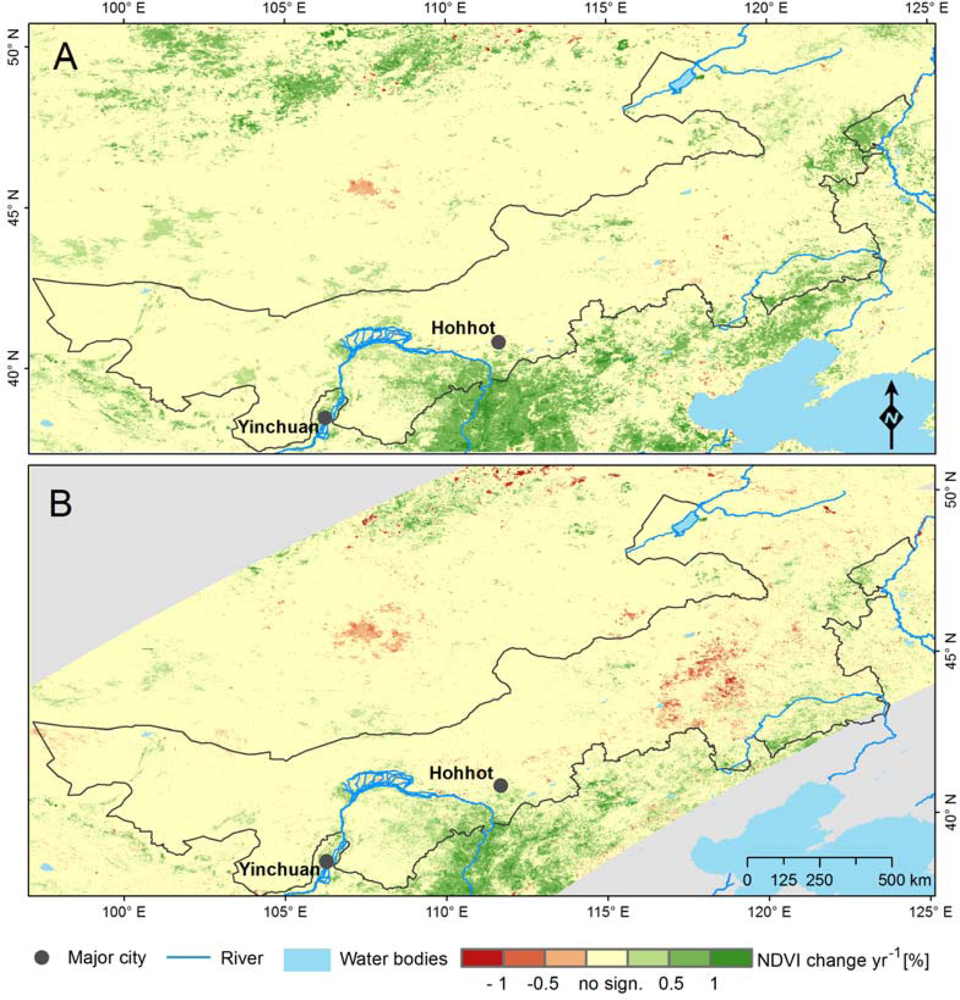
3.3. Trend Analysis
4. Results
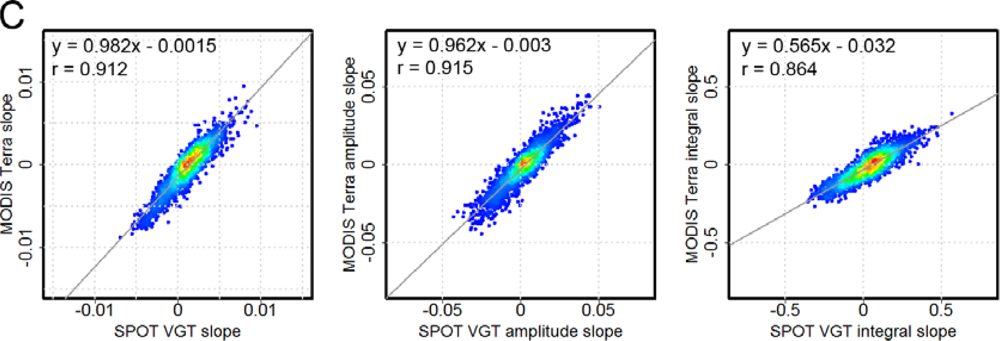
4.1. Correlation Analysis and Comparing Trends from SPOT VGT and MODIS Terra NDVI Archives
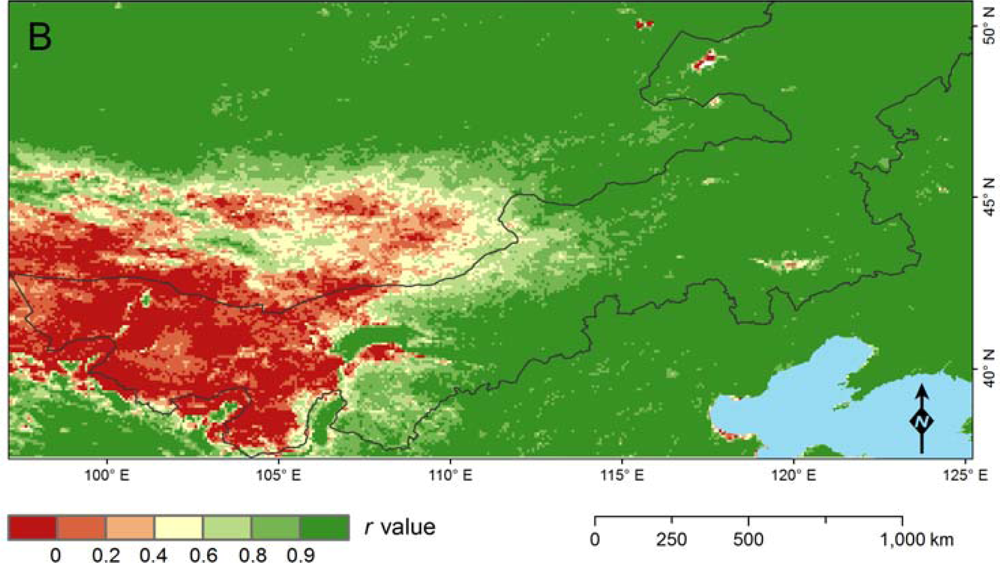
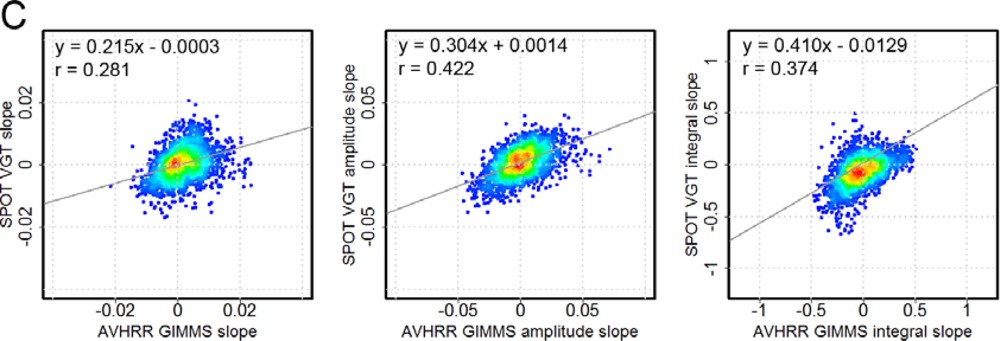
4.2. Correlation Analysis and Comparing Trends from SPOT VGT and AVHRR GIMMS NDVI Archives
5. Discussion
6. Conclusions
Acknowledgments
References
- Millenium Ecosystem Assessment. What are the Most Important Uncertainties Hindering Decision-Making Concerning Ecosystems? In Ecosystems and Human Well-Being: Synthesis; Island Press: Washington DC, USA, 2005; p. 101. [Google Scholar]
- Tucker, C.J.; Townshend, J.R.G.; Goff, T.E. African land-cover classification using satellite data. Science 1985, 227, 369–375. [Google Scholar]
- Turner, B.L., II; Lambin, E.F.; Reenberg, A. From the cover land change science special feature: The emergence of land change science for global environmental change and sustainability. Proc. Natl. Acad. Sci 2007, 104, 20666–20671. [Google Scholar]
- Cracknell, A.P. The Advanced very High Resolution Radiometer (AVHRR); Taylor & Francis: London, UK/Bristol, PA, USA, 1997; p. 534. [Google Scholar]
- Fensholt, R.; Rasmussen, K.; Nielsen, T.T.; Mbow, C. Evaluation of earth observation based long term vegetation trends—Intercomparing NDVI time series trend analysis consistency of Sahel from AVHRR GIMMS, Terra MODIS and SPOT VGT data. Remote Sens. Environ 2009, 113, 1886–1898. [Google Scholar]
- Friedl, M.A.; McIver, D.K.; Hodges, J.C.F.; Zhang, X.Y.; Muchoney, D.; Strahler, A.H.; Woodcock, C.E.; Gopal, S.; Schneider, A.; Cooper, A.; et al. Global land cover mapping from MODIS: Algorithms and early results. Remote Sens. Environ 2002, 83, 287–302. [Google Scholar]
- Ganguly, S.; Friedl, M.A.; Tan, B.; Zhang, X.Y.; Verma, M. Land surface phenology from MODIS: Characterization of the collection 5 global land cover dynamics product. Remote Sens. Environ 2010, 114, 1805–1816. [Google Scholar]
- van Leeuwen, W.J.D.; Huete, A.R.; Laing, T.W. MODIS vegetation index compositing approach: A prototype with AVHRR data. Remote Sens. Environ 1999, 69, 264–280. [Google Scholar]
- Gutman, G.; Janetos, A.C.; Justice, C.O.; Moran, E.F.; Mustard, J.F.; Rindfuss, R.R.; Skole, D.; Turner, B.L., II; Cochrane, M.A. Land Change Science: Observing, Monitoring and Understanding Trajectories of Change on the Earth’s Surface; Springer: London, UK, 2004; Volume 1, p. 461. [Google Scholar]
- Townshend, J.; Justice, C.; Li, W.; Gurney, C.; McManus, J. Global land cover classification by remote sensing: present capabilities and future possibilities. Remote Sens. Environ 1991, 35, 243–255. [Google Scholar]
- DeFries, R.S.; Hansen, M.C.; Townshend, J.R.G.; Janetos, A.C.; Loveland, T.R. A new global 1 km dataset of percentage tree cover derived from remote sensing. Global Change Biol 2000, 6, 247–254. [Google Scholar]
- Barnosky, A.D.; Hadly, E.A.; Bascompte, J.; Berlow, E.L.; Brown, J.H.; Fortelius, M.; Getz, W.M.; Harte, J.; Hastings, A.; Marquet, P.A.; et al. Approaching a state shift in Earth’s biosphere. Nature 2012, 486, 52–58. [Google Scholar]
- Matson, P.A.; Parton, W.J.; Power, A.G.; Swift, M.J. Agricultural intensification and ecosystem properties. Science 1997, 277, 504–509. [Google Scholar]
- Rasmussen, P.E.; Goulding, K.W.T.; Brown, J.R.; Grace, P.R.; Janzen, H.H.; Korschens, M. Long-term agroecosystem experiments: Assessing agricultural sustainability and global change. Science 1998, 282, 893–896. [Google Scholar]
- de Jong, R.; Verbesselt, J.; Schaepman, M.E.; de Bruin, S. Trend changes in global greening and browning: Contribution of short-term trends to longer-term change. Global Change Biol 2012, 18, 642–655. [Google Scholar]
- Samanta, A.; Costa, M.H.; Nunes, E.L.; Vieira, S.A.; Xu, L.; Myneni, R.B. Comment on “Drought-Induced Reduction in global terrestrial Net Primary Production from 2000 Through 2009”. Science 2011, 333, 1093. [Google Scholar]
- Verbesselt, J.; Hyndman, R.; Newnham, G.; Culvenor, D. Detecting trend and seasonal changes in satellite image time series. Remote Sens. Environ 2010, 114, 106–115. [Google Scholar]
- Verbesselt, J.; Hyndman, R.; Zeileis, A.; Culvenor, D. Phenological change detection while accounting for abrupt and gradual trends in satellite image time series. Remote Sens. Environ 2010, 114, 2970–2980. [Google Scholar]
- Reed, B.C.; Brown, J.F. Trend Analysis of Time-Series Phenology Derived from Satellite Data. Proceedings of 2005 International Workshop on the Analysis of Multi-Temporal Remote Sensing Images, Biloxi, MI, USA, 16–18 May 2005; pp. 166–168.
- Tucker, C.J.; Dregne, H.E.; Newcomb, W.W. Expansion and contraction of the Sahara Desert from 1980 to 1990. Science 1991, 253, 299–301. [Google Scholar]
- Udelhoven, T.; Stellmes, M.; Del Barrio, G.; Hill, J. Assessment of rainfall and NDVI anomalies in Spain (1989–1999) using distributed lag models. Int. J. Remote Sens 2009, 30, 1961–1976. [Google Scholar]
- Myneni, R.B.; Keeling, C.D.; Tucker, C.J.; Asrar, G.; Nemani, R.R. Increased plant growth in the northern high latitudes from 1981 to 1991. Nature 1997, 386, 698–702. [Google Scholar]
- Pettorelli, N.; Vik, J.O.; Mysterud, A.; Gaillard, J.M.; Tucker, C.J.; Stenseth, N.C. Using the satellite-derived NDVI to assess ecological responses to environmental change. Trends Ecol. Evol 2005, 20, 503–510. [Google Scholar]
- Tucker, C.J. Red and photographic infrared linear combinations for monitoring vegetation. Remote Sens. Environ 1979, 8, 127–150. [Google Scholar]
- Field, C.B.; Behrenfeld, M.J.; Randerson, J.T.; Falkowski, P. Primary production of the biosphere: Integrating terrestrial and oceanic components. Science 1998, 281, 237–240. [Google Scholar]
- Panda, S.S.; Ames, D.P.; Panigrahi, S. Application of vegetation indices for agricultural crop yield prediction using neural network techniques. Remote Sens 2010, 2, 673–696. [Google Scholar]
- Labus, M.P.; Nielsen, G.A.; Lawrence, R.L.; Engel, R.; Long, D.S. Wheat yield estimates using multi-temporal NDVI satellite imagery. Int. J. Remote Sens 2002, 23, 4169–4180. [Google Scholar]
- Boschetti, M.; Stroppiana, D.; Brivio, P.A.; Bocchi, S. Multi-year monitoring of rice crop phenology through time series analysis of MODIS images. Int. J. Remote Sens 2009, 30, 4643–4662. [Google Scholar]
- de Beurs, K.M.; Henebry, G.M. Land surface phenology, climatic variation, and institutional change: Analyzing agricultural land cover change in Kazakhstan. Remote Sens. Environ 2004, 89, 497–509. [Google Scholar]
- Hill, M.J.; Donald, G.E. Estimating spatio-temporal patterns of agricultural productivity in fragmented landscapes using AVHRR NDVI time series. Remote Sens. Environ 2003, 84, 367–384. [Google Scholar]
- Lee, R.; Yu, F.; Price, K.P.; Ellis, J.; Shi, P. Evaluating vegetation phenological patterns in Inner Mongolia using NDVI time-series analysis. Int. J. Remote Sens 2002, 23, 2505–2512. [Google Scholar]
- Xin, J.; Yu, Z.; van Leeuwen, L.; Driessen, P.M. Mapping crop key phenological stages in the North China Plain using NOAA time series images. Int. J. Appl. Earth Obs 2002, 4, 109–117. [Google Scholar]
- Kariyeva, J.; Van Leeuwen, W. Environmental drivers of NDVI-based vegetation phenology in Central Asia. Remote Sens 2011, 3, 203–246. [Google Scholar]
- Reed, B.C.; White, M.; Brown, J.F. Remote Sensing Phenology. In Phenology: An Integrative Environmental Science; Schwartz, M.D., Ed.; Kluwer Academic Publishers: Dordrecht, The Netherlands, 2003; pp. 365–380. [Google Scholar]
- Bradley, B.A.; Mustard, J.F. Comparison of phenology trends by land cover class: A case study in the Great Basin, USA. Global Change Biol 2008, 14, 334–346. [Google Scholar]
- Yu, H.Y.; Luedeling, E.; Xu, J.C. Winter and spring warming result in delayed spring phenology on the Tibetan Plateau. Proc. Natl. Acad. Sci 2010, 107, 22151–22156. [Google Scholar]
- Alcantara, C.; Kuemmerle, T.; Prishchepov, A.V.; Radeloff, V.C. Mapping abandoned agriculture with multi-temporal MODIS satellite data. Remote Sens. Environ 2012, 124, 334–347. [Google Scholar]
- Gu, Y.; Brown, J.; Miura, T.; Van Leeuwen, W.J.; Reed, B. Phenological classification of the United States: A geographic framework for extending multi-sensor time-series data. Remote Sens 2010, 2, 526–544. [Google Scholar]
- Martinez-Beltran, C.; Jochum, M.A.O.; Calera, A.; Melia, J. Multisensor comparison of NDVI for a semi-arid environment in Spain. Int. J. Remote Sens 2009, 30, 1355–1384. [Google Scholar]
- Zhang, X.Y.; Friedl, M.A.; Schaaf, C.B.; Strahler, A.H.; Hodges, J.C.F.; Gao, F.; Reed, B.C.; Huete, A. Monitoring vegetation phenology using MODIS. Remote Sens. Environ 2003, 84, 471–475. [Google Scholar]
- Geerken, R.; Ilaiwi, M. Assessment of rangeland degradation and development of a strategy for rehabilitation. Remote Sens. Environ 2004, 90, 490–504. [Google Scholar]
- Li, A.; Deng, W.; Liang, S.; Huang, C. Investigation on the patterns of global vegetation change using a satellite-sensed vegetation index. Remote Sens 2010, 2, 1530–1548. [Google Scholar]
- Wessels, K.J.; Prince, S.D.; Malherbe, J.; Small, J.; Frost, P.E.; VanZyl, D. Can human-induced land degradation be distinguished from the effects of rainfall variability? A case study in South Africa. J. Arid Environ 2007, 68, 271–297. [Google Scholar]
- Begue, A.; Vintrou, E.; Ruelland, D.; Claden, M.; Dessay, N. Can a 25-year trend in Soudano-Sahelian vegetation dynamics be interpreted in terms of land use change? A remote sensing approach. Global Environ. Change 2011, 21, 413–420. [Google Scholar]
- Lillesand, T.M.; Kiefer, R.W.; Chipman, J.W. Remote Sensing and Image Interpretation, 6th ed; John Wiley & Sons: Hoboken, NJ, USA, 2008; p. 768. [Google Scholar]
- Steven, M.D.; Malthus, T.J.; Baret, F.; Xu, H.; Chopping, M.J. Intercalibration of vegetation indices from different sensor systems. Remote Sens. Environ 2003, 88, 412–422. [Google Scholar]
- Huete, A.; Didan, K.; Miura, T.; Rodriguez, E.P.; Gao, X.; Ferreira, L.G. Overview of the radiometric and biophysical performance of the MODIS vegetation indices. Remote Sens. Environ 2002, 83, 195–213. [Google Scholar]
- Tarnavsky, E.; Garrigues, S.; Brown, M.E. Multiscale geostatistical analysis of AVHRR, SPOT-VGT, and MODIS global NDVI products. Remote Sens. Environ 2008, 112, 535–549. [Google Scholar]
- Jiang, H. Grassland management and views of nature in China since 1949: Regional policies and local changes in Uxin Ju, inner Mongolia. Geoforum 2005, 36, 641–653. [Google Scholar]
- Li, W.J.; Ali, S.H.; Zhang, Q. Property rights and grassland degradation: A study of the Xilingol Pasture, Inner Mongolia, China. J. Environ. Manage 2007, 85, 461–470. [Google Scholar]
- Tucker, C.J.; Pinzon, J.E.; Brown, M.E.; Slayback, D.A.; Pak, E.W.; Mahoney, R.; Vermote, E.F.; El Saleous, N. An extended AVHRR 8-km NDVI dataset compatible with MODIS and SPOT vegetation NDVI data. Int. J. Remote Sens 2005, 26, 4485–4498. [Google Scholar]
- Alcaraz-Segura, D.; Liras, E.; Tabik, S.; Paruelo, J.; Cabello, J. Evaluating the consistency of the 1982–1999 NDVI trends in the Iberian Peninsula across four time-series derived from the AVHRR sensor: LTDR, GIMMS, FASIR, and PAL-II. Sensors 2010, 10, 1291–1314. [Google Scholar]
- Brown, M.E.; Pinzon, J.E.; Didan, K.; Morisette, J.T.; Tucker, C.J. Evaluation of the consistency of long-term NDVI time series derived from AVHRR, SPOT-Vegetation, SeaWiFS, MODIS, and Landsat ETM+ sensors. IEEE Trans. Geosci. Remote Sens 2006, 44, 1787–1793. [Google Scholar]
- Gitelson, A.A.; Kaufman, Y.J. MODIS NDVI optimization to fit the AVHRR data series spectral considerations. Remote Sens. Environ 1998, 66, 343–350. [Google Scholar]
- Fontana, F.; Rixen, C.; Jonas, T.; Aberegg, G.; Wunderle, S. Alpine grassland phenology as seen in AVHRR, VEGETATION, and MODIS NDVI time series—A comparison with in situ measurements. Sensors 2008, 8, 2833–2853. [Google Scholar]
- Gallo, K.; Li, L.; Reed, B.; Eidenshink, J.; Dwyer, J. Multi-platform comparisons of MODIS and AVHRR normalized difference vegetation index data. Remote Sens. Environ 2005, 99, 221–231. [Google Scholar]
- Swinnen, E.; Veroustraete, F. Extending the SPOT-VEGETATION NDVI time series (1998–2006) back in time with NOAA-AVHRR data (1985–1998) for southern Africa. IEEE Trans. Geosci. Remote Sens. 2008, 46, 558–572. [Google Scholar]
- Song, Y.; Ma, M.G.; Veroustraete, F. Comparison and conversion of AVHRR GIMMS and SPOT vegetation NDVI data in China. Int. J. Remote Sens 2010, 31, 2377–2392. [Google Scholar]
- Fensholt, R.; Proud, S.R. Evaluation of Earth observation based global long term vegetation trends—Comparing GIMMS and MODIS global NDVI time series. Remote Sens. Environ 2012, 119, 131–147. [Google Scholar]
- Yu, F.F.; Price, K.P.; Ellis, J.; Shi, P.J. Response of seasonal vegetation development to climatic variations in eastern Central Asia. Remote Sens. Environ 2003, 87, 42–54. [Google Scholar]
- Nemani, R.R.; Keeling, C.D.; Hashimoto, H.; Jolly, W.M.; Piper, S.C.; Tucker, C.J.; Myneni, R.B.; Running, S.W. Climate-driven increases in global terrestrial net primary production from 1982 to 1999. Science 2003, 300, 1560–1563. [Google Scholar]
- Tao, F.L.; Yokozawa, M.; Zhang, Z.; Xu, Y.L.; Hayashi, Y. Remote sensing of crop production in China by production efficiency models: Models comparisons, estimates and uncertainties. Ecol. Model 2005, 183, 385–396. [Google Scholar]
- Liu, J.Y.; Liu, M.L.; Zhuang, D.F.; Zhang, Z.X.; Deng, X.Z. Study on spatial pattern of land-use change in China during 1995–2000. Sci. China Ser. D 2003, 46, 373–384. [Google Scholar]
- Liu, J.Y.; Zhang, Z.X.; Xu, X.L.; Kuang, W.H.; Zhou, W.C.; Zhang, S.W.; Li, R.D.; Yan, C.Z.; Yu, D.S.; Wu, S.X.; Nan, J. Spatial patterns and driving forces of land use change in China during the early 21st century. J. Geogr. Sci 2010, 20, 483–494. [Google Scholar]
- Wang, X.H.; Lu, C.H.; Fang, J.F.; Shen, Y.C. Implications for development of grain-for-green policy based on cropland suitability evaluation in desertification-affected North China. Land Use Policy 2007, 24, 417–424. [Google Scholar]
- Jiang, H. Decentralization, ecological construction, and the environment in post-reform China: Case study from Uxin Banner, Inner Mongolia. World Development 2006, 34, 1907–1921. [Google Scholar]
- Tong, C.; Wu, J.; Yong, S.; Yang, J.; Yong, W. A landscape-scale assessment of steppe degradation in the Xilin River Basin, Inner Mongolia, China. J. Arid Environ 2004, 59, 133–149. [Google Scholar]
- Chen, J.S.; He, D.W.; Cui, S.B. The response of river water quality and quantity to the development of irrigated agriculture in the last 4 decades in the Yellow River Basin, China. Water Resour. Res 2003, 39, 1047. [Google Scholar]
- Qiao, G.H.; Zhao, L.J.; Klein, K.K. Water user associations in Inner Mongolia: Factors that influence farmers to join. Agr. Water Manage 2009, 96, 822–830. [Google Scholar]
- Bennett, M.T. China’s sloping land conversion program: Institutional innovation or business as usual? Ecol. Econ 2008, 65, 699–711. [Google Scholar]
- Deng, X.Z.; Huang, J.K.; Rozelle, S.; Uchida, E. Cultivated land conversion and potential agricultural productivity in China. Land Use Policy 2006, 23, 372–384. [Google Scholar]
- Liu, J.; Liu, M.; Deng, X.; Zhuang, D.; Zhang, Z.; Luo, D. The Land-use and land-cover change database and its relative studies in China. J. Geogr. Sci 2002, 12, 275–282. [Google Scholar]
- Pinzon, J.E.; Brown, M.E.; Tucker, C.J. Monitoring Seasonal and Interannual Variations in Land-Surface Vegetation from 1981–2006 Using GIMMS NDVI. University of Maryland-Global Land Cover Facility Data Distribution. Available online: http://glcf.umiacs.umd.edu/library/guide/GIMMSdocumentation_NDVIg_GLCF.pdf (accessed on 30 July 2007).
- Pinzon, J. Using HHT to Successfully Uncouple Seasonal and Interannual Components in Remotely Sensed Data. Proceedings of SCI 2002 International Conference, Orlando, FL, USA, 14–18 July 2002.
- Pinzon, J.; Brown, M.E.; Tucker, C.J. Satellite Time Series Correction of Orbital Drift Artifacts Using Empirical Mode Decomposition. In Hilbert-Huang Transform: Introduction and Applications; Huang, N.E., Shen, S.P., Eds.; World Scientific Publishing: Company: Hackensack, NJ, USA, 2004. [Google Scholar]
- Mangiarotti, S.; Mazzega, P.; Hiernaux, P.; Mougin, E. The vegetation cycle in West Africa from AVHRR-NDVI data: Horizons of predictability versus spatial scales. Remote Sens. Environ 2010, 114, 2036–2047. [Google Scholar]
- Gobron, N.; Pinty, B.; Verstraete, M.M.; Widlowski, J.L. Advanced vegetation indices optimized for up-coming sensors: Design, performance, and applications. IEEE Trans. Geosci. Remote Sens 2000, 38, 2489–2505. [Google Scholar]
- SPOT Vegetation User’s Guide. Available online: http://www.spot-vegetation.com/userguide/userguide.htm (assessed on 1 June 2011).
- Henry, P.; Meygret, A. Calibration of Vegetation Cameras on-board SPOT4. Proceedings of 2000 Conference on the VEGETATION, Belgirate, Italy, 3–6 April 2001; pp. 23–32.
- Vermote, E.F.; El Saleous, N.Z.; Justice, C.O. Atmospheric correction of MODIS data in the visible to middle infrared: First results. Remote Sens. Environ 2002, 83, 97–111. [Google Scholar]
- Ran, Y.H.; Li, X.; Lu, L. China land cover classification at 1 km spatial resolution based on a multi-source data fusion approach. Adv. Earth Sci 2009, 24, 192–203. [Google Scholar]
- Gutman, G.; Ignatov, A. Satellite-derived green vegetation fraction for the use in numerical weather prediction models. Adv. Space Res 1997, 19, 477–480. [Google Scholar]
- Holben, B.N. Characteristics of maximum-value composite images from temporal AVHRR data. Int. J. Remote Sens 1986, 7, 1417–1434. [Google Scholar]
- Jonsson, P.; Eklundh, L. TIMESAT—A program for analyzing time-series of satellite sensor data. Comput. Geosci 2004, 30, 833–845. [Google Scholar]
- Udelhoven, T. TimeStats: A software tool for the retrieval of temporal patterns from global satellite archives. IEEE J. Sel. Top. Appl. Earth Obs. Remote Sens 2011, 4, 310–317. [Google Scholar]
- Julien, Y.; Sobrino, J.A. Comparison of cloud-reconstruction methods for time series of composite NDVI data. Remote Sens. Environ 2010, 114, 618–625. [Google Scholar]
- Hird, J.N.; McDermid, G.J. Noise reduction of NDVI time series: An empirical comparison of selected techniques. Remote Sens. Environ 2009, 113, 248–258. [Google Scholar]
- Cleverland, R.B.; Cleveland, W.S.; McRae, J.E. A seasonal-trend decomposition procedure based on Loess. J. Official Stat 1990, 6, 3–73. [Google Scholar]
- Jonsson, P.; Eklundh, L. Seasonality extraction by function fitting to time-series of satellite sensor data. IEEE Trans. Geosci. Remote Sens 2002, 40, 1824–1832. [Google Scholar]
- White, M.A.; de Beurs, K.M.; Didan, K.; Inouye, D.W.; Richardson, A.D.; Jensen, O.P.; O’Keefe, J.; Zhang, G.; Nemani, R.R.; van Leeuwen, W.J.D.; et al. Intercomparison, interpretation, and assessment of spring phenology in North America estimated from remote sensing for 1982–2006. Global Change Biol 2009, 15, 2335–2359. [Google Scholar]
- Heumann, B.W.; Seaquist, J.W.; Eklundh, L.; Jonsson, P. AVHRR derived phenological change in the Sahel and Soudan, Africa, 1982–2005. Remote Sens. Environ 2007, 108, 385–392. [Google Scholar]
- Hirsch, R.M.; Slack, J.R. A Nonparametric trend test for seasonal data with serial dependence. Water Resour. Res 1984, 20, 727–732. [Google Scholar]
- Kendall, M.G. Rank Correlation Methods, 4 ed; Charles Griffin: London, UK, 1975; p. 202. [Google Scholar]
- Mann, H.B. Non-parametric test against trend. Econometrica 1945, 13, 245–259. [Google Scholar]
- Hirsch, R.M.; Slack, J.R.; Smith, R.A. Techniques of trend analysis for monthly water-quality data. Water Resour. Res 1982, 18, 107–121. [Google Scholar]
- Sen, P.K. Estimates of regression coefficient based on Kendall’s Tau. J. Am. Stat. Assoc 1968, 63, 1379–1389. [Google Scholar]
- Bouza-Deano, R.; Ternero-Rodriguez, M.; Fernandez-Espinosa, A.J. Trend study and assessment of surface water quality in the Ebro River (Spain). J. Hydrol 2008, 361, 227–239. [Google Scholar]
- Gilbert, R.O. Statistical Methods for Environmental Pollution Monitoring; Van Nostrand Reinhold Company: New York, NY, USA, 1987; p. 320. [Google Scholar]
- Dent, D.L.; Bai, Z.G.; Olsson, L.; Schaepman, M.E. Proxy global assessment of land degradation. Soil Use Manage 2008, 24, 223–234. [Google Scholar]
- Helldén, U.; Tottrup, C. Regional desertification: A global synthesis. Global Planet. Change 2008, 64, 169–176. [Google Scholar]
- Symeonakis, E.; Drake, N. Monitoring desertification and land degradation over Sub-Saharan Africa. Int. J. Remote Sens 2004, 25, 573–592. [Google Scholar]
- Kobayashi, H.; Dye, D.G. Atmospheric conditions for monitoring the long-terrn vegetation dynamics in the Amazon using normalized difference vegetation index. Remote Sens. Environ 2005, 97, 519–525. [Google Scholar]
- Nagol, J.R.; Vermote, E.F.; Prince, S.D. Effects of atmospheric variation on AVHRR NDVI data. Remote Sens. Environ 2009, 113, 392–397. [Google Scholar]
- Wessels, K.J.; van den Bergh, F.; Scholes, R.J. Limits to detectability of land degradation by trend analysis of vegetation index data. Remote Sens. Environ 2012, 125, 10–22. [Google Scholar]
- Zhu, Z.H.; Yin, X.R.; Zang, H.B.; Liu, H.M.; Dong, J.L.; Liu, Q.Q.; Li, J.R.; Ruan, X.P. Dynamic monitoring on forestry resources in Etuoke Qianqi based on the interpretation of TM image. Inner Mongolia Forestry Science & Technology 2008, 34, 45–48. [Google Scholar]
- The Dynamic Studies on Grassland Vegetation Types and Characteristic in Etuokeqian Banner. Inner Mongolia Agricultural University, Huhhot, Inner Mongolia, China, 2009.
- Liu, Q.; He, Y.; Cui, B.S. Land use/cover change and its influence on the evapotranspiration in Taoer River basin. Resour. Sci 2007, 29, 121–126. [Google Scholar]
- Xia, B.C.; Hu, J.M. Analysis of land-use change in taoerhe catchment during last 15 years. J. Soil Water Conserv 2004, 11, 5–8. [Google Scholar]
- Deng, M.; Di, L. Solar Zenith Angle Correction of Global NDVI Time-Series from AVHRR. Proceedings of IEEE 2001 International Geoscience and Remote Sensing Symposium, Sydney, NSW, Australia, 9–13 July 2001; 4, pp. 1838–1840.
- Sobrino, J.A.; Julien, Y.; Atitar, M.; Nerry, F. NOAA-AVHRR orbital drift correction from solar zenithal angle data. IEEE Trans. Geosci. Remote Sens 2008, 46, 4014–4019. [Google Scholar]
- Kaufman, Y.J. Atmospheric effect on spectral signature—Measurements and corrections. IEEE Trans. Geosci. Remote Sens 1988, 26, 441–450. [Google Scholar]
- King, M.D.; Kaufman, Y.J.; Menzel, W.P.; Tanre, D. Remote-sensing of cloud, aerosol, and water-vapor properties from the Moderate Resolution Imaging Spectrometer (MODIS). IEEE Trans. Geosci. Remote Sens 1992, 30, 2–27. [Google Scholar]
- Wang, J.; Xia, X.G.; Wang, P.C.; Christopher, S.A. Diurnal variability of dust aerosol optical thickness and Angstrom exponent over dust source regions in China. Geophys. Res. Lett 2004, 31, L08107. [Google Scholar]
- Goward, S.N.; Dye, D.G.; Turner, S.; Yang, J. Objective assessment of the NOAA global vegetation index data product. Int. J. Remote Sens 1993, 14, 3365–3394. [Google Scholar]
- POES (US); NCDC (US). Technical Documentation with Imagery and Digital Data: NOAA Polar Orbiter Data User’s Guide (August 1997) and NOAA Global Vegetation Index User’s Guide (July 1997), 1.0 ed; National Climatic Data Center: Asheville, NC, USA, 1997. [Google Scholar]
- James, M.E.; Kalluri, S.N.V. The pathfinder AVHRR land data set—An improved coarse resolution data set for terrestrial monitoring. Int. J. Remote Sens 1994, 15, 3347–3363. [Google Scholar]
- Gupta, R.K.; Prasad, T.S.; Rao, P.V.K.; Manikavelu, P.M.B. Problems in upscaling of high resolution remote sensing data to coarse spatial resolution over land surface. Adv. Space Res 2000, 26, 1111–1121. [Google Scholar]
- Hufkens, K.; Bogaert, J.; Dong, Q.H.; Lu, L.; Huang, C.L.; Ma, M.G.; Che, T.; Li, X.; Veroustraete, F.; Ceulemans, R. Impacts and uncertainties of upscaling of remote-sensing data validation for a semi-arid woodland. J. Arid Environ 2008, 72, 1490–1505. [Google Scholar]
- Baldi, G.; Nosetto, M.D.; Aragon, R.; Aversa, F.; Paruelo, J.M.; Jobbagy, E.G. Long-term satellite NDVI data sets: Evaluating their ability to detect ecosystem functional changes in South America. Sensors 2008, 8, 5397–5425. [Google Scholar]
- Beck, H.E.; McVicar, T.R.; van Dijk, A.I.J.M.; Schellekens, J.; de Jeu, R.A.M.; Bruijnzeel, L.A. Global evaluation of four AVHRR-NDVI data sets: Intercomparison and assessment against Landsat imagery. Remote Sens. Environ 2011, 115, 2547–2563. [Google Scholar]


| Land Cover Types | Description |
|---|---|
| Sparse grassland (SG) | Herbaceous land with 5–20% canopy cover |
| Medium dense grassland (MG ) | Herbaceous land with 20–60% canopy cover |
| Dense grassland (DG) | Herbaceous land with over 60% canopy cover |
| Croplands (CL) | Agricultural land with crops |
| Forestland (FL) | Coniferous, broadleaf and mixed tree cover |
| Waterbodies (WB) | Ocean, lakes, reservoirs, and rivers |
| Constructed area (CA) | Artificial surfaces |
| Non-vegetated land (NL) | All other land cover with less than 5% vegetation cover |
| Observation | Cropland Area (%) | Grassland Area (%) |
|---|---|---|
| SPOT VGT NDVI positive slope | 18.0 | 9.8 |
| SPOT VGT NDVI negative slope | 0.1 | 0.4 |
| MODIS Terra NDVI positive slope | 24.3 | 15.4 |
| MODIS Terra NDVI negative slope | 1.0 | 3.9 |
Share and Cite
Yin, H.; Udelhoven, T.; Fensholt, R.; Pflugmacher, D.; Hostert, P. How Normalized Difference Vegetation Index (NDVI) Trendsfrom Advanced Very High Resolution Radiometer (AVHRR) and Système Probatoire d’Observation de la Terre VEGETATION (SPOT VGT) Time Series Differ in Agricultural Areas: An Inner Mongolian Case Study. Remote Sens. 2012, 4, 3364-3389. https://doi.org/10.3390/rs4113364
Yin H, Udelhoven T, Fensholt R, Pflugmacher D, Hostert P. How Normalized Difference Vegetation Index (NDVI) Trendsfrom Advanced Very High Resolution Radiometer (AVHRR) and Système Probatoire d’Observation de la Terre VEGETATION (SPOT VGT) Time Series Differ in Agricultural Areas: An Inner Mongolian Case Study. Remote Sensing. 2012; 4(11):3364-3389. https://doi.org/10.3390/rs4113364
Chicago/Turabian StyleYin, He, Thomas Udelhoven, Rasmus Fensholt, Dirk Pflugmacher, and Patrick Hostert. 2012. "How Normalized Difference Vegetation Index (NDVI) Trendsfrom Advanced Very High Resolution Radiometer (AVHRR) and Système Probatoire d’Observation de la Terre VEGETATION (SPOT VGT) Time Series Differ in Agricultural Areas: An Inner Mongolian Case Study" Remote Sensing 4, no. 11: 3364-3389. https://doi.org/10.3390/rs4113364