Article

Reconstructing the Spatio-Temporal Development of Irrigation Systems in Uzbekistan Using Landsat Time Series

by
Jana Edlinger
1,
Christopher Conrad
2,*,
John P.A. Lamers
3,
Gulchekhra Khasankhanova
4 and
Thomas Koellner
5
1
Biogeography Department, Faculty of Biology, Chemistry and Earth Sciences, University of Bayreuth, Universitaetsstr. 30, 95440 Bayreuth, Germany
2
Remote Sensing Department, Institute of Geography and Geology, University of Würzburg, Am Hubland, 97074 Würzburg, Germany
3
Center for Development Research (ZEF), Walter-Flex-Str.3, 53113 Bonn, Germany
4
Design and Research UZGIP Institute, Ministry of Agriculture and Water Resources, Republic of Uzbekistan
5
Professorship of Ecological Services, Faculty of Biology, Chemistry and Earth Sciences, BayCEER, University of Bayreuth, Universitaetsstr. 30, 95440 Bayreuth, Germany
*
Author to whom correspondence should be addressed.
Remote Sens. 2012, 4(12), 3972-3994; https://doi.org/10.3390/rs4123972
Submission received: 22 October 2012 / Revised: 2 December 2012 / Accepted: 5 December 2012 / Published: 11 December 2012
(This article belongs to the Special Issue Advances in Remote Sensing of Agriculture)

Abstract

:
The expansion of irrigated agriculture during the Soviet Union (SU) era made Central Asia a leading cotton production region in the world. However, the successor states of the SU in Central Asia face on-going environmental damages and soil degradation that are endangering the sustainability of agricultural production. With Landsat MSS and TM data from 1972/73, 1977, 1987, 1998, and 2000 the expansion and densification of the irrigated cropland could be reconstructed in the Kashkadarya Province of Uzbekistan, Central Asia. Classification trees were generated by interpreting multitemporal normalized difference vegetation index data and crop phenological knowledge. Assessments based on image-derived validation samples showed good accuracy. Official statistics were found to be of limited use for analyzing the plausibility of the results, because they hardly represent the area that is cropped in the very dry study region. The cropping area increased from 134,800 ha in 1972/73 to 470,000 ha in 2009. Overlaying a historical soil map illustrated that initially sierozems were preferred for irrigated agriculture, but later the less favorable solonchaks and solonetzs were also explored, illustrating the strategy of agricultural expansion in the Aral Sea Basin. Winter wheat cultivation doubled between 1987 and 1998 to approximately 211,000 ha demonstrating its growing relevance for modern Uzbekistan. The spatial-temporal approach used enhances the understanding of natural conditions before irrigation is employed and supports decision-making for investments in irrigation infrastructure and land cultivation throughout the Landsat era.

1. Introduction

Irrigation agriculture and cotton cultivation has a long tradition in the Aral Sea Basin in Central Asia. However, in the second half of the 20th century the Soviet Union (SU) intensified the agricultural systems through a large-scale expansion of irrigation and drainage infrastructure [1]. With the aim of meeting the demands of a growing population and strengthening the national economy, the overall area of irrigated land in the Aral Sea Basin was rapidly expanded from 4.51 to 7.99 million ha between 1960 and 2000 [2]. Traditional crops were replaced and crop rotations were sacrificed for monocultures, such as the cash crop cotton in the socialistic republic of Uzbekistan. Melioration practices and the provision of major production factors (water, fertilizers, chemicals) enabled the farming population, who was partly resettled from other parts of the SU bloc, to cultivate even the steppe regions, but under extremely dry continental climatic conditions [3].
Triggered by its historical development, the former Soviet republic Uzbekistan, Central Asia, became the sixth largest cotton producer worldwide [4]. Since the entire cotton chain in the country accounts for 35% of the national GDP, 60% of foreign exchange receipts, and 45% of employment [5], this illustrates the dependency of the country on a sustainable land use for cotton production. But the situation in the agricultural production systems of Uzbekistan has become alarming because severe land degradation and ill-managed water resources endanger the livelihoods of the rural population and the welfare of the country given its high path dependency on cotton. Excessive use of irrigation water, deteriorating irrigation canals, and missing or malfunctioning drainage systems have already increased groundwater levels and accelerated secondary salinization since Soviet times [3]. About 60% of the irrigated land in Uzbekistan is reportedly already affected by medium to high soil salinity, which can reduce potential yields by 30–40% to 50–60%, respectively [6].
The irrigation expansion initiated during the SU era caused manifold environmental challenges. The construction of new water reservoirs and irrigation canals interfered strongly with the natural water balance of which the demise of the Aral Sea is probably the most well-known example. Until 2009, the Aral Sea for instance lost 92% of its water resources available in 1960 [7]. A loss of biodiversity was recorded along the rivers and in their delta regions, where valuable wetlands and ecosystems disappeared due to the now regular occurring, man-made droughts [3,6]. Furthermore, the numerous desert sinks, which have been filled with highly saline drainage water, are further evidence for the ongoing environmental damages. Following independence in 1991, various reforms have been initiated to arrest or even reverse the ongoing trend of resources degradation in Uzbekistan. Despite the programs launched to support these reforms, limited impact has been seen on the ground thus far. These programs could benefit from both knowledge of historical processes and up-to-date, reliable and comprehensive information to support current decision-making processes.
Knowledge and awareness about the implementation of previous decisions for intensifying irrigated agricultural production may qualify current decision makers for an improved understanding of the impacts of irrigation on different ecological settings. Latest research results underline for instance that a further expansion of irrigation and drainage networks in Uzbekistan are likely to occur in case of continuing recently initiated reforms [8]. However, due to geological reasons, the majority of virgin land shares in the country exploited for irrigated agriculture after 1950 was already saline [9] whilst similar conditions can be found on the presently envisaged expansion areas. Thus, monitoring and understanding the development of land conversion in a spatially explicit way is essential for future decision-making. For instance, by combining frequent observations of the cropland area with information on changing soil properties, soil degradation processes can be understood better in time and space. Spatially explicit information on land use changes is helpful for assessing the necessary resources suitable for maintaining the agricultural production, e.g., calculations of demands for infrastructure and production inputs, or simply for prioritizing canal rehabilitation plans. The latter is especially important as water losses from irrigation and drainage networks in the Aral Sea Basin amount to about 40 km3 annually [10] meanwhile the water demands for agricultural production in Uzbekistan are likely to increase [8].
Multi-temporal remote sensing is widely recognized as a powerful tool for land surface mapping and change detection, which includes mapping of irrigated areas [11,12]. Frequently moderate-resolution sensors such as MODIS or SPOT Vegetation have been used for mapping irrigated croplands (among others [1215]). These sensors cover extensive areas over long periods thus permitting to contribute to global area coverage even in intervals of several days. Similarly, a wealth of information exist on numerous approaches used for mapping agricultural area or crops through high-resolution data recorded by sensors such as Landsat, although only few studies applied multi-annual time series of Landsat data. Martinez-Casanovas et al.[16] analyzed for instance spatial cropping patterns in a small-scale irrigation system in Spain over eight years (1993–2000), however, with an incomplete sequence of these years. Maxwell et al.[17] used a complete set of annual Landsat time series for the period 1994 to 2010 (two to eleven scenes per year) with the purpose of mapping permanent-cropped land in several counties of the US. One innovative multi-sensor approach was presented by Thenkabail and Wu [18], who combined the high geometric resolution of Landsat and the phenological details of MODIS time series in decision tree classifications for mapping cropland in Tajikistan in 2005 and 2010. However, even though the Landsat archives of NASA have been made accessible, applications of Landsat time series for mapping the development of irrigation agriculture over longer time periods have not been reported yet.
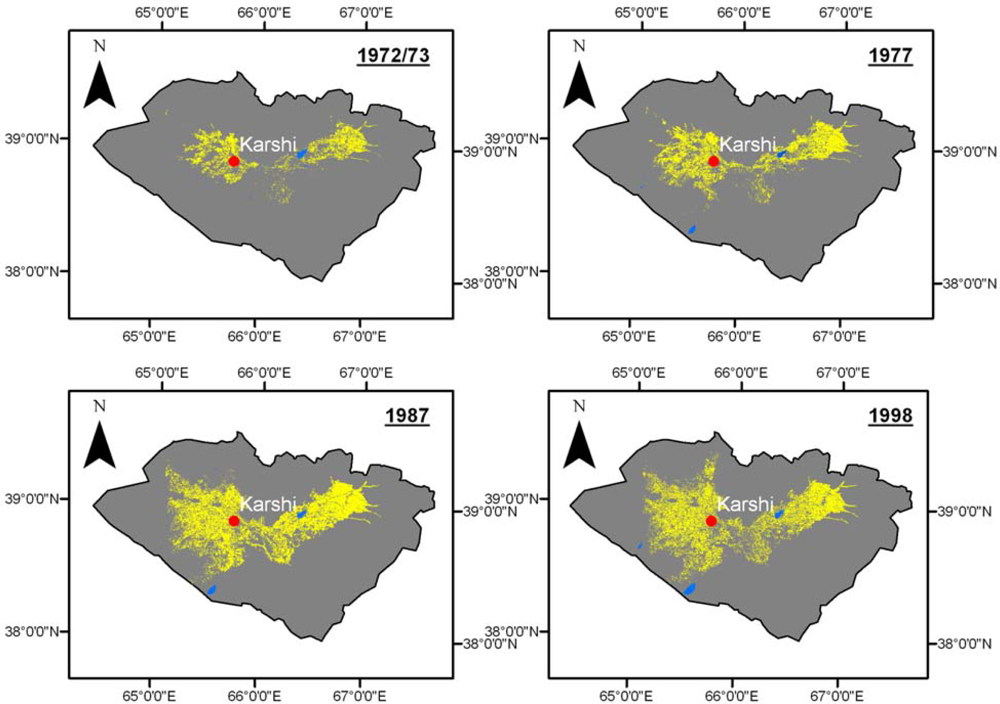
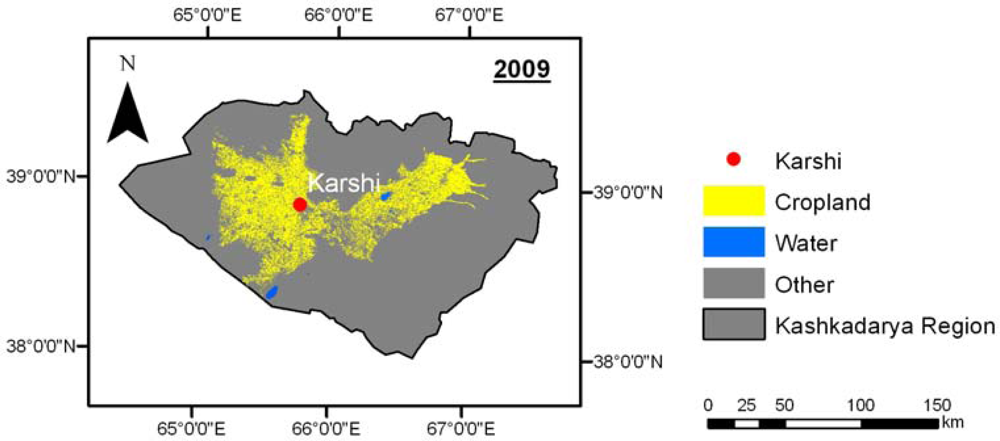
This study aims at a method that enables reconstructing the spatio-temporal development of irrigation systems between 1972 and 2009 using satellite remote sensing for the Kashkadarya Province of Uzbekistan, Central Asia. Sequences of different Landsat satellite data were used to generate objective maps of historical land use changes with a focus on the laminar expansion and the intensification of agricultural land use, which is defined here as the densification of agriculture per area and agricultural usage of different soil types in the study region. Our research spans the period from the installation of a large-scale irrigation infrastructure in the Kashkadarya Province during the SU era starting in the early-mid-1970s, the intensification of winter wheat production following the independency of Uzbekistan in 1991, till today, where a restructuring of the irrigation systems is envisaged. The period under investigation includes the openings of the Karshi Pumping Cascade in 1973 and the Talimardjan Water Reservoir in 1975/76. These were the most relevant infrastructural steps towards expansion and intensification of the irrigation systems in the study region.

2. Study Area

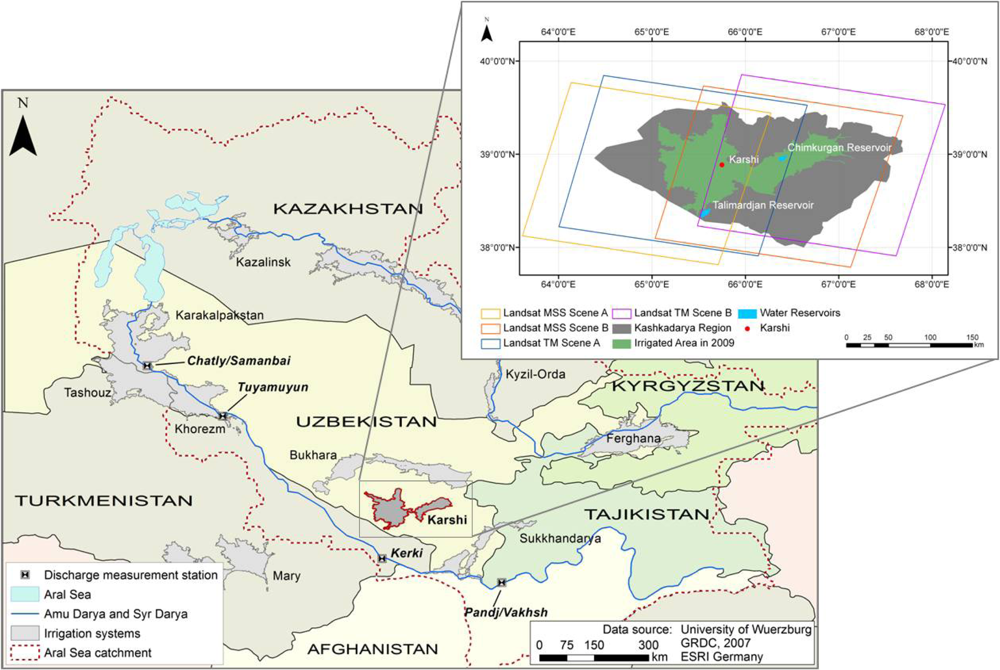
The Kashkadarya Province is located in south of Uzbekistan. The eastern part of the Kashkadarya Province consists of the foothills of Pamir Mountains from where the Kashkadarya River enters the flat Karshi Steppe, which is the western part of this province. The climate of the region is continental with hot and long summers, and short winters with little snow [19]. The long-term annual average temperature in the region is 13.5 °C. Precipitation mainly occurs during the winter months showing an increasing trend from the steppe to the mountains and averages at 355 mm per year [20].
Given the characteristics of precipitation and weather, agriculture in the Kashkadarya Province relies on supplemental irrigation especially in summer. From the mid-1960s onwards this province became a large-scale irrigation area. The irrigation network to be installed was designed for supplying more than 500,000 ha of irrigation land with water. This district became one of the major cotton production areas of the former SU and received massive amounts of resources for maintaining the productive potential of its irrigated land. Therefore, the irrigation system of the province was divided into two planning zones (PZ). The Kashkadarya PZ, located upstream, is completely supplied with irrigation water from the Kashkadarya Basin. The Karshi PZ on the other hand is by 90% irrigated with water from the Amudarya, the other 10% originate from the Kashkadarya River, in particular the Chimkurgan Water Reservoir in the east of the Kashkadarya Province (Figure 1) [21]. The Karshi Steppe (PZ) is not directly located at the banks of the Amudarya. Hence the river water is conveyed over a distance of 78 km via the Karshi Main Canal (design capacity 175 m3/s) and the Karshi Pumping Cascade (KPC), which was constructed in 1973. Seven pumping stations lift water 159 m from the Amudarya into the Talimardjan Water Reservoir from where a maximum water amount of 360 m3/s can be released [22]. Beside irrigation water, the reservoir also provides drinking water for the inhabitants of the Karshi PZ. Today, the efficiency of the pumping stations and canals in the KPC has been declined, which has been assessed as one of the major causes for the reduced productivity of the Karshi PZ [5,21]. Thus, adequate land and water management decisions are required in this highly drought-prone basin, especially under increasing climate variability, which predicts lower water supply to the lowlands of Central Asia including the Kashkadarya Province of Uzbekistan [23].
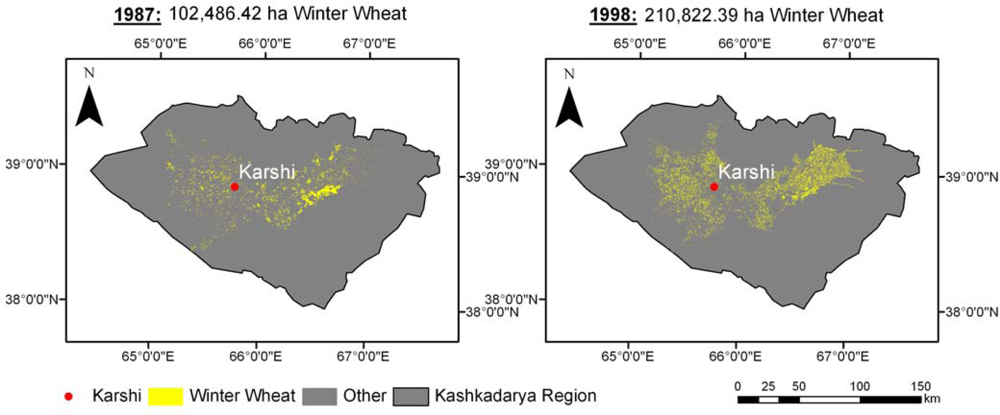
Although cotton is the main crop in both PZs, the Kashkadarya Province has been designated an important role in the wheat production of Uzbekistan following independence in 1991. In comparison to other Uzbek provinces, the production of both strategic crops was reportedly much lower in the Kashkadarya planning zones during 1991–2005 [24]. Furthermore, rice, corn, vegetables, orchards and gardens are reported for this region [17].
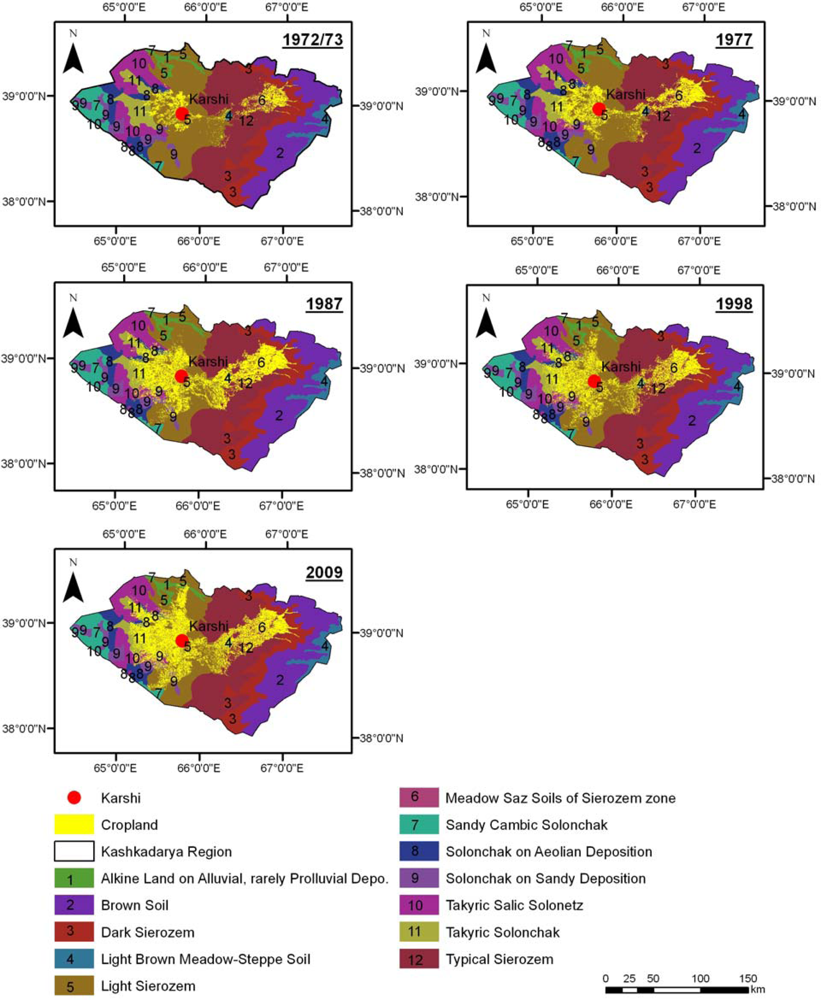
The irrigated areas are nowadays situated in desert and sierozem soil formation zones [25]. Prior to the introduction of the large-scale irrigation networks and intensive crop cultivations schemes in 1960, the natural soil conditions were poor. The soils in the Karshi steppes are mainly solonchaks on aeolian and sandy depositions and takyric salic solonetz. In the center, typical and light sierozems are found. At the foothills of the Pamir Mountains, dark sierozems and brown soils dominate [26]. Due to intensive irrigation activities since the 1960s and the subsequent rise in ground water tables, the zonal features of the soils have changed and the hydromorphic features have increased [25].

3. Materials and Methods

3.1. Data and Knowledge-Base

3.1.1. Landsat Satellite Data

The explored Landsat MSS and TM Level 1 data were provided free of charge by the Product Generation System at the United States Geological Survey (USGS) Center for Earth Resources Observation and Science (EROS). Landsat images were regarded as the best option because they provided a relatively continuous time series of data with a resolution detailed enough to detect human induced changes such as land conversion to irrigation agriculture [27].
Landsat is an operational imaging system and each scene is ordered in a so-called World Reference System (WRS). To cover the entire study area, two neighboring scenes needed to be required. Scene A displays the Karshi PZ around the town of Karshi, whilst scene B shows the Kashkadarya PZ along the Kashkadarya River (Figure 1(b)). The MSS data are registered to a 79 m grid, Universal Transverse Mercator (UTM) projection, WGS 84, Zone 41 (scene A) and Zone 42 (scene B), path 168/row 33 (scene A) and path 167/row 33 (scene B). They comprise four spectral bands. The TM data are registered to the same UTM projection; they differ however in the path of the Landsat WRS, because MSS data is tiled into WRS-1, whereas for TM data, WRS-2 is used. Scene A is located at path 156/row 33 and Scene B at path 155/row 33. TM images feature a 30 m grid and consist out of 7 spectral bands. All scenes cover an area of approximately 183 km × 170 km [2830]. For classification, only the red and near-infrared bands were used.
Five time steps (1972/73, 1977, 1987, 1998, 2009) were chosen to follow changes in extent and usage intensity of the irrigated land in the Kashkadarya province. Due to a lack of usable data in the early Landsat era, scenes of two years had to be combined for implementing the multi-temporal classification approach (Section 3.2). Images of 1977 were chosen to assess the immediate impact of the Talimardjan Reservoir. Since 1977, the extension of the cropping area is monitored with ten to eleven year intervals depending on quality and suitability of data of initially selected years.
As Landsat satellites and their operational instruments have changed and improved between 1972 and 2009, different initial situations had to be accounted for. Technical defaults and heavy cloud cover limited the amount of useable images but this differed each year. Consequently more data was available in some years than in other. To cover the period with the highest vegetation values, only the satellite images from March to October were considered.

3.1.2. Soil Map

A historical soil map of Uzbekistan [26] was digitized. Although the scale is relatively course, (1:1,500,000) it is sufficiently accurate in providing a valuable overview of the soils before irrigation expansion from 1960 onwards. Hence, it was a suitable reference for tracing back the gradual usage of the different soil types.

3.1.3. Secondary Data

Accurate data on the size of the irrigated areas and actually cropped area is limited whereas complete time series turned out to be even rare. This gap was bridged by composing a complementary data set with the use of additional sources: Data for 1972 and 1973 was made available by the Council of Production Forces of the Republic Uzbekistan [31], which became the “pre-expansion” benchmark. The year 1977 could be complemented with information from the WARMIS/database [32]. The CAREWIB database [33] provided information on the size of the irrigated area in the Kashkadarya irrigation system for 1987 and 1998. For 2008, data was made available through the national statistical department of Uzbekistan [34].

3.2. Classification Approach

3.2.1. Preprocessing of Landsat Data

All Landsat data (Table 1) were calibrated to the reflectance at the top of the atmosphere (TOA) after which subsets of the study area were extracted. All of the Landsat TM data were found to be accurately georeferenced after the download. Only the MSS images needed additional geometrical adjustments to the TM data. This was achieved by setting 8–10 visually distinctive ground control points (GCPs) and applying a 2nd level polynomial transformation. The returning accuracy was at sub-pixel level for all MSS data sets.
An absolute atmospheric correction was omitted from the preprocessing progress due to several considerations. First, the dry climatic conditions prevailing in the study region generally lead to reduced water vapor content in the atmosphere but especially during the examined period, May–October. Secondly, an automated system was not used for the classification but rather completed manually, which enabled to balance varying atmospheric influences. Furthermore, change detection was conducted during post-classification and independent from spectral information.

3.2.2. Knowledge-Based Detection of Irrigated Land

In the study region, natural vegetation cover increases with altitude. The dominant steppe ecosystems are usually sparsely covered with green vegetation but peak after the snow melts in spring. Thus, for detecting agricultural land, three basic area classes have been distinguished: (a) ‘cropland’, (b) ‘water’, and (c) ‘other’, whereas the latter comprises the sparsely vegetated steppes, bare and unused agricultural areas and settlements. Visual interpretation of Google Earth datasets and analyzing height and slopes derived from Shuttle Radar Topography Mission (SRTM) data [35] was needed to separate irrigated cropland from other types of dense vegetation. The latter comprised in particular the non-irrigated grain production areas on the hillsides as well as the vegetation aside the irrigation system, and the natural vegetation. Dense natural vegetation occurs in some mountainous parts of the province, far beyond the core of the irrigation district in the steppes, in smaller wetlands along the drainage canals, and around the Talimardjan Reservoir. Accordingly, the class ‘cropland’ could be purposely delineated to the irrigated cropland of the Kashkadarya Province during all years examined. The utilization of SRTM for irrigated cropland separation in the neighbored Tajikistan was also suggested by Thenkabail and Wu [18].
Because croplands show a distinctive phenological pattern in contrast to non- or semi-vegetated areas or water, a temporal transect of spectral information could be analyzed. Temporal profiles of the Normalized Difference Vegetation Index (NDVI) were therefore generated from multiple Landsat scenes of one observation year. The NDVI represents the greenness and density of vegetation cover [36].
All NDVI layers derived from multiple time steps within one vegetation period were stacked and displayed. Training data for detecting benchmarks of the three basic classes (later on to be implemented as rules in the hierarchical decision trees) were generated by a random collection of polygons representing visually differing land cover and vegetation classes within each NDVI stack. This method is considered to be adequate in case the environment from which the training data were obtained is relatively homogeneous [37]. For instance, during the very dry summer period (July and August), only cropping activities result in dense vegetation patches. Non-irrigated vegetated areas in mountainous locations (natural vegetation or rain-fed agriculture) mostly show lower NDVI values within this period.
For each observation year, 12–15 spectral classes (greenness signatures) were created from annual NDVI profiles containing several polygons with an overall pixel amount of approximately 300 per class. Attention was paid to sample the polygons for each greenness signature from plots homogeneously distributed over the image. For each greenness signature, the monthly maximum and minimum NDVI as well as the mean and standard deviation of NDVI values per month were calculated.
In a second step, the NDVI profiles of the visually separable classes were compared with phenological stages of the typical crops from the region. According to official statistics, cotton and grain crops were selected since they represented between 72% and 83% of all crops under irrigation between 1980 and 2000 [33]. Therefore, existing MODIS-based phenological NDVI development curves of cotton, rice, winter wheat, rotations with winter wheat, bare land, and water were used as representative profiles. These profiles were assembled from the Khorezm region [38,39], since this region exposes agro-climatic conditions between May and October similar to the Kashkadarya Province, although located about 500 m north-west of the Karshi PZ. Accordingly, a range of thresholds could be derived as classification rules for the basic classes.
Figure 2 depicts an exemplary library of greenness signatures of the three basic classes resulting from the comparison of NDVI profiles in the mask indicating the estimated potential irrigated cropland. The values on the x-axis show the analyzed Landsat time steps. The water class (blue line) has negative slopes in the red edge leading to negative NDVI values. Bare soil or sparse steppe vegetation with a high percentage of dry vegetation usually show non-model NDVI developments at soil line level (between 0.1 and 0.2). Also, those areas with temporary water cover followed by sparse vegetation as indicated by negative NDVI values followed by an NDVI increase moderately above soil line level were assigned to the class ‘other’ (Figure 2: grey profiles). Three groups of crop phenologies could be detected: one peaked in spring (May, June) but showed low values afterwards (‘cropland group 1’); one with NDVIs increasing from soil line level to 0.4 and higher (‘cropland group 2’); and another with two peaks separated by a decrease in the June acquisitions (‘cropland group 3’). According to the findings from Conrad et al.[38,39] for the Khorezm region in Uzbekistan and based on the fact, that major crops in Khorezm correspond with those in Kashkadarya PZ, these profiles were interpreted as winter wheat (‘cropland group 1’), summer crops (cotton, rice, maize/sorghum, ‘cropland group 2’) and rotations of winter wheat with a summer crop such as rice or maize and sorghum (‘cropland group 3’). A more detailed differentiation of summer crops was beyond the scope of this study. Consequently, only the three major classes of crop vegetation cover were considered in this step and merged to the class ‘cropland’.
Decision trees were generated for all five time steps between 1972/73 and 2009. A two-step approach was implemented for each time step (an example is given in Figure 3). Table 2 shows the different classification rules for the classes ‘cropland’, ‘water’, and ‘other’ applied in the respective decision trees. The fact that the availability of Landsat data varied between the years (Table 1) necessitated the establishment of different rule sets for each year.
The reliability of classification results decreases in case of incomplete time series, e.g., when one image of a relevant phenological stage is missing [40]. To account for the varying acquisition dates for which Landsat data was available within one year, annual mean NDVI values were used in the rules of the decision trees. The latter was adequate especially for the earlier periods examined, i.e., 1972/73 and 1977.
It has also to be noted that the simplicity of the decision tree structure results from the comparatively low presence of dense vegetation cover other than irrigated cropland. Those parts of the study region, where potentially dense vegetation cover occurred, were already omitted from the classification by the aforementioned steps using SRTM and Google Earth. The use of annual means of NDVI per pixel permitted to remove sparsely vegetation covered areas like rangelands. Even in case of high herbaceous cover, the active period of the steppes in the Kashkadarya Province is too short for higher signals in the annual NDVI averages. More sophisticated rule sets become necessary in more heterogeneous landscapes with other climate conditions and subsequently more vegetation classes, as previously shown by Gumma et al.[14].

3.2.3. Accuracy Assessment

Due to the absence of ground truth information, validation data was selected in the same way as the training data was sampled. For each year, 12–15 samples were collected each comprising around 300 pixels. The statistics of the spectral classes and the knowledge on NDVI development in Khorzem [37,38] were therefore used to assign the NDVI profiles to the three basic classes ‘cropland‘, ‘water’, and ‘other’. A confusion matrix was created by contrasting the result of the decision tree with the sample class, which is a frequently applied approach for validation [37]. From this matrix, overall accuracy, user’s and producer’s accuracy were calculated as described by Congalton & Green [41]. For the time step 2009, Google Earth information could be used for additional assessments.

3.2.4. Separation of ‘Winter Wheat’ from ‘Cropland’

After independence in 1991, the cultivation of irrigated winter wheat was enforced in Uzbekistan. Until this period winter wheat was cropped mainly under rain-fed conditions. In 1998, already 28% of the irrigated area in Uzbekistan was cropped with wheat [2]. Winter wheat is the only dominating winter crop in the irrigated areas of Uzbekistan. Since two early acquisitions (May 1987 and May 1998, Table 1) were available, wheat area changes before and after independence could subsequently be mapped. Therefore, the previously described decision trees (Table 2) of the respected years were extended for detecting ‘winter wheat’ in the class ‘cropland’ (Table 3). The thresholds derived from the NDVI stacks were crosschecked with the temporal NDVI profiles available for the Khorzem region [38,39].

4. Results and Discussion

4.1. Accuracy Assessment

The confusion matrixes of the single classifications showed overall accuracies ranging between 87% and 98% (Table 4). Such accuracies can be considered as high, but since image-derived samples were used instead of actual ground-truth measurements, this assessment should be taken with some caution. On the other hand, the classification focused on the three general surface types, which can be easily discriminated with high accuracies due to their optical properties: water, non- or sparsely vegetated areas, and vegetated areas from which the actual irrigated croplands are extracted by the post-processing steps. Finally, an overlay of the classification results of 2009 in Google Earth (recorded in the same year) confirmed, that the results are trustworthy.
The accuracy of the classifications based on Landsat MSS data prior to the construction of the Talimardjan Water Reservoir (1973) was lower compared to classifications based on the later scenes. However, the lower spatial resolution of MSS (60 m) influenced only marginally the findings compared to the level of detail, which was possible with 30 m TM data. The average size of the irrigated field parcels during the Soviet epoch in Central Asia amounted to several ha. Hence, potential negative effects on the accuracy usually resulting from a more heterogeneous landscape could be excluded. Instead, the limited number of time steps available (two for scene B, and three for scene A, Table 1), the merging of two years and the slightly lower quality of the very early MSS data are the most likely sources for the resulting lower accuracy of the results for the earliest period examined.
The results underestimated the official data on the irrigated area of the Kashkadarya Province (Table 5). It remains untraceable, if the official statistics reported the actually irrigated area or the planning status, which usually exceeds the actual implementation [8]. This is especially the case in 1998. For this year official statistics showed very high net irrigated area, i.e., the actually irrigated area. But there was no information available on the actually harvested area, which is usually the area recordable by satellite data irrespectively of the method. In dry regions such as the Karshi Steppe within-field variability of crop growth is very high and patches of bare land occur especially under water scarce situations. Water diversion to the Karshi Main Canal for instance was lower in 1998 than in the subsequent years [33], which might be an indication for low productivity in the irrigation system in 1998. However, finding actual reasons for droughts in irrigation systems is usually more complex than taking into account the water availability in one, even important canal. For the first time step, one additional reason for the deviation of ca. 20% may be caused by the comparatively low overall accuracies for the early Landsat MSS based classifications. The limited information provided by the official data sources lowers on the one hand their credibility but on the other hand underlines the value of objective remote sensing assessments. Therefore, the following analysis steps are completely based on the remotely sensed cropland maps.

Limitations of the Approach

Despite the high overall accuracies presented above, there are some restrictions which potentially reduce the transferability of the approach to other regions and especially limit automation. Some uncertainties and potential error sources have already been indicated in other sections and will be included in the following discussion.
The statistics derived from the cropland maps suggest that the sum of pixels that has been accounted to the class ‘cropland’ in each time step corresponds to the agriculturally used area in total. However, one has to consider that the rules of the classification are established from NDVI values, which account for live green vegetation and not only for arable crops. With the knowledge-based classification the risk of including a minor amount of pixels showing natural vegetation in the class ‘croplands’ remained. Utilizing Google Earth maps for excluding clearly non-irrigated but vegetated land was possible due to the availability of high resolution data from 2009 but it was time consuming and only possible by visual interpretation (Section 3.2.2). For automation, information on field boundaries or GIS information about the potential extent of the irrigation system would be helpful. Field information could be derived from very high resolution data, e.g., SPOT or aerial photos as previously shown to be suitable for field-based crop mapping [4244]. However, high resolution data is rare in the early times of Landsat.
A second aspect is the dependency on the image acquisition dates when different vegetation classes are separated using phenological NDVI information [40]. As described in Section 3.2.2 we balanced missing acquisition dates by annual mean NDVI values. However, more detailed classifications including, e.g., the separation of winter and summer crops, or a higher complexity of the agricultural landscape during classification (as described e.g., by Gumma et al.[13]) would have negative influences on the results in case of limited data availability. In that case, the utilization of high resolution optical time series composed of different sensors [18,45] can be one promising conceptual option for improvements when aiming at automation or portability to other agro-ecosystems. But again, this weakness can hardly be solved for the early Landsat period in 1972/73, when also sensor failures (e.g., stripes or missing data) lead to reduced availability of archive data, because for these times, the density of remote sensing data available for analysis is generally very low.

4.2. The Transformation of Irrigated Land in the Kashkadarya Province

The temporal development of the spatial distribution of cropland clearly demonstrates the impact of the construction of new irrigation systems and the diversion of Amudarya water in the Kashkadarya Province (Figure 4). Starting with an area extent below 200,000 ha, observed in the time step 1972/73, the irrigation system has increased to 225,540 ha in 1977, due to the development of the virgin lands in the Karshi Steppe and the completion of the Talimardjan Reservoir. This reservoir is visible in the south of the irrigation district. An intensification of land use is indicated by the increasing density of cropland pixels in the silhouette of the irrigation system. Between 1977 and 1987, the cultivated area grew to almost double its size reaching 404,435 ha in 1987. During the early years, the irrigation system expanded mainly into the Karshi Steppe. Moreover, although a higher intensification of agricultural land use occurred throughout the area, it has been taken place especially in the mountainous Kashkadarya PZ. This fundamental shift in land use (from desert to intensive cropland) increased in the process also the value of land, defined here as the monetary worth of a land plot, not counting any buildings but including improvements such as better irrigation or drainage.
In 1998, the western part of the irrigation district (Karshi PZ) has also been stretched to the north. This shows, that the area potentially ready for irrigation increased. On the other hand, the intensity of agricultural usage within the region has decreased significantly. Thus, the area sum of the class ‘cropland’ amounted to 349,525 ha in 1998. The image of 2009 shows again a high increase in cultivation intensity with about 469,685 ha of irrigated land. In 2009 no further expansion was observed compared to the findings from previous images, but the intensity of agricultural usage reached the level of 1987.
In a World Bank report [5] it was suggested that the reduction in the land use intensity over time in the irrigation district was caused by “the lack of farmer’s incentives to improve production and productivity; … the deteriorating irrigation and drainage infrastructure, … and soil salinization and lack of drainage” that occurred after the breakdown of the former SU. The low motivation for improvements of crop and water productivity by farmers is understandable given the differential crop support for cotton and wheat only, which did not change much after independence [8]. This argument is supported also by the virtually unchanged relationship over time between the amount of irrigation water in the Talimardjan Reservoir and the agricultural area [33].

4.3. Development of Winter Wheat Cultivation in the Kashkadarya Province

Winter wheat production on irrigated land in the Kashkadarya Province increased from 102,486 ha in 1987 to 201,822 ha in 1998 (Figure 5). Although the official statistics do confirm the significant increase of grain production in the Kashkadarya Province, they did not distinguish between different grain crops and neither listed the grain crops produced under irrigation separately [33]. In addition, the classifications show that in 1987 (Soviet times), winter wheat cultivation took place on few, but large parts of the irrigation system. Seven years after independence (1998), the classification revealed instead numerous smaller wheat patches scattered over the entire irrigation zones (Figure 5), which may be seen also as an improved diversification of crop cultivation after independence. However, exactly this development of crop diversification appears to be concurrently a cause for the declining infrastructure. Abdullaev et al.[8] for instance underline that the expansion of the winter wheat area in the irrigated areas obstructed the cleaning and maintenance of the canal and irrigation systems during the winter months, which had been a common practice during the SU era. Moreover, in terms of irrigation water use, the change of winter wheat patterns from a few, large clumped patches to numerous small areas results in higher water demands, since more channels need to be filled with water. Since this in turn increases the losses of water in the system the findings from the classification substantiate the overall reported situation of Uzbek irrigation systems [8]. From a technical perspective, the findings demonstrate also the advantage of generating spatially explicit information by the means of remote sensing rather than using tabular crop acreage only, as previously discussed by Gallego et al.[46].

4.4. Chronological usage of soil types in the Kashkadarya Province

Overlaying the classification results with the historical soil map reveals the systematic selection of land for irrigation agriculture in the past. This is indicated by the sequence of different soil types farming occupied over time (Table 6, Figure 6). Before the expansion (represented by time step 1972/73) most cropland was situated on light sierozems (type 12) and on typical sierozems (type 5), which are the most common but also heterogeneous appearing soil types of the study area. Despite being typical desert soils with inherent extremely low humus content compared to more humid ecosystems, in Central Asia sierozems have been made suitable for crop production [47] once irrigated and appropriate soil salinity management had been introduced [48].
From the 1977 findings it becomes clear that the irrigated area had been expanded further, even covering parts of takyric solonchaks (type 11) in the west although such soils were considered suitable as pasture land only. Therefore, the necessary drainage and irrigation system had to be installed [49].
By 1987, the agriculturally used area had been further expanded to solonchaks with takyric horizons and even to solonchaks on aeolian deposition (type 8) as found in the northwest of the region. In the southwest, the cropland extension occurred on solonchaks underlain by sandy depositions (type 9) and on takyric salic solonetz (type 10). Solonetz shrinks under dry, but disperses under humid conditions, which makes this soil type in principle unfavorable for agriculture. However, when adding systematically gypsum, such soils can also be made suitable for cultivation [50]. A small patch in the eastern center of the irrigation district, characterized by a light brown meadow-steppe soil (type 4), which had been excluded from cultivation before, had instead been cultivated almost completely by 1987.
From 1987 onwards, the irrigation district spanned out north to another area of light sierozem, avoiding thus the alkine land on alluvial, rarely proluvial deposition (type 1). Until 2009, no more significant expansion of the area has occurred. However, in the south one can observe new fields on sandy cambic solonchak (type 7) and in the north more parts of the alkine land on alluvial, rarely proluvial deposition have been cultivated (type 1).
Our results show that light sierozem and typical sierozem had been the preferred soil types for the first exploration, whereas takyric solonchak soils were favored over solonchak on aeolian or sandy deposition. Although initial soil quality is an important criterion for land use, additional factors such as, e.g., property rights or spatial planning by the central administration may have played a role in the extension of the irrigated area. Although findings underlined that soils of low quality had been cultivated later, as a standalone argument this evidence is undoubtedly crude. On the other hand, private land property rights did not exist during the SU era whilst information on spatial planning during this period is hardly accessible, underlining the need for a historical, evolutionary perspective and reconstruction [51]. The target use of remote sensing techniques can help unraveling such uncertainties. As soon as additional spatial information is available, the method developed can increase in value. Moreover this can support the assumption that although the SU found it hard to persuade the international community [52], a solid strategy for expanding its irrigated areas in Central Asia had been used.
The obtained change maps can now also complete an integrative analysis of land degradation. For instance, the monitoring results indicate in a spatially explicit way the time span in which a land parcel was under irrigation. A comparison of soil properties before the first irrigation and later (e.g., today) could support estimating land degradation rates. In case of available secondary data, these rates could be layered with the drainage system to assess the functionality of such a system and for a better understanding of salinization in the PZ, which was described by the World Bank [5]. Abdullaev et al.[8] recalled the effects of the quota for cotton and wheat on management and use of water. Since these quota are not only on yields but also on area, an incentive for improving water productivity especially of cotton is still missing, which in turn increases the risk of accelerated degradation. But an increased effort of data integration, e.g., combining crop productivity with soil types or with periods under irrigation, may show the potential limits of systems. Thus, these methods could deliver planning and decision-making today new information for re-assessing the value of the land in its current conditions.

5. Conclusions

A significant laminar growth of cultivated land and an intensification of the cultivation in the Kashkadarya Province of Uzbekistan from 134,775 ha in 1972/73 to 469,685 ha in 2009 were shown in this study. Multi-temporal Landsat MSS and TM available for five time steps (1972/73, 1977, 1987, 1998, and 2009) enabled the monitoring of these land use changes initiated by the construction of the Talimardjan Water Reservoir in the early 1970s. Also a duplication of wheat acreage from 102,486 ha in 1987 to 201,822 ha in 1998 was recorded, which is a result of land use policy in Uzbekistan, where winter wheat was increased after independency in 1991. Furthermore, overlaying the classification results with historical soil maps showed the temporal sequence, in which different soils were utilized for irrigation, in a spatially explicit way. The findings illustrate the strategies used but also the magnitude of the degradation risks, which apparently had been accepted by the Soviet policy makers in the Kashkadarya region during the expansion period and can also be supportive for the implementation of measures of improvements, for instance the prioritization of canal rehabilitation plans.
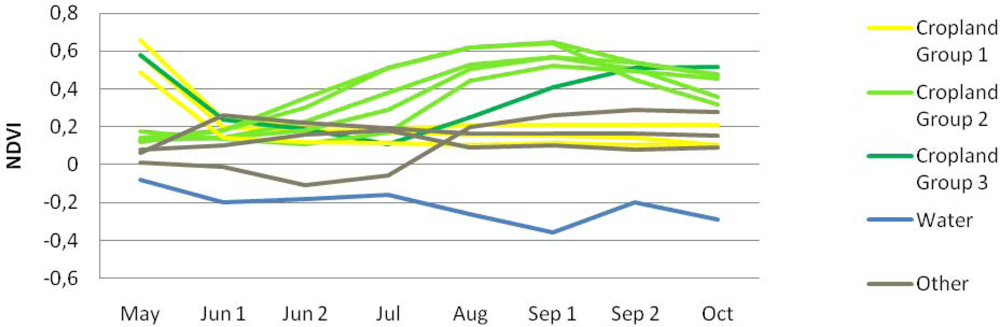
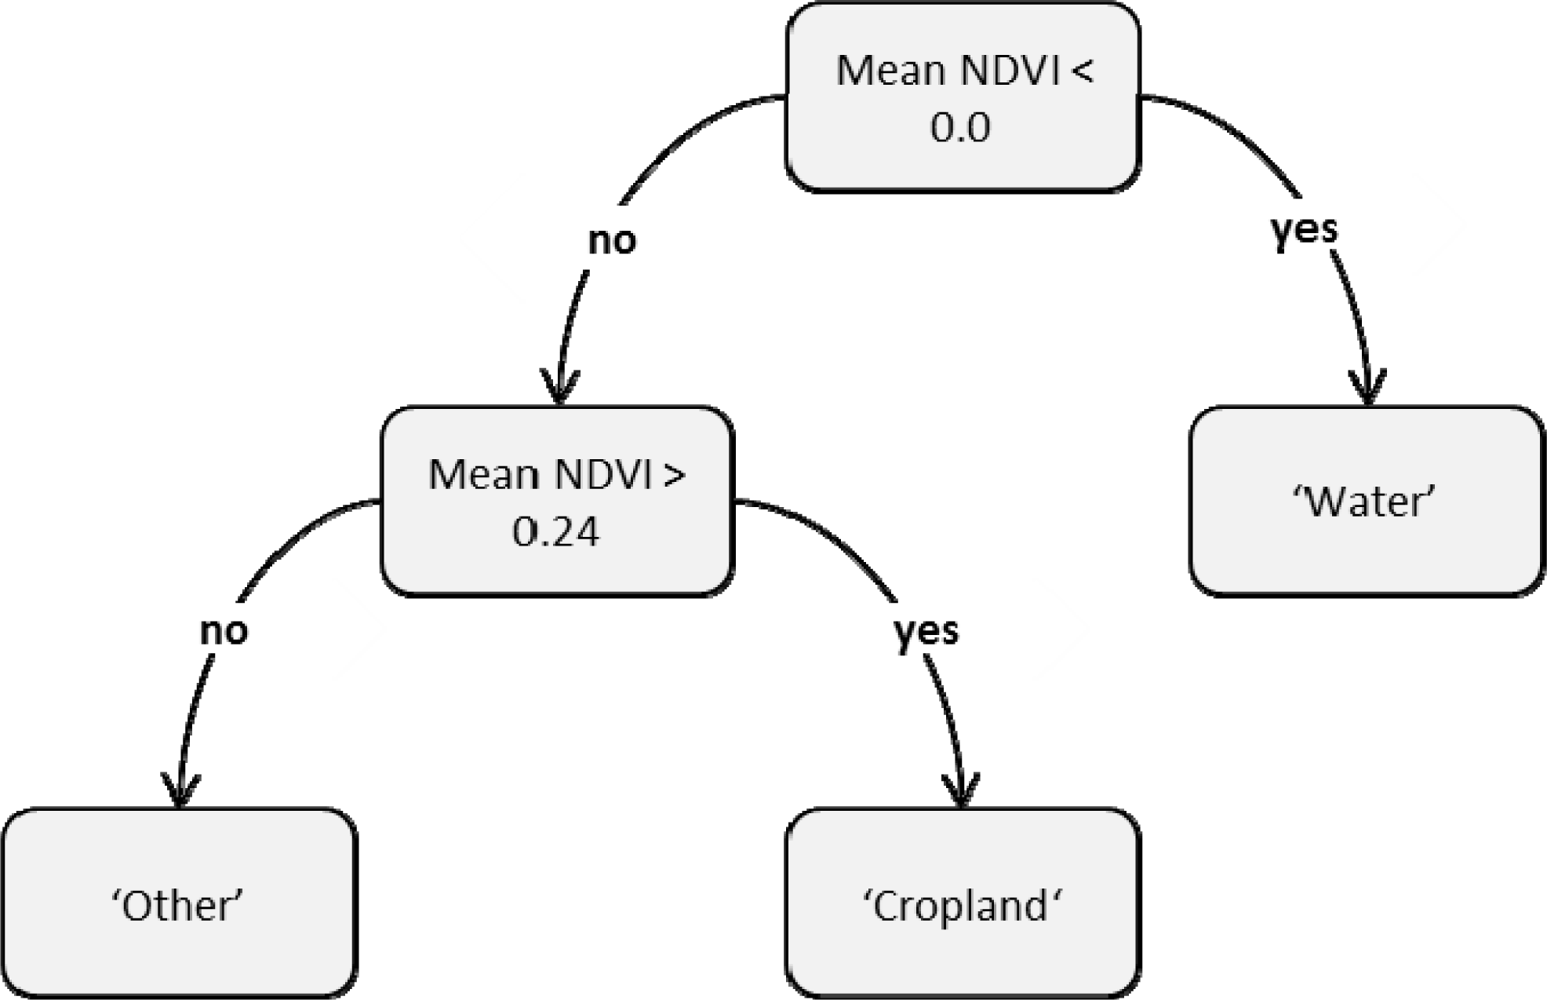
Knowledge-based decision trees based on Landsat scale proved to be suitable for mapping cropland of agricultural landscape within desert and steppe zones. However, even in less complex landscapes like the Karshi planning zone in the Kashkadarya system, the inclusion of ancillary information like high resolution data and a digital elevation model are required for increasing the accuracy of the results. An integration of modern field-based classification techniques can be also concluded beneficial for such long-term Landsat cropland monitoring approaches as presented.
The utilization of the Landsat Archives in the Kashkadarya Province of Uzbekistan is the first application of mapping cropland development in Central Asia over the past forty years in a spatially explicit way. It is very likely that the presented approach can be transferred to all 8 Mio ha of irrigated land in this region, because numerous Landsat MSS and TM data are available in the archives due to the extremely good atmospheric conditions in the lowlands of the Aral Sea Basin. In this potential way forward, the knowledge bases need to be adjusted to the cropping patterns of the other irrigation districts and the time steps for which data records are present within the cropping season. The method can be principally used for creating reliable and transparent databases and for further studies to design land and water management strategies in the Aral Sea Basin and similar problems in arid ecosystems worldwide.

Acknowledgments

The research was conducted in the context of the CAWa project, the initiative for “Water in Central Asia”, implemented by the German Federal Foreign Office. Maksud Bekchanov (Center for Development Research in Bonn, Germany) deserves our special appreciation for his untiring assistance in getting access to and understanding of the secondary data used in this study.

References

  1. Wehrheim, P.; Martius, C. Farmers, Cotton, Water and Models: Introduction and Overview. In Continuity and Change-Land and Water Use Reforms in Rural Uzbekistan. Socio Economic and Legal Analyses for the Region Khorezm; Wehrheim, P., Schoeller-Schletter, A., Martius, C., Eds.; Studies on the Agricultural and Food Sector in Central and Eastern Europe; Leibniz Institute of Agricultural Development in Central and Eastern Europe (IAMO): Leipzig, Germany, 2008; Volume 43, pp. 1–15. [Google Scholar]
  2. Roll, G.; Alexeeva, N.; Aladin, N.; Plotnikov, I.; Sokolov, V.; Sarsembekov, T.; Micklin, P. Aral Sea: Experience and Lessons Learned Brief; Report Lake Basin Management Initiative; International Lake Environment Committee: Shiga, Japan, 2005; pp. 1–14. [Google Scholar]
  3. Létolle, R. Aral; Springer: Paris, France, 1993; p. 517. [Google Scholar]
  4. Kooistra, K.; Termorshuizen, A. The Sustainability of Cotton: Consequences for Man and Environment; Science Shop Wageningen University & Research Centre: Wageningen, The Netherlands, 2006; Volume 223, pp. 1–59. [Google Scholar]
  5. World Bank. Uzbekistan-Karshi Pumping Cascade Rehabilitation Project. 2002. Available online: http://www-wds.WorldBank.org/external/default/main?pagePK=64193027&piPK=64187937&theSitePK=523679&menuPK=64187510&searchMenuPK=64187283&siteName=WDS&entityID=000094946_00010405304782 (accessed on 29 August 2012).
  6. Giese, E.; Bahro, G.; Betke, D. Umweltzerstörungen in Trockengebieten Zentralasiens (West- und Ost-Turkestan). Ursachen, Auswirkungen, Maßnahmen; Erdkundliches Wissen: Stuttgart, Germany, 1998. [Google Scholar]
  7. Micklin, P. The past, present, and future Aral Sea. Lakes Reservoirs Res. Manage 2010, 15, 193–213. [Google Scholar]
  8. Abdullaev, I.; de Fraiture, C.; Giordano, M.; Yakubov, M.; Rasulov, A. Agricultural water use and trade in Uzbekistan: Situation and potential of impacts of market liberalization. Water Resour. Dev 2009, 25, 47–63. [Google Scholar]
  9. Uzglavgidromet for UNEP. Natsional’naia Programma Deistvii po bor’be c Opustynivaniem v Respublike Uzbekistan; UNEP: Tashkent, Uzbekistan, 2000. [Google Scholar]
  10. Kamilov, B. The Use of Irrigation Systems for Sustainable Fish Production: Uzbekistan. FAO Fisheries Technical Paper 430, Fisheries in Irrigation Systems of Arid Asia; Petr, T., Ed.; FAO: Rome, Italy, 2003; pp. 115–116. Available online: http://www.fao.org/docrep/007/y5082e/y5082e00.htm (accessed on 31 August 2012).
  11. Droogers, P. Global Irrigated Area Mapping: Overview and Recommendations; Working Paper 36; International Water Management Institute: Colombo, Sri Lanka, 2002; p. 54. [Google Scholar]
  12. Thenkabail, P.S.; Biradar, C.M.; Noojipady, P.; Dheeravath, V.; Li, Y.; Velpuri, M.; Gumma, M.; Gangalakunta, O.R.P.; Turral, H.; Cai, X.; Vithanage, J.; Schull, M.A.; Dutta, R. Global irrigated area map (GIAM), derived from remote sensing, for the end of the last millennium. Int. J. Remote Sens 2009, 30, 3679–3733. [Google Scholar]
  13. Thenkabail, P.S.; Schull, M.; Turral, H. Ganges and Indus river basin land use/land cover (LULC) and irrigated area mapping using continuous streams of MODIS data. Remote Sens. Environ 2005, 95, 317–341. [Google Scholar]
  14. Gumma, M.; Thenkabail, P.S.; Muralikrishna, I.V.; Velpuri, N.M.; Gangadhararao, P.T.; Dheeravath, V.; Biradar, C.M.; Nalan, S.A.; Gaur, A. Changes in Agricultural Cropland Areas between a water surplus year and water-deficit year impacting food security determined using MODIS 250m time-series data and spectral matching techniques in the Krishna River Basin (India). Int. J. Remote Sens 2011, 32, 3495–3520. [Google Scholar]
  15. Ozdogan, M.; Gutman, G. A new methodology to map irrigated areas using multi-temporal MODIS and ancillary data: An application example in the continental US. Remote Sens. Environ 2008, 112, 3520–3537. [Google Scholar]
  16. Martinez-Casanovas, J.A.; Martin-Montero, A.; Casterad, M.A. Mapping multi-year cropping patterns in small irrigation districts from time-series analysis of Landsat TM images. Europ. J. Agronomy 2005, 23, 159–169. [Google Scholar]
  17. Maxwell, S.K.; Sylvester, K.M. Identification of “ever-cropped” land (1984–2010) using Landsat annual maximum NDVI image composites: Southwestern Kansas case study. Remote Sens. Environ 2012, 121, 186–195. [Google Scholar]
  18. Thenkabail, P.S.; Wu, Z. An Automated Cropland Classification Algorithm (ACCA) for Tajikistan by combining Landsat, MODIS, and secondary data. Remote Sens 2012, 4, 2890–2918. [Google Scholar]
  19. Birdlife International. Chimkurgan Reservoir. 2011. Available online: http://www.birdlife.org/datazone/sitefactsheet.php?id=22138 (accessed on 31 August 2012).
  20. WMO (World Meteorological Organization). World Weather Information Service Uzbekistan. 2011. Available online: http://worldweather.wmo.int/032/c00116.htm (accessed on 31 August 2012).
  21. World Bank. Karshi Pumping Cascade Rehabilitation Phase I Project. Environmental Assessment. Draft Final Report. 2001. Available online: http://www-wds.worldbank.org/external/default/WDSContentServer/WDSP/IB/2002/02/16/000094946_0202020416078/Rendered/INDEX/multi0page.txt (accessed on 1 May 2012).
  22. GoU (Government of Uzbekistan Ministry of Agriculture and Water Resources). Karshi Pumping Cascade Rehabilitation Phase-1 Project. Institutional Development Program. Project Implementation Planning, Report by the Project Implementation Unit; Government of Uzbekistan Ministry of Agriculture and Water Resources: Tashkent, Uzbekistan, November 2001; Unpublished.
  23. Food and Agriculture Organization. A Review of Drought Occurrence and Monitoring and Planning Activities in the Near East Region; FAO: Rome, Italy, 2008. Available online: http://www.fao.org/world/Regional/RNE/morelinks/climate/Drought%20Report%202008%20-%20FAO%20RNE.pdf (accessed on 30 August 2012).
  24. Bhat, M.M.; Malik, M.I.; Hassan, Z. Regional variations in agricultural productivity—A study of Uzbekistan. J. Phytol 2011, 3, 38–41. [Google Scholar]
  25. MAWR (Ministry of Agriculture and Water Ressources, Republic of Uzbekistan). Karshi Pumping Cascade Rehabilitation Project, Environmental Assessment; Final Report; Ministry of Agriculture and Water Ressources, Republic of Uzbekistan: Tashkent, Uzbekistan, 2002. [Google Scholar]
  26. Genusov, A.Z; Gorbunov, B.V.; Kimberg, N.V. Soil Map of Uzbekskoi (Uzbekistan), General Directorate of Surveying and Cartography of the Soviet Ministry, GUGK, SSSR 1,500,000, 1960. Available online: http://eusoils.jrc.ec.europa.eu/library/maps/country_maps/metadata.cfm?mycountry=UZ (accessed on 31 August 2012).
  27. Redo, D. Mapping land-use and land-cover change along Bolivia’s Corredor Bioceánico with CBERS and the Landsat series: 1975–2008. Int. J. Remote Sens 2012, 33, 1881–1904. [Google Scholar]
  28. Roy, D.P.; Ju, J.; Lewis, P.; Schaaf, C.; Gao, F.; Hansen, M.; Lindquist, E. Multi-temporal MODIS–Landsat data fusion for relative radiometric normalization, gap filling, and prediction of Landsat data. Remote Sens. Environ 2008, 112, 3112–3130. [Google Scholar]
  29. USGS (United States Geological Survey). Multispectral Scanner. 2011, pp. 125–150. Available online: http://eros.usgs.gov/#/Find_Data/Products_and_Data_Available/MSS (accessed on 31 August 2012).
  30. USGS (United States Geological Survey). Thematic Mapper. 2011. Available online: http://eros.usgs.gov/#/Find_Data/Products_and_Data_Available/TM (accessed on 31 August 2012).
  31. Council of Production Forces of the Republic. Irrigation of Uzbekistan; Tashkent: Uzbekistan, 1979; Volume 3. [Google Scholar]
  32. SIC-ICWC. WARMIS Database, Tashkent, zbekistan, 2000; Unpublished.
  33. CAWATERinfo. Regional Information System on Water and Land Resources in the Aral Sea Basin (CAREWIB). 2012. Available online: www.cawater-info.net/data_ca/ (accessed on 18 August 2012).
  34. UzStat (Uzbekistan Statistics) Agriculture of Uzbekistan. Tashkent, Uzbekistan, 2009.
  35. Jarvis, A.; Reuter, H.I.; Nelson, A.; Guevara, E. Hole-Filled Seamless SRTM Data V4; International Centre for Tropical Agriculture (CIAT), 2008. Available online: http://srtm.csi.cgiar.org (accessed on 15 January 2011).
  36. Tucker, C.J. Red and photographic infrared linear combinations for monitoring vegetation. Remote Sens. Environ 1979, 8, 127–150. [Google Scholar]
  37. Jensen, J.R. Introductory Digital Image Processing, a Remote Sensing Perspective, 3rd ed.; Prentice Hall Series; Pearson Education: London, UK, 2005. [Google Scholar]
  38. Conrad, C.; Dech, S.W.; Hafeez, M.; Lamers, J.; Martius, C.; Strunz, G. Mapping and assessing water use in a Central Asian irrigation system by utilizing MODIS remote sensing products. Irrig. Drain. Syst 2007, 21, 197–218. [Google Scholar]
  39. Conrad, C.; Colditz, R.; Dech, S.; Klein, D.; Vlek, P. Improved irrigated crop classification in Central Asia using temporal segmentation and MODIS time series. Int. J. Remote Sens 2011, 32, 8763–8778. [Google Scholar]
  40. Murakami, T.; Ogawa, S.; Ishitsuka, N.; Kumagai, K.; Saito, G. Crop discrimination with multitemporal SPOT/HRV data in the Saga Plains, Japan. Int. J. Remote Sens 2001, 22, 1335–1348. [Google Scholar]
  41. Congalton, R.G.; Green, K. Assessing the Accuracy of Remotely Sensed Data, Principles and Practices; Taylor & Francis Inc: Boca Raton, FL, USA, 2008. [Google Scholar]
  42. Lobo, A.; Chic, O.; Casterad, A. Classification of Mediterranean crops with multisensor data: Per-pixel versus per-object statistics and image segmentation. Int. J. Remote Sens 1996, 17, 2385–2400. [Google Scholar]
  43. Geneletti, D.; Gorte, B.G.H. A method for object-oriented land cover classification combining Landsat TM data and aerial photographs. Int. J. Remote Sens 2003, 24, 1273–1286. [Google Scholar]
  44. Conrad, C.; Fritsch, S.; Zeidler, J.; Rücker, G.; Dech, S. Per-field irrigated crop classification in Arid Central Asia using SPOT and ASTER data. Remote Sens 2010, 2, 1035–1056. [Google Scholar]
  45. De Wit, A.J.W.; Clevers, J. Efficiency and accuracy of per-field classification for operational crop mapping. Int. J. Remote Sens 2004, 25, 4091–4112. [Google Scholar]
  46. Gallego, J.; Craig, M.; Michaelsen, J.; Bossyns, B.; Fritz, S. Best Practices for Crop Area Estimation with Remote Sensing; GEOSS Community of Practice: Ispra, Italy, 2008. [Google Scholar]
  47. Minashina, N. G.; Rozanov, A.N.; Shchuvalov, S.A. Soils. In Environmental Conditions and Natural Resources of the USSR. Middle Asia (in Russian); Gerasimov, I.P., Ed.; Institute of Geography, Academy of Sciences of the USSR: Moscow, Russia, 1968. [Google Scholar]
  48. Scheffer, F.; Schachtschabel, P. Lehrbuch der Bodenkunde, 13th ed.; Enke: Stuttgart, Germany, 1992. [Google Scholar]
  49. Stahr, K.; Kandeler, E.; Herrmann, L.; Streck, T. Bodenkunde und Standortlehre; Ulmer Verlag: Stuttgart, Germany, 2008. [Google Scholar]
  50. Fiedler, H.J. Böden und Bodenfunktionen in Ökosystemen, Landschaften und Ballungsgebieten; Expert Verlag: Renningen, Germany, 2001. [Google Scholar]
  51. Van Assche, K.; Djanibekov, N. Spatial planning as policy integration: The need for an evolutionary perspective. Lessons from Uzbekistan. Land Use Policy 2012, 29, 179–186. [Google Scholar]
  52. Lüdeke, M.; Petschel-Held, G.; Schellnhuber, H. Syndromes of global change: The first panoramic view. GAIA 2004, 13, 42–49. [Google Scholar]
Figure 1. The Kashkadarya Province (indicated by red solid line) in the south of Uzbekistan. Upper right: Zoom to the Kashkadarya Province showing the irrigation extend 2009 and footprints of Landsat paths and rows used in this study.
Remotesensing 04 03972f1
Figure 2. Average annual Normalized Difference Vegetation Index (NDVI) curves of the three basic classes ‘cropland’, ‘water’ and ‘other’.
Remotesensing 04 03972f2
Figure 3. Exemplary hierarchical decision tree (Scene A, 1972/73, see also Table 2).
Remotesensing 04 03972f3
Figure 4. Visualization of the dynamics of the Karshi irrigation district from 1972/73 until 2009.
Remotesensing 04 03972f4aRemotesensing 04 03972f4b
Figure 5. Development of winter wheat cultivation areas within the irrigated land after independence in 1991.
Remotesensing 04 03972f5
Figure 6. Expansion of the Karshi irrigated cropland on different soil types over time.
Remotesensing 04 03972f6
Table 1. Landsat data used for the classifications.
Scene Path/RowMarMayJunJulAugSepOct
1972/73A2 × L1 MSSL1 MSS
168/3311.06.197314.09.1972
29.06.1973
BL1 MSSL1 MSS
167/3328.06.197201.10.1973

1977AL2 MSSL2 MSSL2 MSS
168/3319.03.197705.07.197703.10.1977
BL2 MSSL2 MSS
167/3318.03.197704.07.1977

1987AL5 TM2 × L5 TML5 TML5 TML5 TML5 TM
156/3312.05.198713.06.198731.07.198716.08.198701.09.198703.10.1987
29.06.1987
B2 × L5 TML5 TML5 TM2 × L5 TM
155/3305.05.198724.07.198725.08.198710.09.1987
21.05.198726.09.1987

1998AL5 TML5 TML5 TML5 TML5 TM
156/3326.05.199827.06.19981998-98-1415.09.199801.10.1998
BL5 TML5 TML5 TML5 TM2 × L5 TML5 TM
167/3319.05.199804.06.199806.07.199807.08.199808.09.199810.10.1998
24.09.1998

2009AL5 TML5 TML5 TML5 TML5 TML5 TM
156/3324.05.200925.06.200927.07.200912.08.200929.09.200915.10.2009
L5 TML5 TM2 × L5 TML5 TM2 × L5 TML5 TM
Scene B17.05.200918.06.200904.07.200921.08.200906.09.200908.10.2009
Table 2. Schematic representation of the rule sets for the hierarchical decision trees.
Time StepHypothesisConditions Scene AConditions Scene B
1972/73Cropmean NDVI > 0.24mean NDVI > 0.27
Watermean NDVI < 0.0Jun NDVI < −0.05 or Oct NDVI < −0.05

1977Cropmean NDVI > 0.14mean NDVI > 0.3 or Jul NDVI > 0.2
Watermean NDVI < 0.1mean NDVI < 0.0

1987Cropmean NDVI > 0.28 or May NDVI > 0.6mean NDVI > 0.28 or May NDVI > 0.6
Watermean NDVI < −0.1mean NDVI < 0.0

1998Cropmean NDVI > 0.35 or May NDVI > 0.4mean NDVI > 0.32 or May NDVI > 0.5
Watermean NDVI < 0.0mean NDVI < 0.0

2009Cropmean NDVI > 0.28 or May NDVI > 0.34mean NDVI > 0.35 or May NDVI > 0.56
Watermean NDVI < 0.0mean NDVI < 0.0
Table 3. Rule sets for classifying winter wheat.
Time StepHypothesisConditions Scene AConditions Scene B
1987Winter WheatNDVI May > 0.5 and NDVI Mean > 0.5NDVI May > 0.6 and NDVI June < 0.5
1998Winter WheatNDVI May > 0.4 and NDVI Mean < 0.4NDVI May > 0.5 and NDVI Mean < 0.4
Table 4. Accuracy assessment of the decision trees (in percent).
Scene AScene BOverall Accuracy
Time StepClassProd. Acc. (%)User Acc. (%)Prod. Acc. (%)User Acc. (%)Both Scenes (%)
1972/73Cropland74.19100.0076.00100.00
Other100.0071.23100.0081.11
Water65.38100.0099.59100.0087.00

1977Cropland83.1399.86100.00100.00
Other99.9289.82100.00100.00
Water100.00100.00100.00100.0098.00

1987Cropland83.1399.8683.9493.17
Other99.9289.8292.1981.90
Water100.00100.00100.00100.0094.00

1998Cropland93.93100.0096.1576.89
Other100.0081.0575.1095.77
Water100.00100.00100.00100.0094.00

2009Cropland88.6887.7591.18100.00
Other82.3683.62100.00100.00
Water100.00100.00100.0085.7589.00
Table 5. Comparison of the size of the agriculturally used area in the Kashkadarya Province including the Kashkadarya PZ ( Kashkadary River Basin) and the Karshi PZ (Karshi Steppe) with official data.
Classification Results
Official Data
YearIrrigated Area (ha)Irrigated Area (ha)Reference YearSource
1972/73134,775179,5001972[31]
187,1001973[31]
1977225,540256,0001977[32]
1987404,435477,7001987[33]
1998349,525498,3001998[33]
2009469,685481,3002008[34]
Table 6. Cultivated land on different soiltypes for each timestep. Sierozems (originally preferred soils) are highlighted in italic letters.
Soil TypeArea [ha] of Cultivated Land
No.1972/731977198919982009
Alkine Land on Alluvial, rareley Prolluvial Deposition1102001,337
Brown Soil2161223236228241
Dark Sierozem32,3823,6875,0795,2035,681
Light Brown Meadow-Steppe Soil44791,6684,2642,4893,931
Light Sierozem565,992101,069184,826163,583228,117
Meadow Saz Soil of Sierozem zone611,79314,41017,61015,01215,079
Sandy Cambic Solonchak710314208803
Solonchak on Aeolian Deposition81,8704,15610,2299,78715,395
Solonchak on Sandy Deposition91488306,8097,25211,024
Takyric Salic Solonetz101753,06612,96112,22920,451
Takyric Solonchak113,76519,84937,58837,63652,124
Typical Sierozem1248,01076,572124,51995,898116,839

