Evolution of Coral Rubble Deposits on a Reef Platform as Detected by Remote Sensing

Abstract
:1. Introduction
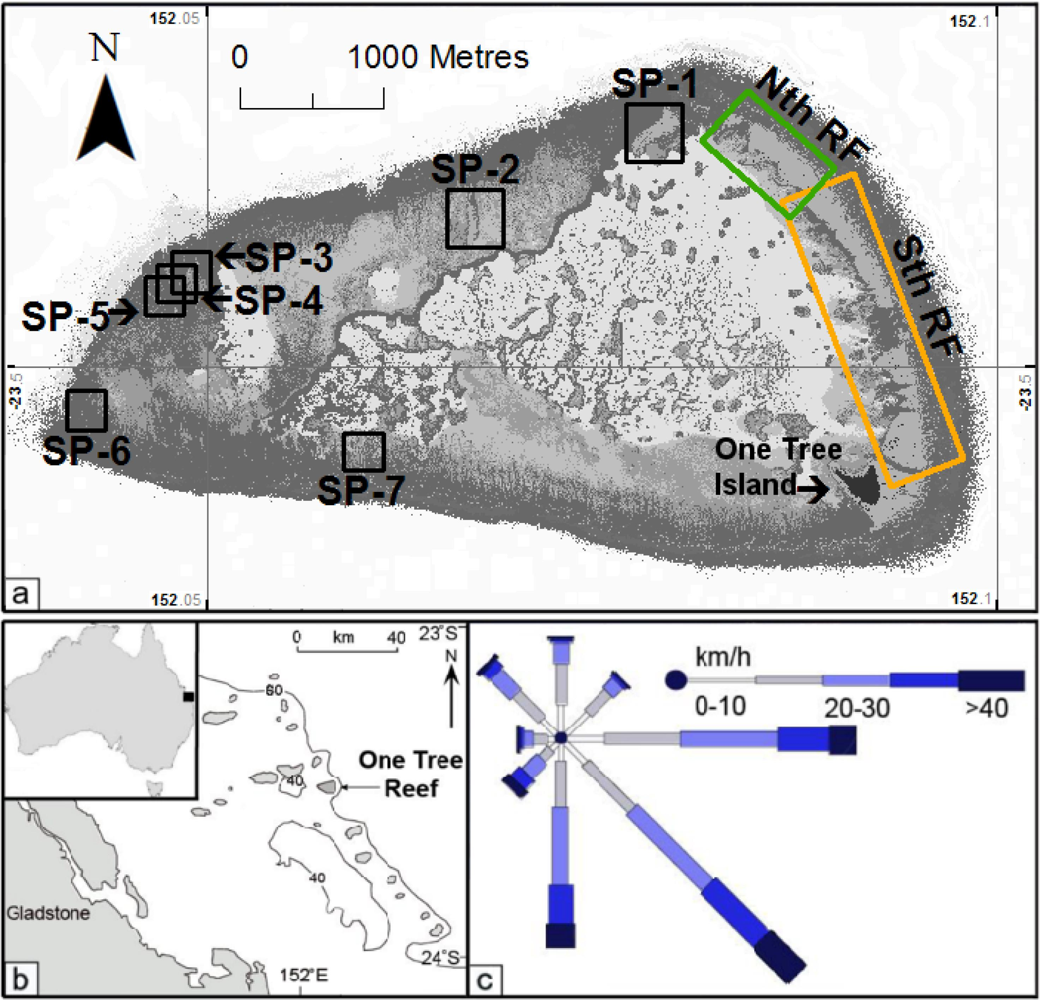
2. Study Area
3. Methods
4. Evolution of Rubble Features
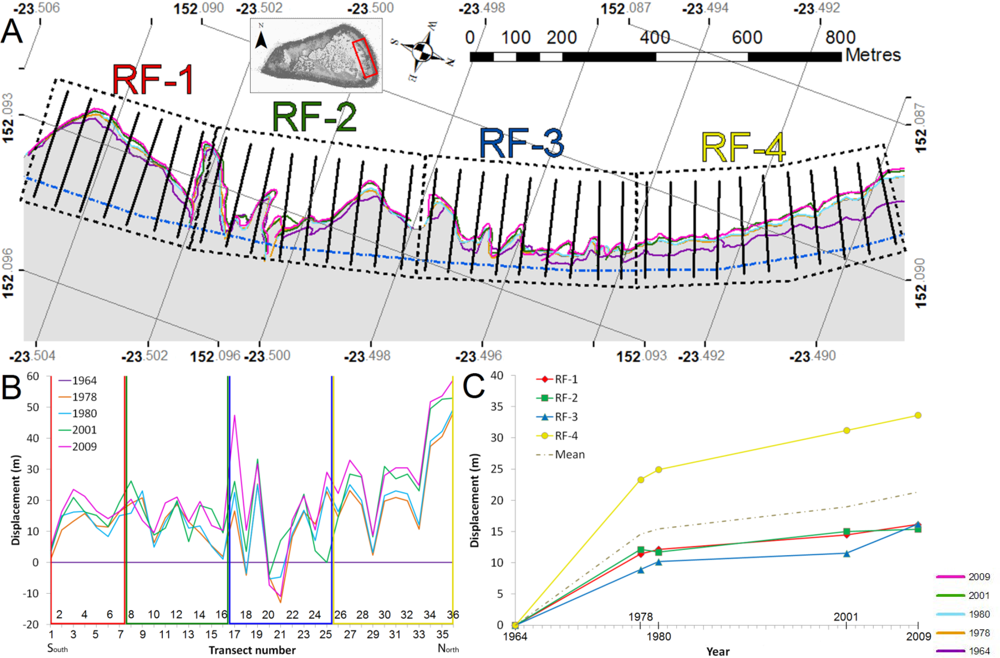
4.1. High-Energy Rubble Flat Evolution
4.1.1. Evolution of the Southern Section of the Eastern Rubble Flat
4.1.2. Northern Section of the Eastern Rubble Flat
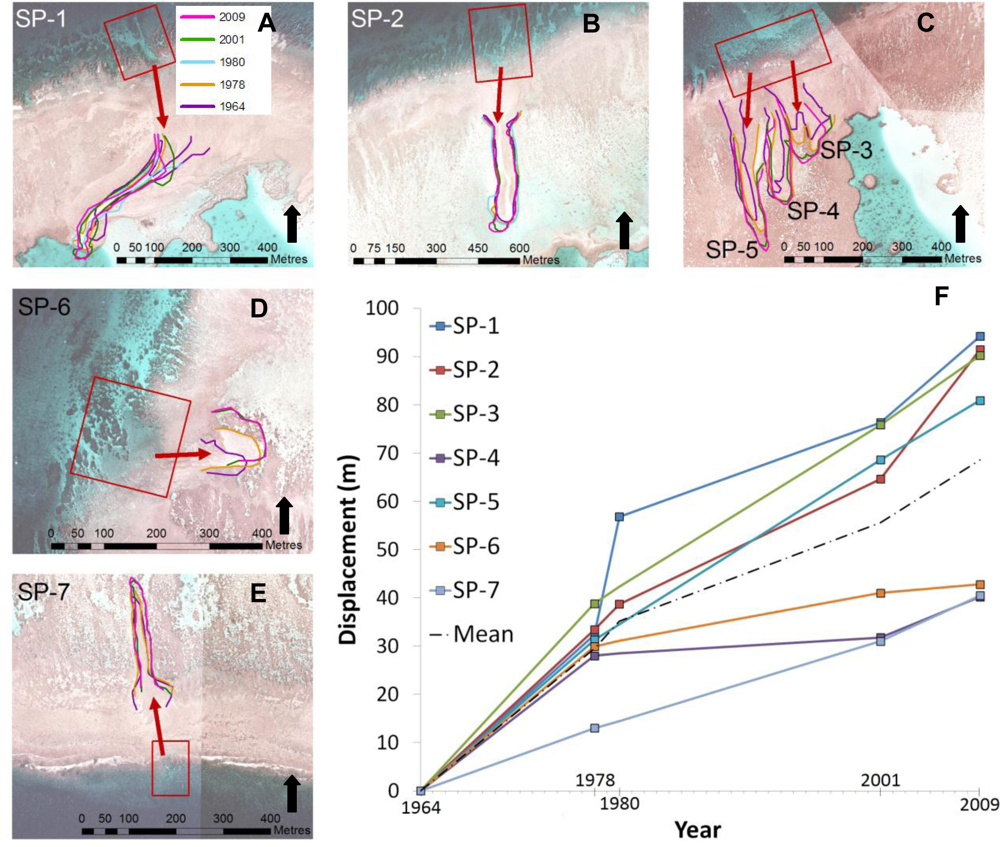
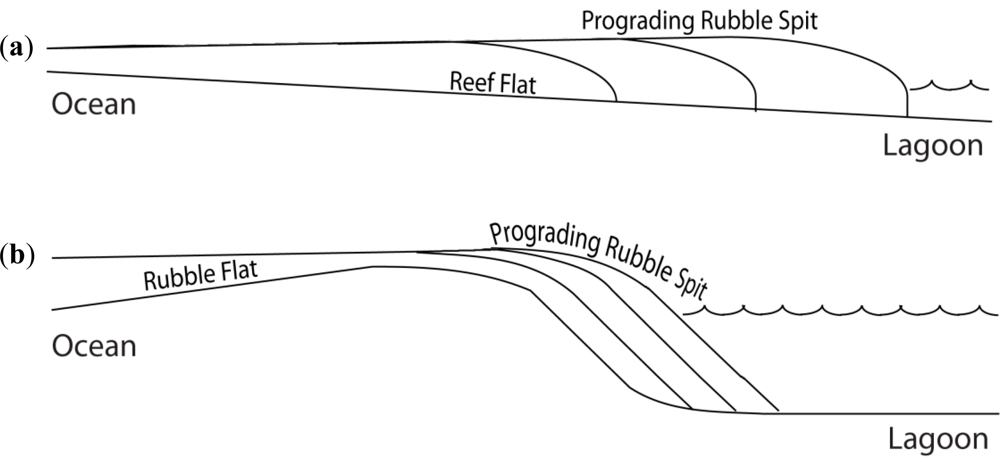
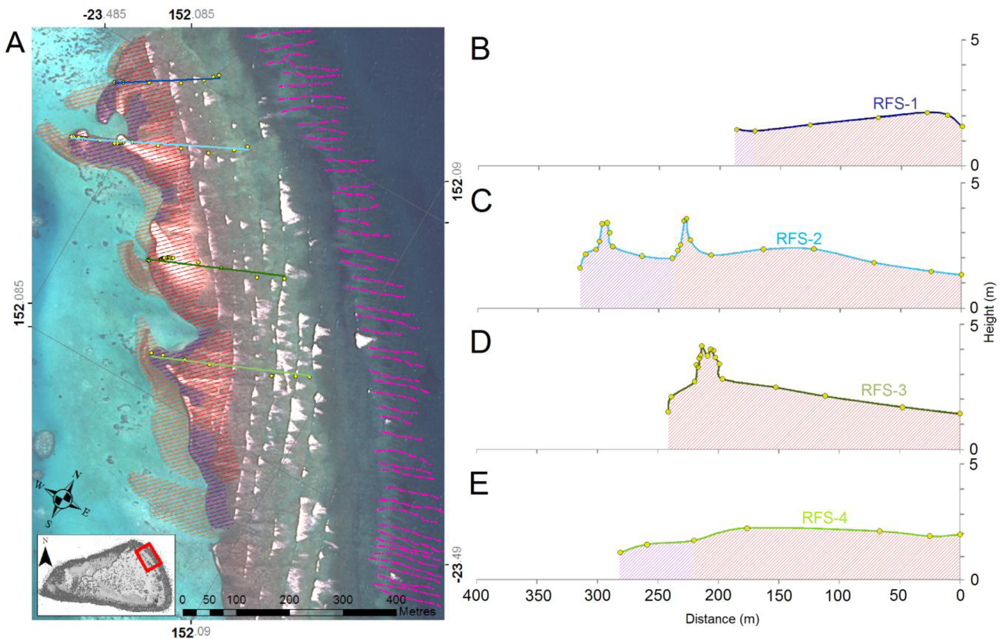
4.2. Evolution of Rubble Spits Located in Lower Energy Settings
5. Discussion
5.1. Location of Rubble Spits
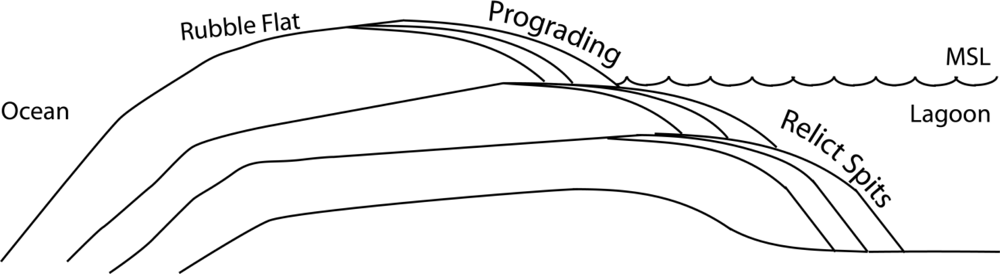
5.2. Evolution of Rubble Spits
6. Conclusions
- Rubble flats are active features that prograde uniformly (at an average of 0.36 m/yr) in the areas of highest energy. The rubble supply (i.e., how much rubble is available), the underlying substrate (i.e., how much accommodation space needs to be infilled for progradation to occur), and the energy regime (i.e., how much energy is available to transport the rubble) were found to be primary controls on the rate of progradation. Rubble flat growth in the northern region of the eastern rubble flat occurs in stages of spit growth, where modern spits overlie relict spits. These are thought to be associated with high energy storm events. Rubble spit growth on the lower energy margins of the reef (protected from modal wave incidence) has also been shown to occur lagoon-ward at rapid rates (with an average rate of 2 m/yr). These rubble spits appear to be controlled by the episodic energy of cyclonic events.
- Large rubble spit accumulations are concentrated in specific locations adjacent to large gaps in the spur and groove morphology of the forereef. These occur on both the high energy and low energy margins of the reef. We argue that these gaps act to focus the wave energy leading to the deposition of rubble in these preferential zones.
- As the rubble spits build upon each other, aggradation occurs, thereby reducing inundation heights and the distance from the reef crest to which waves can transport rubble. As a result, ocean-ward extension of the rubble flat occurs. It is inferred that this process might also be responsible for the development of shingle cays (rubble islands).
- Rubble spit progradation rates vary with the water depth into which the spit is prograding. Deeper depths require a greater volume of sediment in order for the sedimentary body to prograde a given distance than those sedimentary forms that occur in shallower regions.
Acknowledgments
References
- Hatcher, B.G. Coral reef primary productivity. A hierarchy of pattern and process. Trends Ecol. Evol 1990, 5, 149–155. [Google Scholar]
- Veron, J.E.N. A Reef in Time: The Great Barrier Reef from Beginning to End; Belknap Press of Harvard University Press: Cambridge, MA, USA, 2008; p. 289. [Google Scholar]
- Done, T.J. Effects of tropical cyclone waves on ecological and geomorphological structures on the Great Barrier Reef. Cont. Shelf Res 1992, 12, 859–872. [Google Scholar]
- Perry, C.T.; Kench, P.S.; Smithers, S.G.; Riegl, B.; Yamano, H.; O’Leary, M.J. Implications of reef ecosystem change for the stability and maintenance of coral reef islands. Glob. Change Biol 2011, 17, 3679–3696. [Google Scholar]
- Perry, C.T.; Smithers, S.G.; Roche, R.C.; Wassenburg, J. Recurrent patterns of coral community and sediment facies development through successive phases of Holocene inner-shelf reef growth and decline. Mar. Geol 2011, 289, 60–71. [Google Scholar]
- Leon, J.; Woodroffe, C.D. Improving the synoptic mapping of coral reef geomorphology using object-based image analysis. Int. J. Geogr. Inf. Sci 2011, 25, 949–969. [Google Scholar]
- Buddemeier, R.W.; Smith, S.V. Coral reef growth in an era of rapidly rising sea level: predictions and suggestions for long-term research. Coral Reefs 1988, 7, 51–56. [Google Scholar]
- Cowell, P.J.; Thom, B.G. Morphodynamics of Coastal Evolution. In Coastal Evolution: Late Quaternary Shoreline Morphodynamics; Carter, R.W.G., Woodroffe, C.D., Eds.; , Eds.; Cambridge University Press: Cambridge, UK/New York, NY, USA; , 1994; pp. 33–86. [Google Scholar]
- Hamylton, S.; East, H. A geospatial appraisal of ecological and geomorphic change on Diego Garcia Atoll, Chagos Islands (British Indian Ocean Territory). Remote Sens 2012, 4, 3444–3461. [Google Scholar]
- Hamylton, S.; Spencer, T. Geomorphological modelling of tropical marine landscapes: Optical remote sensing, patches and spatial statistics. Cont. Shelf Res 2011, 31, S151–S161. [Google Scholar]
- Joyce, K.E.; Phinn, S.R.; Roelfsema, C.M.; Neil, D.T.; Dennison, W.C. Combining Landsat ETM+ and Reef Check classifications for mapping coral reefs: A critical assessment from the southern Great Barrier Reef, Australia. Coral Reefs 2004, 23, 21–25. [Google Scholar]
- Hopley, D.; Smithers, S.G.; Parnell, K.E. The Geomorphology of the Great Barrier Reef, 1st ed.; Cambridge University Press: Cambridge, UK/New York, NY, USA, 2007; p. 532. [Google Scholar]
- Thornborough, K.J. Reef Flats. In Encyclopedia of Modern Coral Reefs; Hopley, D., Ed.; Springer: Dordrecht, The Netherlands, 2011; pp. 869–876. [Google Scholar]
- Thornborough, K.J. Rubble-Dominated Reef Flat Processes and Development: Evidence from One Tree Reef, Southern Great Barrier Reef. The University of Sydney, Sydney, NSW, Australia, 2012; p. 142. [Google Scholar]
- Walker, B.K.; Riegl, B.; Dodge, R.E. Mapping coral reef habitats in southeast Florida using a combined technique approach. J. Coast. Res 2008, 24, 1138–1150. [Google Scholar]
- Hopley, D. The Geomorphology of the Great Barrier Reef: Quaternary Development of Coral Reefs; Wiley-Interscience: New York, NY, USA, 1982; p. 320. [Google Scholar]
- Hughes, T.P. Off-reef transport of coral fragments at Lizard Island, Australia. Mar. Geol 1999, 157, 1–6. [Google Scholar]
- Harmelin-Vivien, M.L.; Laboute, P. Catastrophic impact of hurricanes on atoll outer reef slopes in the Tuamotu (French Polynesia). Coral Reefs 1986, 5, 55–62. [Google Scholar]
- Rasser, M.W.; Riegl, B. Holocene coral reef rubble and its binding agents. Coral Reefs 2002, 21, 57–72. [Google Scholar]
- Maragos, J.E.; Baines, G.B.; Beveridge, P.J. Tropical cyclone bebe creates a new land formation on funafuti atoll. Science 1973, 181, 1161–1164. [Google Scholar]
- Davies, P.J.; Radke, B.M.; Robison, C.R. The evolution of One Tree Reef, Southern Great Barrier Reef, Queensland. BMR J. Aust. Geol. Geophys 1976, 1, 231–240. [Google Scholar]
- Barrett, S.J.; Webster, J.M. Holocene evolution of the Great Barrier Reef: Insights from 3D numerical modelling. Sediment. Geol. 2012, 265–266, 56–71. [Google Scholar]
- Marshall, J.; Davies, P.J. Internal structure and Holocene evolution of One Tree Reef, Southern Great Barrier Reef. Coral Reefs 1982, 1, 21–28. [Google Scholar]
- Davies, P.J.; Kinesy, D.W. Holocene reef growth—One Tree, Great Barrier. Mar. Geol 1977, 24, M1–M11. [Google Scholar]
- Davies, P.J.; Marshal, J.F. A model of epicontinental reef growth. Nature 1980, 287, 37–38. [Google Scholar]
- Frith, C. Some aspects of lagoon sedimentation and circulation at One Tree Reef, southern Great Barrier Reef. BMR J Aust. Geol. Geophys 1983, 8, 211–221. [Google Scholar]
- Bureau of Meteorology. Database of Past Tropical Cyclone Tracts. 2012. Available online: http://www.bom.gov.au/cyclone/history/index.shtml (accessed on 30 August 2012).
- Nandasena, N.A.K.; Paris, R.; Tanaka, N. Reassessment of hydrodynamic equations: Minimum flow velocity to initiate boulder transport by high energy events (storms, tsunamis). Mar. Geol 2011, 281, 70–84. [Google Scholar]
- Shannon, A.M. Application of Remote Sensing to Establish the Geomorphic Evolution of a Coral Reef Platform on a Decadal Scale: One Tree Reef. University of Sydney, Sydney, NSW, Australia, 2012; p. 116. [Google Scholar]
- Woolsey, E.; Bainbridge, S.; Kingsford, M.; Byrne, M. Impacts of cyclone Hamish at One Tree Reef: integrating environmental and benthic habitat data. Mar. Biol 2012, 159, 793–803. [Google Scholar]
- Vila-Concejo, A.; Short, A.D.; Hughes, M.G.; Ranasinghe, R. Flood-tide delta morphodynamics and management implications, Port Stephens, Australia. J. Coast. Res. 2007, SI 50, 705–709. [Google Scholar]
- Thieler, E.R.; Himmelstoss, E.A.; Zichichi, J.L.; Ergul, A. The Digital Shoreline Analysis System (DSAS) Version 4.0: An ArcGIS Extension for Calculating Shoreline Change. In US Geological Survey Open-File Report 2008-1278; 2009. Available online: http://pubs.usgs.gov/of/2008/1278/ (accessed on 30 August 2012).
- Thomson, J.; Elgar, S.; Herbers, T. Reflection and tunneling of ocean waves observed at a submarine canyon. Geophys. Res. Lett 2005, 32, L24303. [Google Scholar]
- Woolsey, E. Self-Fertilization Suppresses Thermal Tolerance in Embryos of Reef-Building Coral. Proceedings of 12th International Coral Reef Symposium, Cairns, QLD, Australia, 3–13 July 2012.
- Blumenstock, D.I. Typhoon effects at Jaluit Atoll in the Marshall Islands. Nature 1958, 182, 1267–1269. [Google Scholar]
- Blumenstock, D.I.; Fosberg, F.R.; Johnson, C.G. The re-survey of tyhpoon effects on Jaluit Atoll in the Marshall Islands. Nature 1961, 189, 618–620. [Google Scholar]
- Woodroffe, C.D.; McLean, R.F.; Smithers, S.G.; Lawson, E.M. Atoll reef-island formation and response to sea-level change: West Island, Cocos (Keeling) Islands. Mar. Geol 1999, 160, 85–104. [Google Scholar]
- Gourlay, M. Wave Shoaling and Refreaction. In Encyclopedia of Modern Coral Reefs: Structure, Form and Process; Hopley, D., Ed.; Earth Science Series; Springer-Verlag: Townsville, QLD, Australia, 2011. [Google Scholar]
- Harris, D.; Webster, J.; De Carli, E.; Vila-Concejo, A. Geomorphology and morphodynamics of a sand apron, One Tree Reef, Southern Great Barrier Reef. J. Coast. Res. 2011, SI 64, 190–194. [Google Scholar]


| Year | Date | Image/Sensor | Resolution |
|---|---|---|---|
| 1964 | 21-Jun | Panchromatic Aerial Photograph | 1 m |
| 1978 | 3-Jun | Aerial Photograph | 0.15 m |
| 1980 | 6-Sep | Aerial Photograph | 0.35 m |
| 2001 | 26-Apr | Satellite Image/IKONOS 2 | 4 m |
| 2009 | 5-Dec | Satellite Image/WorldView 2 | 0.5 m |
Share and Cite
Shannon, A.M.; Power, H.E.; Webster, J.M.; Vila-Concejo, A. Evolution of Coral Rubble Deposits on a Reef Platform as Detected by Remote Sensing. Remote Sens. 2013, 5, 1-18. https://doi.org/10.3390/rs5010001
Shannon AM, Power HE, Webster JM, Vila-Concejo A. Evolution of Coral Rubble Deposits on a Reef Platform as Detected by Remote Sensing. Remote Sensing. 2013; 5(1):1-18. https://doi.org/10.3390/rs5010001
Chicago/Turabian StyleShannon, Amelia M., Hannah E. Power, Jody M. Webster, and Ana Vila-Concejo. 2013. "Evolution of Coral Rubble Deposits on a Reef Platform as Detected by Remote Sensing" Remote Sensing 5, no. 1: 1-18. https://doi.org/10.3390/rs5010001
APA StyleShannon, A. M., Power, H. E., Webster, J. M., & Vila-Concejo, A. (2013). Evolution of Coral Rubble Deposits on a Reef Platform as Detected by Remote Sensing. Remote Sensing, 5(1), 1-18. https://doi.org/10.3390/rs5010001